Automatic Identification of Auroral Substorms Based on Ultraviolet Spectrographic Imager Aboard Defense Meteorological Satellite Program (DMSP) Satellite
Abstract
:1. Introduction
2. Data and Approaches
2.1. Brief Description of a Substorm
2.2. Datasets
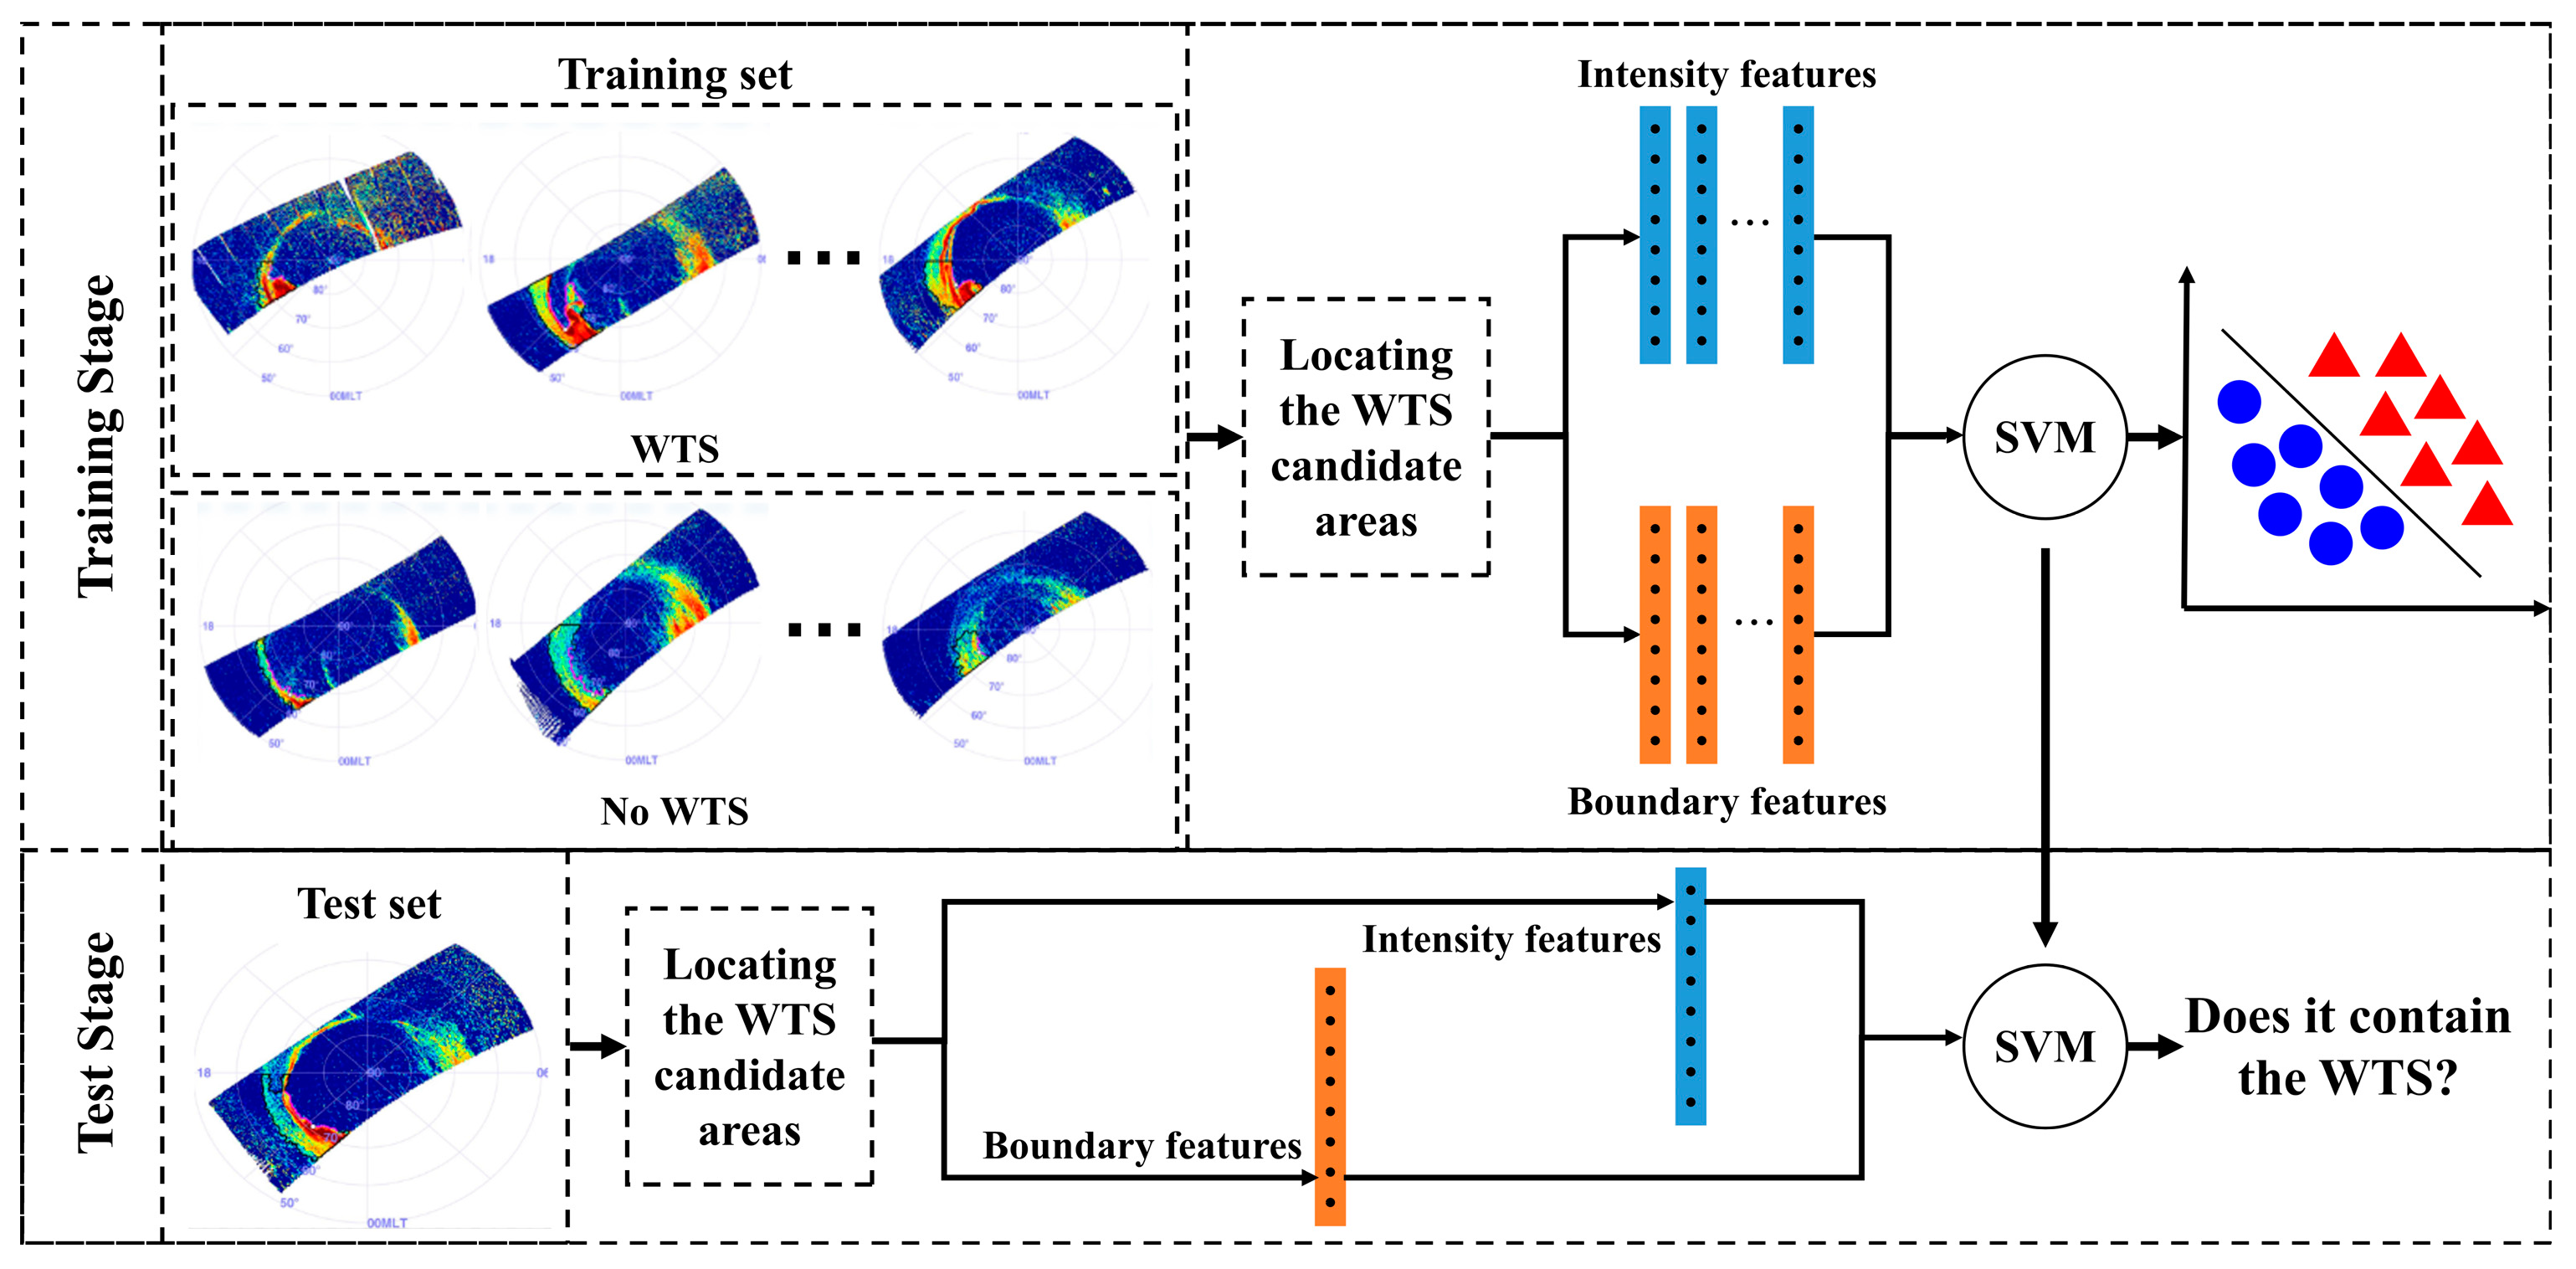
2.3. Automatic Identification of an Auroral Substorm
2.3.1. Locating the Candidate Region of a WTS
- (1)
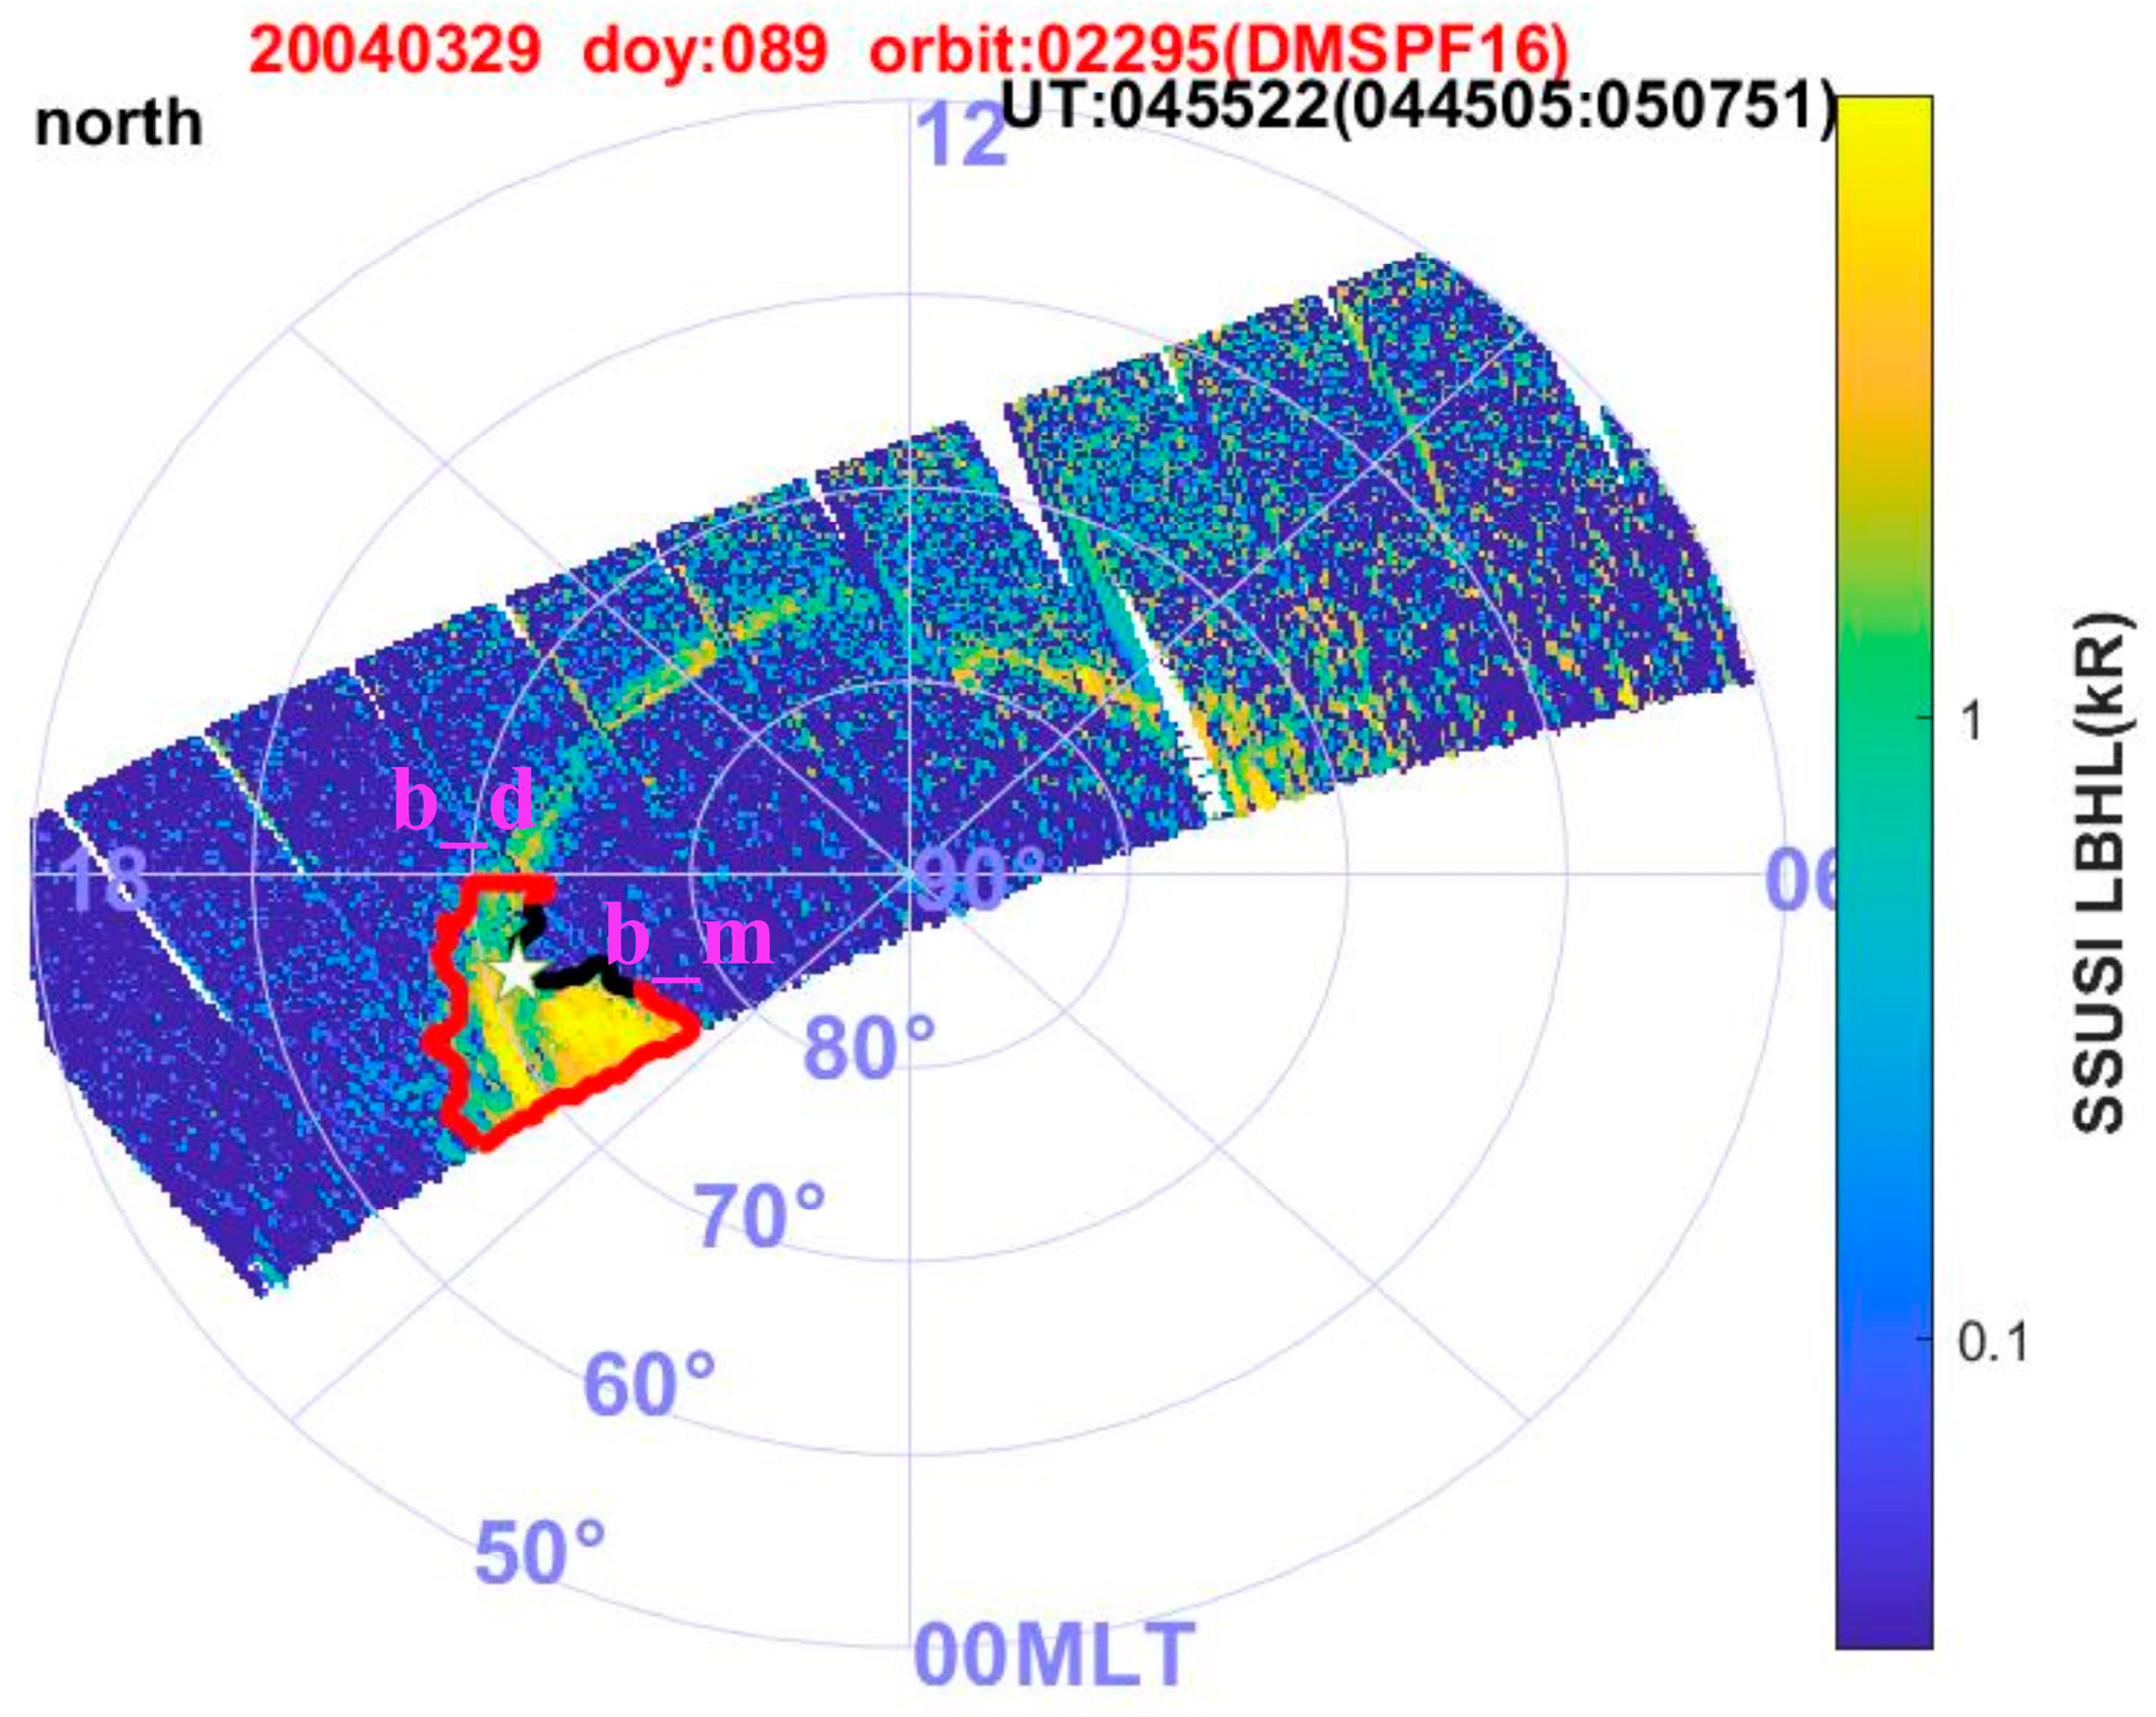
- Determine the polar boundary (PB) of the auroral oval fragment (yellow area to the right of Figure 1);
- (2)
- Locate the position of the PB with the largest value difference between MLT and MLAT, which is named as the extreme value point in this paper. Its vicinity is the candidate region for the WTS. The location of the extreme value point is shown in Equation (1).
2.3.2. Extracting the Features of a WTS
- (1)
- The MLT mean difference (diff_MLT_md) and MLAT mean difference (diff_MLAT_md) between the midnight side and the duskside boundaries are calculated.
- (2)
- The first derivative mean of MLAT to MLT at the midnight side boundary (mean_d1_d), the first derivative mean of MLAT to MLT at the duskside boundary (mean_d1_m), and the difference between them (diff_d1_md) are calculated.
- (3)
- The mean of the absolute value of the first derivative of MLAT to MLT for the midnight boundary (mean_absd1_d), the mean of the absolute value of the first derivative of MLAT to MLT for the duskside boundary (mean_absd1_m), and the difference between them (diff_absd1_md) are calculated.
- (4)
- The second derivative mean of MLAT to MLT for the midnight boundary (mean_d2_d), the second derivative mean of MLAT to MLT for the duskside boundary (mean_d2_m), and the difference between them (diff_d2_md) are calculated.
- (5)
- The mean of the absolute value of the second derivative of MLAT to MLT for the midnight boundary (mean_absd2_d), the mean of the absolute value of the second derivative of MLAT to MLT for the duskside boundary (mean_absd2_m), and the difference between them (diff_absd2_md) are calculated.
- (6)
- The histogram distributions of the duskside boundary with ten equal parts are calculated, along with the MLT distribution features (counts_MLT_d), the MLAT distribution features (counts_MLAT_d), the MLAT to MLT first derivative distribution features (counts_d1_d), and the MLAT to MLT second derivative distribution features (counts_d2_d).
- (7)
- The histogram distributions of midnight side boundary with ten equal parts are calculated, along with the MLT distribution features (counts_MLT_m), the MLAT distribution features (counts_MLAT_m), the MLAT to MLT first derivative distribution features (counts_d1_m), and the MLAT to MLT second derivative distribution features (counts_d2_m).
2.3.3. Determining the Structures of a WTS
3. Experimental Results and Analysis
3.1. Objective Evaluation
- a.
- The actual positive samples were predicted to be positive samples by the classifier; i.e., the aurora image actually contained a WTS and the SVM classifier recognized it as containing a WTS.
- b.
- The actual positive samples were predicted to be negative samples by the classifier; i.e., the aurora image actually contained a WTS and the SVM classifier recognized that it did not contain a WTS.
- c.
- The actual negative samples were predicted to be positive samples by the classifier; i.e., the aurora image did not contain a WTS and the SVM classifier recognized it as containing a WTS.
- d.
- The actual negative samples were predicted to be negative samples by the classifier; i.e., the aurora image did not contain a WTS and the SVM classifier recognized that it did not contain a WTS.
3.2. Analysis of Results
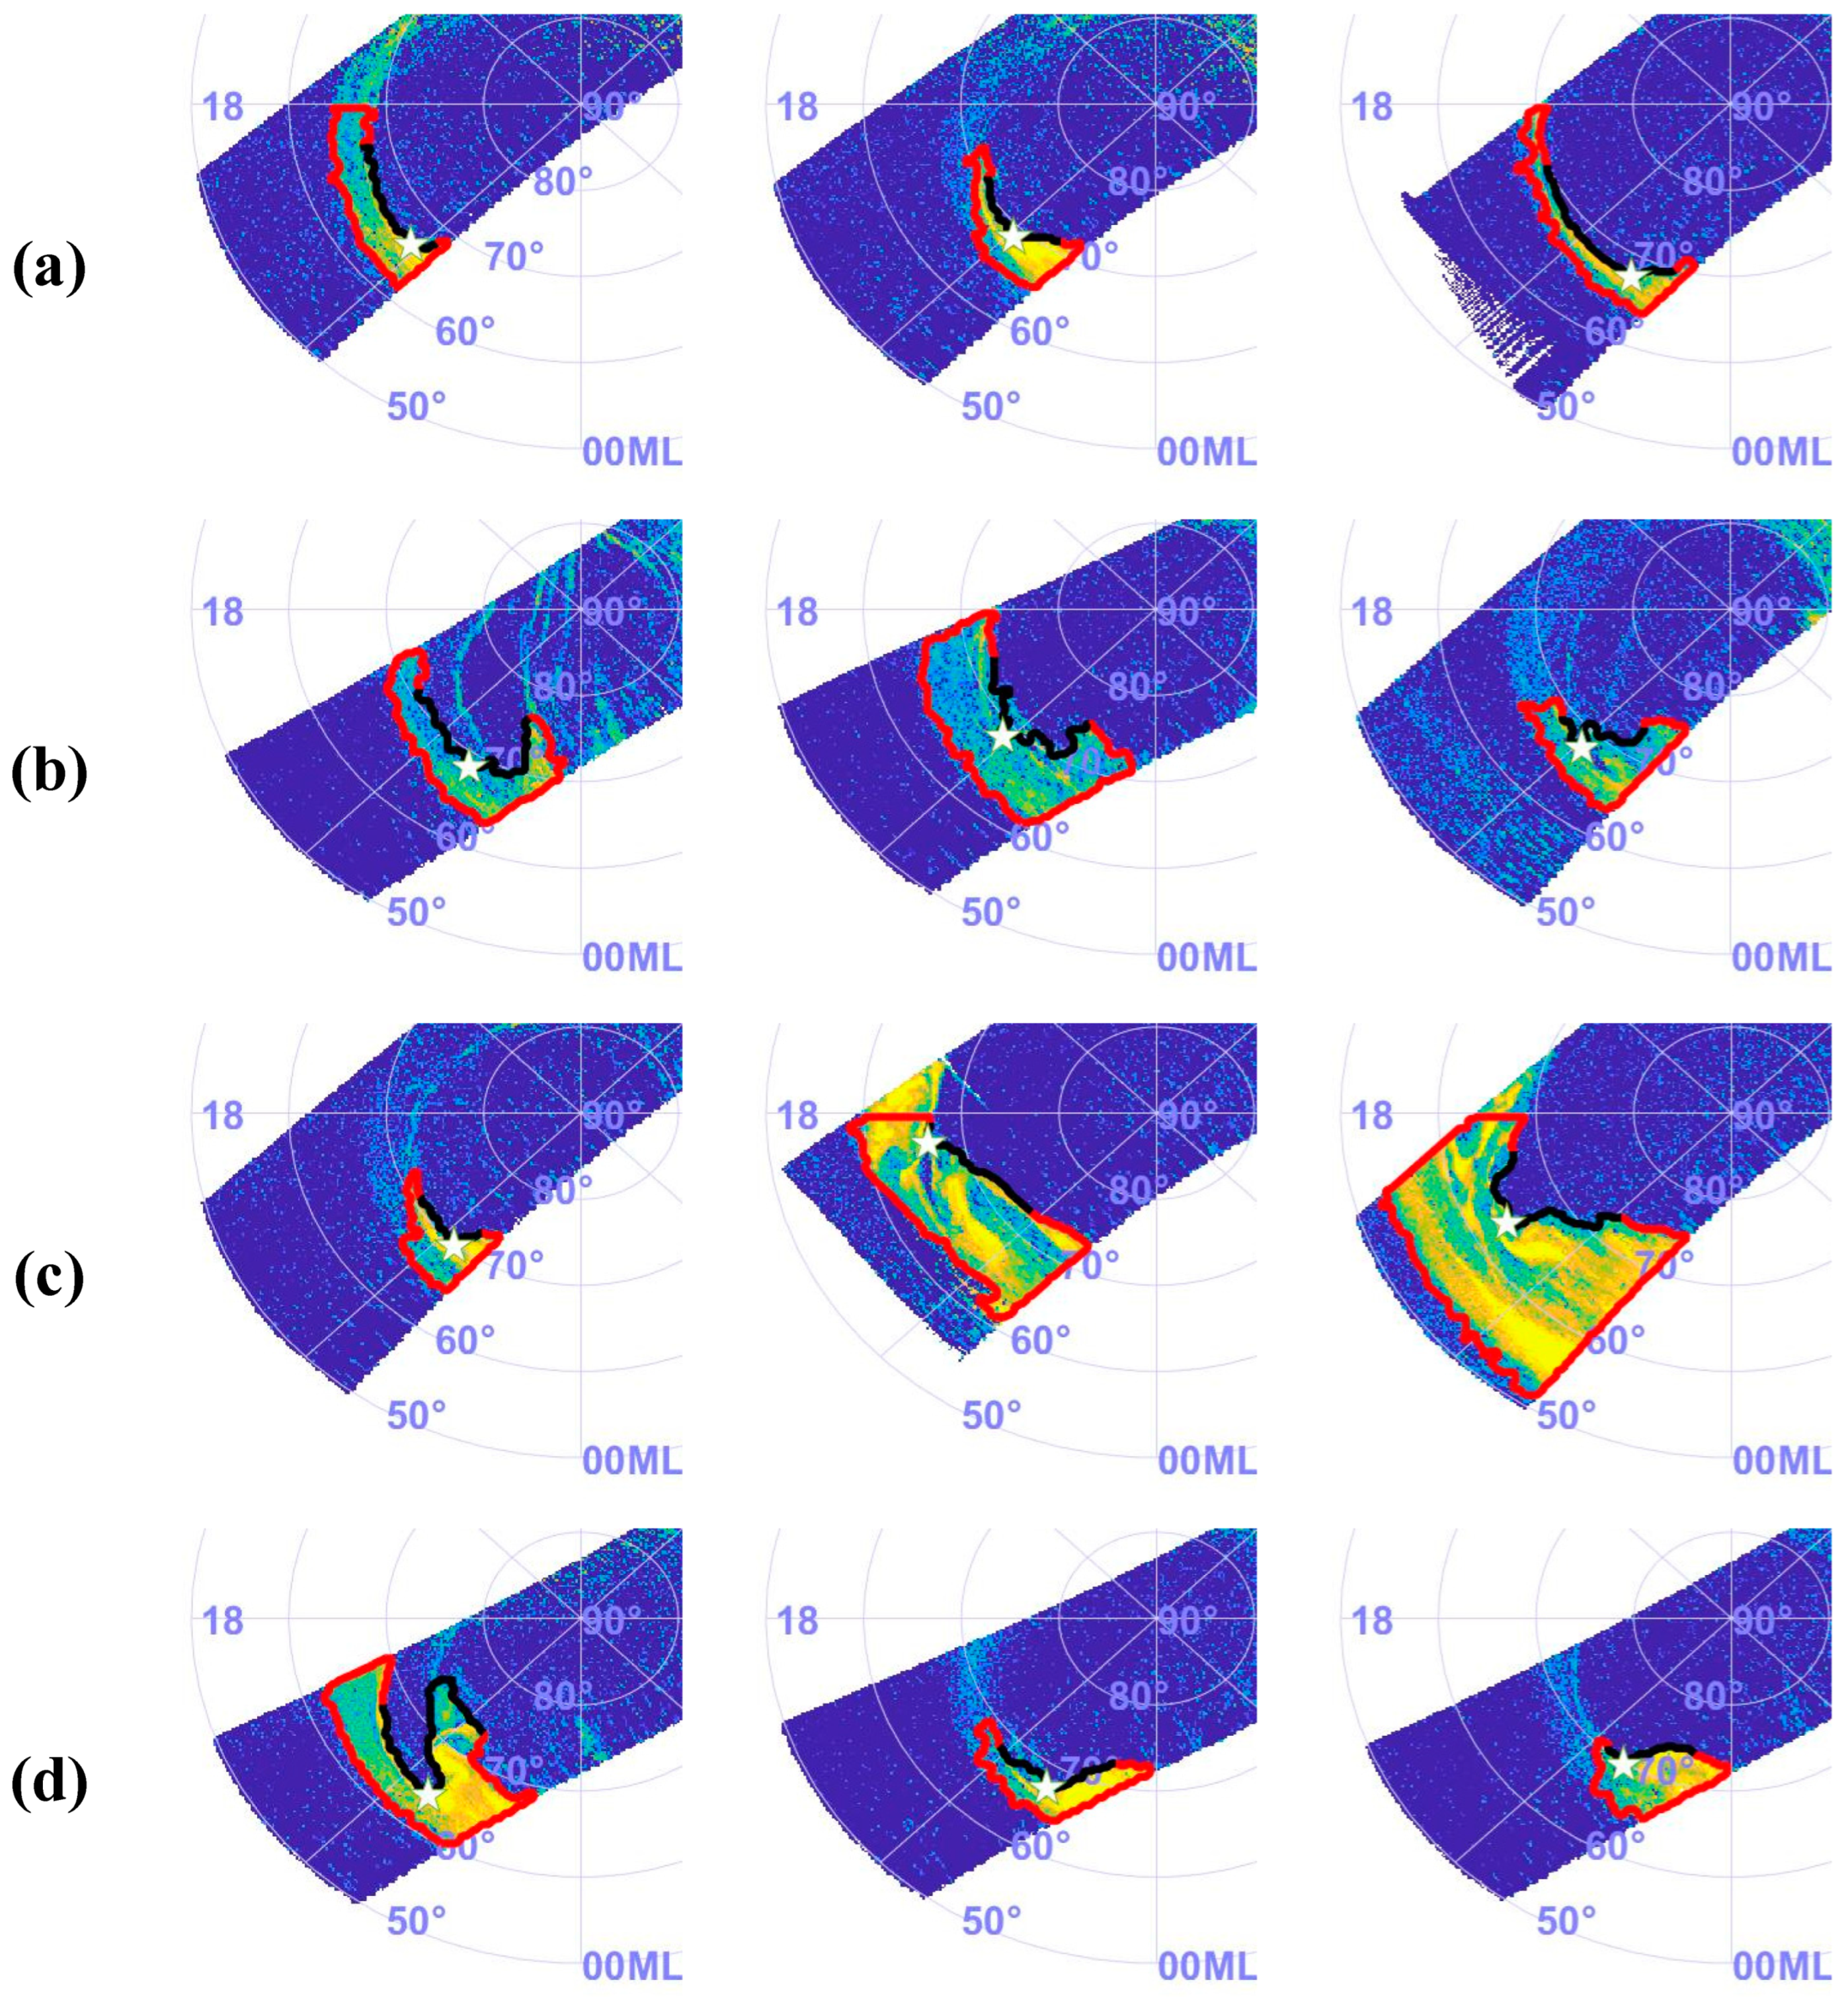
3.2.1. Analysis of Missed Events
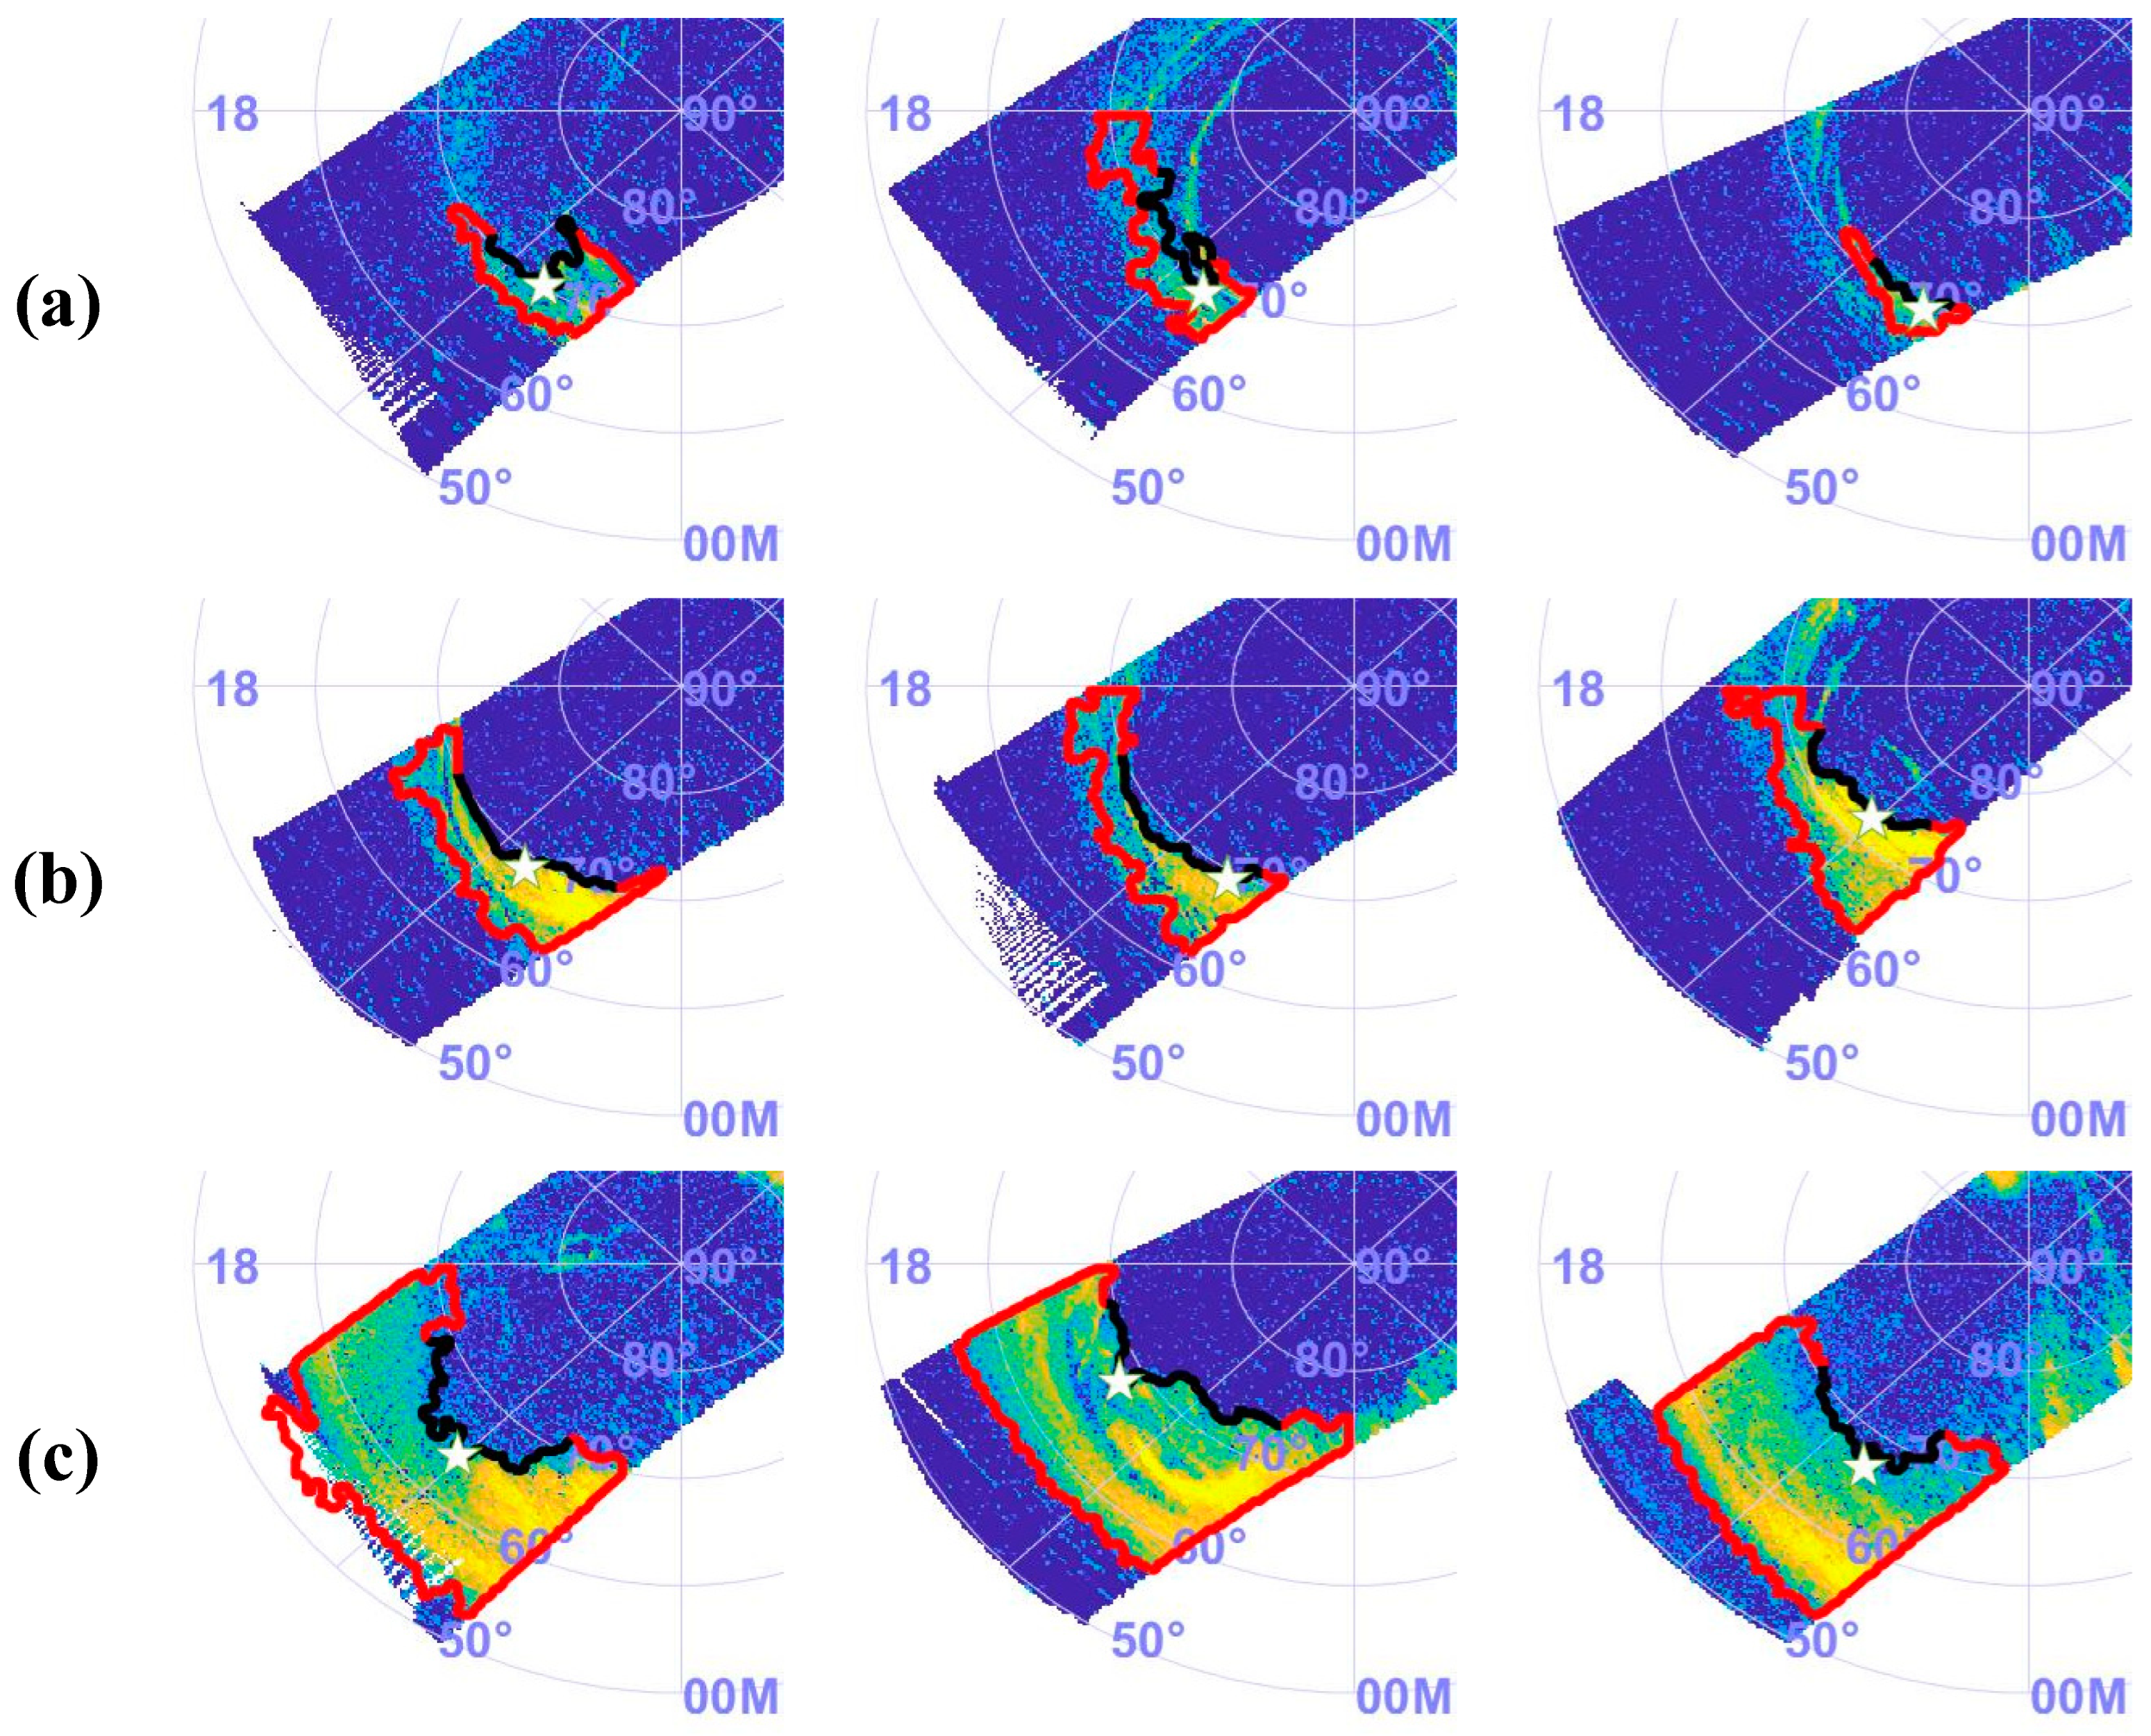
3.2.2. Analysis of False-Alarm Events
4. Conclusions
Author Contributions
Funding
Data Availability Statement
Conflicts of Interest
References
- Xu, W. Energy Budget in the Coupling Processes of the Solar Wind, Magnetosphere and Ionosphere. Chin. J. Space Sci. 2011, 31, 1–14. (In Chinese) [Google Scholar] [CrossRef]
- Li, L.-Y.; Cao, J.-B.; Zhou, G.-C. Relation between the variation of geomagnetospheric relativistic electron flux and storm/substorm. Chin. J. Geophys. 2006, 49, 9–15. (In Chinese) [Google Scholar] [CrossRef]
- Yang, X.; Gao, X.B.; Song, B.; Yang, D. Aurora image search with contextual CNN feature. Neurocomputing 2018, 281, 67–77. [Google Scholar] [CrossRef]
- Wang, Q.-J.; Du, A.-M.; Zhao, X.-D.; Luo, H.; Xu, W.-Y. Manifestation of the AE index in substorms on 6 August 1998. Chin. J. Geophys. 2009, 52, 2943–2950. (In Chinese) [Google Scholar] [CrossRef]
- Sutcliffe, P.R. Substorm onset identification using neural networks and Pi2 pulsations. Ann. Geophys. 1997, 15, 1257–1264. [Google Scholar] [CrossRef]
- Murphy, K.R.; Rae, I.J.; Mann, I.R.; Milling, D.K.; Watt, C.E.J.; Ozeke, L.; Frey, H.U.; Angelopoulos, V.; Russell, C.T. Wavelet-based ULF wave diagnosis of substorm expansion phase onset. J. Geophys. Res. 2009, 114, A00C16. [Google Scholar] [CrossRef]
- Tokunaga, T.; Yumoto, K.; Uozumi, T.; CPMN Group. Identification of full-substorm onset from ground-magnetometer data by singular value transformation. Kyushu Univ. Ser. D Earth Planet. Sci. 2011, 32, 63–73. [Google Scholar] [CrossRef]
- Kataoka, R.; Miyoshi, Y.; Morioka, A. Hilbert-Huang Transform of geomagnetic pulsations at auroral expansion onset. J. Geophys. Res. Space Phys. 2009, 114, A09202. [Google Scholar] [CrossRef]
- Meng, C.I.; Kan, L. Substorm timings and timescales: A new aspect. Space Sci. Rev. 2004, 113, 41–75. [Google Scholar] [CrossRef]
- Hu, Z.; Yang, H.; Ai, Y.; Huang, D.; Hu, H.; Liu, R.; Taguchi, M.; Chen, Z.; Qi, X.; Wen, Y.; et al. Multiple wavelengths observation of dayside auroras in visible range—A preliminary result of the first wintering aurora observation in Chinese arctic station at Ny-Ålesund. Chin. J. Polar Res. 2005, 17, 107–114. (In Chinese) [Google Scholar]
- Hu, Z.-J.; Yang, H.; Huang, D.; Araki, T.; Sato, N.; Taguchi, M.; Seran, E.; Hu, H.; Liu, R.; Zhang, B.; et al. Synoptic distribution of dayside aurora: Multiple-wavelength all-sky observation at Yellow River Station in Ny-Ålesund, Svalbard. J. Atmos. Sol.-Terr. Phys. 2009, 71, 794–804. [Google Scholar] [CrossRef]
- Hu, Z.-J.; Yang, Q.-J.; Liang, J.-M.; Hu, H.Q.; Zhang, B.C.; Yang, H.G. Variation and modeling of ultraviolet auroral oval boundaries associated with interplanetary and geomagnetic parameters. Space Weather 2017, 15, 606–622. [Google Scholar] [CrossRef]
- Akasofu, S.I. The development of the auroral substorm. Planet. Space Sci. 1964, 12, 273–282. [Google Scholar] [CrossRef]
- Liou, K.; Meng, C.I.; Lui, T.Y.; Newell, P.T.; Brittnacher, M.; Parks, G.; Reeves, G.D.; Anderson, R.R.; Yumoto, K. On relative timing in substorm onset signatures. J. Geophys. Res. Space Phys. 1999, 104, 22807–22817. [Google Scholar] [CrossRef]
- Frey, H.U.; Mende, S.B.; Angelopoulos, V.; Donovan, E.F. Substorm onset observations by IMAGE-FUV. J. Geophys. Res. 2004, 109, A10304. [Google Scholar] [CrossRef]
- Liou, K. Polar Ultraviolet Imager observation of auroral breakup. J. Geophys. Res. 2010, 115, A12219. [Google Scholar] [CrossRef]
- Yang, Q.-J.; Liang, J.-M.; Liu, J.-M.; Hu, Z.-J.; Hu, H.-Q. A approach for automatic identification of substorm expansion phase onset from UVI images. Chin. J. Geophys. 2013, 56, 1435–1447. (In Chinese) [Google Scholar] [CrossRef]
- Akasofu, S.I.; Kimball, D.S.; Meng, C.I. The dynamics of the aurora—II Westward traveling surges. J. Atmos. Terr. Phys. 1965, 27, 173–187. [Google Scholar] [CrossRef]
- Ma, Y.Z.; Zhang, Q.H.; Lyons, L.R.; Liu, J.; Xing, Z.Y.; Reimer, A.; Nishimura, Y.; Hampton, D. Is westward travelling surge driven by the polar cap flow channels? J. Geophys. Res. Space Phys. 2021, 126, e2020JA028407. [Google Scholar] [CrossRef]
- Mcpherron, R.L. Growth phase of magnetospheric substorms. J. Geophys. Res. 1970, 75, 5592–5599. [Google Scholar] [CrossRef]
- Mcpherron, R.L. Substorm related changes in the geomagnetic tail: The growth phase. Planet. Space Sci. 1972, 20, 1521–1539. [Google Scholar] [CrossRef]
- Samson, J.C.; Rostoker, G. Polarization characteristic of Pi 2 pulsations and implications for their source mechanisms: Influence of the westward travelling surge. Planet. Space Sci. 1983, 31, 435–458. [Google Scholar] [CrossRef]
- Lyons, L.R.; Nagai, T.; Blanchard, G.T.; Samson, J.C.; Yamamoto, T.; Mukai, T.; Nishida, A.; Kokubun, S. Association between Geotail plasma flows and auroral poleward boundary intensifications observed by CANOPUS photometers. J. Geophys. Res. 1999, 104, 4485–4500. [Google Scholar] [CrossRef]
- Sergeev, V.A.; Sauvaud, J.A.; Popescu, D.; Kovrazhkin, R.A.; Liou, K.; Newell, P.T.; Brittnacher, M.; Parks, G.; Nakamura, R.; Mukai, T.; et al. Multiple-spacecraft observation of a narrow transient plasma jet in the Earth’s plasma sheet. Geophys. Res. Lett. 2000, 27, 851–854. [Google Scholar] [CrossRef]
- Nakamura, R.; Baumjohann, W.; Schödel, R.; Brittnacher, M.; Sergeev, V.A.; Kubyshkina, M.; Mukai, T.; Liou, K. Earthward flow bursts, auroral streamers, and small expansions. J. Geophys. Res. 2001, 106, 10791–10802. [Google Scholar] [CrossRef]
- Nishimura, Y.; Lyons, L.R.; Angelopoulos, V.; Kikuchi, T.; Zou, S.; Mende, S.B. Relations between multiple auroral streamers, pre-onset thin arc formation, and substorm auroral onset. J. Geophys. Res. 2011, 116, A09214. [Google Scholar] [CrossRef]
- Hardy, D.A.; Schmitt, L.K.; Gussenhoven, M.S.; Marshall, F.J.; Yeh, H.C. Precipitating electron and ion detectors (SSJ/4) for the block 5D/flights 6–10 DMSP (Defense Meteorological Satellite Program) satellites: Calibration and data presentation. Rep. Air Force Geophys. Lab. 1984. Hanscom Air Force Base, Bedford, Mass. [Google Scholar]
- Morrison, D.; Paxton, L.J.; Humm, D.C. On-orbit calibration of the Special Sensor Ultraviolet Scanning Imager (SSUSI): A far-UV imaging spectrograph on DMSP F-16. Proc. SPIE-Int. Soc. Opt. Eng. 2022, 4485, 328–337. [Google Scholar] [CrossRef]
- Paxton, L.J.; Morrison, D.; Zhang, Y.; Kil, H.; Wolven, B.; Ogorzalek, B.S.; Humm, D.C.; Meng, C.I. Validation of remote sensing products produced by the special sensor ultraviolet scanning imager (SSUSI): A far UV imaging spectrograph on DMSP F-16. In Proceedings of the Proc. SPIE 4485, Optical Spectroscopic Techniques, Remote Sensing, and Instrumentation for Atmospheric and Space Research IV, San Diego, CA, USA, 30 January 2002. [Google Scholar] [CrossRef]
- Hu, Z.J.; Han, B.; Lian, H.-F.; Zhao, B.-R. SSUSI Images Acquired by Ultraviolet Spectrographic Imager Aboard DMSP Satellite from October to December during 2004–2006 [Data Set]. Zenodo 2023. [Google Scholar] [CrossRef]
- Wang, Q.; Meng, Q.H.; Hu, Z.J.; Xing, Z.Y.; Liang, J.M.; Hu, H.Q. Extraction of Auroral Oval Boundaries from Uvi Images: A New Flicm Clustering-Based Approach and Its Evaluation. Adv. Polar Sci. 2011, 22, 184–191. Available online: https://aps.chinare.org.cn/EN/10.3724/SP.J.1085.2011.00184 (accessed on 30 August 2023).
- Wang, Q.; Meng, Q.H.; Hu, Z.J.; Xing, Z.Y.; Liang, J.M.; Hu, H.Q. A approach for extracting auroral ovals in UVI images and its evaluation. Chin. J. Polar Res. 2011, 23, 168–177. (In Chinese) [Google Scholar]
- Yang, Q.J.; Hu, Z.J.; Han, D.S.; Hu, H.Q.; Ma, X. Modeling and prediction of ultraviolet auroral oval boundaries based on IMF/solar wind and geomagnetic parameters. Chin. J. Geophys. 2016, 59, 426–439. (In Chinese) [Google Scholar] [CrossRef]
- Han, B.; Lian, H.F.; Hu, Z.J. Modeling of ultraviolet auroral oval boundaries based on neural network technology. Sci. Sin. Technol. 2019, 49, 531–542. [Google Scholar] [CrossRef]
- Vapnik, V.N. Statistical Learning Theory; Wiley: New York, NY, USA, 1998. [Google Scholar]
- Wang, C.; Graziella, B.R. Progress of Solar Wind Magnetosphere Ionosphere Link Explorer (SMILE) Mission. Chin. J. Space Sci. 2018, 38, 657–661. [Google Scholar] [CrossRef]


| Train–Test Ratio | True Categories | SVM Classifier Determination Categories | Total | |
|---|---|---|---|---|
| WTS | No WTS | |||
| 1:9 | WTS | a = 162 | b = 165 | 327 |
| No WTS | c = 131 | d = 341 | 472 | |
| Total | 293 | 506 | 799 | |
| Train–Test Ratio | Raccuracy | Rrecall | Rmiss | Rfalse-alarm | Rprecision |
|---|---|---|---|---|---|
| 1:9 | 63.00% | 49.66% | 50.34% | 44.48% | 55.52% |
| 2:8 | 63.61% | 41.24% | 58.77% | 42.08% | 57.92% |
| 3:7 | 62.73% | 40.94% | 59.06% | 43.40% | 56.60% |
| 4:6 | 61.39% | 23.95% | 76.05% | 42.97% | 57.03% |
| 5:5 | 62.22% | 31.46% | 68.55% | 42.40% | 57.60% |
Disclaimer/Publisher’s Note: The statements, opinions and data contained in all publications are solely those of the individual author(s) and contributor(s) and not of MDPI and/or the editor(s). MDPI and/or the editor(s) disclaim responsibility for any injury to people or property resulting from any ideas, methods, instructions or products referred to in the content. |
© 2023 by the authors. Licensee MDPI, Basel, Switzerland. This article is an open access article distributed under the terms and conditions of the Creative Commons Attribution (CC BY) license (https://creativecommons.org/licenses/by/4.0/).
Share and Cite
Hu, Z.-J.; Lian, H.-F.; Zhao, B.-R.; Han, B.; Zhang, Y.-S. Automatic Identification of Auroral Substorms Based on Ultraviolet Spectrographic Imager Aboard Defense Meteorological Satellite Program (DMSP) Satellite. Universe 2023, 9, 412. https://doi.org/10.3390/universe9090412
Hu Z-J, Lian H-F, Zhao B-R, Han B, Zhang Y-S. Automatic Identification of Auroral Substorms Based on Ultraviolet Spectrographic Imager Aboard Defense Meteorological Satellite Program (DMSP) Satellite. Universe. 2023; 9(9):412. https://doi.org/10.3390/universe9090412
Chicago/Turabian StyleHu, Ze-Jun, Hui-Fang Lian, Bai-Ru Zhao, Bing Han, and Yi-Sheng Zhang. 2023. "Automatic Identification of Auroral Substorms Based on Ultraviolet Spectrographic Imager Aboard Defense Meteorological Satellite Program (DMSP) Satellite" Universe 9, no. 9: 412. https://doi.org/10.3390/universe9090412
APA StyleHu, Z.-J., Lian, H.-F., Zhao, B.-R., Han, B., & Zhang, Y.-S. (2023). Automatic Identification of Auroral Substorms Based on Ultraviolet Spectrographic Imager Aboard Defense Meteorological Satellite Program (DMSP) Satellite. Universe, 9(9), 412. https://doi.org/10.3390/universe9090412


