Article

Jovian Periodicities (~10 h, ~40, 20, 15 min) at ACE, Upstream from the Earth’s Bow Shock, on 25–27 November 2003

by
Georgios C. Anagnostopoulos
1,*,
Panagiotis K. Marhavilas
2,
Efthymios Vassiliadis
1 and
Emmanuel T. Sarris
1,3
1
Department of Electrical and Computer Engineering, Democritus University of Thrace, Vas. Sofias 12 St., 67132 Xanthi, Greece
2
Department of Production and Management Engineering, Democritus University of Thrace, Vas. Sofias 12 St., 67132 Xanthi, Greece
3
GSRT—Athena, 15125 Athens, Greece
*
Author to whom correspondence should be addressed.
Universe 2023, 9(8), 357; https://doi.org/10.3390/universe9080357
Submission received: 29 March 2023 / Revised: 3 July 2023 / Accepted: 20 July 2023 / Published: 30 July 2023
(This article belongs to the Special Issue Solar Energetic Particles)

Abstract

:
It is known that Jovian radio and high energy electron emissions are observed near Earth. The question we address in this study is whether the quasi-periodic ~10 h and ~40/15–20 min (QP-10 h, QP-40/15–20 min) energetic particle and magnetic field periodicities observed by Ulysses during its distant encounter with Jupiter in 2003 were also detectable as far as the Earth’s orbit. Surprisingly, we found that at the end of the extreme 2003 Halloween events, during times of a highly disturbed Jovian magnetosphere, as inferred from strong bKOM radio emissions observed by Ulysses, and a magnetic connection of Earth with the Jovian magnetosphere, as suggested by simulation results of the interplanetary magnetic field (IMF), the ACE satellite observed, between at least 25–27 November 2013 at the Lagrangian Point L1 (LPL1), all the characteristic Jovian periodicities. In particular, by using high-time resolution data (1/5 min), we found, for the first time, quasi-permanent electron, and magnetic field QP-10/5 h, QP-40 min and QP-15/20 data variations at LPL1 for at least three days. These observations reasonably suggest that low energy (~50–~300 keV) Jovian electrons reached the Earth’s environment; the observations examined extend the lowest energy limit of the Jovian electron spectrum from 200 keV to ~50 keV. In addition, the ACE satellite observed an impressive series of QP-10/5 h energetic (≤0.05 MeV) ion bursts (EIBs) with strong cross-field intensity gradients at the onset/decay phase of the events and energy-dependent field aligned anisotropy suggesting ion streaming in the anti-sunward direction during their main phase. A comparison of simultaneously obtained measurements by ACE at the LPL1 and by Geotail upstream from the bow shock and in the magnetosphere suggests that the QP-10/5 h EIBs are inconsistent with the concept of a terrestrial origin. On the contrary, the observations indicate that the series of QP-10/5 h EIBs on 25–27 November 2003 was a spatial effect caused by the ~10/5 h quasi-periodic approach of a large-scale sheet to the Earth’s environment. The source of the ion population forming the QP-10/5 h sharp EIBs seems most probably Jovian ions accumulated in the interplanetary space, although a solar ion contribution is possible. Based on the above results, it is reasonable to suggest that the observed QP-10 h, QP-40 min and QP-15/20 periodicities are due to Jovian influence. Further research is needed to study the cause of the QP-10/5 h EIBs. This study presents new data which extend our view on the influence of the QP-10 h/QP-40/QP-15/20 min Jovian emissions from the outer to the inner heliosphere at 1 AU.

1. Introduction

1.1. Energetic Particles in the Heliosphere

Cosmic rays are high-energy particles, primarily high-energy protons or atomic nuclei, measured by Earth and space-based experiments. The study of cosmic rays provides us with necessary information on their origin, the space covered to reach the sites of their detection (Earth and satellites/spacecraft), and their influence on Earth’s physical environment and human life. The terrestrial environment is continuously bombarded by streams of cosmic rays coming mostly on the one hand from the Sun and on the other hand from interstellar space, other galaxies, supernova explosions and active galactic nuclei. The study of cosmic rays contributes to the scientific comprehension of the formation and evolution of the solar system and other astrophysical processes.
Direct measurement of cosmic rays, especially at lower energies (#104–#109 eV), has been possible due to satellite measurements since the late 1950s. The low-energy cosmic rays are called “Energetic Particles” (EPs). During the space era, detecting EPs from the Sun (SEPs) and some planets greatly enhanced our knowledge of our solar system. EPs studies have taught us about physical processes in the Sun’s atmosphere, their acceleration processes at magnetohydrodynamic (MHD) interplanetary (IP) and planetary shock waves and their presence and physical processes taking place in planetary magnetospheres, the region upstream from the termination shock, the heliosheath etc.
Many of the launched spacecraft have been posed in trajectories as artificial satellites of Earth or were sent to investigate the near and far environment of the Earth’s magnetosphere. Also, several space missions explored the planets of our solar system. Therefore, besides information related to space weather research, space missions extract information near Earth’s orbit concerning the Earth’s environment, the atmosphere, the ionosphere, the magnetosphere, and the regions upstream from the Earth’s bow shock as well as the whole solar system, for instance, the Sun and its atmosphere, the IP space, planetary magnetosphere and their particle and electromagnetic emissions, astrophysical objects/processes etc.
A significant space research tool has been the satellite exploration of the space downstream and upstream from the Earth’s bow shock by spacecraft like IMP-7/8, ISEE-1/2/3, ACE, GEOTAIL, CLUSTER 1/2/3/4, WIND, SOHO, STEREO-A and B. These satellites have observed mostly energetic ion (EI) events of two types: EI events originated from the Sun/interplanetary space, and EI produced in Earth’s magnetosphere, including its bow shock. The former last for a long time (a few days), their flux increases and decreases rather smoothly (# hours), show hard spectra (γ ≈ 2–3) and are rich in highly ionized (i.e., O6+, O7+) particles [1,2], whereas the latter last for a short time (#minutes to a couple of hours), increase abruptly (seconds/minutes), show soft spectra (γ ≈ 3.5–5) and are often rich in low charged (ionospheric O+) protons [3,4,5,6,7,8,9,10,11,12,13,14].
The spacecraft ISEE-3, Wind and ACE moved around the Lagrangian point L1 at distances around 220 Re from Earth, providing information of special interest.
Extremely extent literature has been written on the observational characteristics and controversy regarding the origin of the short-lasting EI events observed upstream from the bow shock, which lasted for more than four decades. In our opinion, the total of observational features gathered so far suggests that the >50 keV upstream EI events seem to be mostly originated from the Earth’s magnetosphere [4,7,8,15,16], while it is also clear that some contribution comes from the acceleration of ambient solar EI population at the quasi-perpendicular side of the bow shock [3,6,12] via the Shock Drift Acceleration mechanism [16]. Fermi acceleration has not been confirmed to ion energies >50 keV at the bow shock, as shown in the following section.
In some cases, “impulsive” SEPs can also last for a few hours; such events can be due to either impulsive solar particle events [2] or local MHD shock drift acceleration [17,18].

1.2. Near Earth’s Bow Shock Ion Events

Scholer et al. [19] performed a statistical analysis of particles >30 keV/charge upstream of the Earth’s bow shock. They concluded that the probability for upstream particle events is highest for small angles between the magnetic field and the radial direction, indicating that the occurrence is determined by the bow shock connection time of a field line convected with the solar wind. Mitchell and Roelof [20] presented the results of a statistical study of 4 years (1972–1976) of observations made by IMP 7 and 8 at ~40 Re of 50–200 keV upstream EI events. They found a monotonic increase in the probability of observing upstream particle events with a decrease in the angle (θBn) between the interplanetary magnetic field (IMF) and the local shock normal at the point where the IMF intersects the bow shock. They also found a positive correlation of the upstream ion intensities with the geomagnetic index Kp.
Ipavich et al. [21] studied the characteristics of 33 diffuse particle events in the energy range from ~30 to ~130 keV/Q observed upstream of the Earth’s bow shock by ULECA onboard ISEE-1. The particle flux was found to decay exponentially with distance from the bow shock, with an e-folding distance of ~7 RE for H and He at 30 keV/Q. They reported that inverse velocity dispersion (IVD) was observed in the 33 events they examined. They claimed they found them consistent with a first-order Fermi acceleration mechanism and a free escape boundary upstream of the bow shock.
Wibberenz et al. [22] elaborated the temporal structures, energy spectra, and spatial gradients of 25–70 keV protons during four intense upstream ion events observed on December 3, 1977, by the medium-energy particle telescope KED onboard ISEE 2. They determined a field-aligned gradient pointing toward the bow shock with an e-folding distance L = 6.5 ± 1.5 RE for ≈30-keV protons. Under the Parker interplanetary magnetic field (IMF) configuration, the above observations were interpreted by some authors in terms of a Fermi acceleration model suggesting the detection of the highest flux near the dawn quasi-parallel bow shock [19,20,21,22,23,24,25,26,27]. Ref. [22] indicated that the fluxes of the ion events are positively related to the time connection tc of the field line at the position of the detective satellite with the bow shock front, where they are considered to accelerate by a diffusive (Fermi type) process. Refs. [23,24,25,26,27] also have attempted to a few upstream ion events published by [21,22,26] in terms of first-order Fermi models.
On the other hand, many case and statistical studies showed that upstream ion bursts of magnetospheric origin are often accompanied by relativistic (≥220 keV) electrons occurring during times of active (Kp ≥ 3) geomagnetic periods [7, 8 and references therein]. The occurrence rate of ion and electron bursts increases when the solar wind speed and the geomagnetic activity index are enhanced [7,8,20,28,29,30].
Anagnostopoulos et al. [7] presented results from a statistical analysis of energetic (50–220 keV) ion events of magnetospheric origin observed by IMP-8 upstream from the bow shock. The statistical analysis of these EI events shows a dawn-dusk asymmetry in ion distributions, with most events upstream from the quasi-parallel pre-dawn side. They also found a positive correlation of the upstream ion fluxes with the geomagnetic index Kp. These observations have been explained by a leakage model of magnetospheric particles, which predicts ion leakage from the dusk magnetopause [4,31,32] and final escape into the interplanetary space from the dawn/pre-noon region [7,15,33].
Further elaboration of the features of the upstream EI events has demonstrated (1) a high percentage (~80%) accompanied by the presence of magnetospheric >220 keV electrons [9], (2) association with the presence of ionospheric O+ [4,5,27] and (3) Predominance of EI events with forward or no velocity dispersion at their onset phase [6,8,9,34].
Based on their observational findings, the studies mentioned above inferred that the magnetosphere is the main source of the upstream EI events.

1.3. Ion Events Far Upstream (~200 Re) from the Earth’s Bow Shock

Mitchell and Roelof [20] compared several upstream energetic (50–200 keV) ion events observed simultaneously by solid-state detectors on ISEE 3 at ~200 Re (L1 Point) and on IMP 8 at ~35 Re from the earth. Conclusions were based on comparing the pitch angle distributions (PADs) observed at the two spacecraft and transformed into the solar wind frame. The PADs were found beamlike at ISEE-3 and confined to the outward hemisphere, while they were pancakelike at IMP 8 close to the bow shock. Sanderson et al. [35] noted that waves are sometimes present at ISEE-3, then the pitch angle distributions are broadened, and the amount of broadening correlated with the amount of wave activity. They inferred that the scattering decreases with upstream distance, ranging from strong scattering at the bow shock to weak scattering at ISEE 3.
Maragakis et al. [36] performed a similar but more extended statistical analysis (492 cases) of simultaneous ion observations with one spacecraft outside the magnetopause and another one around the L1 point (ACE: ~120 Re). They found that the proton flux at ACE is much lower than that at Geotail by an average factor of <jACE/jGΕOΤ> > 10−2 and that the spectrum hardens throughout the ion propagating from near the magnetopause up to the L1 point [14,25]; they evaluated a great average decrease between Geotail and ACE of the spectral indexes γ, for a power law fitting (dj/dE~E−γ) <γGΕOΤACE > ≈ 3 at 80 keV.
Some studies concluded that they could not decide between bow shock acceleration and leakage from the magnetosphere as the agent of the ion events observed far from the bow shock, based on the measurements of a sole satellite [28,37,38]. However, the Wind EI events examined in [28], when compared with measurements made by Geotail and IMP-8 near the Earth’s bow shock, were found to support leakage of energetic particles from the magnetosphere (presence of magnetospheric electrons and ionospheric O+ ions, dawn–dusk asymmetry of energetic ions and electrons, anisotropic ion distributions, energy dispersion of ion intensities, high values of geomagnetic index Kp (3–5+)). From the results of this study, we infer that the origin of EI events can be checked by comparison with measurements near the Earth’s bow shock.
Ref. [15] studied the relation between the upstream events observed from about 70 to 1750 Re away from the Earth by STEREO A and STEREO B and observations in the vicinity of the terrestrial bow shock (up to 30 Re) by Cluster and Geotail. They found that the upstream events near the bow shock often coincide with sunward-directed electron bursts, increased AE index (>200 nT), non-exponential proton spectra, and the presence of O+ ions, all of which imply at least partly a magnetospheric origin. These ion events are associated with the upstream events observed by STEREO A and STEREO B far upstream from the bow shock.

1.4. Jovian Energetic Particles Far (~200 Re) Upstream from the Earth’s Bow Shock

Jupiter is the largest magnetosphere in our solar system. Jovian radio emissions are directly observed by ground-based instrumentation [39,40,41], although most of our current information on radio emissions has come from in-situ spacecraft observations [42,43,44].
Near Earth space, measurements have also confirmed the detection of relativistic electrons of a Jovian origin when the Earth could be magnetically connected to the magnetosphere of Jupiter [45,46,47,48,49]. Ref. [49] first noted relativistic (0.22 ≲ E ≲ 2.5 MeV) electron enhancements in the IMP-7/CPME intensity measurements characterized by an energy spectrum quite different from that of solar or magnetospheric electrons (with γ = 1.3 ± 0.3) not unlike the electron spectrum observed in the vicinity of Jupiter. They inferred that it is reasonable to suggest that the observed electrons may be of Jovian origin. Jovian electrons near Earth’s environment show a 27-day modulation due to solar rotation [46] and a strong 13-month periodicity associated with Jupiter’s synodic period [47,48]. Ref. [46] found that the Jovian electron intensity shows a maximum during the ideal Parker spiral connection and that a trend exists for solar wind speed influence, which is well explained in terms of solar wind interactions.
The question addressed in this study is whether, besides radio and relativistic electron emissions, other plasma parameter variations occur in the near-Earth interplanetary space due to a Jovian influence under some special conditions. Surprisingly, we found that after the extreme Halloween events (November 2003), while the whole heliosphere [50,51] and the Jovian magnetosphere were highly disturbed [52,53] and the Earth was magnetically conjugated with the environment of the Jovian magnetosphere, between 24–29 November 2013, the ACE satellite observed: (i) quasi-periodic EI events separated by the characteristic Jovian ~10 h period (ii) the ~10 h quasi-periodic EI events superposed on the solar EP intensity background at times of a significant drop, (iii) ~10 h periodic modulation of several plasma parameters, as, for instance, IMF direction, energetic electron spectrum and high energy heavy (Z > 5) ion measurements, (iv) ~40 min quasi-periodic variation of some plasma parameters, as, for instance, IMF direction (~40 min quasi-periodicity is the characteristic period of EPs and radio emissions from the Jovian high latitude magnetosphere [44,54,55,56,57,58,59]. The above ~10 h and ~40 min quasi-periodic variations reveal, for the first time, a fine variable plasma profile in the region upstream from the bow shock due to Jovian influence.

2. Instrumentation and Data

2.1. The ACE Mission and Instrumentation

Our present study is based on measurements made by the ACE, Geotail and the Ulysses spacecraft.
The ACE (Advanced Composition Explorer) satellite was launched in 1997 (25 August 1997) with the main scope of monitoring the elemental and isotopic composition of EPs, and also their ionic charge-state, in the neighboring interplanetary space [60,61]. The ACE satellite orbits the L1 Libration point (LPL1), which constitutes the point of Earth-Sun gravitational equilibrium at about 1.5 million km (~220 Re) from the Earth and about 148.5 million km from the Sun (Figure 1). Being in this position allows its instrumentation to depict and monitor the status of solar wind and transmit data back to Earth with approximately one hour lead time [61]. ACE also provides near-real-time continuous coverage of the solar wind parameters and SEP measurements. Therefore, from a space weather viewpoint, it provides an advance warning (approximately one hour) of geomagnetic storms and other phenomena. Here we compare ACE data with data obtained by the Earth’s satellite Geotail to investigate the origin of QP-10 h EIBs on 25–27 November 2003.
ACE is carrying six high-resolution sensors and three monitoring instruments, including the following experiments used in this study: (a) the EPAM (Electron, Proton, and Alpha Monitor) and (b) the MAG triaxial flux-gate magnetometer.

2.2. The EPAM and MAG Instrument

One of the experiments onboard the ACE satellite is the EPAM instrument (an acronym for the “Electron Proton Alpha Monitor”), which is the flight spare of the HI-SCALE instrument (an acronym for the “Heliospheric Instrument for Spectra, Composition, and Anisotropy at Low-Energy”) onboard Ulysses. Thus, the two instruments are practically identical. Therefore, the compared data of analysis at ACE positioned near Earth and Ulysses in the environment of Jupiter facilitate research under conditions of Earth—Jupiter magnetic connection.
More particularly, the EPAM instrument was constructed to record low-energy ions and electrons, and it is composed of five telescope apertures of three different kinds (similar to the HI-SCALE/Ulysses instrument): CA, LEMS30 and LEMS120, and (iii) LEFS60 and LEFS150. The numbers 30, 60, 120, and 150 indicate the inclination of each telescope concerning the spacecraft’s spin axis, which looks toward the Sun [60]. In the present study, we use mostly ion observations from the LEMS120 telescope of EPAM, electron data from the LEMS30 telescope and heavy ions (Z > 5; E > 2.5 MeV) from the CA/WARTD60 telescope. The LEMS120 telescope measures ions at 47–4800 keV (8 channels P1′, …, P8′).
It is noted that solid-state detectors are utilized to measure the energy and composition of the incoming particles. The LEMS30 (channels P1, …, P8) telescope on the Ulysses spacecraft (or ACE) was exposed to solar X-rays during half of its spin due to its direct explosion to the solar disc, causing a constant problem for the ACE/EPAM instrument. However, the Ulysses/HISCALE instrument only experienced issues when approaching perihelion. In 1998, on day 78, the LEFS150 (channels E1, …, E4) detector on EPAM malfunctioned, and its data was deemed unusable due to contamination. This left only two detectors, LEFS60 (channels E1′, …, E4′) and LEMS120 (channels P1′, …, P8′), as fully functional on EPAM, limiting the ability to study radial anisotropies at ACE using the EPAM MFSA data, but still allowing the study of tangential and meridional anisotropies. In the present study, we use WARTD60/Z3 (Z > 5, E > 2.5 MeV) channel data.
The EPAM telescopes use satellite spinning to sweep the full sky to measure EP fluxes with a typical time resolution of 1 min. In addition, it is remarkable that the ACE/EPAM omnidirectional data (i.e., the averaged data over all sectors of each telescope) consists of electrons and ions in the energy range from about 50 keV to 5 MeV [59].
The ACE/MAG magnetic-fields experiment, which is a flight spare of the magnetometer onboard the Wind satellite, is a twin tri-axial flux-gate magnetometer that measures the dynamic behavior of the vector magnetic field, involving measurements of interplanetary shocks, waves, and other features that govern the acceleration and transport of energetic particles [62].

2.3. GEOTAIL Mission. Proton and Magnetic Field Instruments

The Geotail spacecraft was launched on 24 July 1992. Its original orbit extended from the near-Earth region, ~8 RE from the Earth to the distant tail ~210 Re, but since February 1995, Geotail’s orbit changed and has been in an elliptical orbit (9–30 Re), where it has provided data on most aspects of the solar wind interaction with the magnetosphere. Surviving much longer than planned, Geotail continued to send back crucial data until operations ended on 28 November 2022.
One of its experiments was EPIC (Energetic Particle and Ion Composition). The primary objective of EPIC was to obtain information on the origin, transport, storage, and acceleration mechanism of suprathermal and non-thermal particle populations. Its ICS (Ion Composition Subsystem) detector measures mass and energy properties of ions with energies of less than 50 keV to ~3 MeV. In situ, magnetic field measurements in the frequency range below 50 Hz were provided by dual fluxgate magnetometers and a search coil magnetometer, MFG.

2.4. The Ulysses Mission and Instrumentation

Ulysses was a joint project of ESA and NASA, under the leadership of ESA with the participation of Canada’s National Research Council) Ulysses’ main mission was to orbit the Sun and observe it at all latitudes from 1990 until 30 June 2009 (last mission day), achieving three “fast latitude scans” of the Sun [63]. Twelve different instruments were mounted on Ulysses probe and, among others, the following: (i) The Magnetometer (MAG) was used for measuring the magnetic field in the heliosphere and Jupiter’s magnetic field. (ii) The “Solar Wind Plasma Experiment” (SWOOPS), which detected the solar wind. (iii) The “Unified Radio and Plasma Wave” Instrument (URAP), which picked up radio waves from the Sun and electromagnetic waves generated in solar wind close to the spacecraft. (iv) The “Low-Energy Ion and Electron Experiment” (HISCALE), which investigated the energy, fluxes, and distribution of energetic particles in the heliosphere. The HISCALE instrument utilized three separate silicon solid-state detector systems (LEMS/LEFS, CA, “WART”). HISCALE instrumentation recorded measurements of interplanetary ions and electrons, where the ions (Ei > 50 KeV) and electrons (Ee > 30 KeV) were detected by five separate solid-state detector telescopes, oriented to give essentially complete pitch-angle coverage from the spinning spacecraft. Data from the above four instruments are used in this study to compare observations near Earth and Jupiter. Ulysses approached Jupiter for the first time in 1992 [64] and for a second time at the beginning of 2004. The second encounter of Ulysses with Jupiter was achieved on 5 February 2004 (day 36/2004) [54].

3. Observations

3.1. QP-10 h Ion Events Far Upstream from the Bow Shock: ACE Observations

Figure 2 shows the large energetic particle flux enhancements detected by ACE upstream from the Earth’s bow shock, followed by the extreme solar activity that started on 28 October 2003 (2003 Halloween events). Figure 2 displays hourly spin-averaged energetic particle and 64 s averaged magnetic field data, recorded from 17 October 2003 (day 290) to 6 December 2003 (day 340). More specifically, Figure 2a,b presents low-energy ion intensities (P3′, P2′ channels) as measured by the EPAM/LEMS120 telescope. In addition, panel c of Figure 2 shows heavy-ion intensities (Z3 channel) as measured by the EPAM/CA60/Wart60 head, while panel d depicts near-relativistic electron intensities (DE4 channel) as measured by the EPAM/LEMS30/WartB telescope. The bottom panel (e) illustrates the IMF magnitude measured by the MAG magnetometer on board ACE. The two dashed vertical lines indicate the interval (days 329–333) we focus on in this study.
It is worth noting that, according to the studies of Lario et al. 2005 ([50]; Figure 4) and Marhavilas et al. ([56]; Table 5), the EPAM/LEMS120 ion time-intensity profiles (P’ channels) indicated the existence of possible electron contamination during the time intervals of days 301/2003 and 306–307/2003. These ion channels were possibly contaminated by electrons at the beginning of the large SEP events when many electrons arrived rapidly, well before the heavier and slower ions started reaching the spacecraft. On the other hand, through the remaining intervals of days 290/2003–340/2003, all sectors of the P’ ion channels were non-contaminated.
As we mentioned in the Introduction, the Jovian magnetosphere was highly disturbed [49,50], and the Earth was magnetically conjugated with the environment of the Jovian magnetosphere [47], as will be discussed later in this paper.
Ιn Figure 2, we see multiple particle intensity enhancements, which were produced by successive injection of SEPs related to intense solar events produced by ICMEs or CIRs. Low-energy ion intensities peaked at or near the arrival of at least five (S1-S5) of the CME-driven shocks observed at 1 AU: d. 294/23:30 UT, d.297/14:48 UT, d.301/01:31 UT, d.302/05:58 UT, d.303/16:19, d.324/07:27 ([50], Table 1). The continuous acceleration of low-energy ions by CME-driven shocks and CIRs led to the elevated low-energy ion intensities observed throughout more than 40 days [50].
Here, we focus on the series of spikes of energetic ions during the time interval 25–27 (329–331) November 2003, which is indicated by the normal dashed lines in Figure 2. The flux peaks are more intense in panel b, which shows the 68–115 keV ion intensities, as measured by the P2′ channel of the EPAM/LEMS120 telescope. Since the intense 68–115 keV ion intensity peaks observed by ACE between 25–27 November 2003 are consistent with an extra-terrestrial source and at the same time period, the Jovian magnetosphere was highly distur9bed (as inferred from the radio emissions observed by Ulysses), in Figure 3 we examine high time resolution data from ACE to check any possible Jovian signals in Earth’s environment.
Figure 3 shows data obtained by the ACE spacecraft upstream from the Εarth’s bow shock from 18–30 November 2003 (d. 323–334, 2003). More specifically, Figure 3 shows differential intensities of ions from the EPAM/LEMS120 detector in the energy channels P1′ (61–77 keV), P3′ (127–207), P’5 (36–601 keV) and P7′ (1123–1874 keV) (Figure 3a), differential intensities of high energy (>2.5 MeV) heavy (Z > 5) ions (Figure 3b) and the value of the electron flux ratio from the DE1 (38–53 keV) and DE2 (53–103 keV) energy channels of the EPAM/LEMS30 detector (Figure 3c); the rest of the panels display the differential intensities of 50–103 keV electrons (Figure 3d), the longitudinal magnetic field angle ϕ (Figure 3e) and the IMF magnitude (Figure 3f). At the bottom of Figure 3, in a separate panel (Figure 3g), the values of magnetospheric index Sym-H are given for the same time interval (24–29 November 2003). The normal pink lines have been drawn every 10 h to facilitate the comparison of the data with the Jovian rotation period.
The magnetic field (panel f) and the energetic particle flux (panels a and d) increase on days 19–20 November, indicating the passage of an ICME-associated strong interplanetary shock (Lario et al. 2005; their Table 1), which produces an ion intensity peak at the time of its arrival at ACE, around the middle of 20 November (324), 2003 and influenced a large portion of the heliosphere [50]. This ICME triggered a magnetic storm, as revealed by the drop in the SYM-H index value (bottom panel). In general, the energetic ion fluxes decrease after day 29 November, but striking ion peaks are seen between days 29–31 November 2003. In the top panel of Figure 3 (Panel a), we can see strange periodic ion events: from the end of day 328 up to day 33: the P1′ flux time profile shows consecutive ion bursts separated by ~10 or ~5 h. The ~10/5 periodicities are also seen in ion channels P3′, P5′ and P7′ with the effects becoming weaker in the higher energy channels; we infer that the energy spectrum of the ~10/5 h quasi-periodic ion events reaches energies of ~0.5 MeV. We can also notice that on day 329, a ~5 h periodicity exists in the flux-time profile of P1′ and P3′ ions and small sporadic bursts at even earlier times (d. 326–327).
In Panels c and e, we see that the low-energy flux ratio DE1/DE2, which is considered a spectral index of energetic electrons, and the magnetic field vector longitudinal angle ϕ follow a quasi-periodic pattern of ~10/5 h; the ~10/5 h periodicity is more evident in the magnetic field vector longitudinal angle ϕ (panel e) on days 229–331, that is during the time interval of the ~10 h separated EI bursts (panel a). This correlation suggests a correlation of the magnetic field vector variation with the detection of the EI bursts by the EPAM instrument onboard ACE, which reminds a similar phenomenon observed by Ulysses far upstream (~1.2 AU) from the Jovian bow shock [51,55]. However, it is worth noting that the quasi-periodic modulation starts about three days earlier (from d. 326) than the appearance time (d. 329) of the series of the distinct ~10-h separated bursts.
Figure 4 shows the flux-time profile of the P1′ ion energy (47–68 keV) channel with the series of quasi-periodic major EIBs. The normal pink lines have been drawn every 10 h, the period of Jupiter’s rotation. From this figure, we see a piece of ACE data with ten EIBs, with Events marked numbered 1–6 following a periodicity of ~10 h (EIBs # 1, 2, … 6) and Events numbered 0−, 0, 1−, 1, 1+, 2 following a periodicity of ~5 h; both, ~10 h and ~5 h periodicities characterize the Jovian emissions into the heliosphere [54].
Figure 5 displays representative Pitch Angle Distributions (PADs) of ions as measured by ACE/EPAM/LEMS120 during the series of the QP-10 h EP events shown in Figure 3 and Figure 4. The normal and the horizontal axes indicate the normalized ion intensities and the cosine of ion pitch angles, respectively. The numbers 1–8 noted in the PADs correspond to the eight equal (450) sectors S1–S8 of a circle, corresponding to the angular detection directions of the instrument [60]. The four panels, from top to bottom, on both sides of Figure 5, display measurements from the energy channels P1′, P2′, P3′ and P4′.
The panels on the left side of Figure 5 display the PADs during the onset phase of the ACE EIB #5 (09:15–09:20 UT, on November 27 (331), 2003. All four PADs show a cross-field anisotropy with higher fluxes observed in sector 8 than in the opposite sector 4, which suggests a positive anisotropy index A = (S8 – S4)/(S8 + S4). The cross-magnetic field anisotropy is highest in the highest energy channel P4′ and lowest in the low-energy channels P1′ and P2′, with intermediate value anisotropy in channel P3′. Such positive relation of the particle anisotropy A with particle energy E suggests the existence of cross-field intensity gradients. We point out that such a positive correlation between A and E strongly suggests an undetectable Compton-Getting effect (which produces the highest cross-field anisotropy in the lowest energies).
The cross-field intensity gradients during the onset phase of the event reveal the entrance of the spacecraft in a sheet of streaming particles [Sanderson et al., 1981]. Similar cross-field anisotropies suggesting cross-field intensity gradients were observed during the decay phase of the EIBs, which indicates the exit of the spacecraft from the energetic particle sheet.
The panels on the right side of Figure 5 display the PADs during the main phase of event #3 at 07:10–07:15 UT on November 26 (330), 2003. The PADs at low energies (P1′, P2′) are highly anisotropic, suggesting strong field-aligned particle streaming. A comparison of the P1′ and P2′ ion PADs with the PADs of P3′ and P4′ ions indicates that the ion anisotropy is energy dependent, with decreasing field aligned anisotropy A//= (S5 − S1)/(S5 + S1) in higher energy ion PADs; such a phenomenon has not been reported on upstream ions escaping from the Earth’s magnetosphere/bow shock as far as we know. Since the IMF, during the whole time of the QP-10/5 h events on 25–27 November 2003, and in particular at 07:10–07:15 UT (Event #3) directed outward from the Sun, the field-aligned ion streaming, suggests that the Event #3 is consistent with a non-terrestrial origin.

3.2. ACE—Geotail Observations Compared

3.2.1. ACE Ion Event #5

The short-lived (a few hours) energetic (>~40 keV) ion events observed at the Lagrangian Point L1 (LPL1), streaming from the Earth’s environment in the sunward direction, have been explained in terms of either leakage from the magnetosphere or first-order Fermi acceleration at the Earth’s bow shock. Some investigators have noted that the observational features of this type of event cannot satisfactorily distinguish between either of the two mechanisms mentioned above based only on the analysis of data at LPL1 [28].
Here we follow the methodology of [15,36], who compared simultaneously obtained observations at LPL1 and near the bow shock/within the magnetosphere and found conclusive results on the origin of the EIBs at LPL1. In particular, we examine two representative time intervals on November 25–27 (329–331)/2003, when ACE observed EIBs #3 and #5.
In Figure 6, we compare the flux time profiles of ACE/EPAM/LEFS120 energetic ions (panel a), Geotail ICS/EPIC protons (panel b), the latitudinal and longitudinal angles of the magnetic field vector, θ and ϕ observed by the MGF experiment onboard Geotail model (Fairfield, 1971) bow shock (panel d), the angle ΘBn at the connection point PC between the IMFG and the normal direction to the bow shock front (panel e) and the geomagnetic index AE (panel f) during the time interval 00:00–02:00 UT on November 27 (331), 2003.
ACE/EPAM/LEFS120 energetic ion differential intensities are shown for the energy channels P1’, P2’, P3’, P4’ and P5’ and Geotail ICS/EPIC proton differential intensities for the energy channels P3, P4, P5 and P6; the range of each energy channel is noted in the appropriate panels, a and b, correspondingly. The ACE EIB #5 can be seen in panel a, after ~01:45 UT, as intensity increases in energy panels P1′, P2′, P3′ and P4′. The dashed horizontal line in panel d indicates the lower level of the connection time tC = 12 min, above which strong Fermi acceleration is suggested to have occurred [22]. Fermi acceleration is most effective in quasi-parallel (ΘBn < 45°) bow shock structures and under high values of connection time tC, which allow the build-up of high-intensity upstream ion events [4,12,20,21,22,24,25]. The four ion flux enhancements in Geotail/EPIC P3, P4 and P5 ion data are marked as A, B, C and D.
The ACE upstream ion event #5 shows a gradual flux increase starting at ~01:15 UT and a sudden increase at ~01:56 UT. Geotail observed the upstream proton event D in the P3 channel between ~01:45–~01:57 UT and a maximum flux at ~01:50 UT. The question we address is: can any known physical processes explain the generation of the Geotail proton event D and, therefore, the ACE ion event #5 caused by particles travelling from the bow shock to the LPL1?
The onset of the Geotail proton event D (panel b) coincides with a gradual decrease of the connection time to values tC < 12 min. Furthermore, θBn increases between ~01:46–~01:50 UT, while the proton flux also climbs to its maximum value occurs. These observations contrast the major predictions of the Fermi models suggested to explain the generation of upstream ion events (Introduction; in particular [21,22,24,26,27].
Similar observations to Event D, which contrast the predictions of the Fermi models on flux relations to ΘBn and tC can be seen at the onset of upstream event B (01:22 UT). Also, Event C was observed during times of increasing angles ΘBn (from ~10° to ~45°) under various connection times tC, particularly between 01:10–~01:15 UT. Furthermore, all Geotail events occurring examined in Figure 6 took place under conditions of a quiet magnetosphere.
Furthermore, the AE index shows a decrease during the rising phase of Geotail ion event D (01:45–~01:50 UT) and an increase during the decay phase of this event (01:~51–~01:57 UT); this anticorrelation between the geomagnetic index AE and the proton intensity jGEOT are inconsistent with a magnetospheric source of event D.
We infer that neither of the Events A, B, C and D occurred under favorable conditions for Fermi-type acceleration or leakage models, and, therefore, they cannot support a terrestrial source of the ACE #5 Event.

3.2.2. ACE Ion Event #3

Figure 7 displays observations corresponding to the ACE EIB #3. In particular, Figure 7 displays the flux–time profiles of ACE/EPAM/LEFS120 ions (protons) in the energy channels P1′–P5′ (panel a), the Geotail ICS/EPIC protons in the energy channels P1–P5 (panel b), the energetic (73–115) protons observed by the geostatic satellites LANL 01A, 02A, 1994-084, and 97A (panel c) and the values of the geomagnetic index SYM-H (panel d), during the time interval 06:30–07:40 UT on November 26 (330), 2003. Detailed information for each of ACE/EPAM/LEFS120, Geotail ICS/EPIC, and the geostationary satellite particle observations are noted in panels a, b and c.
Panels a and b indicate by a normal dashed line (01) the almost common onset (within 1 min) of energetic particle enhancements at ACE and Geotail satellites at 06:53 UT. However, we can notice a light gradual flux increase at ACE which started ~20 min earlier, at ~06:36 UT, in P1’ and P3’ energy channels. An abrupt flux increase is shown at ACE starting at 07:21 UT (02). The ACE/EPAM ion fluxes reach their maximum intensities at ~07:30 UT (M) and drop to pre-event flux levels at 07:39 UT. At time M, the P1′ and P2′ channels show peak–to–pre–event flux increases of ~2 orders of magnitude.
Conversely, the Geotail P1–P3 energy channels show peak–to–pre-vent flux increases of at least one order of magnitude during 06:30–07:40 UT. In contrast, the flux increase #02 is observed ~5 min later (~07:35 UT) at Geotail than the corresponding one at ACE (~07:30 UT). Panels c and d reveal that no energetic particle injection events were detected by the plethora of geostationary satellites around the Earth under a quiet magnetosphere as inferred by the SYM-H index (−10~−20 nT; panel d).
The quiet magnetosphere (panels c and d) cannot explain the ACE EIB #3, with peak–to–pre–event flux increases as high as ~2 orders of magnitude at LPL1, as generated by a strong magnetic storm. On the other hand, the absence of inverse velocity dispersion at the onset (~06:53 UT) of the proton event at Geotail, near the Earth’s bow shock, is in contrast to a significant prediction of the Fermi acceleration as applied to the Earth’s bow shock [21,26].
Figure 8 displays the energy spectra of protons measured at ACE and Geotail during ACE Event #3 examined above (Figure 6). We test the hypothesis that ACE Event #3 might have occurred at LPL1 due to travelling particles originating from the Earth’s environment by some physical process (a Fermi-type acceleration, magnetospheric acceleration/leakage etc.). For this reason, we compare the ACE proton spectrum around the LPL1 between 07:28.00 and 07:32.00 UT (Event #3 maximum flux) with the spectrum of a proton population observed by Geotail upstream from the dawn bow shock at 07:1233–07:15.48 UT. The dawn quasi-parallel side of the bow shock is a preferential site to observe energetic ion events caused by either leakage of magnetospheric ions or ions accelerated via Fermi acceleration [4,7,8,33]. The upstream ion flux has been found to decay with distance from the bow shock. Several authors evaluated that the upstream ion flux decays exponentially with distance X from the bow shock (dj/dE ~ exp (-X/L), with an e-folding distance of 6–7 Re for H and He at 30 keV/Q [21,22]. Furthermore, the spectrum further upstream is harder than at the bow shock, indicating an increase in the e-folding distance with energy. [36] performed a statistical study for about half a year (day 242/1997–day 77/1998) and compared energetic particle intensities and spectra at Geotail and ACE. The average maximum intensity at 80 keV was evaluated to be <jG> ≈ 80 p/cm2 s sr keV at Geotail, but only <jA> ≈ 0.8 p/cm2 s sr keV at ACE, which suggests a large decrease of ~2 orders of magnitude between the fluxes observed close to the magnetosphere and at LPL1, or an average flux <jACE/jGEO> ≈ 1.6·10−3. Furthermore, the spectral index γ, for a power law fitting (dj/dE ~ E-γ), was found to be, in general, much harder at the position of ACE than the corresponding spectra observed by the Geotail spacecraft near the bow shock, with an average spectral index <γGΕO> ≈ 5.5 and <γACE> ≈ 2.8 correspondingly, and an average spectral ratio between the positions of the two spacecraft <γG>/<γA> ≈ 3 at the energy level of 80 keV.
In Figure 8, we compare the ACE proton spectrum around the LPL1 between 07:28.00 and 07:32.00 UT (Event #3 maximum flux) with the spectrum of the proton population observed by Geotail upstream from the dawn bow shock at 07:1233–07:15.48 UT. The comparison of the two proton spectra suggests: (a) comparable intensities at energies E = ~50–80 keV and higher intensities at ACE than those at Geotail, which are in direct contradiction to the statistical results by [36], which suggest much lower fluxes at LPL1 than close to the bow shock (<jACE/jGEOT> ≈ 1.6 10−3), (b) an unusual soft spectrum far from the bow shock (ACE) with and an index γ ≅ 4.2 between ~55–250 keV, which is much higher than the average spectral index (<γGΕOT> ≈ 2.8) at ACE found by [36]. Figure 8 suggests that ACE observed a population with different features than the ions observed close to the bow shock, originating from either the bow shock or the magnetosphere.
In conclusion, from the data shown in Figure 7 and Figure 8, we infer that: (i) ACE observed much higher proton fluxes at LPL1 than those observed by Geotail near the dawn bow shock, (ii) the maximum ion flux was observed earlier at LPL1 than near the bow shock, and (iii) ACE detected an unusually soft ion spectrum (γ ≈ 4.2) at LPL1. The above observational features are inconsistent with the ACE Event #3 as generated by ions travelling from the region upstream from the bow shock to the LPL1 and suggest an extra-terrestrial origin of the ACE energetic ion population observed between 06:53–07:39 UT on November 26 (330), 2003.

3.3. Jovian Electron/Ion/Magnetic Field Periodicities (10/5, 40/15–20 min) Near Earth

To further check the periodic profiles of the high-energy ions (Figure 3b), the value of the electron flux ratio from the DE1 (38–53 keV) and DE2 (53–103 keV) energy channels (Figure 3c) and the value of the longitudinal IMF angle ϕ (Figure 3e) we performed a spectral analysis of the corresponding time series. In particular, in Figure 5, we show the results derived by the spectral analysis applied on time series of the Z3 (Z > 5, E > 2.5 MeV) integral ion fluxes recorded by the ACE/EPAM/WARTD60 from d.327/00:00 UT until d.331/12:00 UT (top panel), the angle ϕ of the IMF recorded by the ACE/MAG magnetometer, during the time interval d.327/00:00 UT–d.329/24:00 UT (middle panel) and the intensity ratio DE1/DE2 of the electronic channels DE1 and DE2 from d.327/00:00 UT–d.330/12:00 UT (bottom panel) recorded by the ACE/EPAM instrument, respectively. The three graphs depict the squared-harmonic-amplitudes (vertical axis) that were calculated by using the sinusoidal amplitudes of the Fourier analysis as a function of the frequency f (horizontal axis).
The spectrum graphs of Figure 9 unveil the existence of significant periodicities at ~10/5 h. More explicitly, the Z3 heavy ionic flux time series show a peak at 9.2 h (i.e., close to 10 h) and a second peak at 7.7 h (panel a), which are significant at the level p < 0.01. The ϕ angle of the IMF also shows a distinct peak at 9.2 h (≅10.0 h) and a second one at 6.4 h (i.e., close to 5.0), which are significant at the p = 0.05 level (panel b). Finally, in the spectrum of the DE1/DE2 ratio (panel c), we see three peaks at 10.5 h (≅10.0), 15.2 h (≅3 × 5 h), and 21 h (≅ 2 × 10.5 h). [More information about the Fourier spectral calculation of the squared-amplitudes see in [51]/Appendix A].
From the comparison of the data shown in Figure 2, Figure 3, Figure 4 and Figure 9, we infer that the series of the QP-10/5 h EIBs (Figure 3 and Figure 4) is associated -among other parameters- with a QP-10/5 h modulation of the IMF ϕ angle, the electron spectrum and high energy heavy (Z > 5) ions, as in the case of the Jovian magnetosphere, the magnetosheath and the region upstream from the Jovian bow shock to distances as large as 1.2 AU from the planet [29,51,55].
Figure 10 shows spectral results constructed as in Figure 9, but for ACE electron flux ratio DE1/DE2, considered a spectral index, for the days (top to bottom) 229–331, 2003. In this figure, we focus on a higher frequency band than that of Figure 10 to examine the possible presence of ~40 min and ~15/20 min periodicities, which have been confirmed as characteristic Jovian radio, electron, and ion emissions by the Ulysses mission [44,52,53,54,58]. Surprisingly, Figure 10 shows peaks in the energy spectrum at ~40 min (35/36/41 min) and ~20 min (22/22/19 min) period in all three panels (d. 229–331, 2003). The peaks were very significant (p = 0.01) on 25 November (229) 2003. Peaks are also seen at 57 min and 72 min. Similar, ~40 min and ~20 min periodicities were found in the whole energy range (~50–~500 keV) covered by DE1, DE2, DE3 and DE4 electron channels on November 25–27 (229–331), 2003, but also in the whole-time interval November 24–29 (229–331), 2003.
Since QP-40 min and QP-15/20 min Jovian electron emissions have been shown to relate with the presence of magnetic field waves of the same period, we wanted to examine their possible presence in Figure 11 in the time interval of interest on d. 326–331, 2003. For this reason, in Figure 11, we display, from top to bottom, the three components of the IMF Bx, By, Bz and its total magnitude B as detected by the magnetic-field experiment MAG onboard ACE, between days 22–27 November (326–331), 2003. The normal green lines have been drawn for intervals of 40 min.
During almost the whole interval examined, all the IMF components, namely Bx, By, and Bz, show strong fluctuations. Furthermore, the values of the components Bx, By, and Bz generally show one or two peaks every ~40 min. To further check this impression, in Figure 12, we show spectral results, which were constructed as in Figure 9 and Figure 10, but for the component Bx on November 26 (330), 2003. Peaks at ~40 min (37.3–41 min) and ~20 min (18.7–22.4 min) period are clearly evident and statistically very significant (p = 0.01).
Since, as we mentioned above, ~40 min and ~20 min periodicities characterize the electron emissions (Figure 10), we infer that the findings of ~40 min and ~15/20 min magnetic field waves (Figure 11 and Figure 12) reasonably suggest a physical relation of the magnetic field waves with the >40 keV electron periodic emissions observed on d. 329–331, 2003 at LPL1.
Figure 11 also reveals another important feature: the QP-40/20 min fluctuations are superposed on QP-10/5 h variations of the IMF components Bx, By, and Bz on 25–27 November (229–331). The simultaneous presence of QP-40/20 min fluctuations and the -10/5 h magnetic field wave along with QP-40/20 min energetic electron emissions during QP-10/5 h modulation of the energetic electron spectrum provides strong evidence that the QP-40/20 min and QP-10/5 h periodic electron and magnetic field variations have a Jovian origin.
Notably, the magnetic field magnitude B shown in Figure 11d generally shows only smooth variations and starts decreasing from ~12 nT on November 22–23 (326–327) to ~7.5 nT on November 24 (328). B gradually decreased to ~4.5 nT by the end of d. 331.
The decrease of the magnetic field B on d. 328–329 (Figure 11) almost coincides with the beginning of decrease in (a) EPS high energy (9–15 MeV) proton flux at GOES-11 ([50]; Figure 4c) within the Earth’s magnetosphere, (b) CRNC high energy (11–20 MeV) proton flux at IMP-8 and >10 MeV ACE proton flux ([52]; Figure 2), (c) low-energy (~0.1–1.0 MeV) EPAM ion flux (Figure 3, this study; [50]; Figure 4b) at LPL1, (d) COSPIN high energy (~2.0–19 MeV) proton flux at Ulysses ([52]; Figure 3b,c) and HISCALE low-energy (~0.4–0.1 MeV) electron flux at the same spacecraft in the outer heliosphere (~5.2 AU). We infer that the distinct decreases seen in a magnetic field and energetic particle observations on November 24–55 (328–329) occur around the end of the October-November Halloween SEP events and suggest the entrance of ACE in a different IMF topology, where ACE starts detecting the series of the QP-10 h EIBs.

3.4. Jupiter-Earth Magnetic Connection and Jovian Emissions at Ulysses

In this section, we examine observations made by Ulysses (Figure 13) during its distant encounter with Jupiter [54] and a model IMF configuration in the heliosphere (Figure 14) to better check the Jovian origin on ACE data (~10 h and ~40/20/15 min) periodicities on 25–27 November 2003.
Figure 14a shows Parker IMF lines (assuming an average solar wind speed of 500 km/s [50]; Figure 2) and the projection of the planets Earth/Jupiter and the Ulysses spacecraft in the ecliptic plane (HGI coordinates) on November 26 (330), 2003 (omniweb.gsfc.nasa.gov); We see that Ulysses and Jupiter were positioned at almost the same longitude, but Ulysses (U) was at north latitudes (Figure 1b), on its way to the second Jupiter “encounter” [54]. This Ulysses “encounter” with Jupiter (J) occurred on February 5 (36), 2004, with the closest approach at 0.8 AU from the planet or at Jovicentric and heliographic coordinates RJU = 1683 RJ, θJU = 49°. Ulysses remained at latitudes as high as θJU >~70° in October–December 2003.
On November 26 (330), 2003, Jupiter was located at helio-distance RSJ 5.4 AU and helio-longitude θSJ = 80.5° and Ulysses at RSU = 5.62 AU and θSU = 80.2°, correspondingly (Figure 14a).
What is important to note is that Ulysses was found on November 26, 2003, at RJU ≅ 1.05 AU and θJU ≅ 72.1° in the Jovicentric Coordinate System, that is, at a distance Z ≅ RJU. sin θJU ≅ 1 AU above the Jovicentric X-Y plane (Figure 14b). This information is of high importance since it suggests that the Jovian periodicities were present at those times in a large portion of the heliosphere in a flux tube with a north-south section dimension, most probably, dJ > 2 AU, under the reasonable hypothesis of symmetric particle distribution in the north and the south Jovian direction [53,55,56,57,58].
Clear QP-10 h and QP-40 min periodicities were present in low-energy ion/electron and magnetic field data at Ulysses’ position, at least at times of CIR passages, during the whole period 289/2003–80/2004, when the spacecraft moved at the north (θJU > ~70°) at distances of ~0.8–1.2 AU. We proceed now to examine the specific presence of the Jovian periodicities on 25–27 November 2003 in the heliosphere based on Ulysses’ observations and in tight of the ACE observations we examined in the previous sections.
In Figure 13, we show Ulysses data for the time interval 315–340, 2003, to investigate the wave and particle activity of possible Jovian origin on 25–27 November (329–331) 2003. More specifically, we show, from top to bottom, measurements from HI-SCALE ion fluxes from the LEMS120 P1′ and P7′ and LEMS30 P1 and P7 channels (panel a), URAP radio emissions (panel b), HI-SCALE LEMS120 electron flux ratio DE2/DE1 (panel c), VHM/FGM magnetic field polar coordinates, θ, ϕ and B (panels d, e and f) and SWOOPS plasma density, temperature and speed (panels g, h and i).
A striking feature of the data shown in Figure 13 is the detection of two series of QP-10 h bKOM radio bursts (panel b) at times starting with the arrival of two CIRs on 317–319 and 334–336, 2003 (panels f, g, h and I; also see Figure 2 and relative discussion in [54]). Figure 13 shows an almost continuous QP-10/5 h electron spectral index (DE1/DE2) modulation during interval 318–340, 2003 (panel c). QP-10/5 h fluctuations can also be seen in the IMF angles ϕ and θ (panels d and e), which are most evident around the times of the two CIRs and upstream (before) and downstream (after) the arrival of interplanetary shock wave (ISW) on November 25 (327), 2003 observed by Ulysses at the beginning of d. 327, 2003 (blue arrow). It is worth noting that a series of QP-10 h bKOM radio bursts that started ~1 day was also observed after the ISW, which is consistent with the period needed for the ISW to reach the position of Jupiter and trigger its magnetosphere.
Based on the large dimension of the flux tube (dJ > 2 AU) with ~10/5 h periodicities at Jupiter, we have drawn two Parker IMF lines in Figure 14a. The first line has been drawn to pass near the Earth at a distance of 0.2 AU, and the second one is separated by the half distance dJ, ~1 AU from the first one, in the X-Y plane. From Figure 14a, we can see that the flux tube indicated by the two Parker IMF lines passes by Jupiter and crosses the Jovian magnetosphere. From Figure 13 and Figure 14, we can reasonably infer that the ACE ~10/5 and ~40/20/15 min periodicities observed at ACE and Ulysses have the same origin: particle and wave emissions from the Jovian magnetosphere. We may reasonably assume that large amplitude ~10/5 period Alfvèn waves may allow the QP-10/5 h approach of Jovian particles to the Earth’s environment while they move within the large-scale flux tube. The first CIR seen in Figure 13 on days 317–319, 2013, was a very strong event with magnetic field magnitude at the forward and the reverse shock as high as B ≥ 7 nT. These CIR shocks were the most intense ones observed by Ulysses for 140 days, from d. 230 to d. 370, 2003 ([50]; Figure 2) and coincided with the most intense bKOM emission observed by Ulysses in the same period. The Jovian magnetosphere was so disturbed that it emitted relativistic electrons, which were observed by Ulysses on November 320, 2003, not as a usual modulation in the relativistic electron spectrum but as an intensity increase by more than one order of magnitude [52]. These observations suggest that Jupiter was extremely disturbed, providing the heliosphere abundant energetic ions and electrons. The HISCALE P7 and P7′ 1.1–~1.9 MeV ion fluxes in Figure 13a show a gradual increase after the passage of the ISW until d. 329 and then a gradual decrease from d. 330 to d. 333 when Ulysses/HISCALE started detecting a CIR-associated soft ion population.
We point out that after ~1 day from the passage of the ISW (beginning of d. 327), from the middle of d. 328 to the end of d. 331, Ulysses observed QP-10 h bKOM radio bursts and HISCALE electron spectral index modulation. This time interval coincides with when ACE observed the QP-10 h electron, magnetic field, and ion periodicities. Based on the above results, it is reasonable to suggest that the observed QP-10/5 h electron and magnetic field periodicities at ACE on 25–27 November might be of a Jovian origin. The origin of QP-10 h ion bursts at ACE at the same period is a more puzzling issue discussed in the next section.

4. Summary of Observations and Discussion

In the present study, we investigate at the LPL1, for the first time, the possible presence of (1a) low-energy (~50–~500 keV) Jovian electron signature, (2a) Jovian electron and magnetic field variations with the ~10 h period of Jupiter rotation, (2b) the periodicities of ~40 min and ~15–20 min in electron emissions and magnetic field waves revealed by Ulysses, and (3) upstream ion events with the Jovian ~10/5 h periodicity. The motive of the whole project was the observation of QP-10 h peaks in ion flux-time profiles on d. 329–331, 2003, seen in previously published papers dedicated to the October–November 2003 Halloween solar events (i.e., [54]; Figure 4 of [50]).
The presence, the features, and the origin of the short-lived (from some minutes to a few hours) ion and electron events observed upstream from the Earth’s bow shock have been extensively studied from the bow shock [4,11,12,13,14,15,16,19,20,21,22,23,24,25,26,65,66,67,68] to distances of ~1750 Re [15,27,28,29,30,35,36,37,38]. In general, it is accepted that the upstream EIBs originate from the Earth’s magnetic environment, either by leakage from the magnetosphere during (sub)storms or by some kind of acceleration at the bow shock [4,14,23,25,63]. The upstream energetic ions propagate far distances and are routinely observed by ACE, at the LPL1, since 1997; the upstream energetic ions escaping from the bow shock reach LPL1 with lower intensities and harder spectra [15,20,27,33,36]. Short-lived energetic particle enhancements are also observed upstream from the Earth’s bow shock due to impulsive SEP events or local acceleration of solar particles at interplanetary shocks [1,2,17,18,36,69].
In the present paper, we address whether short-time duration energetic ion and electron periodicities originating from Jupiter can be observed in the Earth’s environment. In particular, we used, for the first time, 5 min ACE averaged data to examine whether energetic particle and magnetic waves with Jovian periodicities (~10/5 h, ~40/15–20 min) can be observed in the Earth’s environment under intense Jovian emissions and appropriate interplanetary conditions.
Jupiter rotates around the Sun at a distance of ~5 AU (5.45 AU Aphelion and 4.95 AU Perihelion). Its magnetosphere is the largest and the most powerful of any other planetary magnetospheres in the Solar System. For these reasons, understanding the dynamic processes in the largest magnetosphere of our solar system has been one of the outstanding goals of space physics [70]. Due to strong magnetospheric dynamic processes, the Jovian magnetosphere is a source of radio and high energy electron emissions in the heliosphere, also observed in the Earth’s orbit [45,46,71,72,73,74].
Besides radio and high energy electron emissions, energetic ion events with a Jovian signature (~10-h, ~40/15–20 min periodicities) have been observed by Ulysses at distances as far as 1.2 AU from Jupiter in the sunward direction [53,54,58]. To check the possibility of such periodicities upstream from the Earth’s bow shock, we elaborated on the data of the ACE satellite during the period after the extreme 2003 Halloween events. During the interval examined (November 25–27, 2003), the Jovian magnetosphere [49,50], along with the whole heliosphere [47,48], were highly disturbed, and the two planets were magnetically connected. In addition, the SEP background was reduced (Figure 2 and Figure 3, [50]; Figure 4) so that Jovian EP emissions might reach the Earth’s environment and could have been detected by the satellites.

4.1. The Most Important Observational Findings on 25–27 November (329–331), 2003

Our analysis of high-time (1/5 min) resolution data shows that between 25–27 November (329–331), 2003, the ACE, Geotail, and Ulysses spacecraft provided the following findings:
(1)
Low-energy (~50–~500 keV) electrons were observed at ACE with the characteristic Jovian QP-10/5 h, QP-40 min, QP-20 min, and-15 min spectral variations (Figure 3, Figure 4, Figure 9 and Figure 10).
(2)
Waves in the IMF direction were also observed by ACE with the same period as those (-10/5 h, -40 min and -15/20 min) of Jovian electrons. (Figure 3, Figure 9b, Figure 11 and Figure 12).
(3)
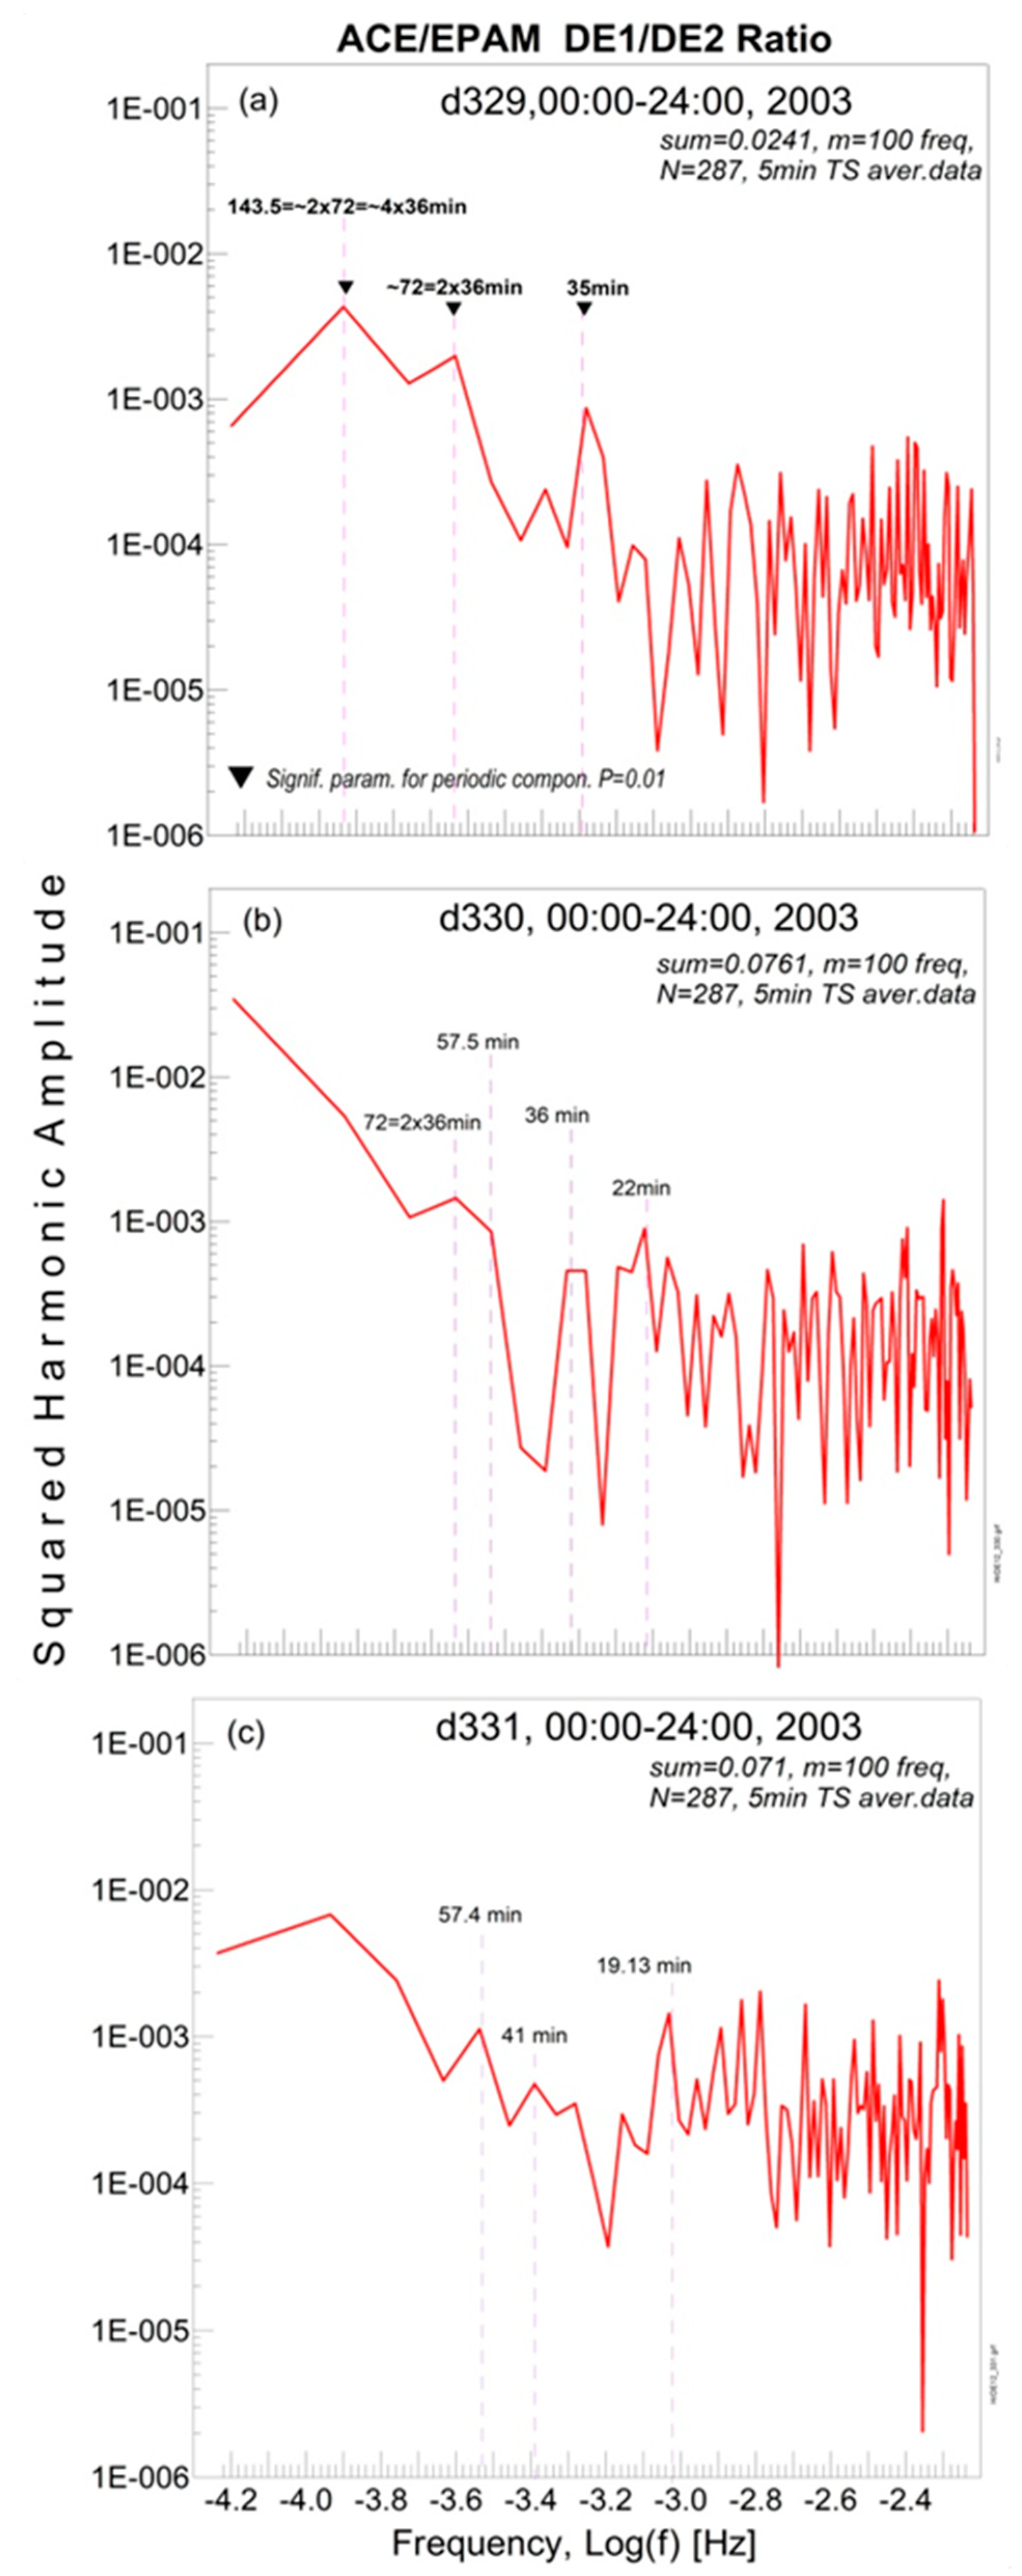
The QP-40 min and QP-15/20 min periodicities of the IMF and the electron spectrum were superimposed on QP-10/5 h variations as within and upstream from Jupiter.
(4)
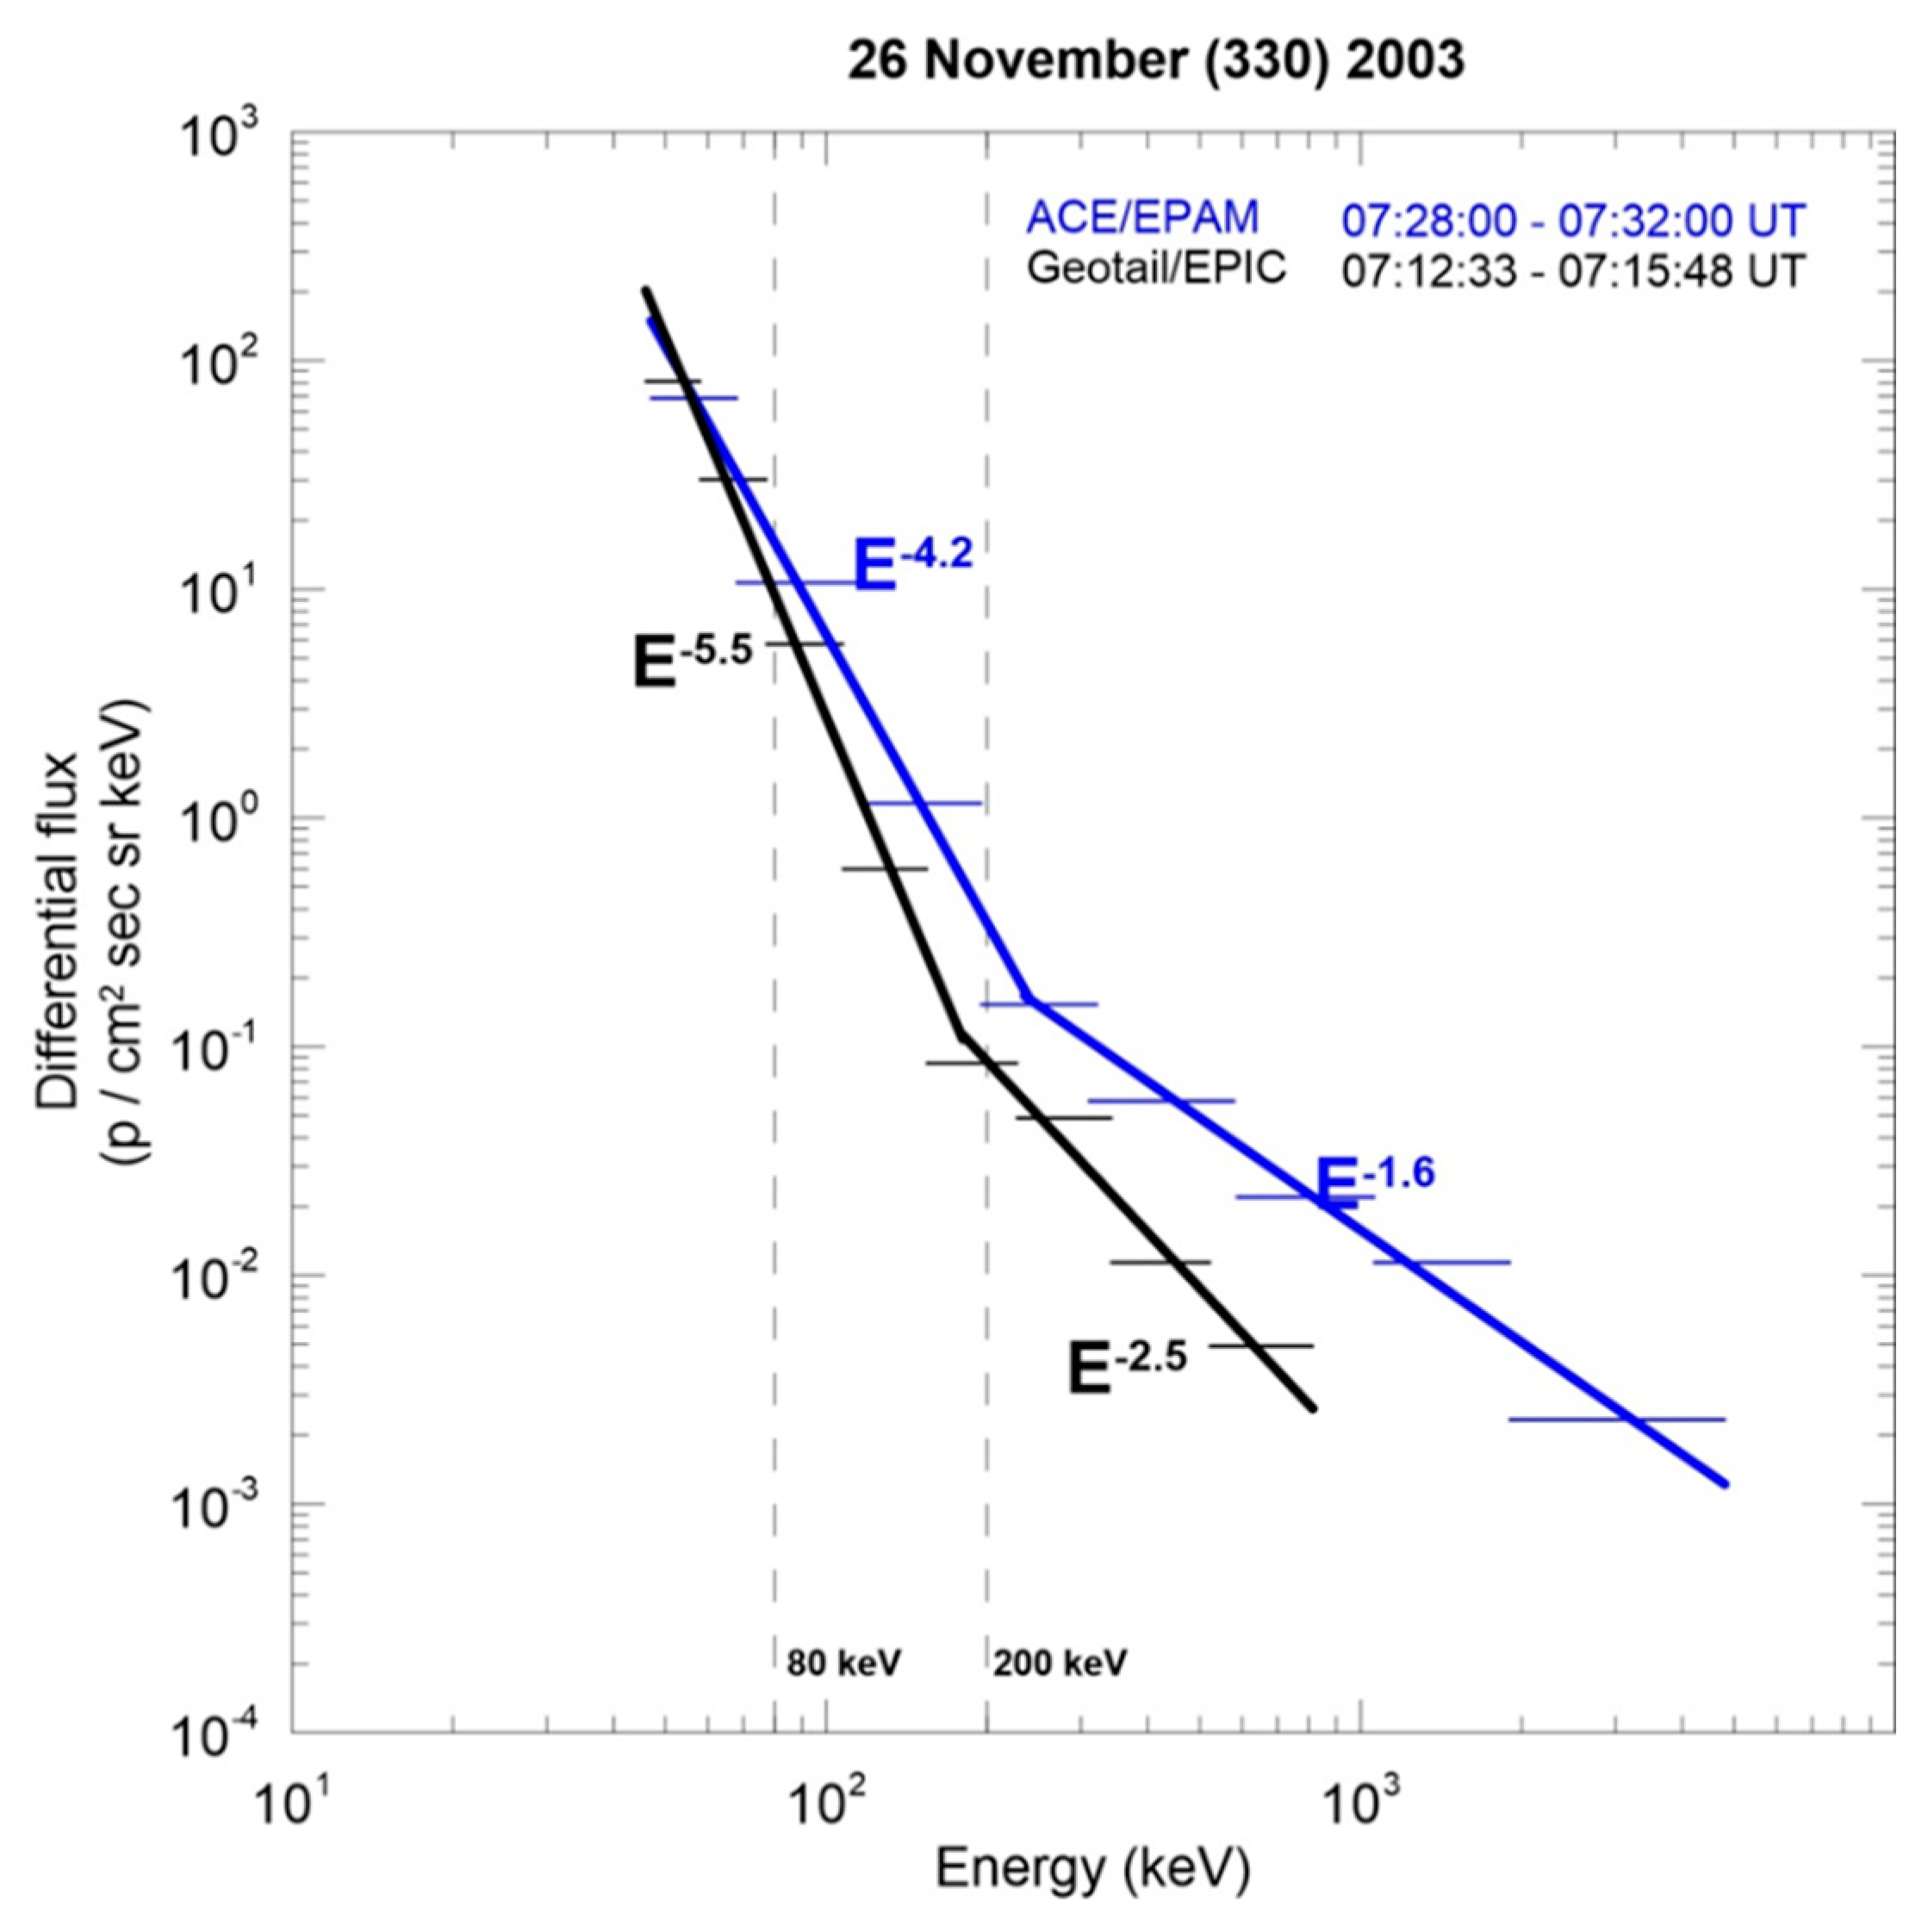
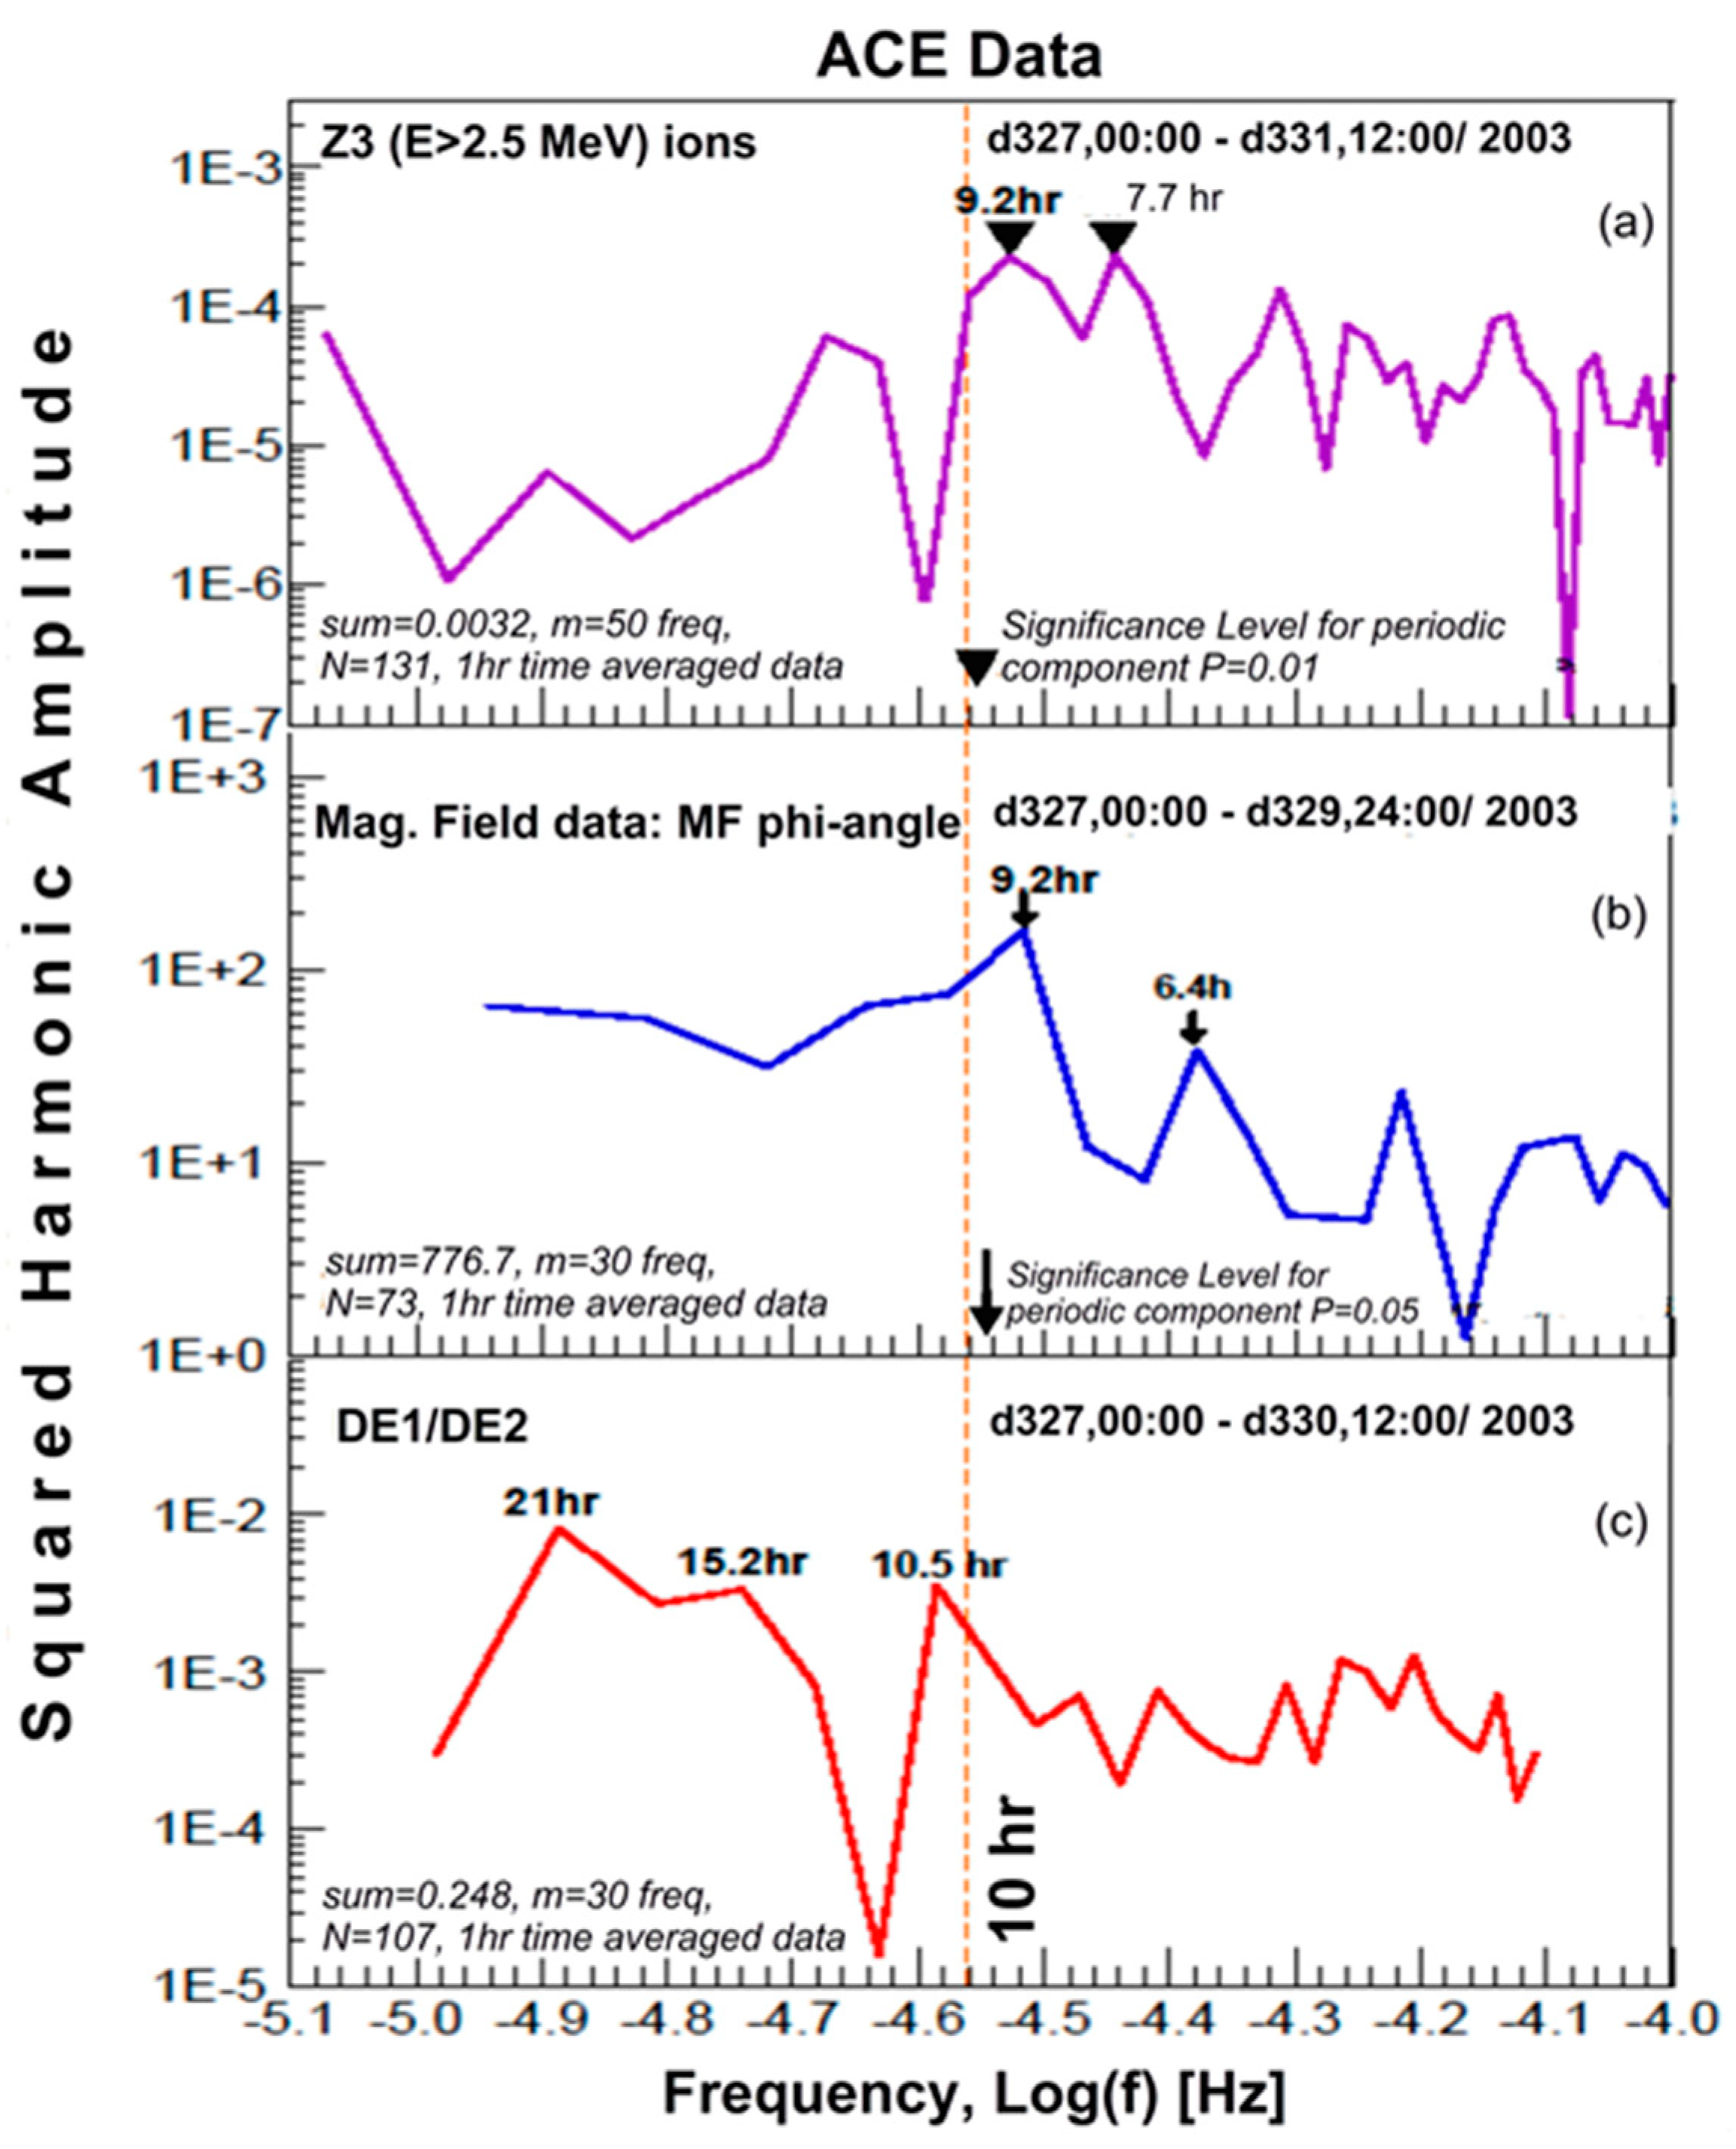
QP-10/5 h distinct low-energy (<0.05 MeV) ion (proton) bursts were observed by ACE with unusually high intensities and soft spectra (p/b ≅ 1.5 × 10² at 61–77 keV and spectral γ ≅ 4.2 between ~55–250 keV (Figure 8). QP-10/5 h variations were also found in high energy (~0.06–0.50 MeV) heavy (Z > 5) ion flux (Figure 3).
(5)
The QP-10/5 h EIBs were characterized by field-aligned ion streaming in the anti-sunward direction during the main phase of the events, and cross-field intensity gradients at the onset and the decay phase of the events suggesting a QP-10/5 h entrance of ACE in a (pre-existing) quasi-permanent large-scale sheet of particles.
(6)
The comparison of ion fluxes and spectra upstream from the down bow shock (Geotail) and at LPL1 (ACE) were found to be inconsistent with the major predictions of the first-order Fermi acceleration and the SDA mechanism as well as with leakage from the magnetosphere (ion data were compared with the angle θΒn, between the IMF and the normal to the bow shock vector n, the connection time of the field line with the bow shock tC, the velocity dispersion at the onset of events, PADs, indexes of geomagnetic activity etc).
(7)
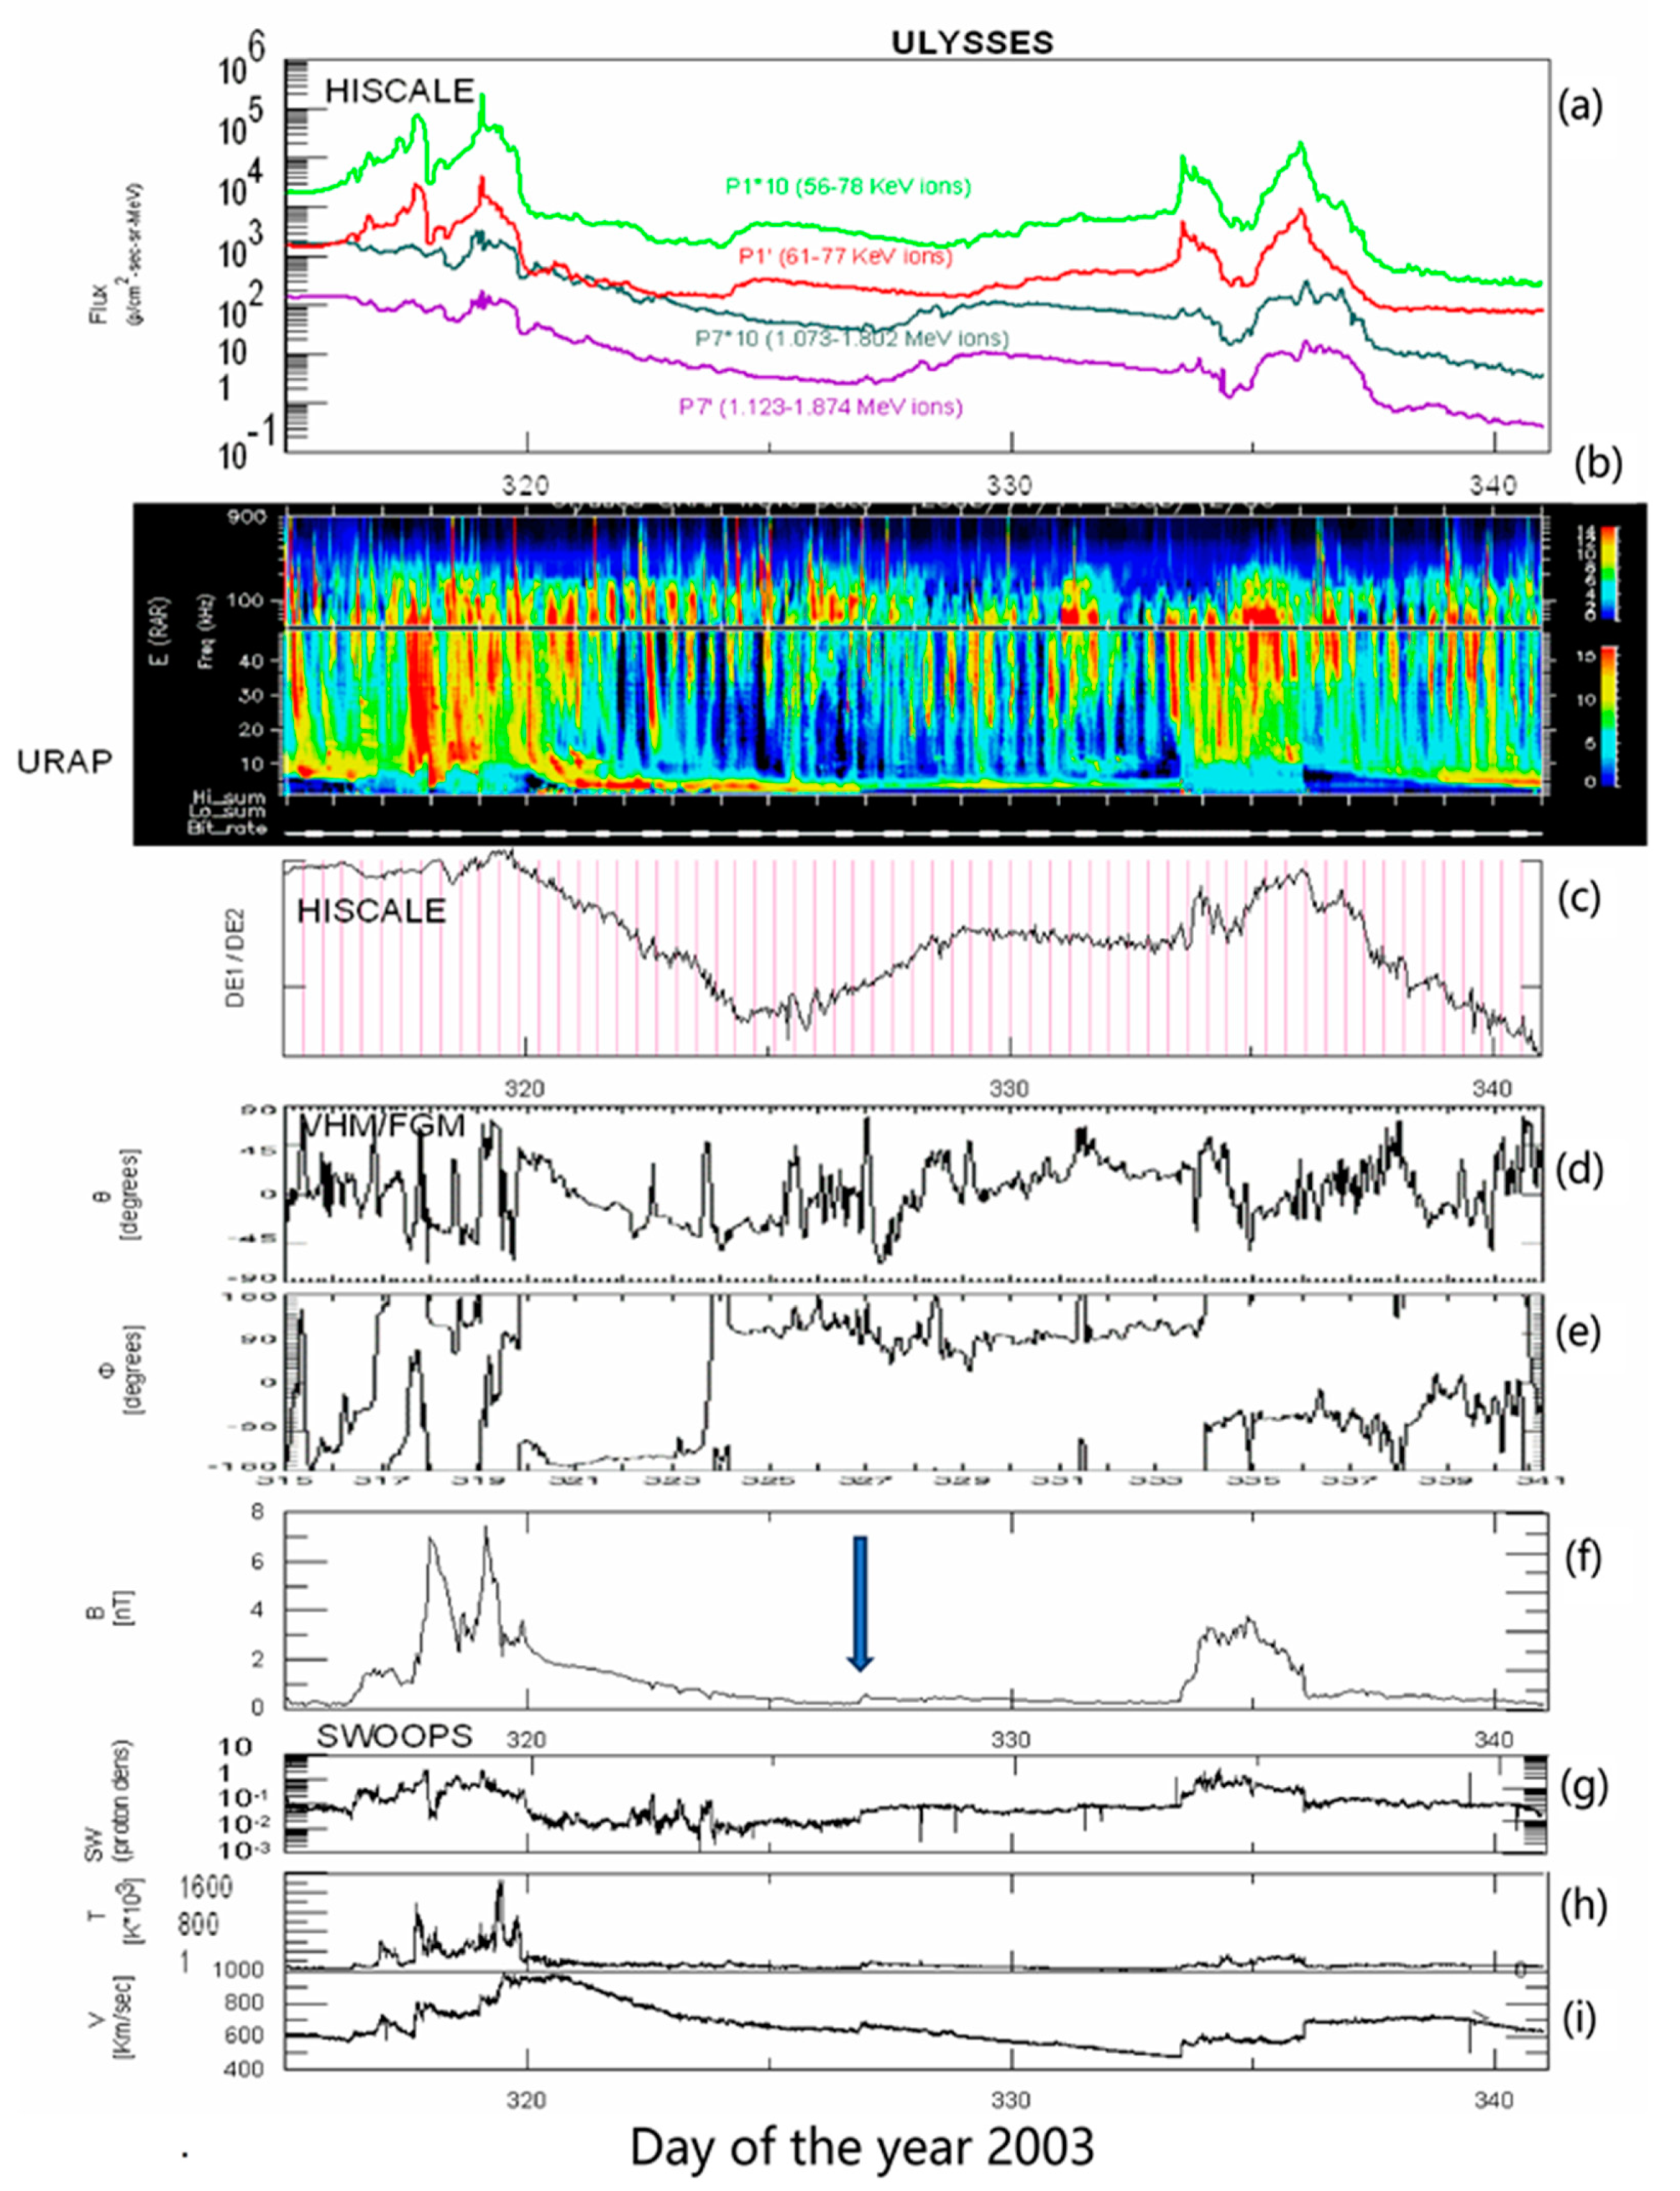
The QP-10/5 h, QP-40 min, QP-20 and QP-15 min periodicities in particle and magnetic field data at ACE were observed during a period of a highly disturbed Jovian magnetosphere, as inferred from distinct QP-10 h bKOM radio emissions observed by Ulysses during its distant encounter with Jupiter (Figure 13b).
(8)
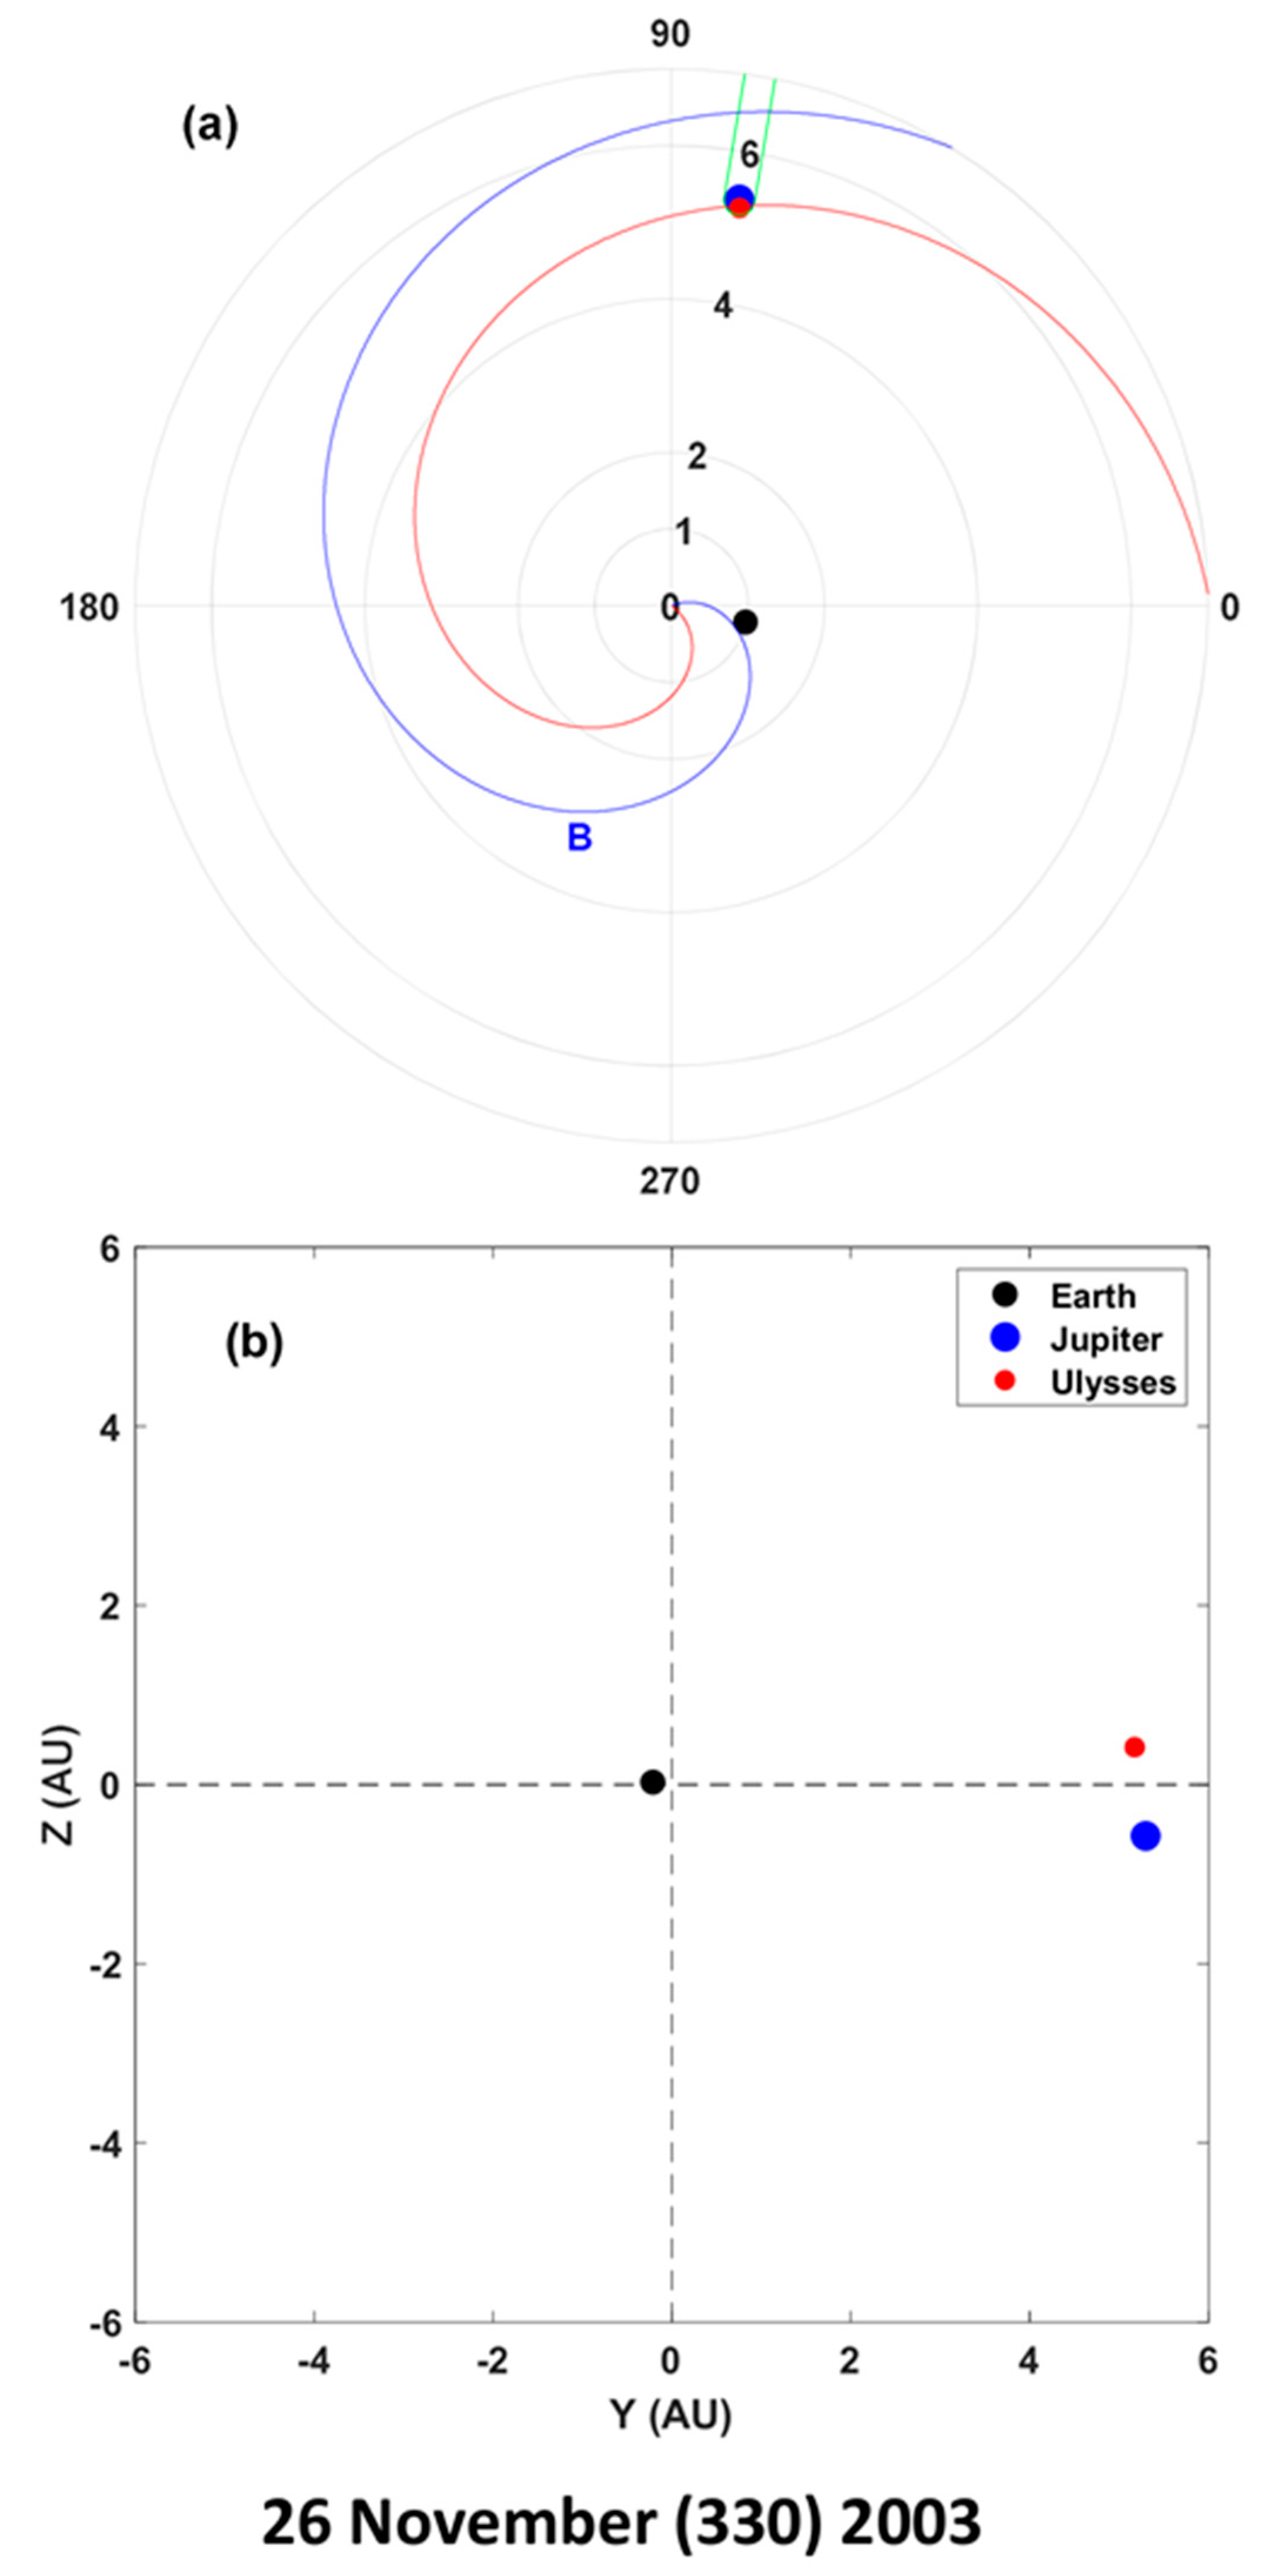
Simulation results of the IMF configuration suggest that there was magnetic field conjunction of Earth with Jupiter (Figure 14).

4.2. Upstream Energetic Electrons and Magnetic Waves at LPL1

The >~50 keV ion events observed upstream from the bow shock are often accompanied by the presence of energetic (>~50 keV) electrons, and a small (~20–40%) percentage of these upstream electron events are observable at larger distances [16,36]; at LPL1 they show an occurrence frequency as low as 24 events/~0.5 year [36]. Furthermore, the upstream energetic electrons are generally observed during strong geomagnetic activity (see Introduction).
The ACE observations showed an almost continuous energetic (~50–~500 keV) QP-40 min and QP-20/15 min electron spectral modulation at LPL1 during at least three days (25–27 November 2003), even though the magnetosphere was quiet (s. 5.1/Point #1). Therefore, this long time (3 days) electron signal cannot be explained as having been caused by magnetic storms and, consequently, it cannot be attributed to magnetospheric activity [7,8,13,14,15].
Figure 10 and Figure 12 reveal representative peaks (on November 30) in the electron spectral index DE1/DE2 at 36 min and 22 min. In the Bx component at almost the same period, that is at 37.3 min and 18.7/22.4 min, respectively. The energetic electrons (S. 5.1/Point #1) and the magnetic field wave show permanent periodicities at -40 min and ~15/20–15 min for three days (25–27 November). These findings reasonably suggest a physical relation of the magnetic field waves with QP-40 min and QP-15/20–15 min energetic (>40 keV) electrons. Since, under a quiet magnetosphere, energetic electrons cannot stream continuously for three days up to LPL1, generating ~40 min and ~15–20 min upstream magnetic field waves cannot be attributed to terrestrial magnetospheric processes. These findings suggest an extra-terrestrial origin for the QP-40 min and QP-15/20 min electron spectral modulation and magnetic field fluctuations.
Furthermore, the QP-10 h variation of Bx and DE1/DE2 (Figure 9b,c) most probably suggests a physical relation between the electron spectral spectrum modulation and the magnetic field waves at the period of ~10 h as well.
On the other hand, point #7 of Section 4.1 notes that on 25–27 November (329–331), 2003, Jupiter was highly disturbed by the passage of an interplanetary shock wave, as confirmed by Ulysses QP-10 h bKOM emissions observed at distances ~1.05 AU from Jupiter (S. 5.1/Point #7; Figure 13). In addition, simulation results of IMF configurations suggest that there was magnetic field conjunction of Earth and Jupiter (S. 5.1/Point #8; Figure 14). These conditions were appropriate for Jovian electrons to reach the Earth’s environment. Indeed, Jovian periodicities (QP-10 h and QP-40 min/QP-15/20–15 min) were observed in ACE energetic electron and magnetic field data, and they reasonably suggest that low-energy (~50–~500 keV) Jovian electrons have reached the Earth’s environment on 25–27 November 2003. We note that the ACE electron observations reveal for the first time a low energy limit of the near-Earth Jovian electron spectrum at ~50 keV, instead of 200 keV reported so far ([73] and references therein).

4.3. QP-10/5 h Upstream Energetic Ion Bursts at LPL1

4.3.1. Generating Physical Mechanism

We address the question about the strange ~10/5 h periodicity of the upstream ΕΙΒs on 25–27 November 2003. Which is the mechanism producing these quasi-periodic EIBs? Which is the origin of their ion population? These questions have been partially discussed in Section 3. Here we summarize the relative observational findings and extend the discussion on the above questions.
(a)
The series of QP-10 EIBs, with high intensities, were observed under conditions of a quiet magnetosphere (as inferred from the geomagnetic indexes and the absence of particle injections in the inner magnetosphere occurring during magnetic storms; Figure 3g and Figure 7c,d. Therefore, the detection of QP-10 h high-intensity EIBs on 25–27 November 2003 at LPL1 is inconsistent with the “leakage” model of magnetospheric ions [7,8,11,15,27].
(b)
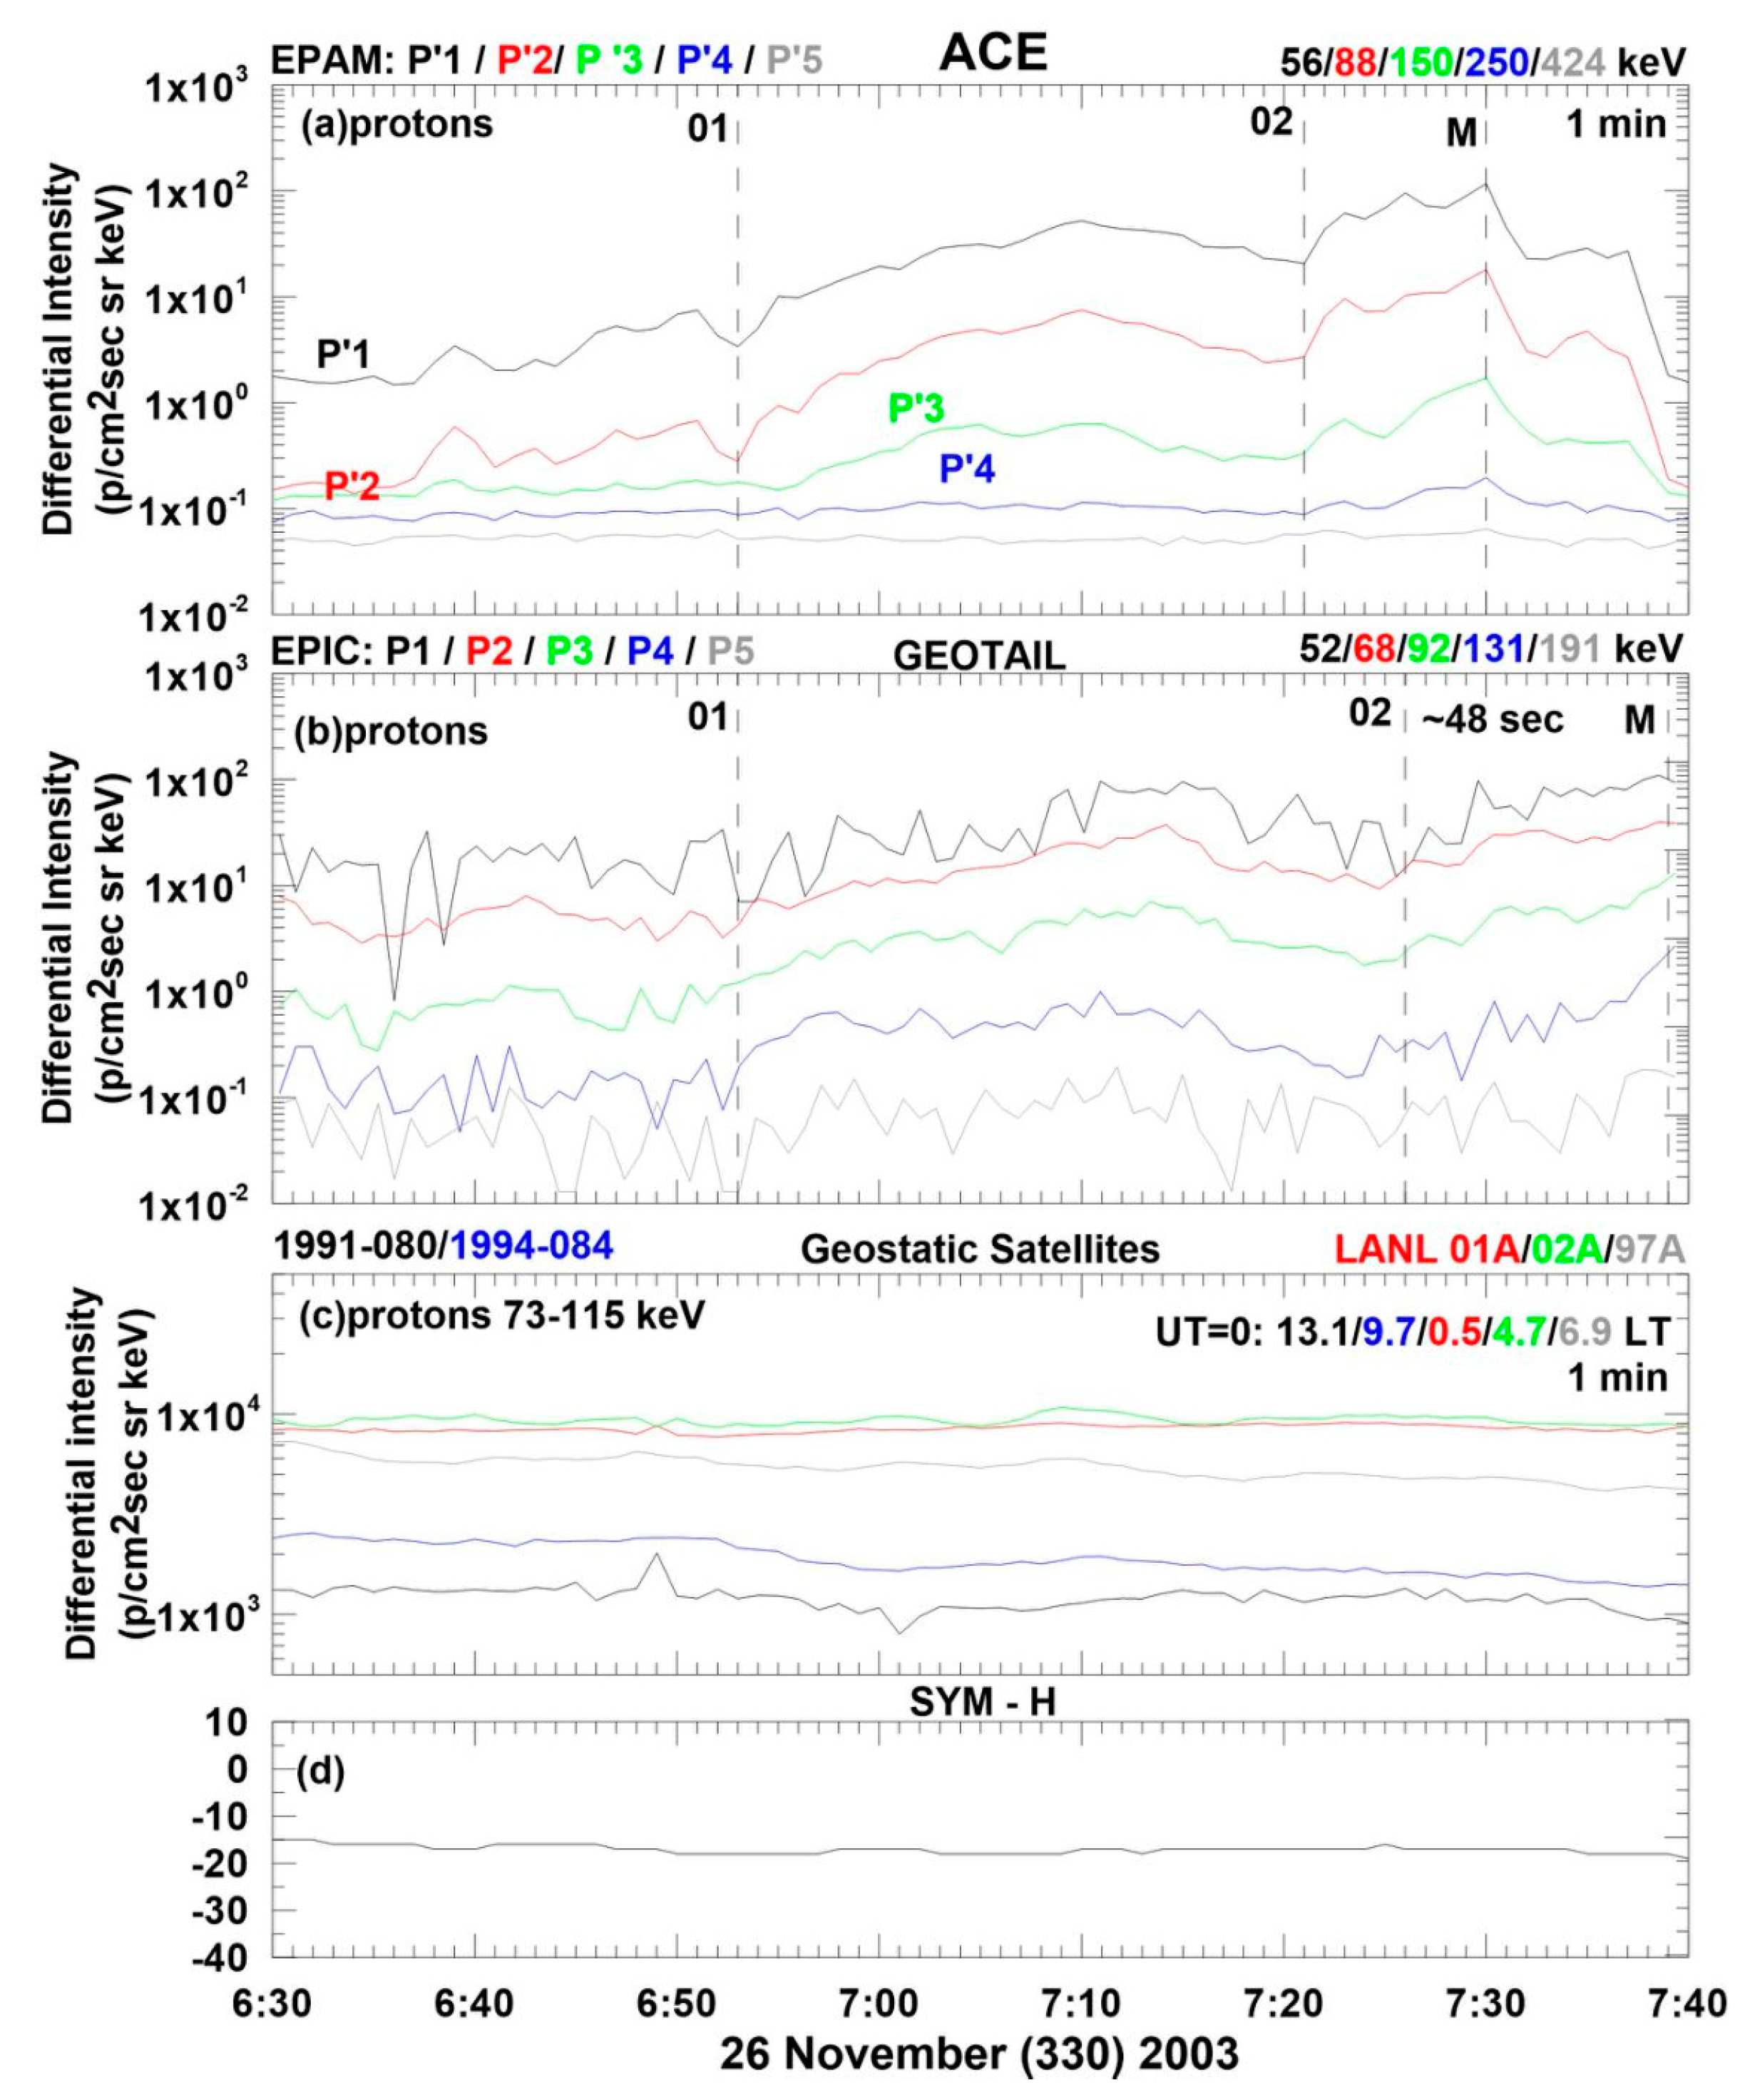
The comparison of simultaneously obtained Geotail and ACE measurements suggests the presence of a sheet of energetic particles with almost the same high ion intensity and soft spectral slope (γ ≅ 4.2; dj/dE~E−γ) in the whole region from the bow shock (Geotail) to the LPL1 (ACE). Such an upstream ion distribution is inconsistent with the intensity gradient in the direction from the upstream region toward the Earth’s bow shock, which is a well-confirmed feature of upstream energetic ions escaping from the bow shock front produced by either shock acceleration or by leakage from the magnetosphere) [4,7,14,20,31]. Moreover, the high ion intensity in some cases was found to be higher ACE than at Geotail (Figure 8). This finding is inconsistent with all previous reports on the spatial distribution of upstream energetic ions [20,27,36].
(c)
During the main phase of the EIBs, the PADs show a field-aligned ion anisotropy suggesting a field-aligned streaming directed outward from the Sun. Such streaming, along with the above findings (a) and (b), strongly recommend an extra-terrestrial origin of the EIBs on November 27 (331), 2003.
(d)
SDA of the solar ambient >50 keV proton population, occurring at quasi-perpendicular (θBn > 45°) sites of the bow shock, show peak-to-background flux ratio ranging in values between p/b ≅ 2–5 [12,68]. Contrarily, the QP-10 h EIBs show a significantly high peak-to-background flux ratio (i.e., p/b ≅ 102) both close (Geotail) and far (ACE) from the bow shock. Therefore, the origin of EIBs on 25–27 November 2003 is inconsistent with the SDA of the solar ambient ion population.
(e)
First-order Fermi acceleration as applied at Earth’s bow shock is effective: (A) at quasi-parallel (θBn < 45°) bow shock structures, (B) under high values of the connection time tC and (C) in the presence of distinct inverse velocity dispersion at the onset phase of the upstream ion events (see Section 1, “Introduction). Detailed elaboration of representative Geotail data obtained close to the bow shock (ACE EIB #5) revealed that they were in contrast to the significant predictions (A–C) of the first-order Fermi acceleration mechanism [17,18,61].
(f)
The QP-10/5 h EIBs were observed during the presence of a fluctuating IMF (QP-40 min and QP-15–20 min periodicities superposed on ~5/10 h periodic variation), which suggests a variety of bow shock conditions during each event and throughout the whole period 25–27 November 2003.
(g)
No known physical process in the Earth’s magnetosphere or at the bow shock could produce quasi-steady strong streaming of energetic ions, which could be observed at LPL1 due to its ~10 h directional variation. Therefore, the QP-10 h appearance of EIBs on 25–27 November 2003 raises severe problems attributing a terrestrial (magnetospheric or bow shock) physical process as responsible for the QP-10/5 h EIBs at LPLl.
We infer that there are many observational features on 25–27 November (329–331), 2003, inconsistent with a terrestrial physical process of the ACE QP-10 h EIBs being their generating cause.
It is reasonable, therefore, to examine whether the QP-10/5 h EIBs are related to an extra-terrestrial source. Jupiter is a candidate cause of the QP-10/5 h EIBs, because of the appropriate conditions in the Jovian magnetosphere, the IMF configuration and the positions of Earth and Jupiter (S. 5.1; Points 7 and 8) on 25–27 November (329–331), 2003. A generating mechanism of the ~10/5 h periodicity in detecting ACE EIBs under a ~10/5 h varying IMF direction at those times.
The ~10/5 h quasi-periodic approach of a large-scale sheet of ions to ACE due to the strong ~10/5 h period wavy activity of the IMF direction could explain the observations. The absence of any velocity dispersion (Figure 6 and Figure 7) along with the cross-field intensity gradients (S5.1, Point #5) observed at the onset/decay phase of the QP-10/5 h EIBs can also be well explained by assuming the existence of a large-scale long-lasting sheet of particles, which approach quasi-periodically the position of the ACE satellite every ~10/5 h. We infer that the observation of the QP-10/5 h EIBs is consistent with a spatial (and not a temporal) effect as their generating mechanism. We also hypothesize that the ~10/5 h IMF wavy activity is caused by the Jovian QP-10/5 h (quasi-)relativistic electron streaming, evident in the ~10 h electron spectral modulation.

4.3.2. On the Origin of the Ion Population Giving Rise to the QP-10/5 h EIBs at LPL1

Although we can reasonably hypothesize an electron streaming from Jupiter to Earth’s environment, under the special conditions of 25–27 November (329–331), 2003 (S. 5.2) and the formation of the QP-10/5 h EIBs, due to a QP-10/5 h approach of an EP sheet to Earth’s environment (S. 5.31), there is still a question about the population giving rise to the QP-10/5 h EIBs. Since the travel time of ~50 keV protons from Jupiter to Earth is in the order of one day, it seems hard to understand that sharp bursts of energetic ions of Jovian origin can be detected at Earth with ~10 h periodicities, even if scatter-free propagation is assumed, since the arrival time dependent on the pitch angle of particles, alone is capable of spreading the short-term variation of the particle fluxes.
Therefore, we face the question: Which is the source of the ion population observed in the impressive strong and abrupt QP-10/5 h energetic (<~0.05 MeV) ion bursts at LPL1? Might the particle population during the QP-10/5 h EIBs at LPL1 be of a solar or terrestrial origin? Or might it be of a Jovian origin?
We have already inferred from a comparison of simultaneous ACE and Geotail observations that the QP-10/5 h EIBs were of an extra-terrestrial origin. Also, significant observational evidence suggests that the QP-10/5 h EIBs were not of solar origin. For instance, the QP-10/5 h EIBs were observed during a reduced ion intensity background at the decay of the 2003 Halloween events. However, a shock acceleration process, if in progress, would produce intense effects during the times of the enhanced solar ion fluxes [17,23,69] of the 2003 Halloween events and not during times of a drop in solar ion background. Therefore, we examine whether the QP-10/5 h EIBs on 25–27 November (329–331), 2003, could result from ~10 h period wavy large-scale long-lasting sheet of Jovian ions.
We saw that on 13–15 November 2003, Ulysses observed a CIR forward and an accompanying reverse shock, which was the most intense ones observed for 140 days (d. 230–370, 2003, [50]; Figure 2); these shocks triggered the most intense bKOM emission observed by Ulysses between d. 260–360, 2003 [53].
Later, on 24–28 November (d. 328–332) 2003, the Jovian magnetosphere was also very active due to an IP shock wave passed by Ulysses at the beginning of day 23 November (Figure 13).
Finally, after the detection of Jovian periodicities by ACE on 25–27 November 2003, a CIR event approached both Earth and Jupiter/Ulysses ([50] on November 28–30 (332–334) 2003. (Figure 3 and Figure 13, [50]; Figure 2).
During most of the period 315–341, 2003, the Jovian magnetosphere emitted intense bKOM radiation and energetic particles (Figure 13), which reasonably fulfilled many Heliospheric longitudes.
Another important finding is the anti-correlation between the ACE/EPAM field-aligned ion anisotropy A// and the ion energy E during the main phase of the QP-10/5 h EIBs: the lower energy ions (~60 – ~200 keV) showed strong field-aligned beams. In comparison, the higher energy (>~200 keV) showed broader PADs (Figure 5). We hypothesize that the differentiation in PADs of the detected EIBs on 25–27 November (329–331), 2003, may be due to particle shock drift acceleration to the approaching CIR (Figure 3 and Figure 13, [50]; Figure 2), but further investigation on this issue.
The difference in the PADs of ions of various energies may be explained in terms of a combination of shock drift acceleration at the approaching quasi-perpendicular CIR-related forward shock, wave-particle interaction upstream from the shock and probably different propagation rοutes of various energy ions reaching the spacecraft. It is possible that the low-energy ions were streaming scatter-free after their SDA and reflection at the CIR-related forward shock. In contrast, the higher energy ions presented a broader pitch angle because of wave–particle interaction at low frequency (<~1 mHz) IMF waves. Finally, it could also be hypothesized that solar ambient energetic ions might have made some minor contribution due to the remaining SEP population at the end of the Halloween SEP events (Figure 2 and Figure 3).

5. Conclusions

In this paper, we present, for the first time, fine-time resolution (1–5 min) multispacecraft energetic ion, electron, and magnetic field observations, which reveal the presence of Jovian periodicities upstream from the Earth’s bow shock. The most impressive results are the findings of (i) a series of quasi-periodic sharp and strong energetic (~0.06–~0.05 MeV) ion bursts separated by ~10 h, which is the rotation period of Jupiter, and (b) the presence of low- energy (~50–~500 keV) electrons and wavy IMF directional variations with the Jovian ~10/5 h, -40 min and ~15/20 min periodicities.
The above Jovian periodicities were observed by ACE at the LPL1 after the well-known 2003 Halloween events. ACE detected Jovian periodicities on 25–27 November (329–331), 2003, while (a) Ulysses recorded very strong QP-10 h bKOM emissions suggesting a highly disturbed Jovian magnetosphere after the passage of an interplanetary shock wave passage, and (b) the Earth’s and Jupiter’s environments were magnetically connected. The above planetary activity and the interplanetary IMF configuration allow the hypothesis that Jovian energetic electron emissions have reached the Earth’s environment. Indeed, the ACE satellite observed electron and magnetic field QP-10/5 h, QP-40 min and QP-15/20 data variations at LPL1. Therefore, the whole set of observations reasonably supports the concept that low-energy (~50–~300 keV) Jovian electrons reached the Earth’s environment in the interval examined between 25–27 November 2003. We point out that the observations presented in this paper extend the low-energy limit of the Jovian electron spectrum reported in previous studies from 200 keV [73] to 50 keV.
Furthermore, the series of QP-10/5 h ion bursts observed on 25–27 November 2003 is a spatial effect caused by the ~10/5 h quasi-periodic variation of the IMF direction. The source of the ion population forming the QP-10/5 h sharp ion bursts may be Jovian ions emitted in the IP space and probably accelerated at the CIR forward shock that reached ACE at the beginning of d. 333 November 2003 (Figure 3, [50]; Figure 2).
The novel observations on 25–27 November 2003 should be attributed to the special conditions of the highly disturbed Jovian magnetosphere emitting a large amount of electrons/ions and the interplanetary IMF configuration, which facilitated the route of the Jovian electrons up to the Earth’s environment.
The present paper is a continuation of a previous one, which presented Ulysses’ observations with ~10 h and ~40/~15–20 min periodicities in magnetic field and energetic particle data at distances 0.8–1.2 AU from Jupiter [51]. In the present paper, we have shown that under some special conditions on 25–27 November 2003, the same periodicities were observed in the inner heliosphere, particularly the Earth’s environment.
It has been pointed out by several scientists that by using Jovian electrons to remote sense magnetic connectivity with Jupiter’s magnetosphere, we may validate solar wind models and cosmic ray spectrum between 1 and 5 AU, even when suitable in situ observations are not available [45,73,74,75]. Further studies around the time interval examined here (25–27 November 2003) could provide insight into heliospheric magnetic topology and wave—particle interaction during an extraordinary period revealing evidence of Jovian influence on the EIBs upstream from the Earth’s bow shock.

Author Contributions

Conceptualization, methodology, supervision, validation, investigation, writing—review, editing by G.C.A.; data curation, software, investigation, and visualization by P.K.M. and E.V.; writing—original draft preparation by G.C.A., P.K.M., E.V. and E.T.S. All authors have read and agreed to the published version of the manuscript.

Funding

This research received no external funding.

Data Availability Statement

The availability of many kinds of data used in this study can be found at the site where they are mentioned in Section 2. Instrumentation and Data.

Acknowledgments

The authors thank L. Lanzerotti and C. W. Smith for providing the ACE energetic particle and magnetic field data. We also thank D. Williams and S. Kokubun for providing the Geotail energetic particle and magnetic field measurements and R. MacDowall, L. Lanzerotti and A. Balogh for the Ulysses radio, energetic particle, and magnetic field measurements.

Conflicts of Interest

The authors declare no conflict of interest.

Appendix A

Based on the studies [75,76,77,78,79], we applied the “harmonic analysis” (HA) technique to evaluate the periodicity of the signals and their significance. In particular, the TSI statistical test evaluates the significance level of the amplitudes at p = 0.01 or p = 0.05. The typical Fourier transform is still a field of continuous research, mostly concerning Fourier transformation on various problems.
More particularly, a time-series xt, t = 1, 2, …, n can be expressed as a sum of “harmonic” terms (or components) by the following relation:
x t = a 0 2 + k = 1 m a k cos 2 π k t n + b k sin 2 π k t n
where in n = 2m + 1, and the values of the constants a0, ak, bk are calculated by the subsequent equations:
a 0 = 2 n t = 1 n x t
a k = 2 n t = 1 n x t cos 2 π k t n
b k = 2 n t = 1 n x t sin 2 π k t n , k = 1 , 2 , , m
Thus, the squared harmonic amplitude is calculated by the following relation:
c k 2 = a k 2 + b k 2
One of the foremost advantages of the HA technique is its ability to evaluate the level of the statistical significance of its outcomes by applying specific significance tests. Although there are no periodic (or harmonic) components in a random time series consisting of n = 2m + 1 values (or points), several of the m amplitudes derived by the harmonic analysis will be higher than others due to random fluctuation. Hence, we can use various significance tests to determine whether a specific harmonic amplitude illustrates a real periodicity.
The normalized values of the aforementioned quantities ak, bk and ck are given by the following equations:
g k = c k 2 j = 1 m c j 2
where:
j = 1 m c j 2 = 2 n t = 1 n x t a 0 2 2
These normalized quantities can be arranged in decreasing order to be the newly arranged values. Let g ¯ 1 be the largest term of this rearranged sequence. Thus, g ¯ 1 is the largest term of the quantities g k .
According to Fisher’s study [75] the probability P that g ¯ 1 exceeds a parameter g is given by the next relation:
P = m ( 1 g ) m 1 m 2 ( 1 2 g ) m 1 + + ( 1 ) L 1 m L ( 1 L g ) m 1
where L is the largest integer less than 1/g.
This equation expresses g as a function of P and m. It constitutes the basis of the table in the work by Nowroozi’s [76], which is used in the tests that evaluate the statistical-significance level.
Ref. [77] showed the probability Pr that the quantity g ¯ r is greater than the parameter g is given by the subsequent relation:
P r = m ! ( r 1 ) ! j = r L ( 1 ) j r 1 j g m 1 j ( m j ) ! ( j r ) !
where as previously referred, L = [1/g] i.e., the largest integer less than 1/g.
Fisher’s test determines the probability that the largest of the amplitudes Ck (k = 1, 2, …, m) depicted in a normalized form in association with the data is the result of the randomness of the data. Moreover, [76], the test application rejects, at a certain level of significance, every amplitude below such a theoretical value, not considering that the test refers only to the largest amplitude. Finally, Shimshoni [78] expanded the studies of [76,77,78] and produced handy matrices for illustrating the significance levels (g values) of the periodicities (i.e., the periodic components). Thus, he suggested a significance test according to which before deciding which spectral amplitudes are statistically significant, we must rearrange them in decreasing order so that g ¯ r will be the r-th greatest normalized amplitude of those available.
Hence, each g ¯ r , larger than the specific value g of the table that presents the significance levels, is statistically important.
The tables with the significance parameters discussed by Shimshoni provide the g values for the statistical levels p = 0.01 and p = 0.05 for two cases: (a) m = 5(5)50 (i.e., m takes values from 5 to 50 with a step of 5) and r = 1, 2, 5, 7, 10 and (b) m = 100(100)3000 and r = 1, 2, 5, 10, 25, 50 [78]. Since the values of g vary relatively smoothly, it is allowable to use linear interpolation for intermediate values of m and r to determine the values of g which are not tabulated. Marhavilas et al. depict in their study (Table 1 and Table 2) the significance levels, with a statistical error of p = 0.01 and p = 0.05, respectively, for the first ri periodic components of a data time series which is completely expressed in a Fourier superposition by a set of m periodic components: (a) m = 5(5)50, and ri = 1–10 (with step 1) and (b) m = 100(100)1000 and ri = 1–50 (with step 1) [79].

References

  1. Marhavilas, P.K.; Sarris, E.T.; Anagnostopoulos, G.C. Observations of shock acceleration signatures by Ulysses: The 04:08:16, day 147, 1991 UT shock. J. Atmos. Sol. Terr. Phys. 2002, 64, 527–533. [Google Scholar] [CrossRef]
  2. Desai, M.; Giacalone, J. Large gradual solar energetic particle events. Living Rev. Sol. Phys. 2016, 13, 3. [Google Scholar] [CrossRef] [PubMed]
  3. Anagnostopoulos, G.C.; Tenentes, V.; Vassiliadis, E.S. The Quasi-Perpendicular Bow Shock as a Temporal Trapping Bar-rier and Accelerator of Magnetospheric Particles. IEEE Trans. Plasma Sci. 2008, 36, 542–553. [Google Scholar] [CrossRef]
  4. Keika, K.; Nosé, M.; Christon, S.P.; McEntire, R.W. Acceleration sites of energetic ions upstream of the Earth’s bow shock and in the magnetosheath: Statistical study on charge states of heavy ions. J. Geophys. Res. 2004, 109, A11104. [Google Scholar] [CrossRef]
  5. Christon, S.P.; Desai, M.I.; Eastman, T.E.; Gloeckler, G.; Kokubun, S.; Lui, A.T.Y.; McEntire, R.W.; Roelof, E.C.; Williams, D.J. Low-Charge-State Heavy Ions Upstream of Earth’s Bow Shock and Sunward Flux of Ionospheric O +1, N +1, and 0 +2 Ions: Geotail Observations. Geophys. Res. Lett. 2000, 27, 2433–2436. [Google Scholar] [CrossRef]
  6. Anagnostopoulos, G.C.; Paschalidis, N.; Littas, A.N. Energy time dispersion of a new class of magnetospheric ion events observed near the Earth’s bow shock. Ann. Geophysicae 2000, 18, 2–41. [Google Scholar] [CrossRef]
  7. Anagnostopoulos, G.C.; Kaliabetsos, G.; Argyropoulos, G.; Sarris, E.T. High energy ions and electrons upstream from the Earth’s bow shock and their dependence on geomagnetic conditions: Statistical results between years 1982–1988. Geophys. Res. Lett. 1999, 26, 2151–2154. [Google Scholar] [CrossRef]
  8. Anagnostopoulos, G.C.; Rigas, A.G.; Sarris, E.T.; Krimigis, S.M. Characteristics of upstream energetic (E ≥ 50 keV) ion events during intense geomagnetic activity. J. Geophys. Res. 1998, 103, 9521–9533. [Google Scholar] [CrossRef]
  9. Anagnostopoulos, G.C.; Sarris, E.T.; Krimigis, S.M. On the Origin of the Forward Velocity Dispersion of Ion Events Observed Near the Earth’s and Jupiter’s Bow Shock. Adv. Space Res. 1995, 16, 149–152. [Google Scholar] [CrossRef]
  10. Kudela, K.; Sibeck, D.G.; Belian, R.D.; Fischer, S.; Lutsenko, V. Possible leakage of energetic particles from the magnetosphere into the upstream region on 7 June 1985. J. Geophys. Res. 1992, 95, 20825. [Google Scholar] [CrossRef]
  11. Sibeck, D.G.; McEntire, R.W.; Krimigis, S.M.; Baker, D.N. The magnetosphere as a sufficient source for upsream ions on 1 November 1984. J. Geophys. Res. 1988, 99, 14328. [Google Scholar] [CrossRef]
  12. Anagnostopoulos, G.C.; Sarris, E.T.; Krimigis, S.M. Observational Test of Shock Drift and Fermi Acceleration on a Seed Particle Population Upstream of Earth’s Bow Shock. J. Geophys. Res. 1988, 93, 5541–5546. [Google Scholar] [CrossRef]
  13. Anagnostopoulos, G.C.; Sarris, E.T.; Krimigis, S.M. Magnetospheric origin of energetic (E ≥ 50 KeV) ions upstream of the bow shock: The 31 October 1977 event. J. Geophys. Res. 1986, 91, 3020–3028. [Google Scholar] [CrossRef]
  14. Sarris, E.T.; Krimigis, S.M.; Bostrom, C.O.; Armstrong, T.P. Simultaneous multispacecraft observations of ener-getic proton bursts inside and outside the magnetosphere. J. Geophys. Res. 1978, 83, 4289. [Google Scholar] [CrossRef]
  15. Anagnostopoulos, G.C.; Efthymiadis, D.; Sarris, E.T.; Krimigis, S.M. Evidence and features of magnetospheric particle leakage on days 30–36, 1995: Wind, Geotail, and IMP 8 observations compared. J. Geophys. Res. Space Phys. 2005, 110, A10203. [Google Scholar] [CrossRef]
  16. Kronberg, E.A.; Bučík, R.; Haaland, S.; Klecker, B.; Keika, K.; Desai, M.I.; Daly, P.W.; Yamauchi, M.; Gómez-Herrero, R.; Lui, A.T.Y. On the origin of the energetic ion events measured upstream of the Earth’s bow shock by STEREO, Clus-ter, and Geotail. J. Geophys. Res. 2011, 116, A02210. [Google Scholar] [CrossRef]
  17. Sarris, E.T.; Van Allen, J.A. Effects of interplanetary shock waves on energetic charged particles. J. Geophys. Res. 1974, 79, 4157. [Google Scholar] [CrossRef]
  18. Decker, R.B. Formation of shock-spike events at quasiperpendicular shocks. J. Geophys. Res. 1983, 88, 9959. [Google Scholar] [CrossRef]
  19. Scholer, M.; Ipavich, F.; Gloeckler, G.; Hovestadt, D. Conditions for acceleration of energetic ions ≳30 keV associ-ated with the Earth’s bow shock. J. Geophys. Res. 1980, 85, 4602–4606. [Google Scholar] [CrossRef]
  20. Mitchell, D.G.; Roelof, E.C. Dependence of 50-keV upstream ion events at IMP 7 and 8 upon magnetic field bow shock geometry. J. Geophys. Res. 1983, 88, 5623–5634. [Google Scholar] [CrossRef]
  21. Ipavich, F.M.; Galvin, A.B.; Gloeckler, G.; Scholer, M.; Hovestadt, D. A statistical survey of ions observed upstream of the Earth’s bow shock: Energy spectra, composition, and spatial variation. J. Geophys. Res. 1981, 86, 4337–4342. [Google Scholar] [CrossRef]
  22. Wibberenz, G.; Zoellich, F.; Fischer, H.M.; Keppler, E. Dynamics of intense upstream ion events. J. Geophys. Res. 1985, 90, 283–301. [Google Scholar] [CrossRef]
  23. Ellison, D.C. Comment on “Magnetospheric origin of energetic (E ≥ 50 keV) ions upstream of the bow shock: The October 31, 1977, event” by G.C. Anagnostopoulos, E.T. Sarris, and S.M. Krimigis. J. Geophys. Res. 1987, 92, 12458–12460. [Google Scholar] [CrossRef]
  24. Skadron, G.; Lee, M.A. Temporal development of diffuse ion events upstream of the Earth’s bow shock: The October 31, 1977, event. J. Geophys. Res. 1983, 88, 9975. [Google Scholar] [CrossRef]
  25. Lee, M.A. Coupled hydromagnetic wave excitation and ion acceleration upstream of the Earth’s bow shock. J. Geophys. Res. 1982, 87, 5063–5080. [Google Scholar] [CrossRef]
  26. Ipavich, F.M.; Scholer, M.; Gloeckler, G. Temporal development of composition, spectra, and anisotropies during upstream particle events. J. Geophys. Res. 1981, 86, 11153. [Google Scholar] [CrossRef]
  27. Scholer, M.; Hovestadt, D.; Ipavich, F.M.; Gloeckler, G. Upstream energetic ions and electrons: Bow shock-associated or magnetospheric origin? J. Geophys. Res. 1981, 86, 9040–9046. [Google Scholar] [CrossRef]
  28. Desai, M.I.; Mason, G.M.; Dwyer, J.R.; Mazur, J.E.; von Rosenvinge, T.T.; Lepping, R.P. Characteristics of energetic (30 keV/nucleon) ions observed by the Wind/STEP instrument upstream of the Earth’s bow shock. J. Geophys. Res. 2000, 105, 61–78. [Google Scholar] [CrossRef]
  29. Posner, A.; Sohwadron, N.A.; Zurbuchen, T.H.; Kozyra, J.U.; Liemohn, M.W.; Gloeckler, G. Association of low-charge-state theory ions up to 200 Re upstream of the Earth’s bow shock with geomagnetic disturbances. Geophys. Res. Lett. 2002, 29, 1099. [Google Scholar] [CrossRef]
  30. Klassen, A.; Gómez-Herrero, R.; Müller-Mellin, R.; Böttcher, S.; Heber, B.; Wimmer-Schweingruber, R.; Mason, G.M. STE-REO/SEPT observations of upstream particle events: Almost monoenergetic ion beams. Annal. Geoph. 2009, 27, 2077–2085. [Google Scholar] [CrossRef]
  31. Karanikola, I.; Anagnostopoulos, G.C.; Rigas, A. Characteristics of ≥290 keV magnetosheath ions. Ann. Geophys. 1999, 17, 650–658. [Google Scholar] [CrossRef]
  32. Paschalidis, N.P.; Sarris, E.T.; Krimigis, S.M.; McEntire, R.W.; Levine, M.D.; Daglis, I.A.; Anagnostopoulos, G.C. Energetic Ion Distributions on both sides of the Earth’s Magnetopause. J. Geophys. Res. 1994, 99, 8687–8703. [Google Scholar] [CrossRef]
  33. Anagnostopoulos, G.C.; Vassiliadis, E.S.; Karanikola, I. Dawn-dusk asymmetry in spatial distribution and origin of energetic ion events upstream the Earth’s bow shock. Planet. Space Sci. 2005, 53, 53–58. [Google Scholar] [CrossRef]
  34. Vassiliadis, E.; Anagnostopoulos, G. The onset phase of upstream energetic (>25 KEV) ion events: Interball-1/DOK-2 ob-servations. Adv. Space Res. 2003, 31, 1463–1471. [Google Scholar] [CrossRef]
  35. Sanderson, T.R.; Reinhard, R.; Wenzel, K.-P.; Roelof, E.C.; Smith, E.J. Observations of upstream ions and low-frequency waves on ISEE 3. J. Geophys. Res. 1983, 88, 85–95. [Google Scholar] [CrossRef]
  36. Maragkakis, M.G.; Anagnostopoulos, G.C.; Vassiliadis, E.S. Upstream ion events with hard energy spectra: Lessons for their origin from a comparative statistical study (ACE/Geotail). Planet. Space Sci. 2013, 85, 1–12. [Google Scholar] [CrossRef]
  37. Haggerty, D.K.; Desai, M.I.; Mason, G.M.; Dwyer, J.R.; Gold, R.E.; Krimigis, S.M.; Mazur, J.E.; Von Rosenvinge, T.T. Simultaneous observations of energetic (∼150 keV) protons upstream of the Earth’s bow shock at ACE and WIND. Geophys. Res. Lett. 1999, 26, 169–172. [Google Scholar] [CrossRef]
  38. Mason, G.M.; Dwyer, J.R.; Mazur, J.E. New properties of 3He-rich solar flares deduced from low-energy particle spectra. Astrophys. J. 2000, 545, L157–L160. [Google Scholar] [CrossRef]
  39. Gurnett, D.A.; Kurth, W.S.; Hospodarsky, G.B.; Persoon, A.M.; Zarka, P.; Lecacheux, A.; Bolton, S.J.; Desch, M.D.; Farrell, W.M.; Kaiser, M.L.; et al. Control of Jupiter’s radio emission and aurorae by the solar wind. Nature 2002, 415, 985–987. [Google Scholar] [CrossRef] [PubMed]
  40. Baron, R.L.; Owen, T.; Connerney, J.E.P.; Satoh, T.; Harrington, J. Solar Wind Control of Jupiter’s H+3Auroras. Icarus 1996, 120, 437–442. [Google Scholar] [CrossRef]
  41. Terasawa, T.; Maezawa, K.; Machida, S. Solar wind effect on Jupiter’s non-Io related radio emission. Nature 1978, 273, 131. [Google Scholar] [CrossRef]
  42. Cravens, T.E.; Ozak, N. Auroral ion precipitation and acceleration at the outer planets. In Auroral Phenomenology and Magnetospheric Processes: Earth and Other Planets; Keiling, A., Donovan, E., Bagenal, F., Karlsson, T., Eds.; AGU: Washington, DC, USA, 2012; pp. 287–294. [Google Scholar]
  43. Cravens, T.E.; Waite, J.H.; Gombosi, T.I.; Lugaz, N.; Gladstone, G.R.; Mauk, B.H.; MacDowall, R.J. Implications of Jovian X-ray emission for magnetosphere-ionosphere coupling. J. Geophys. Res. 2003, 108, 1465. [Google Scholar] [CrossRef]
  44. MacDowall, R.J.; Kaiser, M.L.; Desch, M.D.; Farrell, W.M.; Hess, R.A.; Stone, R.G. Quasi-periodic Jovian radio bursts: Obser-vations from the Ulysses Radio and Plasma Wave Experiment. Planet. Space Sci. 1993, 41, 1059. [Google Scholar] [CrossRef]
  45. Owens, M.J.; Horbury, T.S.; Arge, C.N. Probing the large-scale topology of the heliospheric magnetic field using Jovian elec-trons. Astrophys. J. 2010, 714, 1617–1623. [Google Scholar] [CrossRef]
  46. del Peral, L.; Gomez-Herrero, R.; Rodrıguez-Frıas, M.D.; Gutierrez, J.; Muller-Mellin, R.; Kunow, H. Jovian electrons in the he-liosphere: New insights from EPHIN on board SOHO. Astropart. Phys. 2003, 20, 235–245. [Google Scholar] [CrossRef]
  47. Moses, S.L.; Coroniti, F.V.; Kennel, C.F.; Scarf, F.L.; Greenstadt, E.W.; Kurth, W.S.; Lepping, R.P. High time resolution plasma wave and magnetic field observations of the Jovian bow shock. Geophys. Res. Lett. 1985, 12, 183–186. [Google Scholar] [CrossRef]
  48. Chenette, D.L. The propagation of Jovian electrons to Earth. J. Geophys. Res. 1980, 85, 2243–2256. [Google Scholar] [CrossRef]
  49. Krimigis, S.M.; Sarris, E.T.; Armstrong, T.P. Observations of Jovian electron events in the vicinity of Earth. Geophys. Res. Lett. 1975, 2, 561–564. [Google Scholar] [CrossRef]
  50. Lario, D.; Decker, R.B.; Livi, S.; Krimigis, S.M.; Roelof, E.C.; Russell, C.T.; Fry, C.D. Heliospheric energetic particle observations during the October–November 2003 events. J. Geophys. Res. 2005, 110, A09S11. [Google Scholar] [CrossRef]
  51. Malandraki, O.; Lario, E.D.; Lanzerotti, L.J.; Sarris, E.T.; Geranios, A.; Tsiropoula, G. October/November 2003 interplanetary coronal mass ejections: ACE/EPAM solar energetic particle observations. J. Geophys. Res. 2005, 110, 1–10. [Google Scholar] [CrossRef]
  52. McKibben, R.B.; Anglin, J.D.; Connell, J.J.; Dalla, S.; Heber, B.; Kunow, H.; Lopate, C.; Marsden, R.G.; Sanderson, T.R.; Zhang, M. Energetic particle observations from the Ulysses COSPIN instruments obtained during the October–November 2003 events. J. Geophys. Res. Space Phys. 2005, 110, A09S19. [Google Scholar] [CrossRef]
  53. Louri, I. Periodicities of Electromagnetic Measurements of Possible Extra-Terrestrial Origin. Master’s Thesis, Demokritos University of Thrace, Komotini, Greece, 2011. [Google Scholar]
  54. Anagnostopoulos, G.C.; Louri, I.; Marhavilas, P.; Sarris, E.T. Jovian periodicities (∼10 h, ∼40 min) on Ulysses’ Distant Jupiter Encounter observations around the Halloween CIR events. Adv. Space Res. 2009, 43, 573–581. [Google Scholar] [CrossRef]
  55. Anagnostopoulos, G.C.; Balogh, A.; Marhavilas, P.K.; Rigas, A.; Sarris, E.T.; Trochoutsos, P.C. Quasiperiodic behavior of ion events and wave activity upstream from Jupiter’s bow shock: Ulysses’ observations. Geophys. Res. Lett. 1998, 25, 1533. [Google Scholar] [CrossRef]
  56. Marhavilas, P.K. Elaboration and Analysis of Energetic particle Observations by the ULYSSES Spacecraft, in the Vicinity of Magnetohydrodynamic Surfaces. Ph.D. Thesis, Space Research Lab., Demokritos University of Thrace, Komotini, Greece, 2004. [Google Scholar]
  57. Marhavilas, P.K.; Anagnostopoulos, G.C.; Sarris, E.T. On a systematic spectral variation of energetic ions in the Jovian outer magnetosphere: HI-SCALE/Ulysses observations. Planet. Space Sci. 2004, 52, 5–6. [Google Scholar] [CrossRef]
  58. Marhavilas, P.K.; Anagnostopoulos, G.C.; Sarris, E.T. Periodic signals in Ulysses’ energetic particle events upstream and downstream from the Jovian bow shock. Planet. Space Sci. 2001, 49, 1031–1047. [Google Scholar] [CrossRef]
  59. Marhavilas, P.K.; Malandraki, O.E.; Anagnostopoulos, G.C. Survey of caveats in low-energy particle measurements: Ulys-ses/HI-SCALE and ACE/EPAM Instruments. Planet. Space Sci. 2015, 117, 192–206. [Google Scholar] [CrossRef]
  60. Gold, R.E.; Krimigis, S.M.; Hawkins, S.E., III; Haggerty, D.K.; Lohe, D.A.; Fiore, E.; Armstrong, T.P.; Holland, G.; Lanzerotti, L.J. Electron, Proton, and Alpha Monitor on the Advanced Composition Explorer Spacecraft. Space Sci. Rev. 1998, 86, 541. [Google Scholar] [CrossRef]
  61. Stone, E.C.; Frandsen, A.M.; Mewaldt, R.A.; Christian, E.R.; Margolies, D.; Ormes, J.F.; Snow, F. The Advanced Composition Explorer. Space Sci. Rev. 1998, 86, 1–22. [Google Scholar] [CrossRef]
  62. Smith, C.W.; L’Heureux, J.; Ness, N.F.; Acuna, M.H.; Burlaga, L.F.; Scheifele, J. The ACE Magnetic Fields Experiment. Space Sci. Rev. 1998, 86, 613–632. [Google Scholar] [CrossRef]
  63. Wenzel, K.-P.; Marsden, R.G.; Page, D.E.; Smith, E.J. The Ulysses mission, Astron. Astrophys. Suppl. Ser. 1992, 92, 207. [Google Scholar]
  64. Smith, E.J.; Wenzel, K.-P. Introduction to the Ulysses encounter with Jupiter. J. Geophys. Res. 1993, 98, 111. [Google Scholar] [CrossRef]
  65. Anagnostopoulos, G.C.; Tenentes, V.; Vassiliadis, E.S. MeV ion event observed at 0950 UT on 4 May 1998 at a quasi-perpendicular bow shock region: New observations and an alternative interpretation on its origin. J. Geophys. Res. Space Phys. 2009, 114, 1. [Google Scholar] [CrossRef]
  66. Anagnostopoulos, G.C. Dominant Acceleration Processes of Energetic Protons at the Earth’s Bow Shock. Phys. Scr. 1994, 1994, 142–151. [Google Scholar] [CrossRef]
  67. Anagnostopoulos, G.C.; Kaliabetsos, G.D. Shock drift acceleration of energetic (E ≥ 50 keV) protons and (E ≥ 37 keV/n) alpha particles at the Earth’s bow shock as a source of the magnetosheath energetic ion events. J. Geophys. Res. 1994, 99, 2335–2349. [Google Scholar] [CrossRef]
  68. Kudela, K.; Lutsenko, V.N.; Sarris, E.T.; Sibeck, D.G.; Slivka, M. DOK-2 ion fluxes upstream from the bow shock: Characteristics from 4 years of Interball-1 measurements. Planet. Space Sci. 2005, 53, 59–64. [Google Scholar] [CrossRef]
  69. Vandas, M.; Karlický, M. Electron acceleration in a wavy shock front. Astron. Astrophys. 2011, 531, A55. [Google Scholar] [CrossRef]
  70. Krupp, N.; Vasyliūnas, V.M.; Woch, J.; Lagg, A.; Khurana, K.K.; Kivelson, M.G.; Mauk, B.H.; Roelof, E.C.; Williams, D.J.; Krimigis, S.M.; et al. Dynamics of the Jovian Magnetosphere. In Jupiter: The Planet, Satellites and Magnetosphere; Bagenal, F., Dowling, T.E., McKinnon, W.B., Eds.; Cambridge University Press: Cambridge, UK, 2004; pp. 617–638. ISBN 0-521-81808-7. [Google Scholar]
  71. Vogt, A.; Heber, B.; Kopp, A.; Potgieter, M.S.; Strauss, R.D. Jovian electrons in the inner heliosphere—Proposing a new source spectrum based on 30 years of measurements. Astron. Astrophys. 2018, 613, A28. [Google Scholar] [CrossRef]
  72. Moses, D. Jovian electrons at 1 AU-1978-1984. Astrophys. J. 1987, 313, 471–486. [Google Scholar] [CrossRef]
  73. Kühl, P.; Dresing, N.; Dunzlaff, P.; Effenberger, F.; Fichtner, H.; Gieseler, J.; Gomez-Herrero, R.; Heber, B.; Klassen, A.; Kleimann, J.; et al. Spectrum of galactic and Jovian electrons. In Proceedings of the 33rd International Cosmic Ray Conference (ICRC2013), Rio de Janeiro, Brazil, 2–9 July 2013. [Google Scholar]
  74. Nndanganeni, R.; Potgieter, M.S. The global modulation of Galactic and Jovian electrons in the heliosphere. Astrophys. Space Sci. 2018, 363, 156. [Google Scholar] [CrossRef]
  75. Fisher, R.A. Test of significance in harmonic analysis. Proc. R. Soc. Lond. Ser. 1929, 125, 54–59. [Google Scholar]
  76. Nowroozi, A.A. Table for Fisher’s test of significance in harmonic analysis. Geophys. J. R. Astron. Soc. 1967, 12, 517–520. [Google Scholar] [CrossRef]
  77. Grenander, U.; Rosenblatt, M. Statistical Analysis of Stationary Time Series; John Wiley: New York, NY, USA, 1957; pp. 91–94. [Google Scholar]
  78. Shimshoni, M. On Fisher’s test of significance in harmonic analysis. J. R. Astron. Soc. 1971, 23, 373. [Google Scholar] [CrossRef]
  79. Marhavilas, P.K.; Koulouriotis, D.E.; Spartalis, S.H. Harmonic Analysis of Occupational-Accident Time-Series as a Part of the Quantified Risk Evaluation in Worksites: Application on Electric Power Industry and Construction Sector. Reliab. Eng. Syst. Saf. 2013, 112, 8–25. [Google Scholar] [CrossRef]
Figure 1. Schematic presentation of the satellites ACE and Geotail during November 25–29 (329–333), 2023. The ACE satellite orbits the L1 Libration Point (LPL1). During the time interval 329–331, examined in detail in this study, Geotail moved from the magnetosphere, through the magnetosheath, into the region upstream from the down bow shock.
Universe 09 00357 g001
Figure 2. Depiction of energetic particle and IMF magnitude data, recorded by the ACE spacecraft, from 17 (d. 290) October 2003 to 6 (d. 340) December 2003. This Figure compares low-energy ion intensities (panels a,b) high, energy heavy-ion intensities (panel c), near-relativistic electron intensities (panel d) and the magnetic field magnitude (panel e) during times with enhanced solar ion and electron fluxes following the extreme 2003 Halloween solar events. Details for the data of each graph are noted in the corresponding panels. The normal green lines indicate low-energy ion intensities peaked at or near the arrival of the five (S1–S5) CME-driven shocks. The two normal blue lines indicate a time interval with energetic ion intensity peaks (panels a,b) under a general drop of the solar ion fluxes. These ion peaks show a quasi-periodic behavior, which is examined in detail in the rest of this study.
Universe 09 00357 g002
Figure 3. This figure shows data obtained by the ACE spacecraft upstream from the Εarth’s bow shock from 18–30 November 2003 (d. 323–334, 2003). More specifically, this figure shows differential intensities of ions measured by the EPAM/LEMS120 detector in four energy ranges (channels P1′: 61–77 keV, P3′: 127–207, P’5: 360–601 keV and P7′: 1123–1874 keV) (panel a), differential intensities of high energy (>2.5 MeV) heavy (Z > 5) ions (panel b) and the value of the electron flux ratio from the DE1 (38–53 keV) and DE2 (53–103 keV) energy channels of the EPAM/LEMS30 detector (panel c); the rest of the panels display the differential intensities of 50–103 keV electrons (panel d), the longitudinal magnetic field angle ϕ (panel e) and the IMF magnitude (panel f). The (panel g) displays the values of the index of geomagnetic activity SYM-H.
Universe 09 00357 g003
Figure 4. Flux-time profile of the EPAM/LEMS120/P1′ ion energy (61–77 keV) channel from the ACE satellite far upstream from the Earth’s bow shock on November 22 (00 UT)–28 (UT) The normal green lines have been drawn every 10 h. QP-10/5 h EIBs are evident from the end of 24 November to the middle of 24 November 2003.
Universe 09 00357 g004
Figure 5. Depiction of pitch angle distributions (PADs) concerning the normalized differential intensities of Sectors S1, S2… S8 of ions observed by the ACE/EPAM/LEMS120 detector. The four panels, from to bottom on both sides of the figure, display measurements from the energy channels P1′, P2′, P3′ and P4′. The panels on the left side of this figure display the PADs during the onset phase of the ACE EIB #5 (09:15–09:20 UT, November 27 (331), 2003) show an energy-dependent cross-field anisotropy, which suggests the existence of cross-field intensity gradients of energetic ions in the interplanetary space (see in the text). The panels on the right side of this figure display the PADs during the main phase of event #3 at 07:10–07:15 UT, November 26 (330), 2003; they show ion streaming outward from the Sun, which suggests a non-terrestrial origin of the EIBs observed.
Universe 09 00357 g005
Figure 6. Flux time profiles of ions/protons from ACE (panel a), Geotail (panel b), longitudinal angle ϕ of the magnetic field (panel c), the evaluated connection time tC of the IMF at Geotail with bow shock (panel d), the angle ΘBn between the IMF vector and the normal direction to the bow shock front at the connection point PC (panel e) and the geomagnetic index AE (panel f), during the time interval 00:00–02:00 UT on November 27 (331), 2003. All events A–D occurred under large values of ΘBn and low values tC, which are unfavourable conditions for the Fermi-type acceleration or leakage model.
Universe 09 00357 g006
Figure 7. Flux time profiles of ions/protons from ACE (panel a), Geotail (panel b), a series of geostatic spacecraft (panel c), along with SYM-H index around the period of ACE burst #3 (6:30 to 7:40 UT on 26 November 2003). The onset of the ion events (01, 02) occurred almost simultaneously at ACE and Geotail, under a quiet magnetosphere (panel d), without any injection events in the inner magnetosphere. After a second flux increase (02), the intensity maximum (M) was observed earlier at ACE than at Geotail. These measurements are inconsistent with the leakage model for magnetospheric ions and with a terrestrial source in general (see in the text).
Universe 09 00357 g007
Figure 8. Representative energy spectra of energetic protons measured at ACE and Geotail (ACE Event #3). The comparison of the spectra suggests comparable intensities at energies E = ~50–80 keV but higher intensities at ACE at energies E > 80 keV. The ACE also reveals an unusually soft spectrum (γ ≅ 4.2) between ~55–250 keV for an upstream events at LPL1. These findings may suggest an extra-terrestrial source of the QP-10/5 h EIBs on 27–27 November 2003 (see in the text).
Universe 09 00357 g008
Figure 9. Spectral results from a Fourier analysis of ACE data between days 327–331, 2003. The three panels of Figure 5, from top to bottom, depict the squared-harmonic-amplitudes as a function of the frequency of the flux-time profiles of high energy heavy ions, the values of the magnetic field ϕ angle and the DE1/DE2 electron intensity ratio (which is used as an electron spectral index), during specific intervals throughout the days 327–331, 2003. The spectral analysis reveals the presence of a peak at ~10 h (normal dashed line) in all of the three magnitudes examined in this figure. The appearance of ~10 h Jupiter rotation period in the data provides evidence of a Jovian influence in the region upstream from the bow shock during the period examined here.
Universe 09 00357 g009
Figure 10. Spectral results as in Figure 9, but for ACE electron flux ratio DE1/DE2 for the days 229, 2003 (panel a), 330, 2003 (panel b) and 331, 2003 (panel c). Peaks at ~40 min (35/36/41 min) and ~20 min (22/22/19 min) are evident in all three days. Peaks were also seen at 57 min and 72 min. Since QP-40 min and QP-15–20 min (also QP-60 and QP-80) characterize the Jovian electron emissions, the above results suggest that most probably Jovian electrons reached the Earth’s environment on 25–27 November (329–331) 2003.
Universe 09 00357 g010
Figure 11. The components of the IMF Bx (panel a), By (panel b), Bz (panel c) and its total magnitude B (panel d) as detected by the ACE/MAG instrument, between 22–27 November (326–331), 2003. The normal green lines have been drawn to show 40 min intervals. During almost the whole interval examined here, all of the IMF components Bx, By, and Bz show large amplitude fluctuations. The values of the components Bx, By, and Bz show, in general, one or two peaks every 40 min period. Furthermore, we see that the QP-40/20 min fluctuations are superposed on the QP-10/5 h variations of the IMF components Bx, By and Bz on 25–27 November (229–331), 2003 as in the Jovian high latitude magnetosphere and far upstream from the Jovian bow shock.
Universe 09 00357 g011
Figure 12. Spectral results were constructed as in Figure 9, but for the ACE magnetic field component Bx for the day November 26 (330), 2003. Peaks at ~40 min (37.3 41 min) and ~20 min (18.7–22.4 min) period are evident and very significant (p = 0.01). Since QP-40 min and QP-15–20 min characterizes the electron spectral modulation (Figure 10), it is reasonably implied a physical relation of the magnetic field waves with the >40 keV electrons observed on 25–27 November (326–331), 2003.
Universe 09 00357 g012
Figure 13. From the top to the bottom, measurements from four different instruments onboard Ulysses recorded during the period on days 315–341, 2003: HI-SCALE (panel a; LEMS120 P1′ and P7′ and LEMS30 P1 and P7 ion fluxes), URAP (panel b; radio emissions), HI-SCALE (panel c; LEMS120 electron spectral flux ratio DE2/DE1), VHM/FGM (panels df; magnetic field data) and SWOOPS (panels gi; plasma parameters). The most striking characteristic is the passage of3 two strong CIRs and an interplanetary shock wave (blue arrow) followed by QP-10 h bKOM radio bursts (panel b). The QP-10 h bKOM radio bursts seen on 24–28 (d. 328–332) November 2003, in the time interval between the two CIRs, were observed after the IS passage by Ulysses at the end of November 23 (d. 327).
Universe 09 00357 g013
Figure 14. In this figure, we show Parker IMF lines (assuming an average solar wind speed of 500 km/s) and the projection of the planets Earth/Jupiter and of the Ulysses spacecraft to the (X-Y) ecliptic plane (panel a) as well as to the Z-Y plane (panel b) in HGI coordinates, on November 26 (330), 2003. A sketch around Jupiter indicates the Jovian magnetosphere with its magnetotail; Earth, Ulysses and Jupiter/Jovian magnetosphere are not in scale. The flux tube indicated by the two Parker IMF lines passes by Jupiter. It crosses the Jovian magnetosphere (detailed description of the figure and discussion on the possible common Jovian origin of the ~10/5 periodicities observed at ACE and Ulysses in the text).
Universe 09 00357 g014
Disclaimer/Publisher’s Note: The statements, opinions and data contained in all publications are solely those of the individual author(s) and contributor(s) and not of MDPI and/or the editor(s). MDPI and/or the editor(s) disclaim responsibility for any injury to people or property resulting from any ideas, methods, instructions or products referred to in the content.

