Article

Why Are Some Radio Galaxies Detected by Fermi, but Others Not?

1
School of Physics and Materials Science, Guangzhou University, Guangzhou 510006, China
2
Dipartimento di Fisica e Astronomia ‘G. Galilei’, Università di Padova, 35131 Padova, Italy
3
Center for Astrophysics, Guangzhou University, Guangzhou 510006, China
4
Astronomy Science and Technology Research Laboratory of Department of Education of Guangdong Province, Guangzhou 510006, China
5
Key Laboratory for Astronomical Observation and Technology of Guangzhou, Guangzhou 510006, China
6
College of Mathematics and Physics Science, Hunan University of Arts and Science, Changde 415000, China
*
Authors to whom correspondence should be addressed.
Universe 2023, 9(11), 479; https://doi.org/10.3390/universe9110479
Submission received: 27 September 2023 / Revised: 1 November 2023 / Accepted: 6 November 2023 / Published: 8 November 2023
(This article belongs to the Special Issue Multimessenger Studies of Active Galactic Nucleus)

Abstract

:
Aiming to answer an interesting question on why some radio sources can be detected by Fermi-LAT but others cannot, we compare several parameters of Fermi-detected Fanaroff-Riley radio galaxies (FFRs) and non-Fermi-detected sources (NFFRs), including the optical absolute magnitude, 1.4 GHz radio luminosity, radio loudness, core dominance parameter, Doppler factor, and the mass of the central black hole. Significant differences are ascertained within these parameters between FFRs and NFFRs. Our findings suggest that FFRs are jet-dominant while NFFRs are disk-dominant sources, and NFFRs have a weaker beaming effect. Additionally, we predict the observed γ -ray flux for NFFRs, establishing that the reason why some NFFRs are not detectable arises from their γ -ray flux being below the sensitivity detection threshold of Fermi. We also discuss two sub-types of Fanaroff-Riley galaxies, namely FR I and FR II sources. We first propose a “changing-look” phenomenon in these radio sources and also investigate why FR IIs seem to be exclusive in γ -ray emission.

1. Introduction

Active galactic nuclei (AGN) radio galaxies are characterized by their extremely powerful radio radiation and exhibit various radio morphologies in the radio region, including compact sources, bent (or head-tail type), and Fanaroff-Riley sources [1]. Compact sources are defined as those where most of the radiation comes from a small nucleus in the center of the galaxy’s optical image, such as M87 [2,3]. Bent sources, on the other hand, have narrow angles and wide-angle tails [4] and exhibit diffuse plumes that are either smoothly or sharply bent with respect to the initial jet direction [5,6,7]. The last radio-emitter type was first proposed by Fanaroff and Riley [8] for extragalactic radio sources with large-scale structures, which can be further divided into Type I and Type II based on their luminosity at 178 MHz, i.e., faint sources with L 178 MHz < 2 × 10 25 W Hz 1 sr 1 are classified in Type I (the edge-darkened FR Is), and bright sources with L 178 MHz > 2 × 10 25 W Hz 1 sr 1 are placed in Type II (edge-brightened FR IIs) [8]. FR I and FR II sources are the most common and have radio jets that extend outward in diametrically opposite directions, forming radio lobes when they collide with denser intergalactic medium regions. In FR Is, the peak of radio emission is closer to the central core, with the emission brightness decreasing farther away from the center. Conversely, in FR IIs, the radio emission increases in brightness outward and culminates in bright hotspots at the outer edge of the jet emission [1,9].
Blazars are radio-loud AGNs that are characterized by their strong and rapid variability across the electromagnetic spectrum. They are thought to have a jet pointed toward Earth, which is responsible for most of the emissions we observe [10,11,12,13]. Blazars are believed to be related to radio galaxies through a “Unified Model”, which postulates that all AGN have the same basic structure and that the observed differences in their properties are due to our viewing angle with respect to the relativistic jet. According to this model, radio galaxies are observed when the jet is not pointed directly toward us, while blazars are observed when the jet is pointed close to our line of sight [14,15,16,17].
The Large Area Telescope on-board the Fermi Gamma-ray Space Telescope (Fermi-LAT) was launched in June 2008 and has been scanning the entire γ -ray sky approximately once every three hours with a wide field of view covering the energy range from 20 MeV to above 300 GeV roughly [18]. 4FGL-DR3, an incremental version of the fourth catalog of LAT sources based on 12 years of survey, has detected 3743 blazars [19], indicating that AGNs with the jet oriented in the direction of the observer are the brightest Giga-electron volt (GeV) sources. However, only 59 low-redshift radio galaxies are listed in 4FGL-DR3. Compared to the majority of blazars, why can an immense amount of radio sources not be detected by Fermi-LAT? Some studies have proposed the possible explanations for this phenomenon. For example, Piner et al. [20] found that sources in the Fermi-LAT Second Source Catalog (2FGL) display higher apparent speeds than those that have not been detected. Pushkarev and Kovalev [21] showed that Fermi AGNs have higher VLBI core flux densities and brightness temperatures and are characterized by the less steep radio spectrum of the optically thin jet emission. If we consider that the radio emission is generated through synchrotron processes, we would expect the observed flux to be increased by a factor of approximately δ n + α . Here, n takes a value of 2 for continuous jets and 3 for spherical blobs, α represents the synchrotron power law index, and  δ is the Doppler factor. A study by Grandi and Torresi [22] proposed that this flux enhancement is highly dependent on the viewing angle. When the viewing angle θ becomes greater than approximately 10 , the enhancement sharply decreases. Consequently, radio-loud Active Galactic Nuclei (AGNs) with large inclinations are not typically considered attractive sources of gamma-ray emissions. As a result, only a small portion of radio galaxies can be detected by gamma-ray observatories like the Fermi-LAT when their flux levels surpass the sensitivity threshold.
In spite of the small number of radio galaxies seen by Fermi-LAT, these γ -ray emitters are extremely appealing sources since they offer a potential perspective to approach the high-energy phenomena and emission mechanisms of active galaxies. A unified model of AGNs proposes that blazars and radio galaxies are the same sources but observed from different angles. If blazars have discrepancies between Fermi-detected and non-Fermi-detected sources due to a beaming effect, see e.g., [23,24,25], it is reasonable to expect that radio galaxies may exhibit similar variations. In order to answer the question of why some radio sources can be detected by Fermi but others cannot, we compile a sample of Fermi-detected radio galaxies and non-Fermi-detected radio galaxies as large as possible to compare them via several parameters, e.g., optical absolute magnitude ( M r ), the ratio of flux density radio loudness (B), the Doppler factor of FR Is ( δ ), core dominance parameters (R) and the mass of the central black hole ( M BH ). This paper is arranged as follows: The sample and method will be presented in Section 2. The results and discussion are given in Section 3, Section 4 and Section 5. Our conclusion will be summarized in Section 6. We adopt the Λ CDM model, with  Ω Λ 0.73 , Ω M 0.27 , and  H 0 73 km · s 1 · Mpc 1 .

2. Sample

Abdollahi et al. [19] presented a sample of 59 Fermi-LAT-detected radio galaxies, most of which are nearby galaxies with z < 0.2 . We collected them all and abbreviated them as FFRs. Furthermore, we categorize these sources into FR Is and FR IIs using the classification from Angioni et al. [26]. On the other hand, Capetti et al. [27] and Capetti et al. [28] provided 379 radio galaxies not detected by Fermi-LAT up to now, i.e., NFFRs, which are nearby galaxies as well with z 0.15 . We list our whole sample of FFRs and NFFRs in Table 1 and Table 2, respectively. The relevant column information can be found in the footnote under the two tables.

3. Parameters

To better account for our main issue, we collected and calculated several parameters for comparison between FFRs and NFFRs, including the core-dominance parameter, optical absolute magnitude, flux density and luminosity in 1.4 GHz, the radio loudness, the Doppler factor of FR Is, and the mass of the central black hole.

3.1. Radio Loudness and Luminosity in Radio and Optical Bands

The Luminosity can be calculated as follows
L 1.4 GHz ( W Hz 1 ) = 4 π d L 2 F 1.4 GHz ,
where F 1.4 GHz is the flux at 1.4 GHz and d L is the luminosity distance. The optical apparent magnitude m in band r can be found in the NASA/IPAC Extragalactic Database (NED)1, and the optical flux density can be derived by the optical apparent magnitude via
F opt ( mJy ) = 3.08 × 10 6 × 10 0.4 m ,
thus the absolute magnitude can be evaluated from
M r = m + 5 5 log ( d L × 10 6 ) ,
then we can calculate the radio loudness which is defined by
B = log F 1.4 GHz F opt .

3.2. Doppler Factor

Ye et al. [25] have proposed that FR Is can be regarded as reliable standard candles; see also [29]. However, this observational fact is not valid for FR IIs; therefore, we only derive the Doppler factor for FR Is sources and perform the discussion on those detected by Fermi-LAT or not. In this framework, and taking the beaming effect into consideration, the luminosity can be read by
log L 1.4 GHz in = log 4 π + log 1.4 + log F 1.4 GHz in + 2 log d L ,
where L in ( erg s 1 ) and F in ( mJy ) denote the intrinsic emission in 1.4 GHz. d L is the luminosity distance in the unit of Mpc. The relationship between the intrinsic flux density and observed one is F ob = δ 2 + α F in , or 
log δ = ( log F 1.4 GHz ob log F 1.4 GHz in ) / ( 2 + α ) .
where δ is Doppler factor and α is radio index. Combining Equations (5) and (6), one can obtain
log δ = ( log F 1.4 GHz ob log L 1.4 GHz in + log 4 π + 2 log d L + log 1.4 ) / ( 2 + α ) .
We adopt log L 1.4 GHz in = 5 × 10 39 erg s 1 [25,30], and finally, Equation (7) yields
log δ = ( log F 1.4 GHz ob + 2 log d L 6.6 ) / ( 2 + α ) ,
where α is the radio spectral index ( S ν ν α ). Employing Equation (8), we can estimate the Doppler factor for our FR Is objects.

3.3. Core-Dominance Parameters and Black Hole Mass

In the radio emission, the core-dominance parameters (R) can be defined as
R = log F core F ext
where F core and F ext denote the emission flux from the core and extended component, respectively. Pei et al. [24] compiled the largest catalogue, concluding 4388 AGNs with core-dominance parameters at 5 GHz. After cross-checking with our present FFRs and NFFRs sample, we find seven are in common. Aiming to enlarge our available R, we use the VLBI observations. We collect the given VLBI data from the VLBI Calibrator Survey (VCS)2. We only performed self-calibration for these data sets in the Difmap software package [31], and all the calibrated VLBI data can be imported to Difmap to carry out phase and amplitude self-calibration for our selected sources. Then we fit the data with optimal Gaussian brightness distribution models in Difmap are map to quantitatively describe the emission properties of the VLBI components. The elliptical Gaussian model can be used to fit the core component, while the circular model is used to fit the jet.
We search the source without giving R from Pei et al. [24] in the VLBI database. After selecting the target, we follow three disciplines for data reduction: (i) We choose 5 GHz images; (ii) The latest observation epoch is a priority; (iii) The core component can be clearly resolved. Then the core parameters can be derived using Difmap, and we can obtain the flux of the radio core. We seek the total emission at 5 GHz from NED (we choose the closest epoch to the one from which the core component is derived; if there are a variety of 5 GHz data), then the core-dominance parameter can be ascertained via Equation (9) (The flux of the extended component is calculated by deducting the core flux from the total emission). Using the VLBI observations data, we obtain the core-dominance parameters for 72 sources, and finally, 79 radio sources with available R are listed in our sample, which includes 47 FFRs and 32 NFFRs. The median values for FFRs and NFFRs are 0.50 and 1.25 , respectively, indicating that the Fanaroff–Riley-type radio galaxies are not emission-core-dominated.
The mass of the central black hole for all NFFRs are taken from Capetti et al. [27] and Capetti et al. [28]. For FFRs, we collect the available data from various references, which are listed in column (14) in Table 1.
To investigate the differences between FFRs and NFFRs, we perform a Kolmogorov–Sm irnov test (hereafter KS test) on two subsamples with different parameters we derive. We list the KS test statistic and the confidence level of the null hypothesis (they both come from the same population) that cannot be rejected (probability, P) in Table 3.

4. Results

4.1. Distribution of Luminosity and Radio Loudness

In this section, we conduct a comparison of absolute magnitude ( M r ), radio luminosity (log L 1.4 GHz ), radio loudness (B), and Doppler factor ( δ ) between FFRs and NFFRs. Our results show there are significant differences between two groups at the 95 % level using the KS test. The absolute magnitude of FFRs are on average larger than that of NFFRs, with a test statistic d max = 0.48 and a chance probability of p = 2.18 × 10 8 . Figure 1 manifests the distribution of M r for two groups, illustrating that NFFRs are brighter than FFRs in the optical band. However, when we consider the 1.4 GHz radio luminosity, we find the FFRs is on average higher than NFFRs, with the KS test statistic d max = 0.33 and a chance probability of p = 5.68 × 10 5 . The distribution of log L 1.4 GHz is depicted in Figure 2. Thus, in contrast, FFRs are brighter than NFFRs in the radio band. These findings confirm that sources with strong radio emissions would be easier to detect by Fermi. Since radio emission is usually associated with non-thermal processes that can also produce γ -rays.
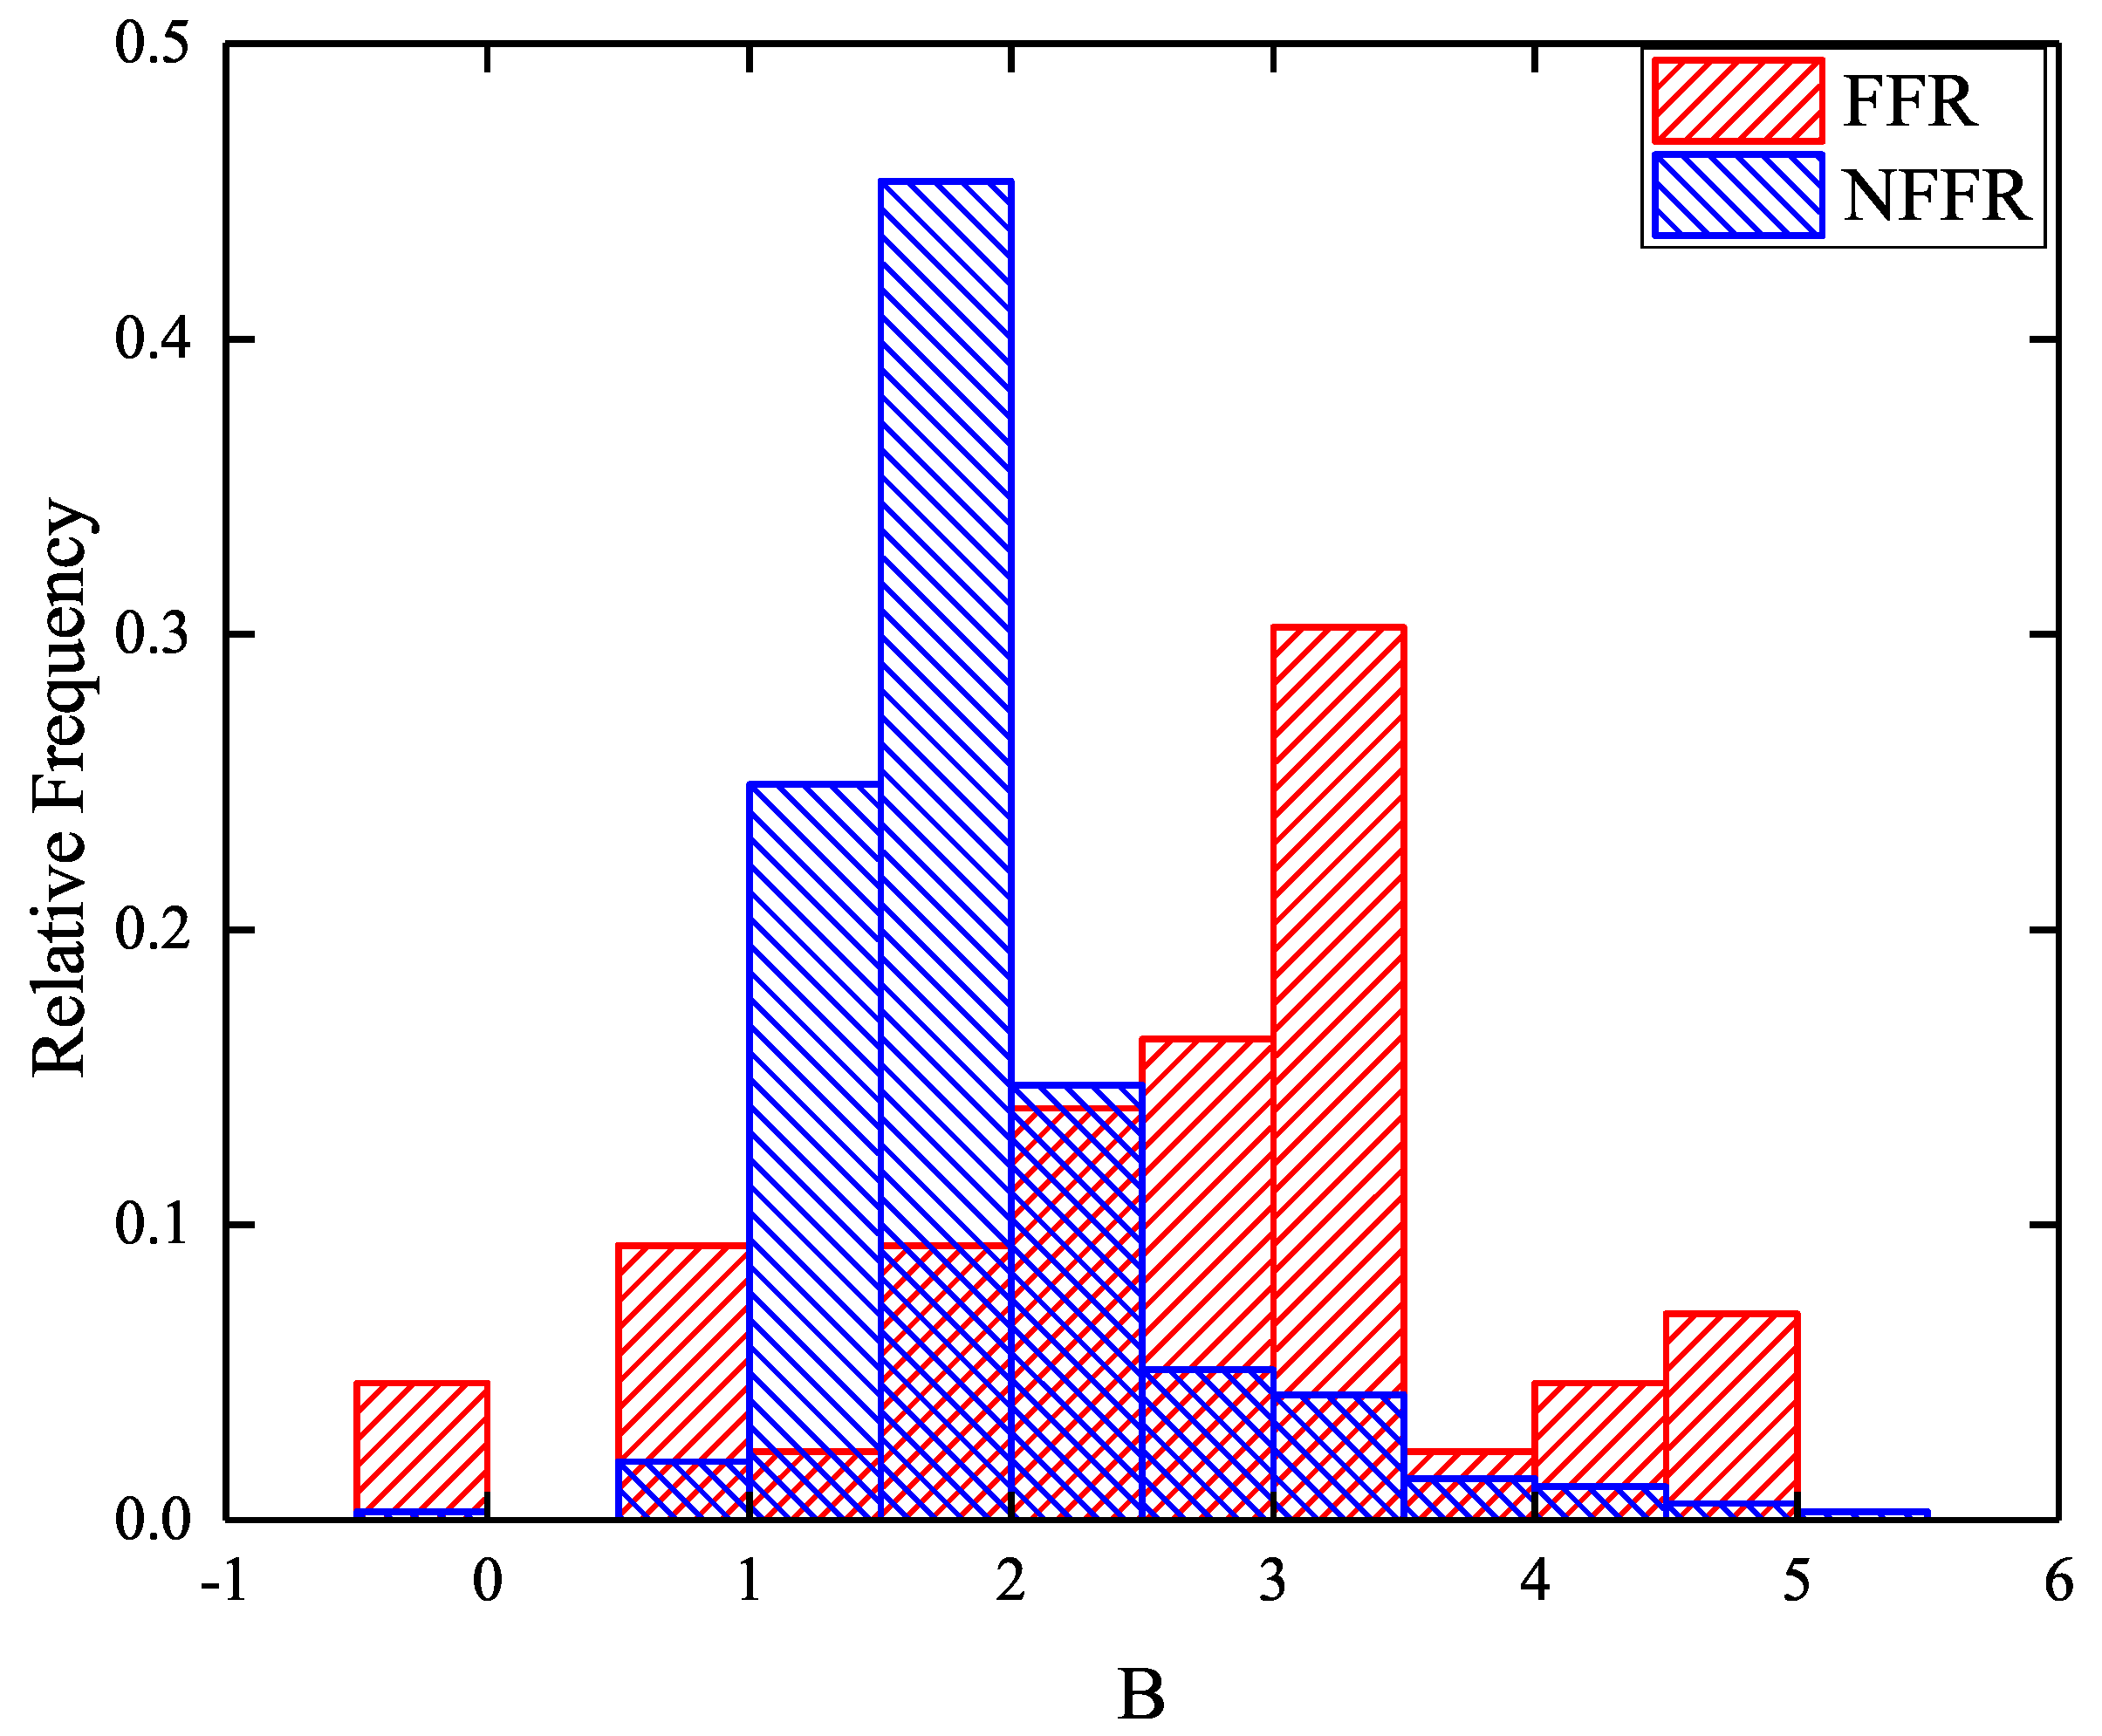
The radio loudness, which was first introduced by Strittmatter et al. [32] as the ratio of radio-to-optical flux density ( B = log F 1.4 GHz / F opt ). In this work, we obtain that the radio loudness of FFRs is significantly higher than that of NFFRs with d max = 0.52 and p = 1.71 × 10 9 , and Figure 3 plots the histogram on B for two subsamples. To address potential misclassification issues, Xiao et al. [33] proposed a double-criterion system that combines radio luminosity and radio loudness to distinguish between radio-loud and radio-quiet AGNs. The synchrotron radiation of relativistic electrons in the jet is believed to be responsible for the radio emission of radio-loud AGNs, and as such, radio loudness can serve as an indicator of whether a source is jet-dominant or accretion disk-dominant. Our results show that FFRs are jet-dominant while NFFRs are disk-dominant.

4.2. Distribution of Core Dominance Parameter and Doppler Factor

Relativistic beaming is an important phenomenon in astrophysics that plays a crucial role in determining the observed properties of AGNs. Standard beaming models predict that AGNs with higher core-dominance parameters should be more strongly beamed, i.e., R f δ n + α [16,34,35,36,37], where f is a constant and n = 2 or 3. This effect makes the core-dominated sources appear brighter and have a flatter radio spectral index than extended sources. Thus, R is an applicable indicator for the beaming effect. Giovannini et al. [38] suggested that the measure of emission core dominance in galaxies can provide an indicator of the viewing angle of jets, with a more dominant radio core implying a smaller θ .
Another parameter to describe the beaming effect based on the orientation angle is the Doppler factor, which can be expressed by δ = [ Γ ( 1 β cos θ ) ] 1 , where Γ is the Lorentz factor defined by Γ = 1 / 1 β 2 , and β is the jet speed in units of c. Since δ cannot be detected directly, many methods have been proposed, e.g., [39,40,41,42,43,44]. Since f is a constant in the relation R f δ n + α , thus we can expect that δ will be larger when having a larger R. Therefore, we consider that more strongly beamed sources have larger Doppler factors.
Relativistic beaming in blazars is evidenced by the rapid variability property from radio to γ -ray band, e.g., [45,46], but the discussion on radio galaxies is unusual since their viewing angles between the line of sight and the jet are normally quite large, leading to a weak beaming effect. However, we believe that the beaming discrepancy still occurs when Fanaroff-Riley radio galaxies are detected by Fermi-LAT or not. Fanaroff-Riley galaxies are considered to be a category of radio-loud AGNs, and their multi-band electromagnetic radiation is attributed to the existence of relativistic particles in jets. When detecting sources, beaming is an important effect that may explain why some radio galaxies can be detected by Fermi while others cannot. Kayanoki and Fukazawa [47] recently studied the comparison in the X-ray spectra between 36 Fermi radio galaxies and 32 non-Fermi radio galaxies, and they suggested that the jet viewing angle of Fermi radio galaxies is smaller than that of non-Fermi radio galaxies.
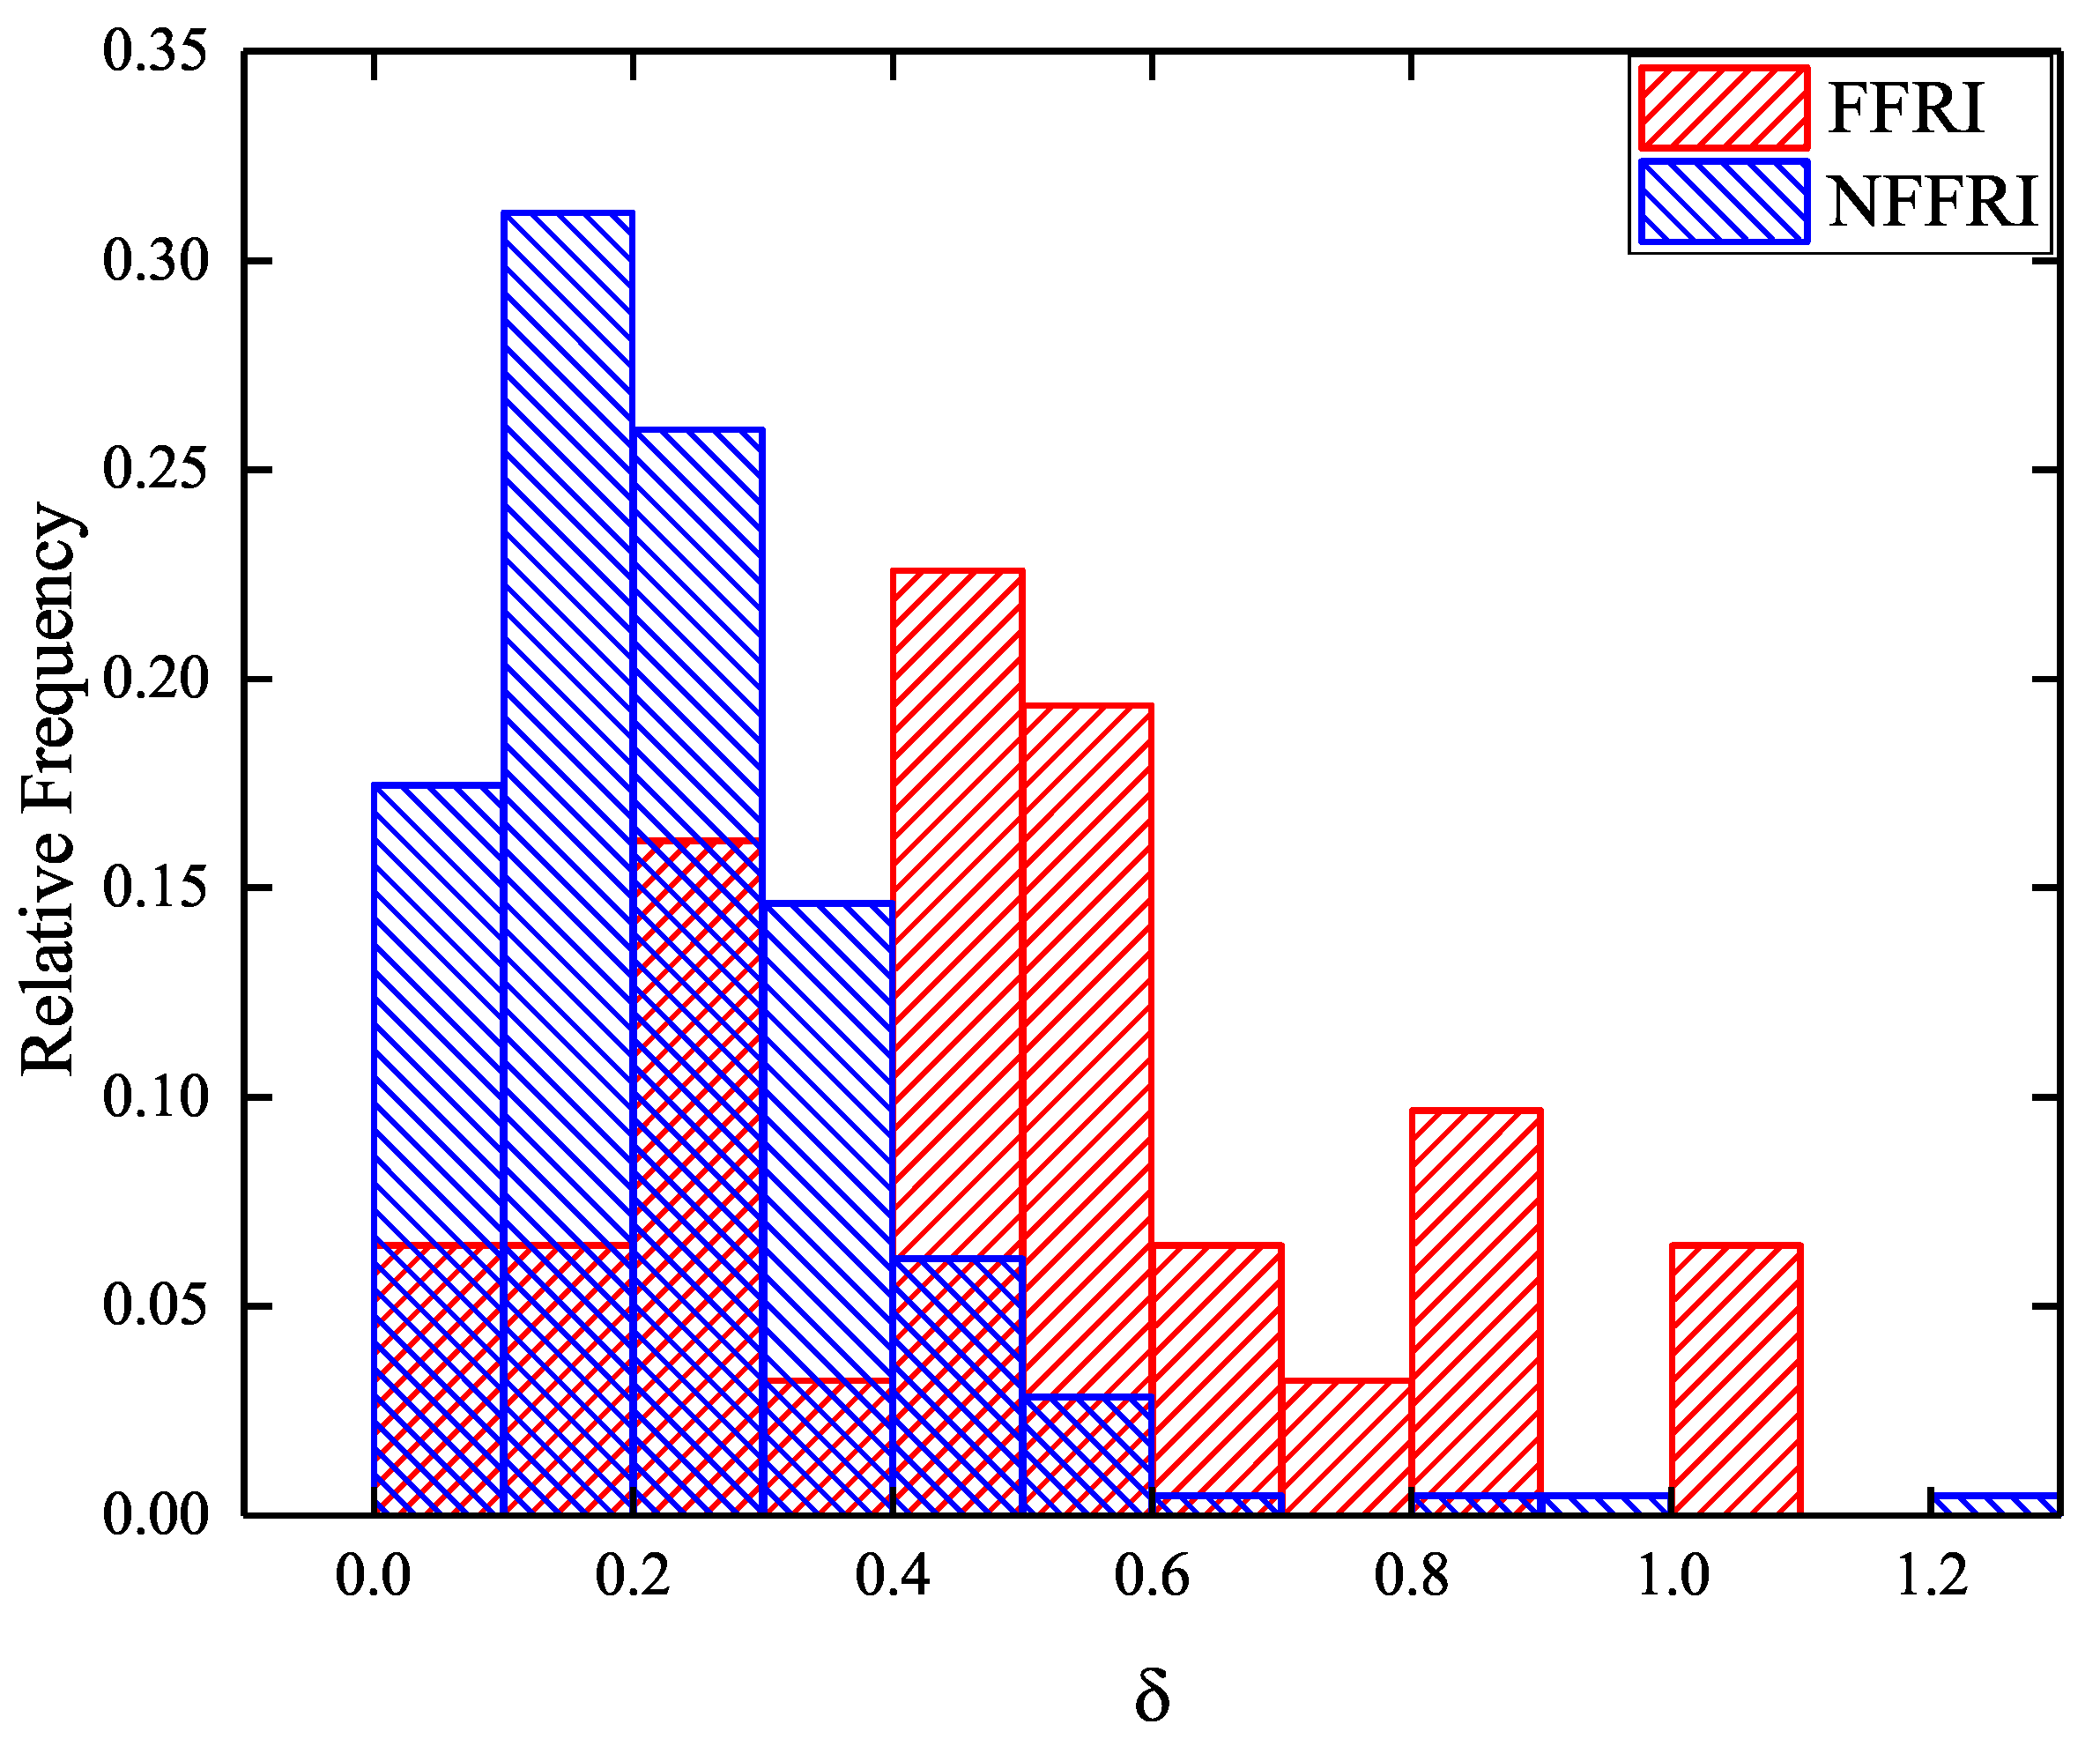
Ye et al. [25] proposed an effective method to estimate the Doppler factors for FR Is via the standard cradles. We also derive the Doppler factors for Fermi-detected FR Is (FFR Is) and non-Fermi-detected FR Is (NFFR Is) using the method presented in Ye et al. [25]. However, FR IIs cannot be seen as reliable standard cradles. Thus, in this study, we only focus on the FR Is sources. We find that the majority of δ fall within the range of 0–2. Our results, presented in Figure 4, show a significant difference between FFR Is and NFFR Is in terms of their δ values, as determined by the KS test with a significant level of 95 % . Specifically, FFR Is exhibit a stronger beaming effect, which has important implications for γ -ray detection. However, our results show that radio galaxies typically have a smaller δ , suggesting that δ has a minimal effect on talking about the beaming in radio galaxies.
The distribution of R is presented in Figure 5, suggesting FFRs are on average more core-dominated than NFFRs, with a KS test statistic d max = 0.50 at a confidence level of 95 % . This significant difference between FFRs and NFFRs on R reveals that beaming may prevent detection by Fermi-LAT. We need to point out that the R for most of our sample is less than 0, indicating that most of the radio sources are not veritably core-dominated, i.e., the radio emission originates from the extended component. Thus, the radio galaxies show an intermediate or weak beaming effect. However, we use this core-dominance parameter as a beaming proxy to distinguish the FFRs and NFFRs, as we had done in discussing the reason for why some blazars can be detected by Fermi-LAT but others not, e.g., [24]. Moreover, if we only take the core emission into account, we ascertain that the radio core flux density for FFRs are on average higher than the NFFRs, namely the mean values are 374.58 mJy and 51.85 mJy, respectively (see Figure 6). Thus, not only the core-dominance parameter but also the core flux density are essential elements to affect the detection of Fermi as well. A source with a brighter compact radio core is more likely to be captured by Fermi. However, we cannot find a tight correlation between core emission and γ -ray luminosity in the FFRs sample. We also find no correlation between the core-dominance parameter and γ -ray luminosity. Our finding is consistent with that of other authors [26,48], which perhaps implies that there is no direct connection between radio core dominance and γ -ray emission for nearby Fermi-detected radio galaxies at 5 GHz.
The identification of FFRs with a higher core flux and a milder beaming effect can provide insights into the physical mechanisms behind the observed properties of FR galaxies. These results can be further investigated in the context of the unified model, which suggests that the observed differences between FFRs and NFFRs may be related to the orientation of the jet with respect to the observer. We suggest that the non-Fermi-detected radio galaxies can be considered to have a weak jet beaming effect, and thus γ -ray radiation is faint, making them difficult to detect by Fermi-LAT.

4.3. Distribution of Black Hole Mass

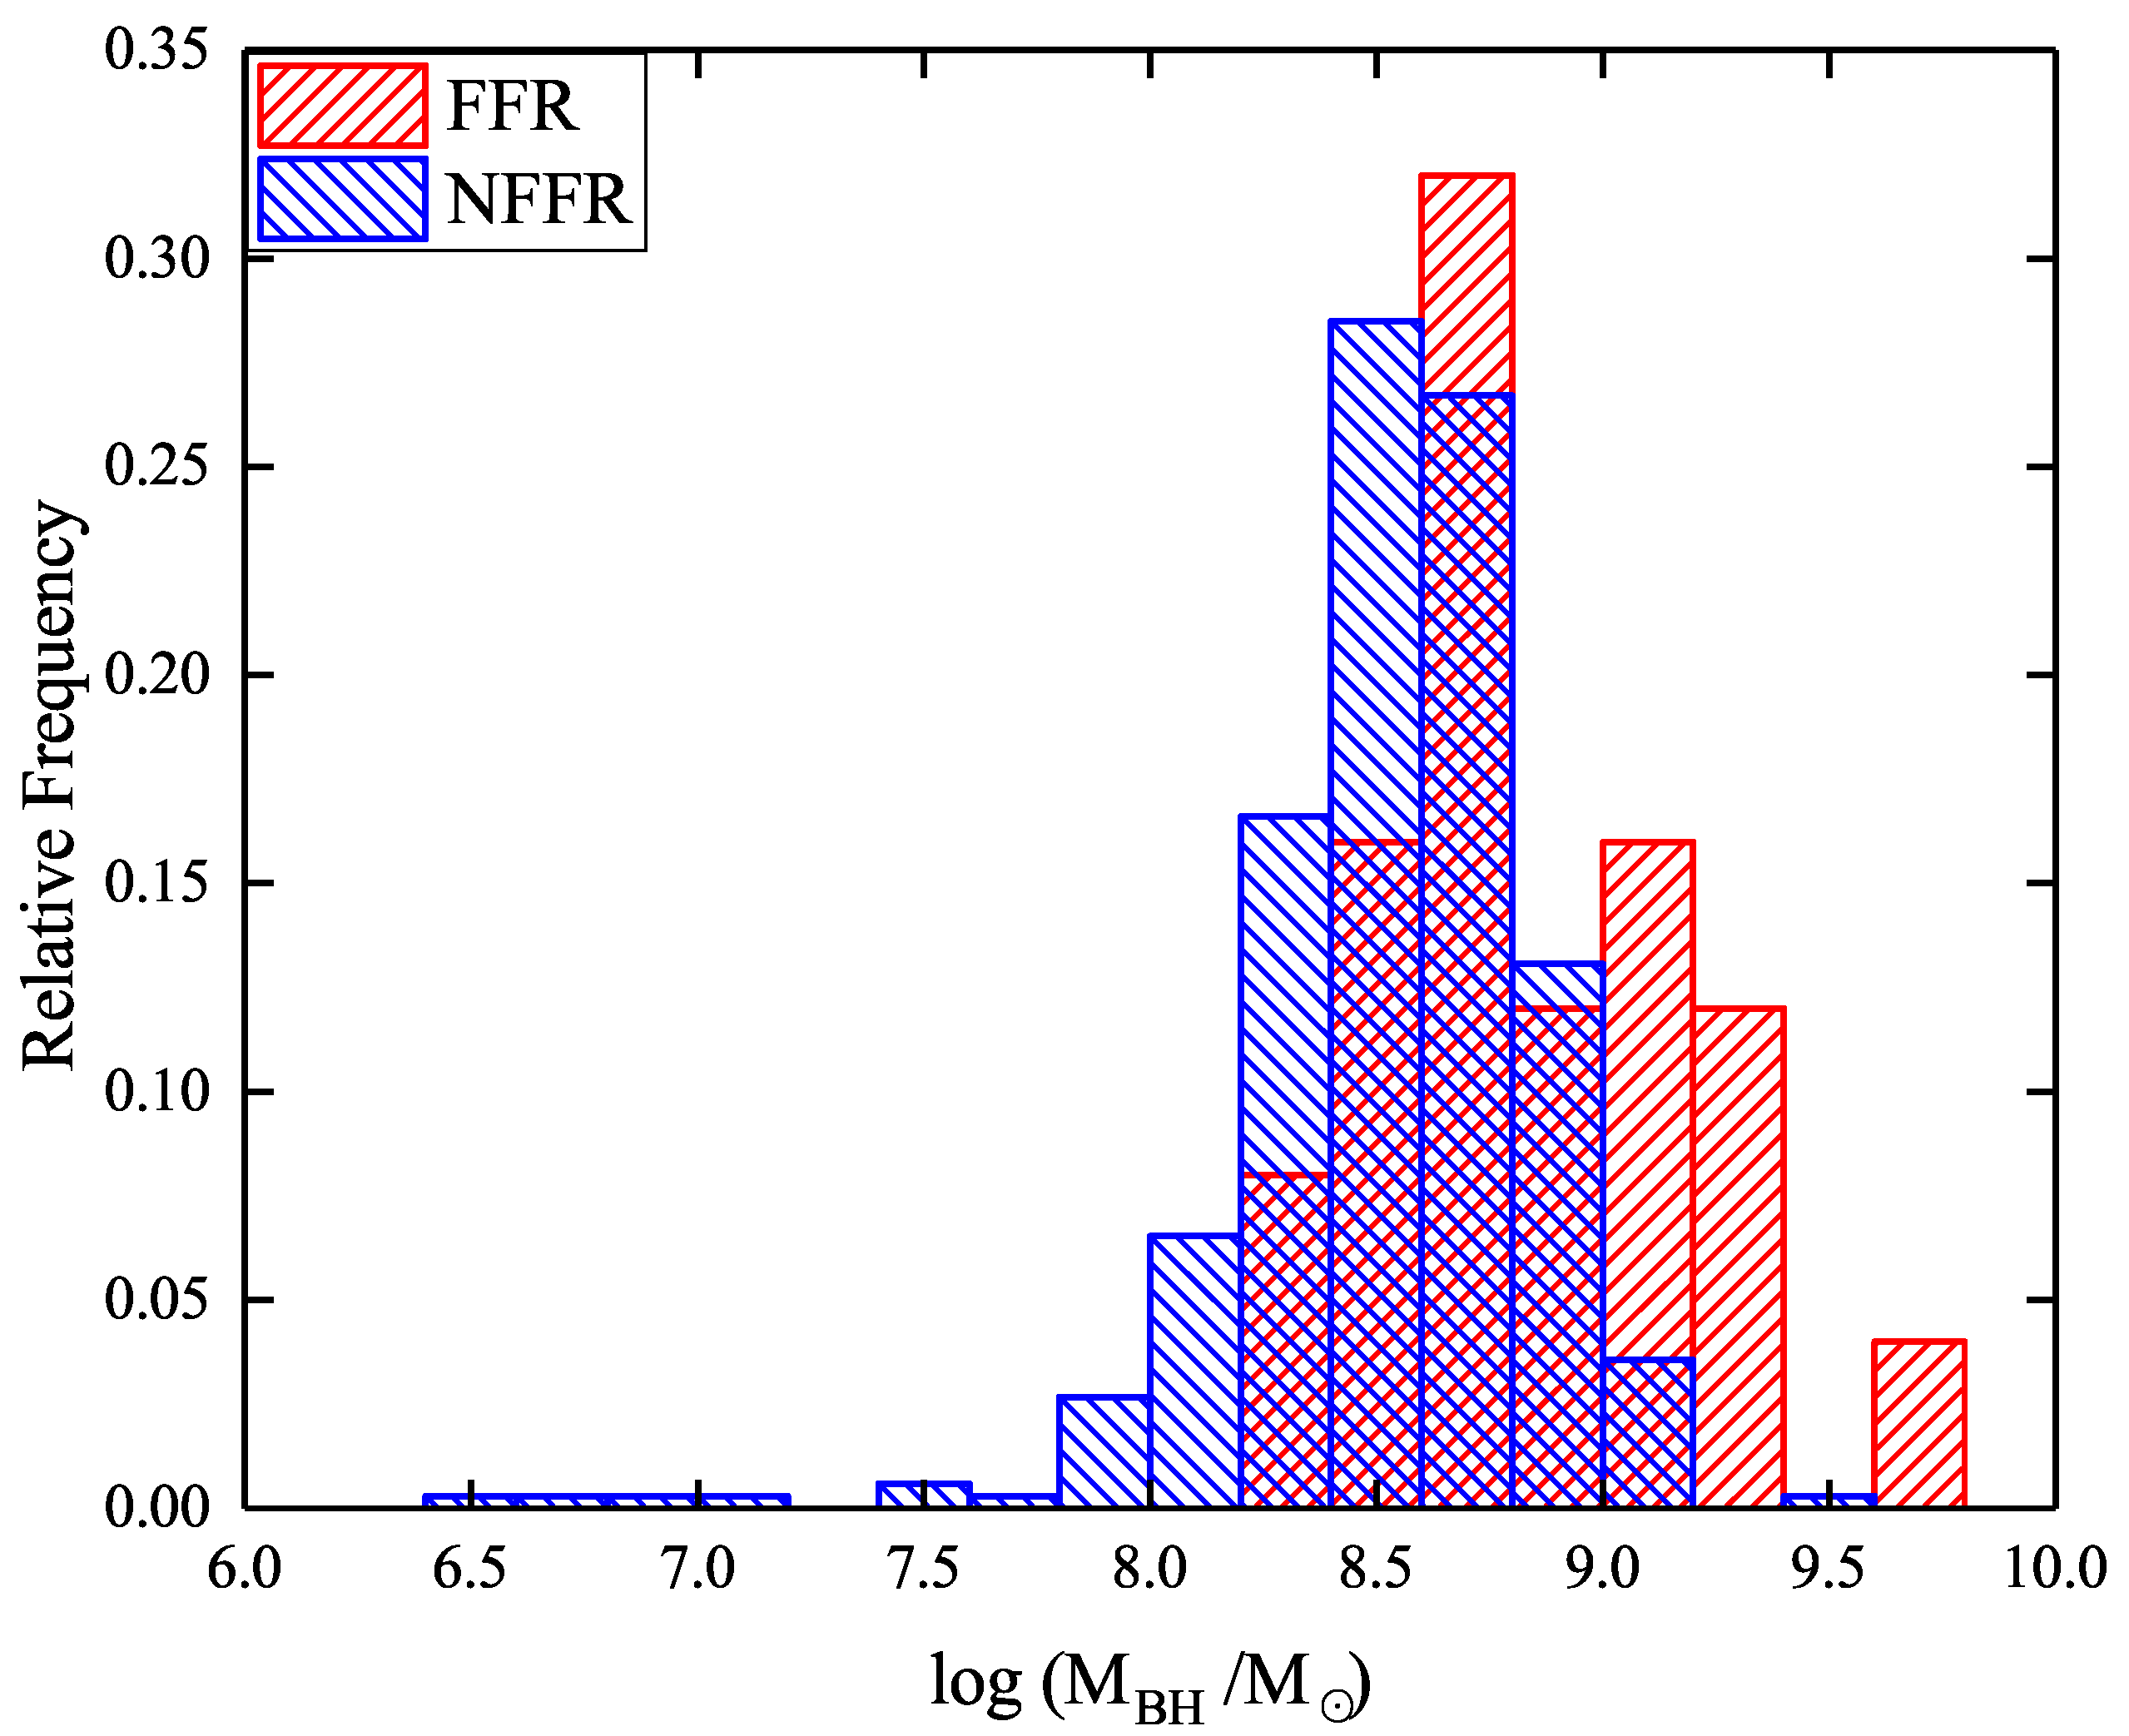
Likewise, the distribution of black hole mass presents a significant difference between FRRs and NFFRs, which is shown in Figure 7. According to Wu et al. [49], the mass of a black hole (or the mass of the surrounding stars) plays a critical role in launching large-scale radio jets. This trend is observed in both elliptical and disk radio galaxies, where the power of the radio jet is found to scale with the stellar mass. Specifically, the relationship between the jet power ( P jet ) and the black hole mass ( M BH ) can be expressed by P jet M BH . This implies that the larger the black hole mass, the more powerful the jet. If the jet can be observed in FR galaxies, then FFRs should possess stronger jet emissions since they have a powerful central engine. This conclusion confirms our verdict presented in Section 3.1 that FFRs are jet-dominant.

5. Discussion

5.1. Predicting the γ -ray Flux of NFFRs

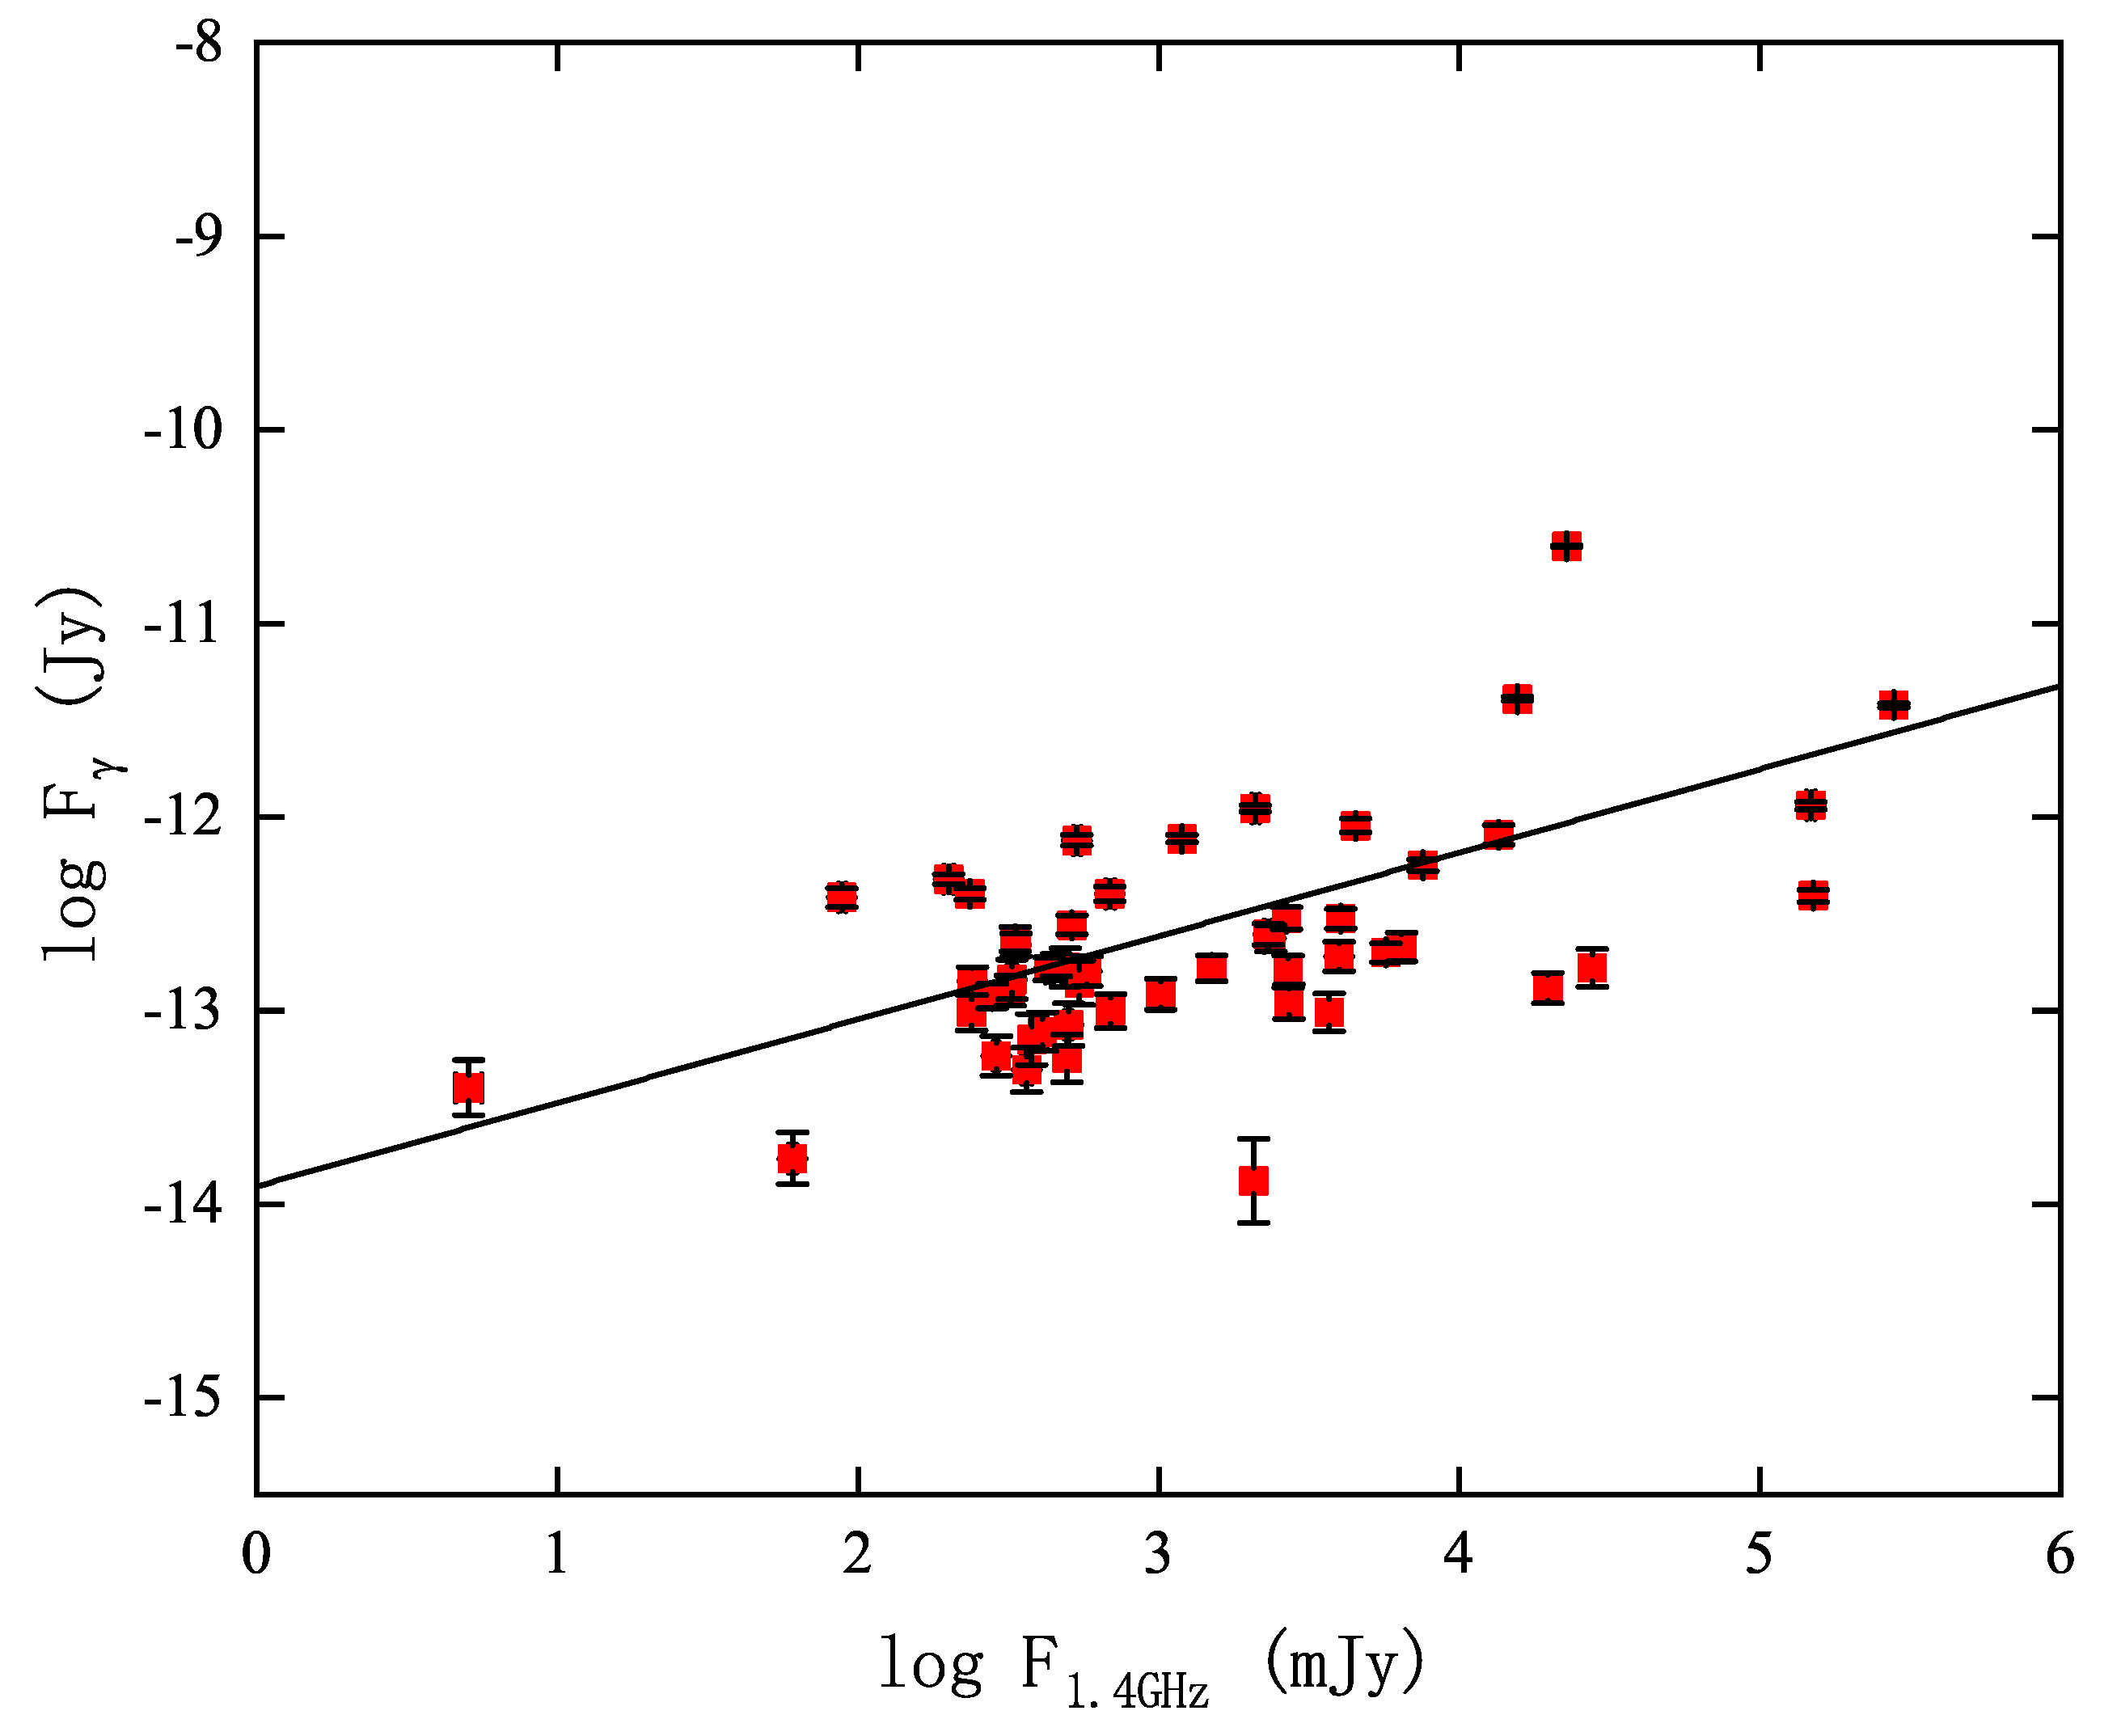
Apart from many FR radio galaxies being possibly γ -quiet, we believe that one main reason why some FR radio galaxies are not detectable for the Fermi telescope is due to their γ -ray flux being below the sensitivity threshold of detection. To investigate this idea, we first obtain the correlation between the γ -ray flux at 1 GeV and the radio flux at 1.4 GHz in FFRs sample. Figure 8 shows a tight tendency that log F γ = ( 0.43 ± 0.09 ) log F 1.4 GHz ( 13.90 ± 0.28 ) with r = 0.63 and P 10 4 by linear fitting. Thus, this relationship can be utilized to predict the γ -ray flux for the NFFR sample if we assume all NFFR sources can emit GeV emissions.
We plot the distribution of predicted γ -ray flux at 1 GeV for NFFRs in Figure 9. The black dashed line denotes the sensitivity threshold for γ -ray detection by the Fermi telescope with test statistic TS 25 (corresponding to 5 σ detections), we clearly find that a large portion of NFFRs fall below the detection threshold, implying that they are elusive GeV sources. Therefore, γ flux being below the threshold of detection of FR radio galaxies is one direct reason for the missing sources for the Fermi telescope.
However, as demonstrated in the figure, there are several FFRs below this threshold. The reason is that the Fermi detection threshold we set in our work is a lower limit value when a source is in the quiescence state. We only consider the threshold at 1 GeV for 12 years of survey data on Fermi-LAT in the 50 MeV–1 TeV energy range. It is noted that some radio galaxies are usually variable; thus, when a source is in the flare state (or a strong beamed state), the emission in both the radio and γ -ray bands would be enhanced, leading the γ -ray flux to exceed our predicted threshold, which makes this source can be captured by Fermi-LAT as well. Besides, the γ -ray flux for some NFFRs is indeed located beyond the threshold. We consider these sources to be quite beamed in a certain period. The flux for most of those NFFRs will be reduced below the detection threshold when they come to the quiescence state. However, we believe some of the NFFRs are likely to be seen by Fermi in the near future. In short, we point out that the beaming effect plays an important role in determining whether something is detectable or not by Fermi, which is also one of the main conclusions in our work.

5.2. FR Is–FR IIs Dichotomy

Traditionally, FR II radio sources are known to be more powerful than FR I radio sources, with a dividing line occurring at a power of approximately 10 25 W Hz 1 sr 1 at 178 MHz, or equivalently, at 1.4 GHz, L 1.4 GHz 3 × 10 25 W Hz 1 [8,50]. Owen and Ledlow [51] suggested that the division line correlates with the absolute magnitude of the host galaxy. In view of the fundamental connection between the black hole mass and bulge stellar mass [52], Ghisellini and Celotti [53] proposed that the Owen and Ledlow [51] relation ultimately reflects a connection between radio power and the mass of the central black hole.
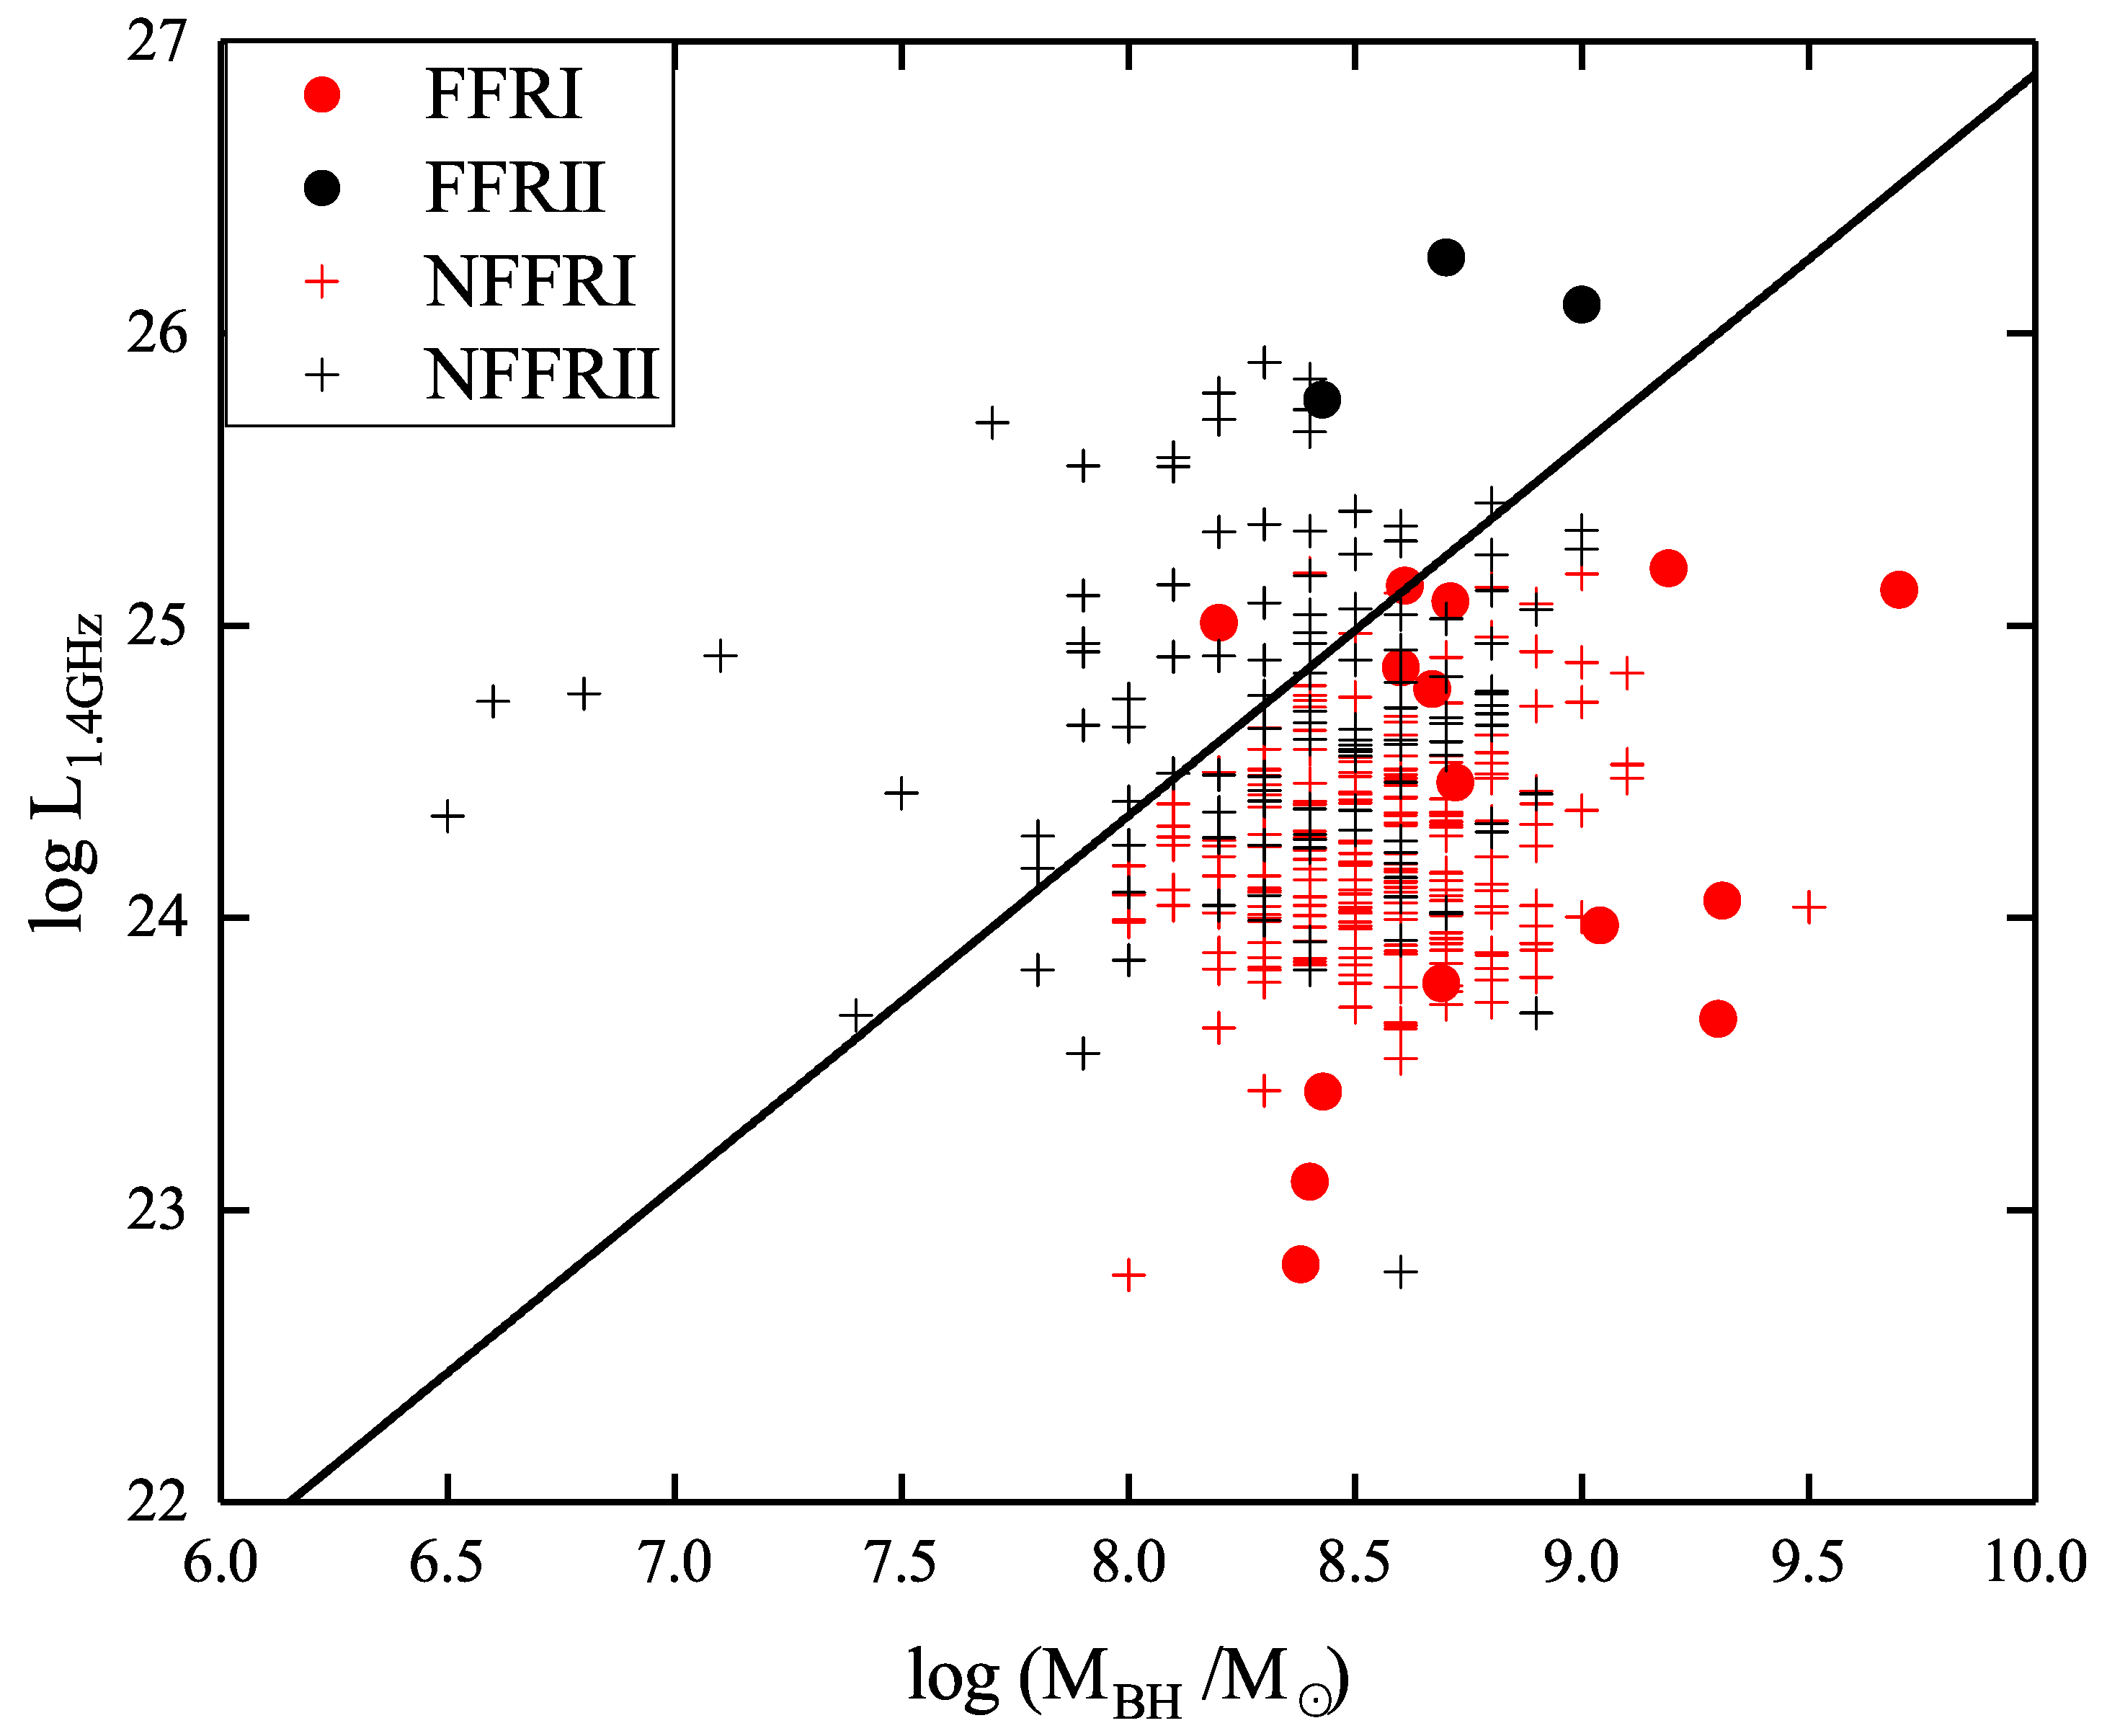
To better understand the classification boundary between FR Is and FR IIs, we plot the 1.4 GHz radio luminosity against black hole mass for our whole FR galaxies sample in Figure 10. We employ the support vector machine method SVM [54], a method of machine learning (ML), from sklearn to accomplish the task. SVM is a supervised learning algorithm that is widely used for classification and regression problems. There are infinite numbers of N − 1 dimensional hyperplanes that can be found to separate two linearly separable samples into different sides of the plane in the N dimensional parameter space. The SVM could then make its effort to determine the plane with the maximum margin, i.e., the maximum distance to the nearest samples. If the two samples are non-linearly separable, SVM can map the samples to a high-dimensional (or even infinite-dimensional) space and find the optimal hyperplane in the high-dimensional space. In this work, we set FRI and FRII samples in the two-dimensional parameter space formed by M BH and l o g L 1.4 GHz . Employing the SVC (a classifier based on a Support Vector Machine (SVM) ) from a python pakage sklearn.svm, we can create an SVM model (linear kernel) by the SVC class and use the fit method of the model object to train the model on the training data. Furthermore, we use the score method of the model object to evaluate the accuracy of the model on the test data. The SVM result gives an accuracy of 81% for the separation and predicts that the double-criterion dividing boundary is log L 1.4 GHz = 1.27 M BH + 14.19 . In order to verify the feasibility of our method, we use the method from Xiao et al. [33] to classify our data. The classification dividing line they set is: log L 1.4 GHz = 1.13 M BH + 15.24 , which is similar to our result. In this figure, half of the FR II sample is located below this dividing line, but only three FR I sources are above the line. They are SDSS J152326.91+283732.5, 4FGL J0319.8+4130, and 3C 120. We suggest they are possibly masquerading as FR I galaxies, namely intrinsic FR II sources, whose powerful radio luminosities are concealed due to the beaming.
The phenomenon of “changing-look” AGNs has been observed in recent two decades, namely transiting between Type I AGNs and Type II AGNs [55,56,57,58]. Type I and Type II AGNs are usually classified based on their optical spectra. The former exhibits a blue continuum from the accretion disk and broad emission lines created by photoionization, while the latter displays no continuum variability and only narrow lines [59]. By far one of the most accepted explanations for the changing-look phenomenon is that the changing-look AGNs or blazars result from a sharp change in the accretion rate, i.e., the broad emission lines would emerge in the wake of an increasing accretion rate, while they would disappear when the accretion rate suddenly drops off, e.g., [33,60]. This transition leads to the fact that the line of sight to the central engine is unobscured for Type I AGNs but obscured for Type II AGNs.
We propose the idea that this changing-look phenomenon also exists in FR radio galaxies, and a promising explanation would be due to the beaming. We believe that the FR I galaxies are jet-dominated while the FR II galaxies are perhaps disk-dominated, and the jet powers for blazars and FR galaxies are believed to be on the order of M ˙ in c 2 . Thus, M ˙ in can be estimated via M ˙ in = P jet / c 2 for FR Is and M ˙ in = L Disk / η c 2 FR IIs, where P jet is the jet power, L Disk is the disk luminosity, which can be considered approximately 10 times of the BLR luminosity, namely L Disk 10 L BLR [61,62,63], and η = 0.08 [64]. Then one can make use of the ratio
M ˙ in M ˙ Edd = M ˙ in c 2 1.3 × 10 38 ( M / M )
to set up the boundary between two groups, similar to how we have done in blazars; see e.g., [12,65,66].
We do not derive the exact value for this ratio since our available data, e.g., black hole mass, are not quite complete. However, this is an issue worthy of follow-up research. We only give the best-classified boundary in the plot of log L 1.4 GHz against M B by using the SVM method, since the correlation between jet power and radio luminosity in AGNs has been bulit in previous studies. For example, Godfrey and Shabala [67] has found that P jet FR I = ( 4 7 ) × 10 44 L 151 10 25 W Hz 1 sr 1 0.64 ± 0.09 for FR Is jet power and P jet FR II = ( 1 2 ) × 10 44 L 151 10 25 W Hz 1 sr 1 0.67 ± 0.05 for FR IIs jet power, where L 151 is 151 MHz monochromatic radio luminosity. This demarcation line, log L 1.4 Ghz = 1.27 M BH + 14.19 , can give us a clue that some FR I galaxies would have weak radiative cooling due to the beaming effect, and the emission from the core component would be highly brightened, bringing about their broad lines being overwhelmed by the continuum from the non-thermal jet emission. In this case, jet powers for these FR I galaxies are increasing while the Eddington luminosity will decrease, resulting in more powerful radio galaxies or masquerading FR II galaxies. This transition from FR Is to FR IIs, or vice versa, is similar to blazars. We consider the beaming to be an important rule within this changing-look phenomenon, making our line of sight to the central core unobscured for FR IIs but obscured for FR Is. Thus, we believe the beaming effect and the variations of the jets bulk Lorentz factor, as well as the sudden change in accretion rate, account for the changing-look in the broad-line sources.

5.3. Why Are FR IIs Fewer Than FR Is in the Fermi-LAT Source Catalog?

The Fermi-LAT Source Catalog has revealed a puzzling discrepancy between the number of FR I and FR II sources, which prompts us to investigate the cause of this imbalance. Our analysis shows that the Fermi telescope tends to favor sources that are more jet-dominated and have larger Doppler factors and core-dominance parameters. We consider this is also similar in answering why FR IIs are the less detected objects than FR Is in Fermi-LAT catalog.
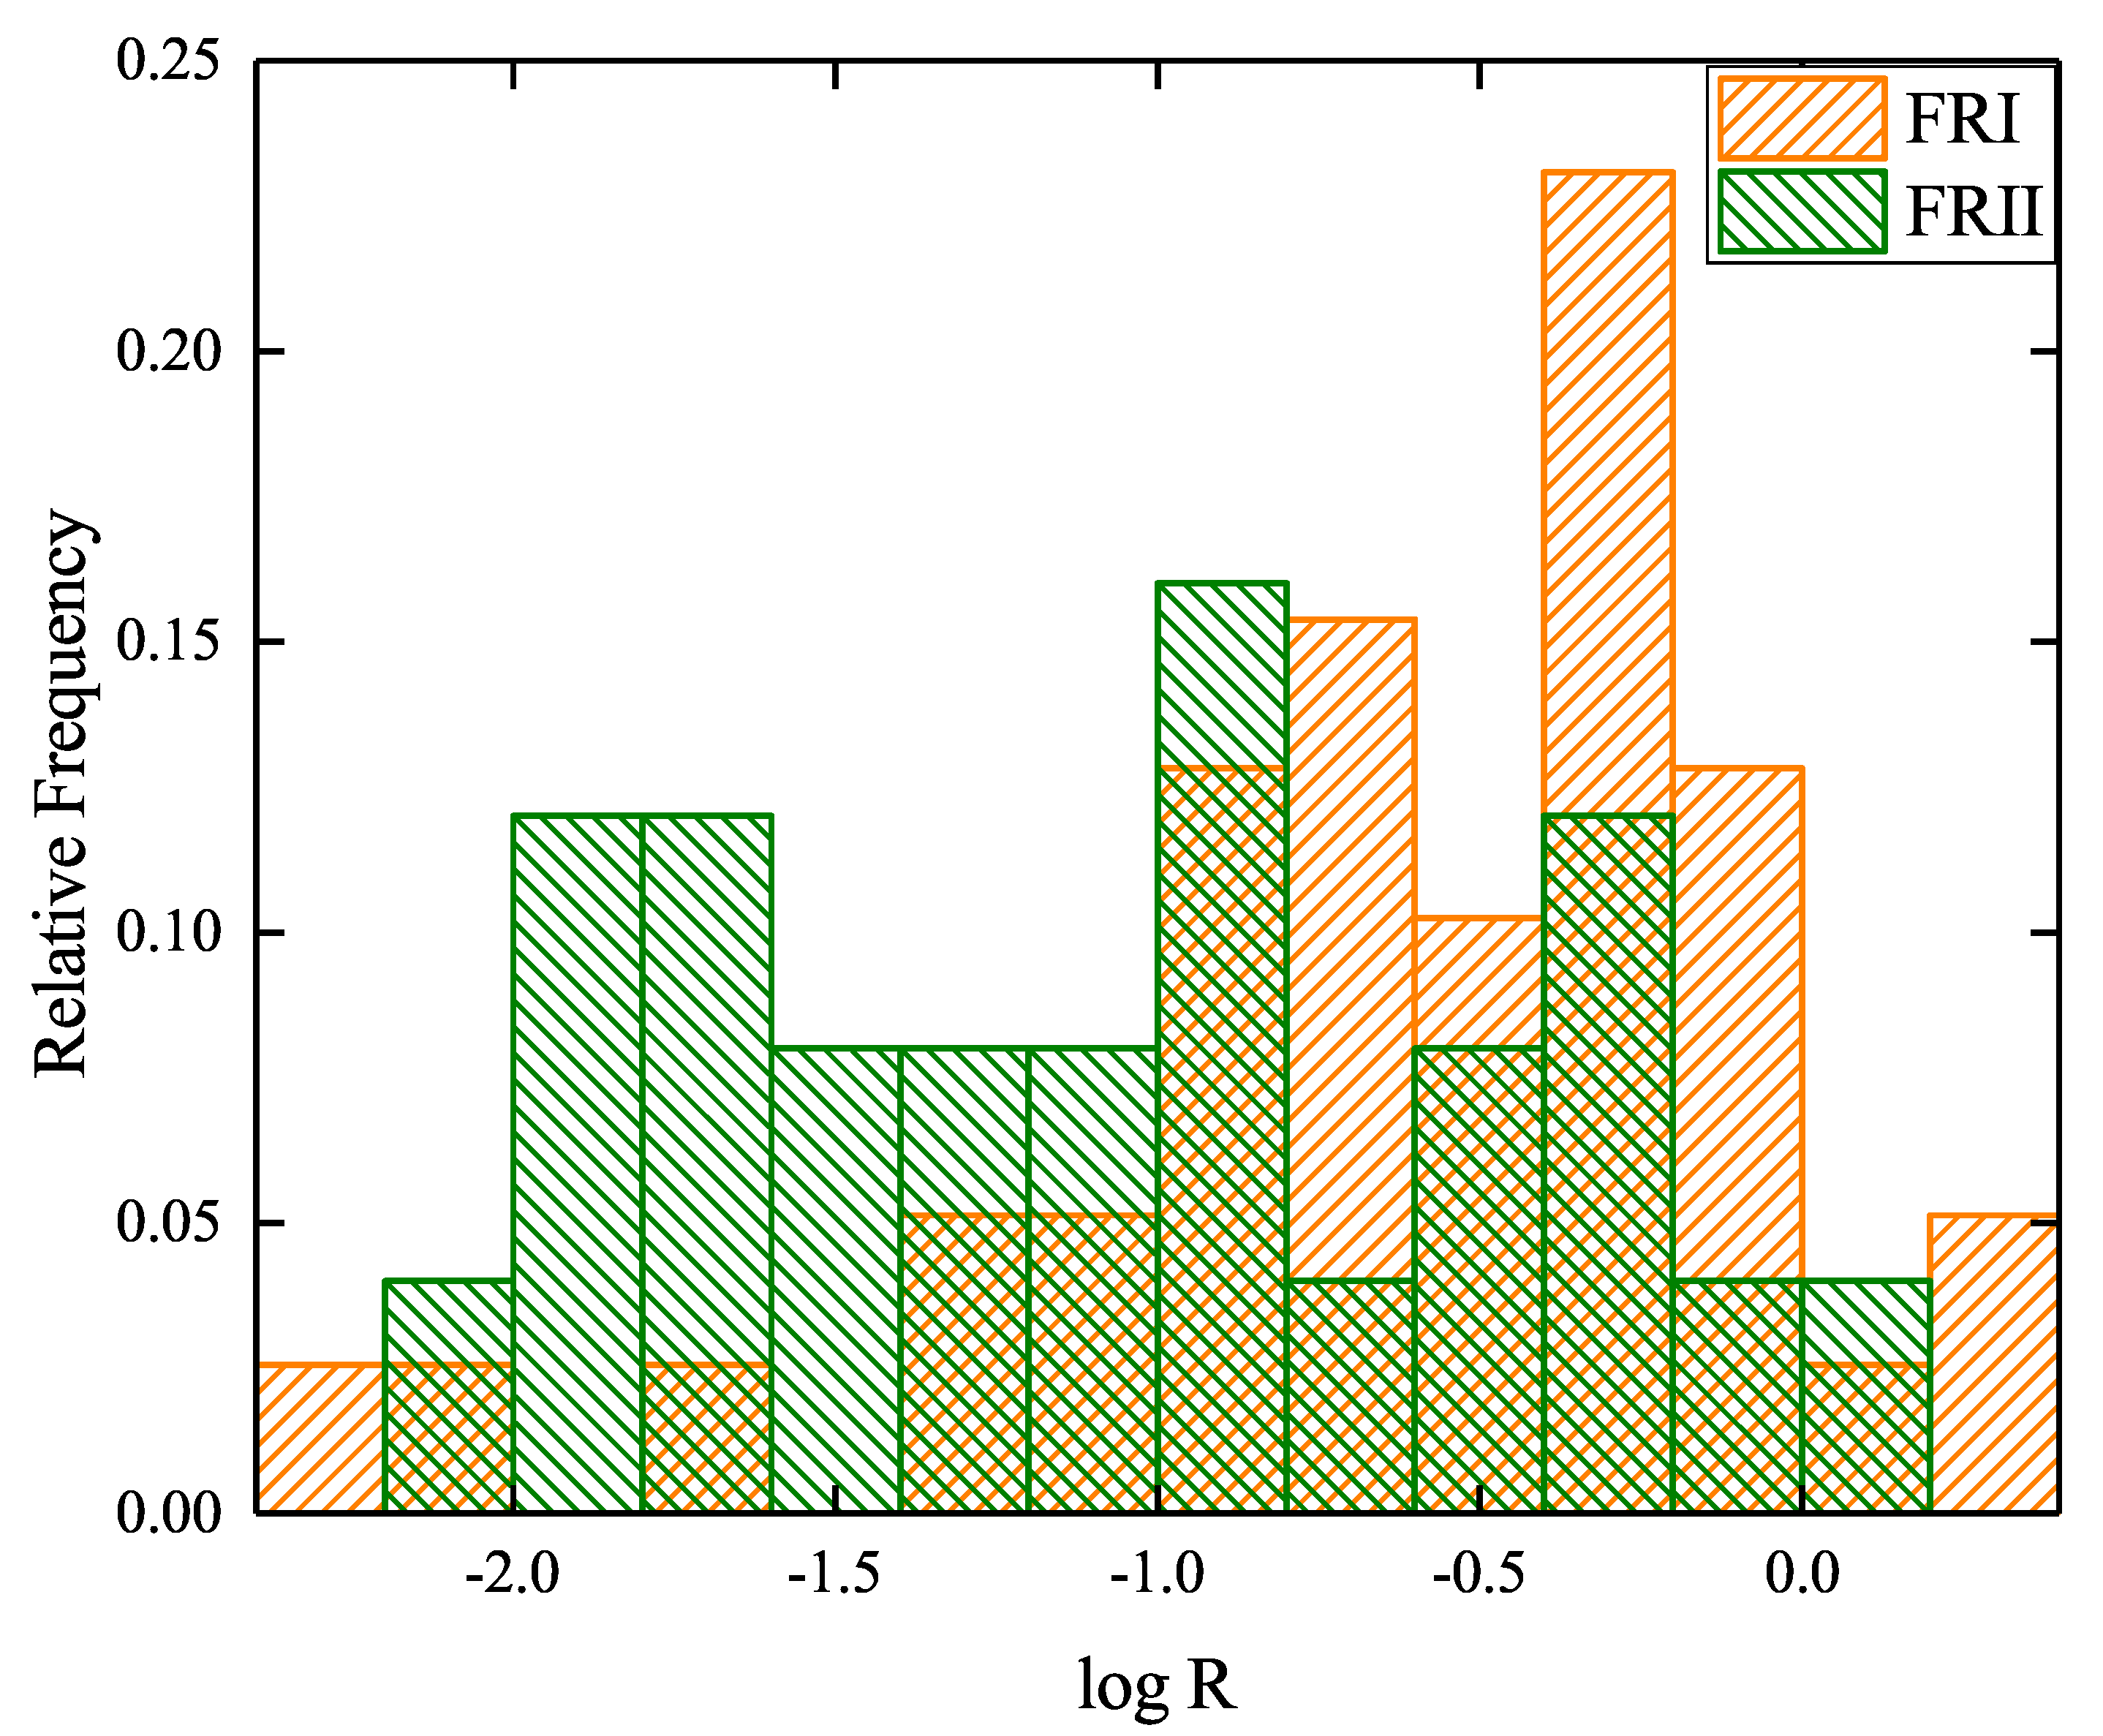
By comparing NFFRs and FFRs, we found significant differences in parameters such as log R , L 1.4 GHz , δ , and B. We also ascertain the difference in core dominance parameters between FR Is and FR IIs objects (same as above, we do not distinguish whether they are listed in the Fermi-LAT catalog or not). The averaged values are R FR Is = 0.61 and R FR IIs = 1.05 , respectively. The distribution of R is displayed in Figure 11. The KS test shows this difference is significant at a confidence level of 95 % . A similar comparison was also found in Pei et al. [36]. In particular, the core radio flux for FR Is and FR IIs is F core FRIs = 261.05 mJy, and F core FRIIs = 158.53 mJy on average. These results reveal that FR Is are more emission-core-dominated than FR IIs. In other words, FR I galaxies exhibit higher beaming than FR II sources. Since the Doppler boosting is stronger and the beaming cone will be narrower compared with synchrotron processes if the emission is due to External Compton (EC) scattering within jets, and if the high energy emission is dominated by the EC process in powerful radio sources and by Synchrotron Self-Compton (SSC) process in low-power radio galaxies, a beaming difference may account for the handful of FR IIs detected by Fermi-LAT compared with FR Is. Studied from seven nearby FR Is and four FR IIs, Abdo et al. [68] conclude that the small number of FRIIs with LAT associations could be due to the fewer nearby FRIIs than FRI sources and to different beaming factors of the emission in the jets of FRII and FRI radio galaxies. Hardcastle et al. [69] suggest that almost all the energy supplied by the beam is used to excite the lobe electron population and to do work on the external medium, and very little of it is radiated away in jets. This may be a reason for the lack of FR IIs detected by Fermi.
There may be intrinsic differences in the jets of FR IIs and FR Is that affect their γ -ray emission. FR IIs are known to have more powerful and faster-moving jets than FR Is, which could make it more difficult for their high-energy emission to reach us, especially if the jet is oriented at an angle that is not favorable for detection [70]. For FR Is, Georganopoulos, Markos and Kazanas, Demosthenes [71] presented a decelerating relativistic flow perspective in the TeV AGNs. It shows that the SSC emission by plasma in relativistic motion with a rather modest Lorentz factor Γ = 15 will decelerate to values consistent with its kinematic state as inferred by recent radio interferometric observations, which can both produce good fits to the spectra. Meliani and Keppens [72] proposed a model, namely the decelerating relativistic two-component jets, which draws the idea that the FR Is jet would correspond to a two-component jet with a high energy flux contribution from the inner jet, whereas the FR IIs jet corresponds to relatively low energy fluxes in the inner jet, leading to a result that high-energy flux from the inner jet of FR Is is easier to be detected by Fermi. Grandi and Torresi [22] also proposed a new model based on the consideration that FR IIs are more Doppler-boosted and have narrower beaming cones when high-energy emission results from Compton scattering of jet environment photons (EC process) rather than synchrotron photons produced in the jet (SSC process) as in FR Is. However, it is difficult to detect FR IIs if they spend most of their time in a quiescent phase, and their elusiveness in γ -rays could also reflect the intrinsic jet differences.
In this work, we consider the core dominance parameter, or core flux, as an influence factor that explains why FR IIs are fewer than FR Is in the Fermi-LAT catalog. The radio emission originating from the core is stronger in FR Is than that in FR IIs, which makes the FR I objects are possibly jet-dominated, favoring them to be preferentially caught by the Fermi telescope. Our finding weakens the hypothesis that the FR IIs are missed because they are too far away.

5.4. Can NFFRs Be Detected by CTA?

The Cherenkov Telescope Array observatory (CTA) is expected to be a powerful instrument for studying γ -ray emission from radio galaxies, especially those that are not detected by Fermi. According to Angioni et al. [73], the CTA will be able to detect about 50 radio galaxies in the northern hemisphere and about 30 in the southern hemisphere, with a detection significance of more than 5 sigma. This is an improvement over the current Fermi-LAT catalog. The CTA will also have a better angular resolution than Fermi-LAT, which will allow it to resolve the spatial structure of the γ -ray emission from radio galaxies. This will help to distinguish between different emission models, such as the one-zone synchrotron self-compton (SSC) model, the two-zone SSC model, or the hadronic model. Covering a huge range in photon energy from 20 GeV to 300 TeV, CTA will improve on all aspects of performance with respect to current instruments [74].
Some of the radio galaxies that are not detected by Fermi-LAT may be within reach of CTA because they have a harder γ -ray spectrum that peaks at higher energies. For example, 3C 018 is a radio galaxy with a redshift of z = 0.188. It has a bright radio core and two extended lobes that emit synchrotron radiation. It is also a source of X-ray emission, detected by ROSAT and Chandra. However, it has not been detected by Fermi-LAT in the GeV band, despite being one of the brightest radio galaxies in the sky. The CTA may be able to detect 3C 018 in the GeV-TeV range if its gamma-ray emission is produced by inverse Compton scattering of cosmic microwave background (CMB) photons or infrared photons from the dusty torus. According to Hodgson et al. [75], the CTA will have a sensitivity of about 10 13 erg / cm 2 / s in the energy range of 0.1−10 TeV, which is sufficient to detect 3C 018 if its γ -ray flux is above this level. For more radio sources, if we can estimate the flux and compare the predicted flux with the sensitivity of CTA, we can conclude whether the sources are detectable by CTA.

6. Conclusions

Based on the radio power at a frequency of 175 MHz, two sub-groups are categorized: low-luminosity Fanaroff-Riley type I radio galaxies are showing a rather compact emission arising from close to the core, while high-luminosity FR II radio galaxies are displaying the structure that the radio lobes are dominant and most of the emission appears to originate from the far end of the extended emission. Aiming to reveal why the radio galaxies seem to be detected in GeV emission, we collect 59 γ -ray radio galaxies detected by Fermi-LAT and 379 galaxies that do not show γ -ray emission to compare the two samples and analyze them by using some physical parameters, e.g., radio luminosity and loudness, core dominance parameters, Doppler factors for FR Is, and central black hole mass. Our principal finding is that there are significant diversities between FFRs and NFFRs, which can probably be explained by their different influences on beaming. According to the study by Xiao et al. [76], Fermi-detected sources have higher proper motions, apparent velocities, Doppler factors, Lorentz factors, and smaller viewing angles than non-Fermi-detected sources. The results reveal that Fermi-detected sources show stronger beaming effects than non-Fermi-detected sources. Since the beaming effect may affect polarization, accretion rate, and jet speed, the data on these parameters could be useful in understanding why Fermi-LAT does not detect some radio galaxies. Additionally, Ghisellini and Tavecchio [77] studied the connection between accretion and jet properties. The observed broad line strength provides a measure of the ionizing luminosity of the accretion disc, while the γ -luminosity is a proxy for the bolometric non-thermal beamed jet emission. The study compares the broad emission line properties of these blazars with those of radio-quiet and radio-loud quasars present in the Sloan Digital Sky Survey to assess differences and similarities between the disc luminosity and the virial black hole mass. The knowledge of the black hole mass and disc luminosity helps constrain the jet parameters, such as the Lorentz factor. Sbarrato et al. [78] find a good correlation between the luminosity of the broad lines and the γ -ray luminosity. Fermi-LAT is widely used to detect γ -ray sources. Therefore, we believe that the broad line/narrow line emission and accretion disc may differ in Fermi-LAT detected compared with non-detected radio galaxies. This can be further investigated in our future work. The main conclusions of this work are as follows:
  • From our results of the comparison on 1.4 GHz radio luminosities and radio loudness parameters, we ascertain that FFRs are jet-dominant while NFFRs are disk-dominant sources.
  • Combining our discussion on the core dominance parameters and Doppler factors, we believe that the observed differences between FFRs and NFFRs are significantly related to the orientation of the jet with respect to the observer. We suggest that the NFFRs can be considered to have a weak jet beaming effect, and thus γ -ray emission is faint, making them difficult to be captured by Fermi-LAT.
  • We estimated the GeV flux at 1 GeV for all NFFRs using the positive correlation observed between the 1 GeV flux and radio flux at 1.4 GHz for FFRs with a γ -ray counterpart. We find that a handful of NFFRs are above the Fermi-LAT sensitivity threshold.
  • We also discuss an interesting issue about why FR II radio galaxies seem to be excluded in γ -ray emission. Since the Doppler boosting is stronger and the beaming cone will be narrower compared with synchrotron processes if the emission is due to External Compton (EC) scattering within jets, and if the high energy emission is dominated by the EC process in powerful radio sources and by Synchrotron Self-Compton (SSC) process in low-power radio galaxies, a beaming difference may account for the handful of FR IIs detected by Fermi-LAT compared with FR Is.
  • We set up a dividing line in the plane of radio flux versus black hole mass to effectively distinguish FR I and FR II sources. Thus, we first propose a “changing-look” phenomenon in radio galaxies, namely that some FR Is are masquerading as FR II galaxies due to the beaming effect, and vice versa.

Author Contributions

Conceptualization, Z.P., J.F. and J.Y.; methodology, Z.P., D.H. and J.Y.; formal analysis, D.H., X.Y. (Xuhong Ye), X.Y. (Xiao Ye), X.H. and J.L.; investigation, Y.Q., Z.L. and H.Z.; data curation, D.H., X.Y. (Xuhong Ye), C.L. and Z.P.; writing—original draft preparation, D.H.; writing—review and editing, D.H. and Z.P.; supervision, Z.P.; project administration, Z.P.; funding acquisition, Z.P. and J.F. All authors have read and agreed to the published version of the manuscript.

Funding

This research was funded by the National Science Foundation for Young Scientists of China (grant No. 12103012), China Postdoctoral Science Foundation (grant 2022M710868), National Natural Science Foundation of China (NSFC U2031201, NSFC 11733001, U2031112), Guangdong Major Project of Basic and Applied Basic Research (grant No. 2019B030302001), China Manned Space Project with No. CMS-CSST-2021-A06, “Challenge Cup” National Undergraduate Curricular Academic Science and Technology Works Competition (grant 2022TZBNAI2001) and China Scholarship Council with NO. 202208440164.

Data Availability Statement

Publicly available datasets were analyzed in this study. This data can be found here: (1) 4FGL, https://fermi.gsfc.nasa.gov/ssc/data/access/lat/10yrcatalog/; (2) NED, https://ned.ipac.caltech.edu/forms/byname.html; (3) Astrogeo VLBI FITS image database: http://astrogeo.org/. The data presented in this study are available on request from the corresponding author.

Acknowledgments

Z.P. acknowledges support from the National Science Foundation for Young Scientists of China (grant No. 12103012), and China Postdoctoral Science Foundation (grant 2022M710868). D.H. acknowledges support from Guangzhou University and the “Challenge Cup” National Undergraduate Curricular Academic Science and Technology Works Competition (grant 2022TZBNAI2001). X.Y. acknowledges the support (NO. 202208440164) from the China Scholarship Council (CSC). This work is also partially supported by the National Natural Science Foundation of China (NSFC U2031201, NSFC 11733001, U2031112), Guangdong Major Project of Basic and Applied Basic Research (grant No. 2019B030302001). We also acknowledge the science research grants from the China Manned Space Project with No. CMS-CSST-2021-A06 and the support for Astrophysics Key Subjects of Guangdong Province and Guangzhou City.

Conflicts of Interest

The authors declare no conflict of interest.

Notes

1
2
Astrogeo VLBI FITS image database maintained by Leonid Petrov: http://astrogeo.org/ (accessed on 24 April 2023).

References

  1. Samudre, A.; George, L.T.; Bansal, M.; Wadadekar, Y. Data-efficient classification of radio galaxies. Mon. Not. R. Astron. Soc. 2022, 509, 2269–2280. [Google Scholar] [CrossRef]
  2. Arras, P.; Frank, P.; Haim, P.; Knollmüller, J.; Leike, R.; Reinecke, M.; Enßlin, T. Variable structures in M87* from space, time and frequency resolved interferometry. Nat. Astron. 2022, 6, 259–269. [Google Scholar] [CrossRef]
  3. Event Horizon Telescope Collaboration; Akiyama, K.; Algaba, J.C.; Alberdi, A.; Alef, W.; Anantua, R.; Asada, K.; Azulay, R.; Baczko, A.K.; Ball, D.; et al. First M87 Event Horizon Telescope Results. VII. Polarization of the Ring. Astrophys. J. Lett. 2021, 910, L12. [Google Scholar] [CrossRef]
  4. Sijbring, D.; de Bruyn, A.G. Multifrequency radio continuum observations of head-tail galaxies in the Perseus cluster. Astron. Astrophys. 1998, 331, 901–915. [Google Scholar]
  5. Owen, F.N.; Rudnick, L. Radio sources with wide-angle tails in Abell clusters of galaxies. Astrophys. J. Lett. 1976, 205, L1–L4. [Google Scholar] [CrossRef]
  6. Rudnick, L.; Owen, F.N. Interferometer observations of radio sources in clusters of galaxies. IV. Astron. J. 1977, 82, 1–20. [Google Scholar] [CrossRef]
  7. Massaglia, S.; Bodo, G.; Rossi, P.; Capetti, A.; Mignone, A. Making Fanaroff-Riley I radio sources. III. The effects of the magnetic field on relativistic jets’ propagation and source morphologies. Astron. Astrophys. 2022, 659, A139. [Google Scholar] [CrossRef]
  8. Fanaroff, B.L.; Riley, J.M. The morphology of extragalactic radio sources of high and low luminosity. Mon. Not. R. Astron. Soc. 1974, 167, 31P–36P. [Google Scholar] [CrossRef]
  9. Blandford, R.D.; Rees, M.J. Extended and compact extragalactic radio sources: Interpretation and theory. Phys. Scr. 1978, 17, 265–274. [Google Scholar] [CrossRef]
  10. Romero, G.E.; Cellone, S.A.; Combi, J.A.; Andruchow, I. Optical microvariability of EGRET blazars. Astron. Astrophys. 2002, 390, 431–438. [Google Scholar] [CrossRef]
  11. Fan, J.H.; Romero, G.E.; Wang, Y.X.; Zhang, J.S. Separation of Different Contributions to the Total X-ray Luminosity in Gamma-ray Loud Blazars. Chin. J. Astron. Astrophys. 2005, 5, 457–462. [Google Scholar] [CrossRef]
  12. Ghirlanda, G.; Ghisellini, G.; Tavecchio, F.; Foschini, L. Correlation of Fermi Large Area Telescope sources with the 20-GHz Australia Telescope Compact Array radio survey. Mon. Not. R. Astron. Soc. 2010, 407, 791–803. [Google Scholar] [CrossRef]
  13. Marscher, A.; Jorstad, S.G.; Larionov, V.M.; Aller, M.F.; Lähteenmäki, A. Multi-Waveband Emission Maps of Blazars. J. Astrophys. Astron. 2011, 32, 233–237. [Google Scholar] [CrossRef]
  14. Murphy, D.W.; Browne, I.W.A.; Perley, R.A. VLA obseravtions of a complete sample of core-dominated radio source. Mon. Not. R. Astron. Soc. 1993, 264, 298–318. [Google Scholar] [CrossRef]
  15. Antonucci, R. Unified models for active galactic nuclei and quasars. Annu. Rev. Astron. Astrophys. 1993, 31, 473–521. [Google Scholar] [CrossRef]
  16. Urry, C.M.; Padovani, P. Unified Schemes for Radio-Loud Active Galactic Nuclei. Publ. Astron. Soc. Pac. 1995, 107, 803. [Google Scholar] [CrossRef]
  17. Netzer, H. Revisiting the Unified Model of Active Galactic Nuclei. Annu. Rev. Astron. Astrophys. 2015, 53, 365–408. [Google Scholar] [CrossRef]
  18. Atwood, W.B.; Abdo, A.A.; Ackermann, M.; Althouse, W.; Anderson, B.; Axelsson, M.; Baldini, L.; Ballet, J.; Band, D.L.; Barbiellini, G.; et al. The Large Area Telescope on the Fermi Gamma-Ray Space Telescope Mission. Astrophys. J. 2009, 697, 1071–1102. [Google Scholar] [CrossRef]
  19. Abdollahi, S.; Acero, F.; Ackermann, M.; Ajello, M.; Atwood, W.B.; Axelsson, M.; Baldini, L.; Ballet, J.; Barbiellini, G.; Bastieri, D.; et al. Fermi Large Area Telescope Fourth Source Catalog. Astrophys. J. 2020, 247, 33. [Google Scholar] [CrossRef]
  20. Piner, B.G.; Pushkarev, A.B.; Kovalev, Y.Y.; Marvin, C.J.; Arenson, J.G.; Charlot, P.; Fey, A.L.; Collioud, A.; Voitsik, P.A. Relativistic Jets in the Radio Reference Frame Image Database. II. Blazar Jet Accelerations from the First 10 Years of Data (1994–2003). Astrophys. J. 2012, 758, 84. [Google Scholar] [CrossRef]
  21. Pushkarev, A.B.; Kovalev, Y.Y. Single-epoch VLBI imaging study of bright active galactic nuclei at 2 GHz and 8 GHz. Astron. Astrophys. 2012, 544, A34. [Google Scholar] [CrossRef]
  22. Grandi, P.; Torresi, E. Exploring the FRI/FRII radio dichotomy with the Fermi satellite. arXiv 2012, arXiv:1205.1686. [Google Scholar] [CrossRef]
  23. Pei, Z.Y.; Fan, J.H.; Liu, Y.; Yuan, Y.H.; Cai, W.; Xiao, H.B.; Lin, C.; Yang, J.H. Radio core dominance of Fermi blazars. Astrophys. Space Sci. 2016, 361, 237. [Google Scholar] [CrossRef]
  24. Pei, Z.; Fan, J.; Bastieri, D.; Yang, J.; Xiao, H. Radio core dominance of Fermi/LAT-detected AGNs. Sci. China Phys. Mech. Astron. 2020, 63, 259511. [Google Scholar] [CrossRef]
  25. Ye, X.H.; Zeng, X.T.; Huang, D.Y.; Zhang, Z.; Pei, Z.Y.; Fan, J.H. The Beaming Effect for Fermi-LAT-detected FR-I Radio Galaxies. Publ. Astron. Soc. Pac. 2023, 135, 014101. [Google Scholar] [CrossRef]
  26. Angioni, R.; Ros, E.; Kadler, M.; Ojha, R.; Müller, C.; Edwards, P.G.; Burd, P.R.; Carpenter, B.; Dutka, M.S.; Gulyaev, S.; et al. Gamma-ray emission in radio galaxies under the VLBI scope. I. Parsec-scale jet kinematics and high-energy properties of γ-ray-detected TANAMI radio galaxies. Astron. Astrophys. 2019, 627, A148. [Google Scholar] [CrossRef]
  27. Capetti, A.; Massaro, F.; Baldi, R.D. FRICAT: A FIRST catalog of FR I radio galaxies. Astron. Astrophys. 2017, 598, A49. [Google Scholar] [CrossRef]
  28. Capetti, A.; Massaro, F.; Baldi, R.D. FRIICAT: A FIRST catalog of FR II radio galaxies. Astron. Astrophys. 2017, 601, A81. [Google Scholar] [CrossRef]
  29. Magliocchetti, M.; Maddox, S.J.; Jackson, C.A.; Bland-Hawthorn, J.; Bridges, T.; Cannon, R.; Cole, S.; Colless, M.; Collins, C.; Couch, W.; et al. The 2dF Galaxy Redshift Survey: The population of nearby radio galaxies at the 1-mJy level. Mon. Not. R. Astron. Soc. 2002, 333, 100–120. [Google Scholar] [CrossRef]
  30. Casey, C.M.; Chapman, S.C.; Muxlow, T.W.B.; Beswick, R.J.; Alexander, D.M.; Conselice, C.J. Constraining star formation and AGN in z ~2 massive galaxies using high-resolution MERLIN radio observations. Mon. Not. R. Astron. Soc. 2009, 395, 1249–1256. [Google Scholar] [CrossRef]
  31. Shepherd, M.C. Difmap: An Interactive Program for Synthesis Imaging. In Astronomical Society of the Pacific Conference Series; Hunt, G., Payne, H., Eds.; Astronomical Society of the Pacific: San Francisco, CA, USA, 1997; Volume 125, p. 77. [Google Scholar]
  32. Strittmatter, P.A.; Hill, P.; Pauliny-Toth, I.I.K.; Steppe, H.; Witzel, A. Radio observations of optically selected quasars. Astron. Astrophys. 1980, 88, L12–L15. [Google Scholar]
  33. Xiao, H.; Zhu, J.; Fu, L.; Zhang, S.; Fan, J. The radio dichotomy of active galactic nuclei. Publ. Astron. Soc. Jpn. 2022, 74, 239–246. [Google Scholar] [CrossRef]
  34. Ghisellini, G.; Padovani, P.; Celotti, A.; Maraschi, L. Relativistic Bulk Motion in Active Galactic Nuclei. Astrophys. J. 1993, 407, 65. [Google Scholar] [CrossRef]
  35. Fan, J.H. Relation between BL Lacertae Objects and Flat-Spectrum Radio Quasars. Astrophys. J. Lett. 2003, 585, L23–L24. [Google Scholar] [CrossRef]
  36. Pei, Z.Y.; Fan, J.H.; Bastieri, D.; Sawangwit, U.; Yang, J.H. The relationship between the radio core-dominance parameter and spectral index in different classes of extragalactic radio sources (II). Res. Astron. Astrophys. 2019, 19, 070. [Google Scholar] [CrossRef]
  37. Pei, Z.Y.; Fan, J.H.; Bastieri, D.; Yang, J.H.; Xiao, H.B.; Yang, W.X. The relationship between the radio core-dominance parameter and spectral index in different classes of extragalactic radio sources (III). Res. Astron. Astrophys. 2020, 20, 025. [Google Scholar] [CrossRef]
  38. Giovannini, G.; Feretti, L.; Venturi, T.; Lara, L.; Marcaide, J.; Rioja, M.; Spangler, S.R.; Wehrle, A.E. VLBI Observations of a Complete Sample of Radio Galaxies. IV. The Radio Galaxies NGC 2484, 3C 109, and 3C 382. Astrophys. J. 1994, 435, 116. [Google Scholar] [CrossRef]
  39. Mattox, J.R.; Bertsch, D.L.; Chiang, J.; Dingus, B.L.; Fichtel, C.E.; Hartman, R.C.; Hunter, S.D.; Kanbach, G.; Kniffen, D.A.; Kwok, P.W.; et al. The EGRET Detection of Quasar 1633+382. Astrophys. J. 1993, 410, 609. [Google Scholar] [CrossRef]
  40. Lähteenmäki, A.; Valtaoja, E. Total Flux Density Variations in Extragalactic Radio Sources. III. Doppler Boosting Factors, Lorentz Factors, and Viewing Angles for Active Galactic Nuclei. Astrophys. J. 1999, 521, 493–501. [Google Scholar] [CrossRef]
  41. Liodakis, I.; Hovatta, T.; Huppenkothen, D.; Kiehlmann, S.; Max-Moerbeck, W.; Readhead, A.C.S. Constraining the Limiting Brightness Temperature and Doppler Factors for the Largest Sample of Radio-bright Blazars. Astrophys. J. 2018, 866, 137. [Google Scholar] [CrossRef]
  42. Chen, L. On the Jet Properties of γ-Ray-loud Active Galactic Nuclei. Astrophys. J. 2018, 235, 39. [Google Scholar] [CrossRef]
  43. Pei, Z.; Fan, J.; Yang, J.; Bastieri, D. The estimation of γ-ray Doppler factor for Fermi/LAT-detected blazars. Publ. Astron. Soc. Aust. 2020, 37, e043. [Google Scholar] [CrossRef]
  44. Zhang, L.; Chen, S.; Xiao, H.; Cai, J.; Fan, J. Doppler Factor Estimation for Fermi Blazars. Astrophys. J. 2020, 897, 10. [Google Scholar] [CrossRef]
  45. Lähteenmäki, A.; Valtaoja, E. Testing of Inverse Compton Models for Active Galactic Nuclei with Gamma-Ray and Radio Observations. Astrophys. J. 2003, 590, 95–108. [Google Scholar] [CrossRef]
  46. Kovalev, Y.Y.; Aller, H.D.; Aller, M.F.; Homan, D.C.; Kadler, M.; Kellermann, K.I.; Kovalev, Y.A.; Lister, M.L.; McCormick, M.J.; Pushkarev, A.B.; et al. The Relation Between AGN Gamma-Ray Emission and Parsec-Scale Radio Jets. Astrophys. J. Lett. 2009, 696, L17–L21. [Google Scholar] [CrossRef]
  47. Kayanoki, T.; Fukazawa, Y. Relationship between gamma-ray loudness and X-ray spectra of radio galaxies. Publ. Astron. Soc. Jpn. 2022, 74, 791–804. [Google Scholar] [CrossRef]
  48. Rulten, C.B.; Brown, A.M.; Chadwick, P.M. A search for Centaurus A-like features in the spectra of Fermi-LAT detected radio galaxies. Mon. Not. R. Astron. Soc. 2020, 492, 4666–4679. [Google Scholar] [CrossRef]
  49. Wu, Z.; Ho, L.C.; Zhuang, M.Y. An Elusive Population of Massive Disk Galaxies Hosting Double-lobed Radio-loud Active Galactic Nuclei. Astrophys. J. 2022, 941, 95. [Google Scholar] [CrossRef]
  50. Tadhunter, C. Radio AGN in the local universe: Unification, triggering and evolution. Astron. Astrophys. 2016, 24, 10. [Google Scholar] [CrossRef]
  51. Owen, F.N.; Ledlow, M.J. The FRI/Il Break and the Bivariate Luminosity Function in Abell Clusters of Galaxies. In Astronomical Society of the Pacific Conference Series; Bicknell, G.V., Dopita, M.A., Quinn, P.J., Eds.; Astronomical Society of the Pacific: San Francisco, CA, USA, 1994; Volume 54, p. 319. [Google Scholar]
  52. Kormendy, J.; Ho, L.C. Coevolution (Or Not) of Supermassive Black Holes and Host Galaxies. Annu. Rev. Astron. Astrophys. 2013, 51, 511–653. [Google Scholar] [CrossRef]
  53. Ghisellini, G.; Celotti, A. The dividing line between FR I and FR II radio-galaxies. Astron. Astrophys. 2001, 379, L1–L4. [Google Scholar] [CrossRef]
  54. Hearst, M.; Dumais, S.; Osuna, E.; Platt, J.; Scholkopf, B. Support vector machines. IEEE Intell. Syst. Their Appl. 1998, 13, 18–28. [Google Scholar] [CrossRef]
  55. Matt, G.; Guainazzi, M.; Maiolino, R. Changing look: From Compton-thick to Compton-thin, or the rebirth of fossil active galactic nuclei. Mon. Not. R. Astron. Soc. 2003, 342, 422–426. [Google Scholar] [CrossRef]
  56. Bianchi, S.; Guainazzi, M.; Matt, G.; Chiaberge, M.; Iwasawa, K.; Fiore, F.; Maiolino, R. A search for changing-look AGN in the Grossan catalog. Astron. Astrophys. 2005, 442, 185–194. [Google Scholar] [CrossRef]
  57. Mishra, H.D.; Dai, X.; Chen, P.; Cheng, J.; Jayasinghe, T.; Tucker, M.A.; Vallely, P.J.; Bersier, D.; Bose, S.; Do, A.; et al. The Changing Look Blazar B2 1420+32. arXiv 2021, arXiv:2103.08707. [Google Scholar] [CrossRef]
  58. Peña-Herazo, H.A.; Massaro, F.; Gu, M.; Paggi, A.; Landoni, M.; D’Abrusco, R.; Ricci, F.; Masetti, N.; Chavushyan, V. An Optical Overview of Blazars with LAMOST. I. Hunting Changing-look Blazars and New Redshift Estimates. Astron. J. 2021, 161, 196. [Google Scholar] [CrossRef]
  59. Peterson, B.M.; Ferrarese, L.; Gilbert, K.M.; Kaspi, S.; Malkan, M.A.; Maoz, D.; Merritt, D.; Netzer, H.; Onken, C.A.; Pogge, R.W.; et al. Central Masses and Broad-Line Region Sizes of Active Galactic Nuclei. II. A Homogeneous Analysis of a Large Reverberation-Mapping Database. Astrophys. J. 2004, 613, 682–699. [Google Scholar] [CrossRef]
  60. Sniegowska, M.; Czerny, B.; Bon, E.; Bon, N. Possible mechanism for multiple changing-look phenomena in active galactic nuclei. Astron. Astrophys. 2020, 641, A167. [Google Scholar] [CrossRef]
  61. Smith, M.G.; Carswell, R.F.; Whelan, J.A.J.; Wilkes, B.J.; Boksenberg, A.; Clowes, R.G.; Savage, A.; Cannon, R.D.; Wall, J.V. Observations of the Lyman limit in 19 QSOs. Mon. Not. R. Astron. Soc. 1981, 195, 437–449. [Google Scholar] [CrossRef]
  62. Calderone, G.; Ghisellini, G.; Colpi, M.; Dotti, M. Black hole mass estimate for a sample of radio-loud narrow-line Seyfert 1 galaxies. Mon. Not. R. Astron. Soc. 2013, 431, 210–239. [Google Scholar] [CrossRef]
  63. Chen, Y.; Gu, Q. The black hole mass, jet power and accretion in blazars and flat-spectrum radio-loud narrow-line Seyfert 1 galaxies. Astrophys. Space Sci. 2019, 364, 123. [Google Scholar] [CrossRef]
  64. Ghisellini, G.; Tavecchio, F. Rapid variability in TeV blazars: The case of PKS2155-304. Mon. Not. R. Astron. Soc. 2008, 386, L28–L32. [Google Scholar] [CrossRef]
  65. Ghisellini, G.; Tavecchio, F.; Foschini, L.; Ghirlanda, G. The transition between BL Lac objects and flat spectrum radio quasars. Mon. Not. R. Astron. Soc. 2011, 414, 2674–2689. [Google Scholar] [CrossRef]
  66. Pei, Z.; Fan, J.; Yang, J.; Huang, D.; Li, Z. The Estimation of Fundamental Physics Parameters for Fermi-LAT Blazars. Astrophys. J. 2022, 925, 97. [Google Scholar] [CrossRef]
  67. Godfrey, L.E.H.; Shabala, S.S. AGN Jet Kinetic Power and the Energy Budget of Radio Galaxy Lobes. Astrophys. J. 2013, 767, 12. [Google Scholar] [CrossRef]
  68. Abdo, A.A.; Ackermann, M.; Ajello, M.; Baldini, L.; Ballet, J.; Barbiellini, G.; Bastieri, D.; Bechtol, K.; Bellazzini, R.; Berenji, B.; et al. Fermi Large Area Telescope Observations of Misaligned Active Galactic Nuclei. Astrophys. J. 2010, 720, 912–922. [Google Scholar] [CrossRef]
  69. Hardcastle, M.J.; Alexander, P.; Pooley, G.G.; Riley, J.M. FR II radio galaxies with z<0.3 - II. Beaming and unification. Mon. Not. R. Astron. Soc. 1999, 304, 135–144. [Google Scholar] [CrossRef]
  70. Arshakian, T.G.; Longair, M.S. On the jet speeds of classical double radio sources. Mon. Not. R. Astron. Soc. 2004, 351, 727–732. [Google Scholar] [CrossRef]
  71. Kazanas, D.; Georganopoulos, M. Decelerating Flows in TeV Blazars: A Resolution to the BL Lacertae-FR I Unification Problem. Astrophys. J. 2003, 594, L27–L30. [Google Scholar] [CrossRef]
  72. Meliani, Z.; Keppens, R. Decelerating Relativistic Two-Component Jets. Astrophys. J. 2009, 705, 1594–1606. [Google Scholar] [CrossRef]
  73. Angioni, R.; Grandi, P.; Torresi, E.; Vignali, C.; Knödlseder, J. Radio galaxies from Fermi to the CTA. AIP Conf. Proc. 2017, 1792, 050006. [Google Scholar] [CrossRef]
  74. Cherenkov Telescope Array Consortium; Acharya, B.S.; Agudo, I.; Al Samarai, I.; Alfaro, R.; Alfaro, J.; Alispach, C.; Alves Batista, R.; Amans, J.P.; Amato, E.; et al. Science with the Cherenkov Telescope Array; World Scientific: Singapore, 2019. [Google Scholar] [CrossRef]
  75. Hodgson, J.A.; Rani, B.; Oh, J.; Marscher, A.; Jorstad, S.; Mizuno, Y.; Park, J.; Lee, S.S.; Trippe, S.; Mertens, F. A Detailed Kinematic Study of 3C 84 and Its Connection to γ-Rays. Astrophys. J. 2021, 914, 43. [Google Scholar] [CrossRef]
  76. Xiao, H.; Fan, J.; Yang, J.; Liu, Y.; Yuan, Y.; Tao, J.; Costantin, D.; Zhang, Y.; Pei, Z.; Zhang, L.; et al. Comparison between Fermi-detected and non-Fermi-detected superluminal sources. Sci. China Phys. Mech. Astron. 2019, 62, 129811. [Google Scholar] [CrossRef]
  77. Ghisellini, G.; Tavecchio, F. Fermi/LAT broad emission line blazars. Mon. Not. R. Astron. Soc. 2015, 448, 1060–1077. [Google Scholar] [CrossRef]
  78. Sbarrato, T.; Ghisellini, G.; Maraschi, L.; Colpi, M. The relation between broad lines and γ-ray luminosities in Fermi blazars. Mon. Not. R. Astron. Soc. 2012, 421, 1764–1778. [Google Scholar] [CrossRef]
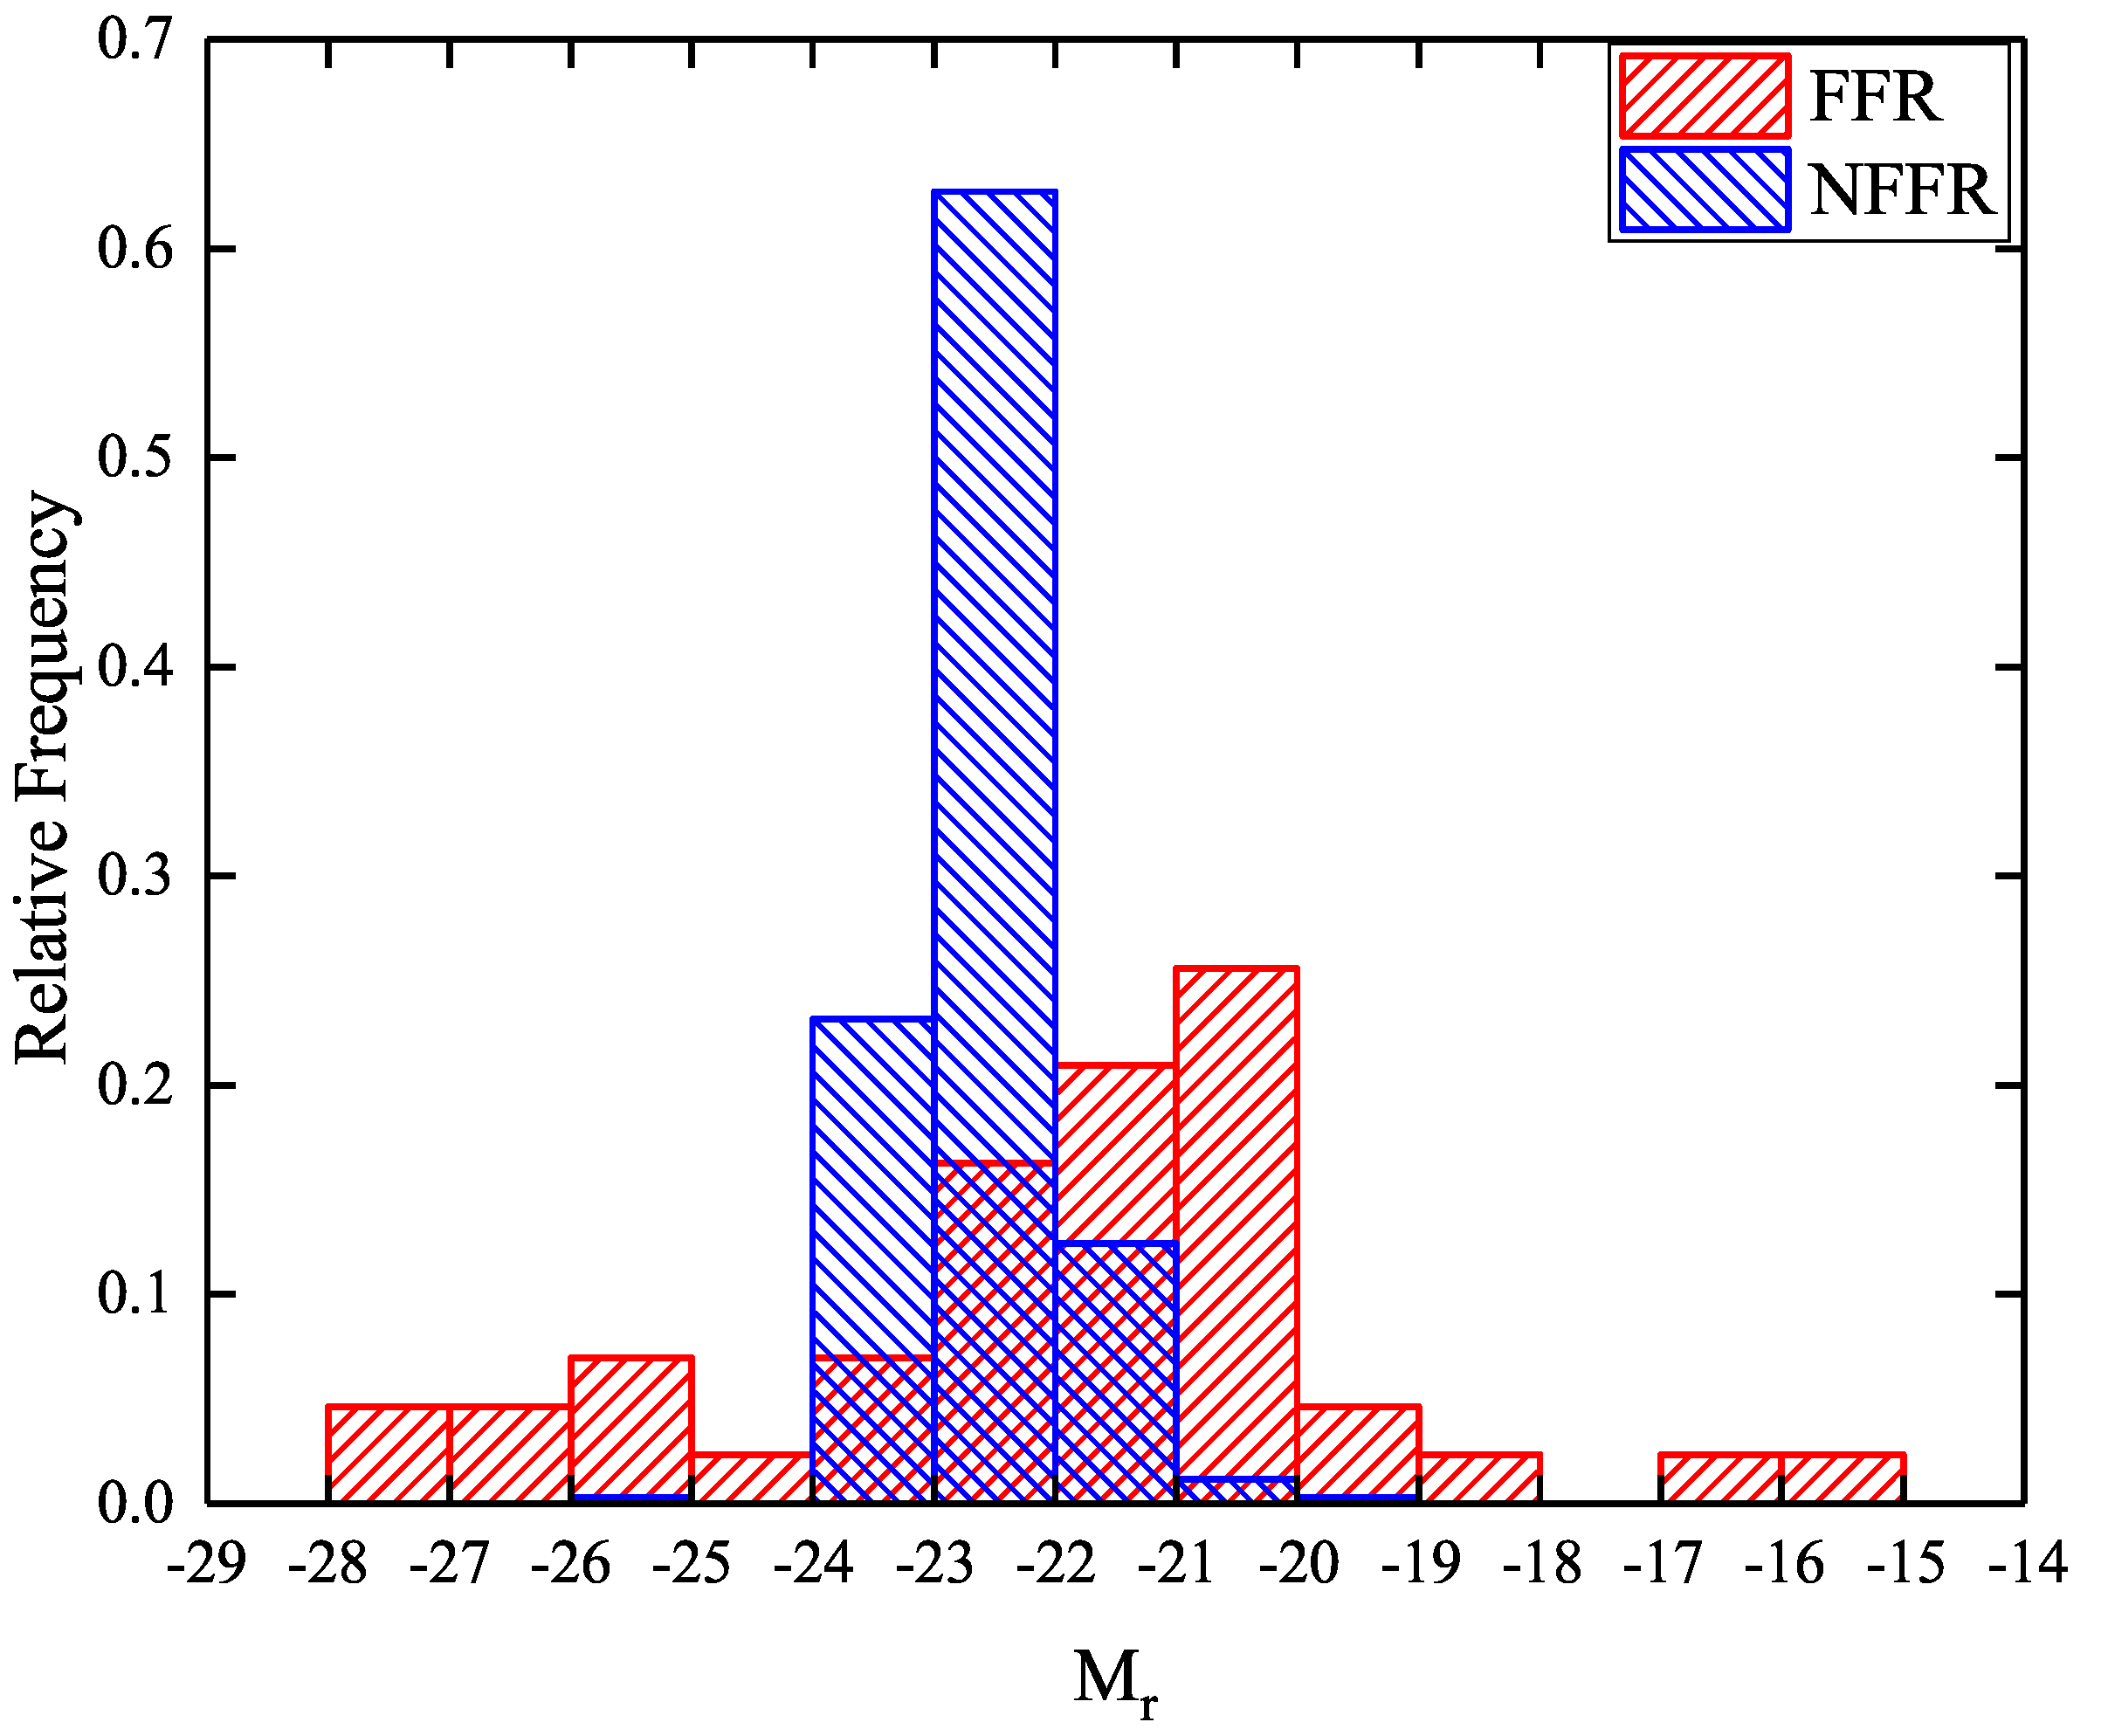
Figure 1. Distribution of absolute magnitude. The red area stands for the FFRs; the blue area is for the NFFRs.
Universe 09 00479 g001
Figure 2. Distribution of radio luminosity at 1.4 GHz in units of W Hz 1 .
Universe 09 00479 g002
Figure 3. Distribution of radio loudness.
Universe 09 00479 g003
Figure 4. Distribution of Doppler factor for FR Is.
Universe 09 00479 g004
Figure 5. Distribution of core-dominance parameter.
Universe 09 00479 g005
Figure 6. Distribution of radio core flux density in units of mJy.
Universe 09 00479 g006
Figure 7. Distribution of central black hole mass in units of M .
Universe 09 00479 g007
Figure 8. Correlation between γ -ray flux at 1 GeV and radio flux at 1.4 GHz for FFRs. There is a tight tendency that log F γ = ( 0.43 ± 0.09 ) log F 1.4 GHz ( 13.90 ± 0.28 ) .
Universe 09 00479 g008
Figure 9. Distribution of predicted γ -ray flux at 1 GeV for NFFRs.
Universe 09 00479 g009
Figure 10. Classification of FR type I (FR Is) and type II radio galaxies (FR IIs) on using machine learning method in the plot of radio luminosity against the black hole mass. The best dividing line is log L 1.4 Ghz = 1.27 M BH + 14.19 using a machine learning (ML) method.
Universe 09 00479 g010
Figure 11. Distribution of core-dominance parameter for FR Is and FR IIs.
Universe 09 00479 g011
Table 1. Sample of FFRs.
4FGLAssociatedClassz F 1.4 GHz log L 1.4 GHz m F opt M r B δ R M BH log f γ α
NameName (mJy)(W Hz 1 )(mag)(mJy) ( M ) (Jy)
(1)(2)(3)(4)(5)(6)(7)(8)(9)(10)(11)(12)(13)(14)(15)
J0009.7−3217IC 1531FRI0.02564164223.9812.0546.57 23.18 1.141.50 0.25 9.04 12.78 0.17
J0014.2+0854TXS 0011+086FRI0.1632325.625.4017.1913.69 20.55 1.381.13 0.78 12.83 0.53
J0028.8−0112PKS 0026−014FRI0.08337824.8216.460.80 21.30 2.670.470.21 13.13 0.29
Column (1) gives the 4FGL name; column (2) the associated name; column (3) the classification; column (4) redshift; column (5) the flux density in 1.4 GeV in units of mJy; column (6) the radio luminosity in units of W Hz 1 ; column (7) the optical apparent magnitude; column (8) optical flux density in units of mJy; column (9) absolute magnitude; column (10) the radio loudness; column (11) Doppler factor; column (12) core-dominance parameter; column (13) the logarithm of black hole mass in units of M ; column (14) the γ -ray flux at 1 GeV in units of Jy, and column (15) spectral index between the frequencies 1.4 and 5 GHz, defined as S ν ν α .
Table 2. Sample of NFFRs.
Associated NameClassz F 1.4 GHz log L 1.4 GHz m F opt M r B δ R M BH log F γ pre α
(mJy)(W Hz 1 )(mag)(mJy) ( M ) (Jy)
(1)(2)(3)(4)(5)(6)(7)(8)(9)(10)(11)(12)(13)(14)
SDSS J001247.57+004715.8FRII0.14862.724.5916.350.89 22.95 1.850.34 8.6 13.13 0.68
SDSS J002107.62−005531.4FRII0.108112.924.5515.352.23 23.21 1.700.35 8.5 13.02 0.48
0034−014BFRII0.0736440025.7215.182.60 22.31 3.230.72 1.65 12.34 0.81
Column (1) gives the associated name; column (2) the classification; column (3) redshift; column (4) the flux density in 1.4 GeV in units of mJy; column (5) the radio luminosity in units of W Hz 1 ; column (6) the optical apparent magnitude; column (7) the optical flux density in units of mJy; column (8) the absolute magnitude; column (9) the radio loudness; column (10) the Doppler factor; column (11) the core-dominance parameter; column (12) the logarithm of black hole mass in units of M ; column (13) the predicted γ -ray flux at 1 GeV in units of Jy, and column (14) the radio spectral index between 1.4 and 5 GHz.
Table 3. Results of KS tests comparing properties of FFRs and NFFRs.
ParameterKS StatisticProbabilityNFFRsFFRsAverage (NFFRs)Average (FFRs)
M r 0.482.18 × 10−835443 22.66 21.56
log L 1.4 GHz 0.335.68 × 10−53645324.3824.86
B0.521.71 × 10−9353431.742.89
δ (for FR Is)0.583.59 × 10−9212310.210.49
R0.507.30 × 10−53247 1.25 0.55
M BH 0.441.07 × 10−4337258.498.78
Kolmogorov–Smirnov test results on comparing different parameters of Fermi-detected FRs (FFRs) and non-Fermi-detected FRs (NFFRs).
Disclaimer/Publisher’s Note: The statements, opinions and data contained in all publications are solely those of the individual author(s) and contributor(s) and not of MDPI and/or the editor(s). MDPI and/or the editor(s) disclaim responsibility for any injury to people or property resulting from any ideas, methods, instructions or products referred to in the content.