
Challenges of the Standard Cosmological Model


Abstract
:1. Introduction
2. The Tension
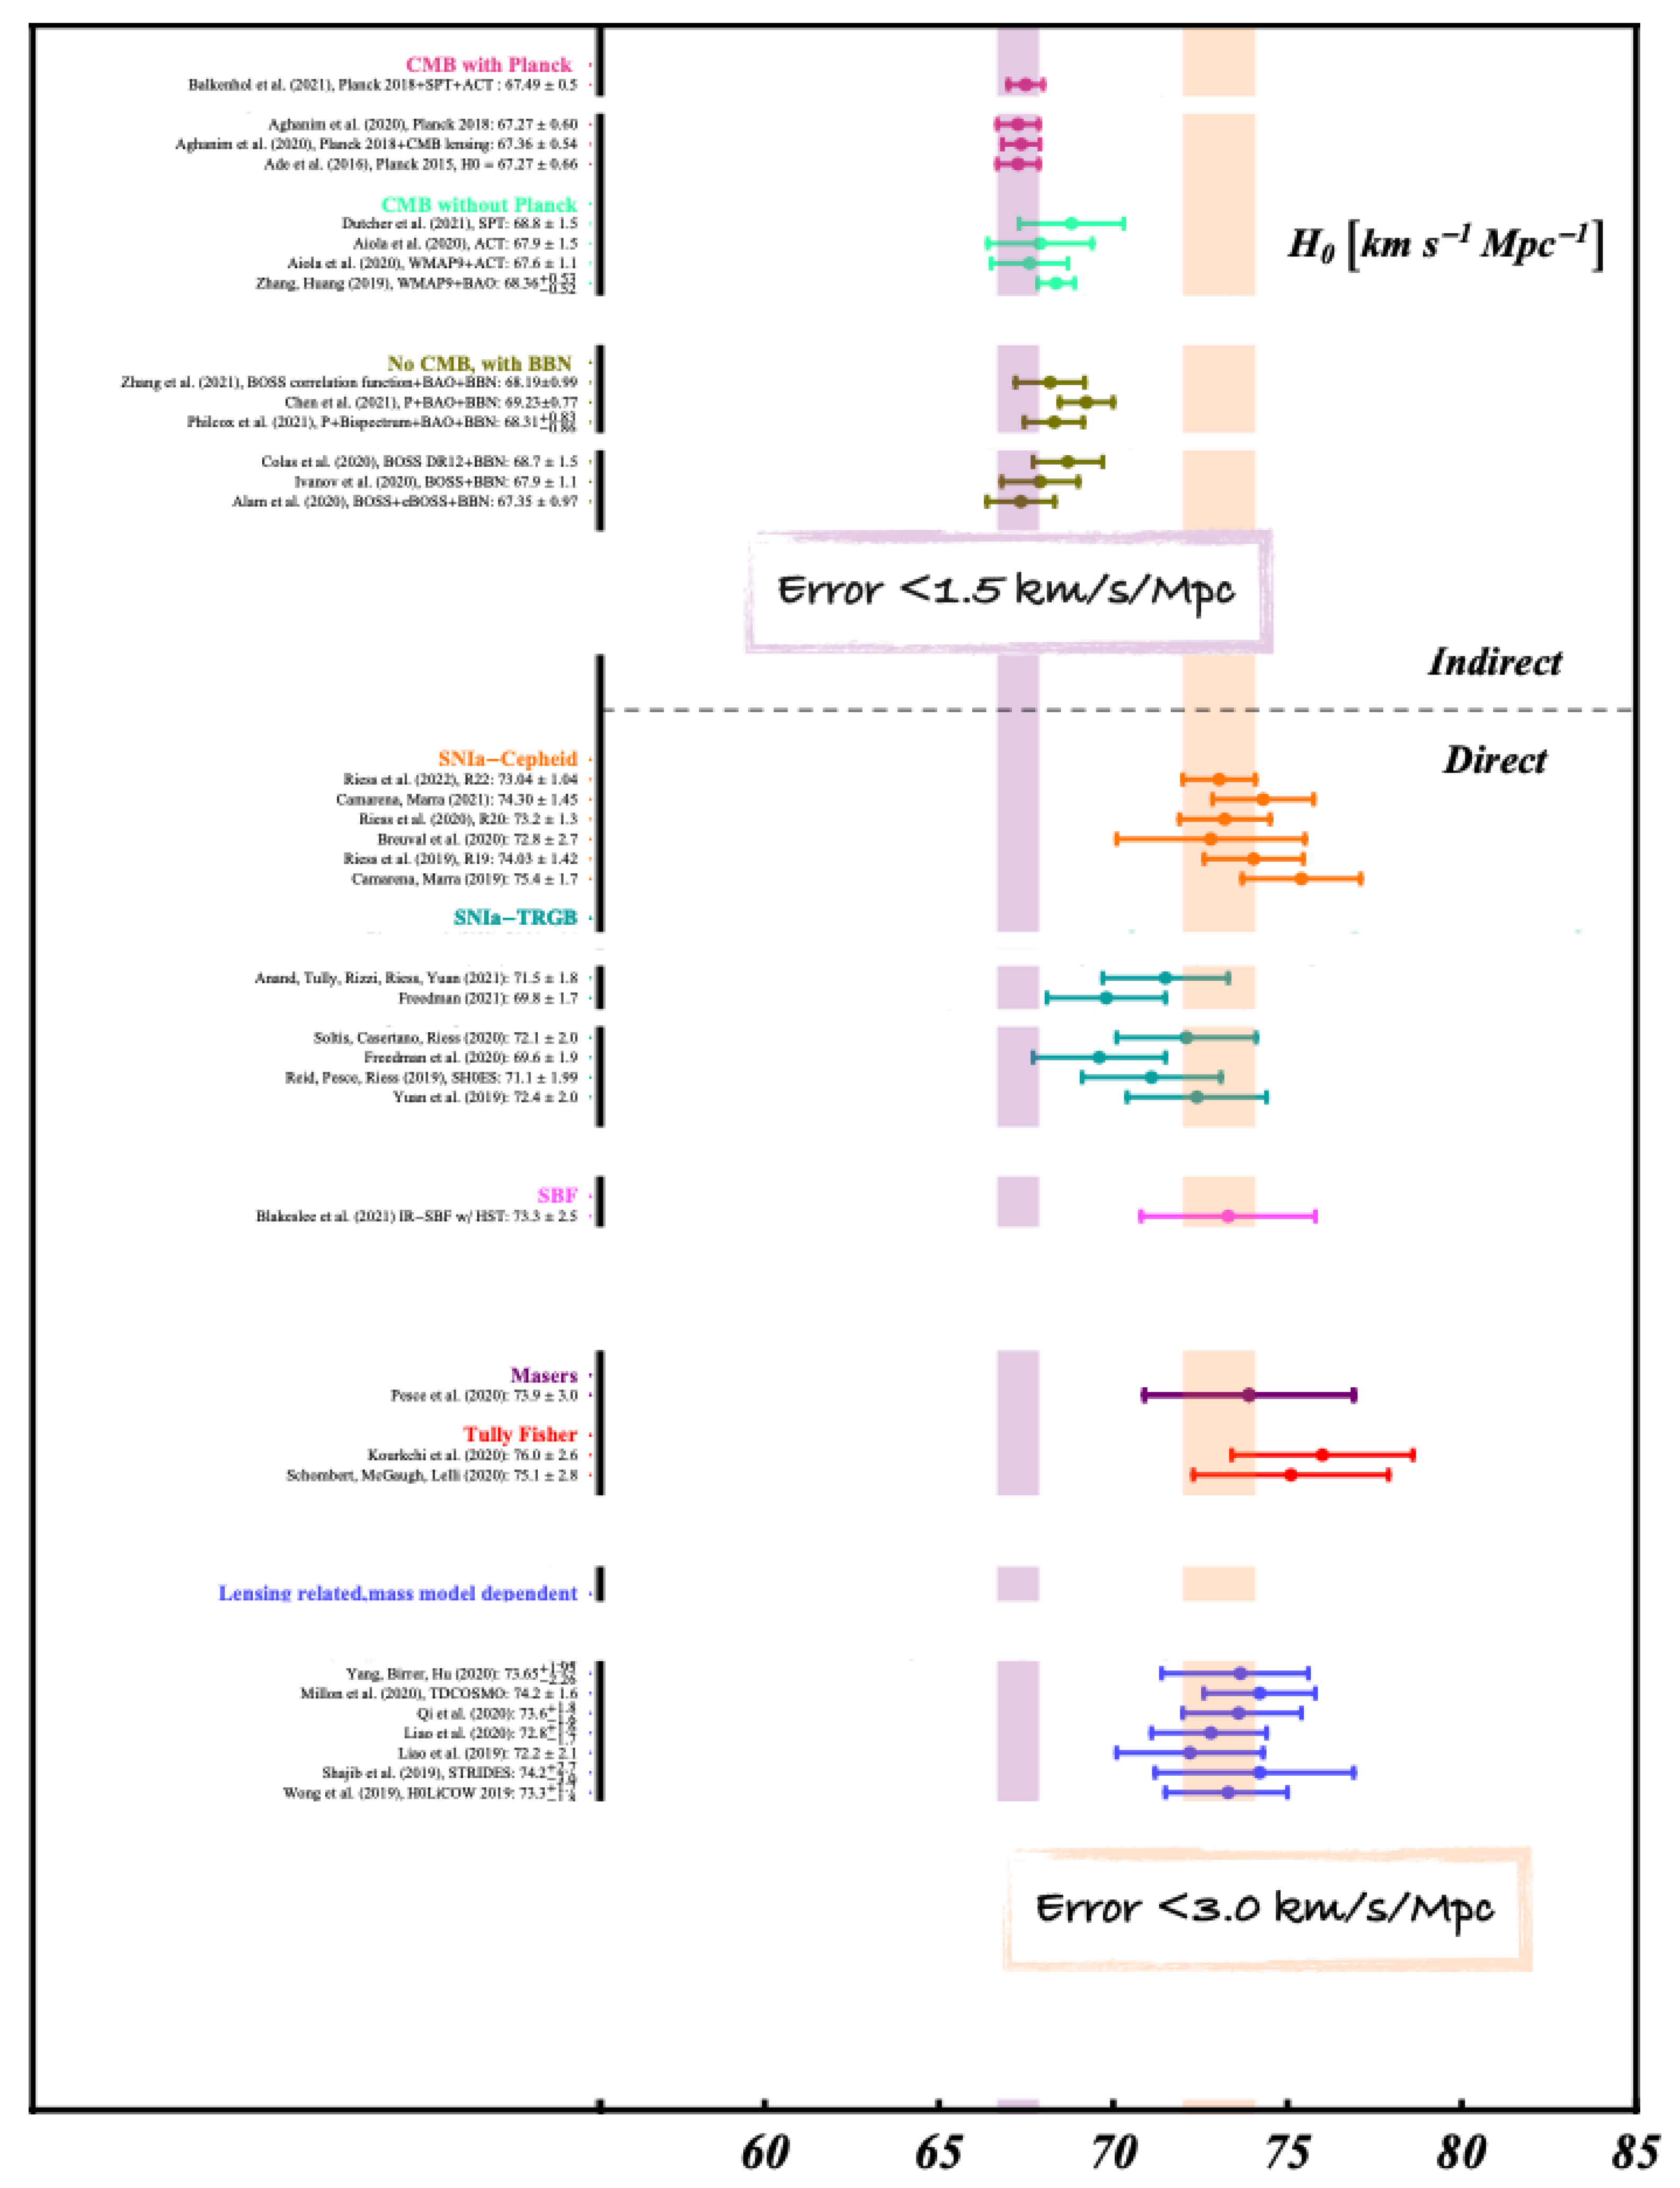
2.1. The Measurements
2.2. Looking for a Solution beyond Systematic Errors
2.2.1. The Plane
2.2.2. The Tension
2.2.3. The Plane
3. Additional Anomalies and Tensions
3.1. The Tension
3.2. The Anomaly
3.3. The Tension
3.4. The CMB Ground-Based Experiments
4. Conclusions
Funding
Institutional Review Board Statement
Informed Consent Statement
Data Availability Statement
Conflicts of Interest
| 1 | The SNOWMASS planning exercise (https://snowmass21.org/start, accessed on 2 July 2022) is a scientific study aimed at identifying the long-term strategy of the particle physics community in the US. This is usually followed by a project prioritization panel to provide specific recommendations for funding agencies. |
| 2 | A sample code for producing similar figures with any choice of the data is made publicly available online at github.com/lucavisinelli/H0TensionRealm, accessed on 2 July 2022). |
| 3 | |
| 4 | It was recently shown in Ref. [81] that the significance of seems to be reduced in the new Planck PR4 release with CamSpec. However, looking at Table 6 of Ref. [81], it is clear that the problem in the temperature power spectrum is not solved and the significance of is unchanged for this probe, but the reduction of its significance is due to the modification of the EE power spectrum, which is shifting all the parameters towards CDM. However, this change in EE is also producing a significant shift in the acoustic scale parameter (see Figure 15 of Ref. [81]), and a tension at more than between TT and EE, but more significantly, the reduced values show a more than tension with the best-fit TT and TTTEEE LCDM model, as shown in Table 1 of Ref. [81]. |
| 5 | Again, as discussed in the previous footnote, looking at Table 6 of Ref. [81], it is clear that the significance of from the temperature power spectrum is mostly unchanged for the new PR4 release with CamSpec. |
References
- Brout, R.; Englert, F.; Gunzig, E. The Creation of the Universe as a Quantum Phenomenon. Ann. Phys. 1978, 115, 78. [Google Scholar] [CrossRef]
- Guth, A.H. The Inflationary Universe: A Possible Solution to the Horizon and Flatness Problems. Phys. Rev. D 1981, 23, 347–356. [Google Scholar] [CrossRef]
- Sato, K. First Order Phase Transition of a Vacuum and Expansion of the Universe. Mon. Not. R. Astron. Soc. 1981, 195, 467–479. [Google Scholar] [CrossRef]
- Rubin, V.C.; Ford, W.K., Jr. Rotation of the Andromeda Nebula from a Spectroscopic Survey of Emission Regions. Astrophys. J. 1970, 159, 379–403. [Google Scholar] [CrossRef]
- Trimble, V. Existence and Nature of Dark Matter in the Universe. Ann. Rev. Astron. Astrophys. 1987, 25, 425–472. [Google Scholar] [CrossRef]
- Riess, A.G. et al. [Supernova Search Team]. Observational evidence from supernovae for an accelerating universe and a cosmological constant. Astron. J. 1998, 116, 1009–1038. [Google Scholar] [CrossRef]
- Perlmutter, S. et al. [Supernova Cosmology Project]. Measurements of Ω and Λ from 42 high redshift supernovae. Astrophys. J. 1999, 517, 565–586. [Google Scholar] [CrossRef]
- Hinshaw, G. et al. [WMAP]. Nine-Year Wilkinson Microwave Anisotropy Probe (WMAP) Observations: Cosmological Parameter Results. Astrophys. J. Suppl. 2013, 208, 19. [Google Scholar] [CrossRef]
- Beutler, F.; Blake, C.; Colless, M.; Jones, D.H.; Staveley-Smith, L.; Campbell, L.; Parker, Q.; Saunders, W.; Watson, F. The 6dF Galaxy Survey: Baryon Acoustic Oscillations and the Local Hubble Constant. Mon. Not. R. Astron. Soc. 2011, 416, 3017–3032. [Google Scholar] [CrossRef]
- Ross, A.J.; Samushia, L.; Howlett, C.; Percival, W.J.; Burden, A.; Manera, M. The clustering of the SDSS DR7 main Galaxy sample – I. A 4 per cent distance measure at z=0.15. Mon. Not. R. Astron. Soc. 2015, 449, 835–847. [Google Scholar] [CrossRef]
- Alam, S. et al. [BOSS]. The clustering of galaxies in the completed SDSS-III Baryon Oscillation Spectroscopic Survey: Cosmological analysis of the DR12 galaxy sample. Mon. Not. R. Astron. Soc. 2017, 470, 2617–2652. [Google Scholar] [CrossRef]
- Aghanim, N. et al. [Planck]. Planck 2018 results. VI. Cosmological parameters. Astron. Astrophys. 2021, 641, A6, Erratum: Astron. Astrophys. 2021, 652, C4. [Google Scholar] [CrossRef]
- Aiola, S. et al. [ACT]. The Atacama Cosmology Telescope: DR4 Maps and Cosmological Parameters. J. Cosmol. Astropart. Phys. 2020, 12, 047. [Google Scholar] [CrossRef]
- Balkenhol, L. et al. [SPT-3G]. Constraints on ΛCDM extensions from the SPT-3G 2018 EE and TE power spectra. Phys. Rev. D 2021, 104, 083509. [Google Scholar] [CrossRef]
- Alam, S. et al. [eBOSS]. Completed SDSS-IV extended Baryon Oscillation Spectroscopic Survey: Cosmological implications from two decades of spectroscopic surveys at the Apache Point Observatory. Phys. Rev. D 2021, 103, 083533. [Google Scholar] [CrossRef]
- Abbott, T.M.C. et al. [DES]. Dark Energy Survey Year 3 Results: Constraints on extensions to ΛCDM with weak lensing and galaxy clustering. arXiv 2022, arXiv:2207.05766. [Google Scholar]
- Abbott, T.M.C. et al. [DES]. Dark Energy Survey Year 3 results: Cosmological constraints from galaxy clustering and weak lensing. Phys. Rev. D 2022, 105, 023520. [Google Scholar] [CrossRef]
- Abdalla, E.; Abellán, G.F.; Aboubrahim, A.; Agnello, A.; Akarsu, O.; Akrami, Y.; Alestas, G.; Aloni, D.; Amendola, L.; Anchordoqui, L.A.; et al. Cosmology intertwined: A review of the particle physics, astrophysics, and cosmology associated with the cosmological tensions and anomalies. J. High Energy Astrophys. 2022, 34, 49–211. [Google Scholar] [CrossRef]
- Di Valentino, E.; Anchordoqui, L.A.; Akarsu, Ö.; Ali-Haimoud, Y.; Amendola, L.; Arendse, N.; Asgari, M.; Ballardini, M.; Basilakos, S.; Battistelli, E.; et al. Cosmology intertwined III: fσ8 and S8. Astropart. Phys. 2021, 131, 102604. [Google Scholar] [CrossRef]
- Di Valentino, E.; Anchordoqui, L.A.; Akarsu, Ö.; Ali-Haimoud, Y.; Amendola, L.; Arendse, N.; Asgari, M.; Ballardini, M.; Basilakos, S.; Battistelli, E.; et al. Snowmass2021—Letter of interest cosmology intertwined IV: The age of the Universe and its curvature. Astropart. Phys. 2021, 131, 102607. [Google Scholar] [CrossRef]
- Di Valentino, E.; Anchordoqui, L.A.; Akarsu, O.; Ali-Haimoud, Y.; Amendola, L.; Arendse, N.; Asgari, M.; Ballardini, M.; Basilakos, S.; Battistelli, E.; et al. Snowmass2021—Letter of interest cosmology intertwined I: Perspectives for the next decade. Astropart. Phys. 2021, 131, 102606. [Google Scholar] [CrossRef]
- Di Valentino, E.; Anchordoqui, L.A.; Akarsu, O.; Ali-Haimoud, Y.; Amendola, L.; Arendse, N.; Asgari, M.; Ballardini, M.; Basilakos, S.; Battistelli, E.; et al. Snowmass2021—Letter of interest cosmology intertwined II: The hubble constant tension. Astropart. Phys. 2021, 131, 102605. [Google Scholar] [CrossRef]
- Riess, A.G.; Yuan, W.; Macri, L.M.; Scolnic, D.; Brout, D.; Casertano, S.; Jones, D.O.; Murakami, Y.; Breuval, L.; Brink, T.G.; et al. A Comprehensive Measurement of the Local Value of the Hubble Constant with 1 km/s/Mpc Uncertainty from the Hubble Space Telescope and the SH0ES Team. arXiv 2021, arXiv:2112.04510. [Google Scholar] [CrossRef]
- Lewis, A.; Challinor, A.; Lasenby, A. Efficient computation of CMB anisotropies in closed FRW models. Astrophys. J. 2000, 538, 473–476. [Google Scholar] [CrossRef]
- Blas, D.; Lesgourgues, J.; Tram, T. The Cosmic Linear Anisotropy Solving System (CLASS) II: Approximation schemes. J. Cosmol. Astropart. Phys. 2011, 7, 034. [Google Scholar] [CrossRef]
- Lewis, A.; Bridle, S. Cosmological parameters from CMB and other data: A Monte Carlo approach. Phys. Rev. D 2002, 66, 103511. [Google Scholar] [CrossRef]
- Brinckmann, T.; Lesgourgues, J. MontePython 3: Boosted MCMC sampler and other features. Phys. Dark Univ. 2019, 24, 100260. [Google Scholar] [CrossRef]
- Zuntz, J.; Paterno, M.; Jennings, E.; Rudd, D.; Manzotti, A.; Dodelson, S.; Bridle, S.; Sehrish, S.; Kowalkowski, J. CosmoSIS: Modular cosmological parameter estimation. Astron. Comput. 2015, 12, 45–59. [Google Scholar] [CrossRef]
- Dutcher, D. et al. [SPT-3G]. Measurements of the E-mode polarization and temperature-E-mode correlation of the CMB from SPT-3G 2018 data. Phys. Rev. D 2021, 104, 022003. [Google Scholar] [CrossRef]
- Riess, A.G.; Casertano, S.; Yuan, W.; Bowers, J.B.; Macri, L.; Zinn, J.C.; Scolnic, D. Cosmic Distances Calibrated to 1% Precision with Gaia EDR3 Parallaxes and Hubble Space Telescope Photometry of 75 Milky Way Cepheids Confirm Tension with ΛCDM. Astrophys. J. Lett. 2021, 908, L6. [Google Scholar] [CrossRef]
- Breuval, L.; Kervella, P.; Anderson, R.I.; Riess, A.G.; Arenou, F.; Trahin, B.; Mérand, A.; Gallenne, A.; Gieren, W.; Storm, J.; et al. The Milky Way Cepheid Leavitt law based on Gaia DR2 parallaxes of companion stars and host open cluster populations. Astron. Astrophys. 2020, 643, A115. [Google Scholar] [CrossRef]
- Camarena, D.; Marra, V. On the use of the local prior on the absolute magnitude of Type Ia supernovae in cosmological inference. Mon. Not. R. Astron. Soc. 2021, 504, 5164–5171. [Google Scholar] [CrossRef]
- Freedman, W.L. Measurements of the Hubble Constant: Tensions in Perspective. Astrophys. J. 2021, 919, 16. [Google Scholar] [CrossRef]
- Soltis, J.; Casertano, S.; Riess, A.G. The Parallax of ω Centauri Measured from Gaia EDR3 and a Direct, Geometric Calibration of the Tip of the Red Giant Branch and the Hubble Constant. Astrophys. J. Lett. 2021, 908, L5. [Google Scholar] [CrossRef]
- Freedman, W.L.; Madore, B.F.; Hoyt, T.; Jang, I.S.; Beaton, R.; Lee, M.G.; Monson, A.; Neeley, J.; Rich, J. Calibration of the Tip of the Red Giant Branch (TRGB). arXiv 2020, arXiv:2002.01550. [Google Scholar]
- Anand, G.S.; Tully, R.B.; Rizzi, L.; Riess, A.G.; Yuan, W. Comparing Tip of the Red Giant Branch Distance Scales: An Independent Reduction of the Carnegie-Chicago Hubble Program and the Value of the Hubble Constant. Astrophys. J. 2022, 932, 15. [Google Scholar] [CrossRef]
- Jones, D.O.; Mandel, K.S.; Kirshner, R.P.; Thorp, S.; Challis, P.M.; Avelino, A.; Brout, D.; Burns, C.; Foley, R.J.; Pan, Y.C.; et al. Cosmological Results from the RAISIN Survey: Using Type Ia Supernovae in the Near Infrared as a Novel Path to Measure the Dark Energy Equation of State. arXiv 2022, arXiv:2201.07801. [Google Scholar] [CrossRef]
- Dhawan, S.; Goobar, A.; Johansson, J.; Jang, I.S.; Rigault, M.; Harvey, L.; Maguire, K.; Freedman, W.L.; Madore, B.F.; Smith, M.; et al. A Uniform Type Ia Supernova Distance Ladder with the Zwicky Transient Facility: Absolute Calibration Based on the Tip of the Red Giant Branch (TRGB) Method. arXiv 2022, arXiv:2203.04241. [Google Scholar]
- Blakeslee, J.P.; Jensen, J.B.; Ma, C.P.; Milne, P.A.; Greene, J.E. The Hubble Constant from Infrared Surface Brightness Fluctuation Distances. Astrophys. J. 2021, 911, 65. [Google Scholar] [CrossRef]
- Khetan, N.; Izzo, L.; Branchesi, M.; Wojtak, R.; Cantiello, M.; Murugeshan, C.; Agnello, A.; Valle, M.D.; Gall, C.; Hjorth, J.; et al. A new measurement of the Hubble constant using Type Ia supernovae calibrated with surface brightness fluctuations. Astron. Astrophys. 2021, 647, A72. [Google Scholar] [CrossRef]
- de Jaeger, T.; Stahl, B.E.; Zheng, W.; Filippenko, A.V.; Riess, A.G.; Galbany, L. A measurement of the Hubble constant from Type II supernovae. Mon. Not. R. Astron. Soc. 2020, 496, 3402–3411. [Google Scholar] [CrossRef]
- de Jaeger, T.; Galbany, L.; Riess, A.G.; Stahl, B.E.; Shappee, B.J.; Filippenko, A.V.; Zheng, W. A 5% measurement of the Hubble constant from Type II supernovae. arXiv 2022, arXiv:2203.08974. [Google Scholar] [CrossRef]
- Pesce, D.W.; Braatz, J.A.; Reid, M.J.; Riess, A.G.; Scolnic, D.; Condon, J.J.; Gao, F.; Henkel, C.; Impellizzeri, C.M.V.; Kuo, C.Y.; et al. The Megamaser Cosmology Project. XIII. Combined Hubble constant constraints. Astrophys. J. Lett. 2020, 891, L1. [Google Scholar] [CrossRef]
- Kourkchi, E.; Tully, R.B.; Anand, G.S.; Courtois, H.M.; Dupuy, A.; Neill, J.D.; Rizzi, L.; Seibert, M. Cosmicflows-4: The Calibration of Optical and Infrared Tully–Fisher Relations. Astrophys. J. 2020, 896, 3. [Google Scholar] [CrossRef]
- Schombert, J.; McGaugh, S.; Lelli, F. Using the Baryonic Tully–Fisher Relation to Measure Ho. Astron. J. 2020, 160, 71. [Google Scholar] [CrossRef]
- Liao, K.; Shafieloo, A.; Keeley, R.E.; Linder, E.V. Determining Model-independent H0 and Consistency Tests. Astrophys. J. Lett. 2020, 895, L29. [Google Scholar] [CrossRef]
- Qi, J.Z.; Zhao, J.W.; Cao, S.; Biesiada, M.; Liu, Y. Measurements of the Hubble constant and cosmic curvature with quasars: Ultracompact radio structure and strong gravitational lensing. Mon. Not. R. Astron. Soc. 2021, 503, 2179–2186. [Google Scholar] [CrossRef]
- Yang, T.; Birrer, S.; Hu, B. The first simultaneous measurement of Hubble constant and post-Newtonian parameter from Time-Delay Strong Lensing. Mon. Not. R. Astron. Soc. 2020, 497, L56–L61. [Google Scholar] [CrossRef]
- Birrer, S.; Shajib, A.J.; Galan, A.; Millon, M.; Treu, T.; Agnello, A.; Auger, M.; Chen, G.C.F.; Christensen, L.; Collett, T.; et al. TDCOSMO—IV. Hierarchical time-delay cosmography—Joint inference of the Hubble constant and galaxy density profiles. Astron. Astrophys. 2020, 643, A165. [Google Scholar] [CrossRef]
- Denzel, P.; Coles, J.P.; Saha, P.; Williams, L.L.R. The Hubble constant from eight time-delay galaxy lenses. Mon. Not. R. Astron. Soc. 2021, 501, 784–801. [Google Scholar] [CrossRef]
- Di Valentino, E. A combined analysis of the H0 late time direct measurements and the impact on the Dark Energy sector. Mon. Not. R. Astron. Soc. 2021, 502, 2065–2073. [Google Scholar] [CrossRef]
- Verde, L.; Treu, T.; Riess, A.G. Tensions between the Early and the Late Universe. Nat. Astron. 2019, 3, 891. [Google Scholar] [CrossRef]
- Riess, A.G. The Expansion of the Universe is Faster than Expected. Nat. Rev. Phys. 2019, 2, 10–12. [Google Scholar] [CrossRef]
- Knox, L.; Millea, M. Hubble constant hunter’s guide. Phys. Rev. D 2020, 101, 043533. [Google Scholar] [CrossRef]
- Di Valentino, E. The H0 Tensions to Discriminate Among Concurring Models. In Modified Gravity and Cosmology; Springer: Cham, Switzerland, 2021. [Google Scholar] [CrossRef]
- Jedamzik, K.; Pogosian, L.; Zhao, G.B. Why reducing the cosmic sound horizon alone can not fully resolve the Hubble tension. Commun. Phys. 2021, 4, 123. [Google Scholar] [CrossRef]
- Perivolaropoulos, L.; Skara, F. Challenges for ΛCDM: An update. arXiv 2021, arXiv:2105.05208. [Google Scholar] [CrossRef]
- Di Valentino, E.; Mena, O.; Pan, S.; Visinelli, L.; Yang, W.; Melchiorri, A.; Mota, D.F.; Riess, A.G.; Silk, J. In the realm of the Hubble tension—A review of solutions. Class. Quant. Grav. 2021, 38, 153001. [Google Scholar] [CrossRef]
- Shah, P.; Lemos, P.; Lahav, O. A buyer’s guide to the Hubble constant. Astron. Astrophys. Rev. 2021, 29, 9. [Google Scholar] [CrossRef]
- Vagnozzi, S. New physics in light of the H0 tension: An alternative view. Phys. Rev. D 2020, 102, 023518. [Google Scholar] [CrossRef]
- Poulin, V.; Smith, T.L.; Karwal, T.; Kamionkowski, M. Early Dark Energy Can Resolve The Hubble Tension. Phys. Rev. Lett. 2019, 122, 221301. [Google Scholar] [CrossRef]
- Di Valentino, E.; Melchiorri, A.; Silk, J. Reconciling Planck with the local value of H0 in extended parameter space. Phys. Lett. B 2016, 761, 242–246. [Google Scholar] [CrossRef]
- Di Valentino, E.; Melchiorri, A.; Mena, O.; Vagnozzi, S. Interacting dark energy in the early 2020s: A promising solution to the H0 and cosmic shear tensions. Phys. Dark Univ. 2020, 30, 100666. [Google Scholar] [CrossRef]
- Arendse, N.; Wojtak, R.J.; Agnello, A.; Chen, G.C.F.; Fassnacht, C.D.; Sluse, D.; Hilbert, S.; Millon, M.; Bonvin, V.; Wong, K.C.; et al. Cosmic dissonance: Are new physics or systematics behind a short sound horizon? Astron. Astrophys. 2020, 639, A57. [Google Scholar] [CrossRef]
- Glanville, A.; Howlett, C.; Davis, T.M. Full-Shape Galaxy Power Spectra and the Curvature Tension. arXiv 2022, arXiv:2205.05892. [Google Scholar]
- Heinesen, A.; Blake, C.; Wiltshire, D.L. Quantifying the accuracy of the Alcock-Paczyński scaling of baryon acoustic oscillation measurements. J. Cosmol. Astropart. Phys. 2020, 1, 038. [Google Scholar] [CrossRef]
- Bernal, J.L.; Smith, T.L.; Boddy, K.K.; Kamionkowski, M. Robustness of baryon acoustic oscillation constraints for early-Universe modifications of ΛCDM cosmology. Phys. Rev. D 2020, 102, 123515. [Google Scholar] [CrossRef]
- Sanchez, E.; Carnero, A.; Garcia-Bellido, J.; Gaztanaga, E.; de Simoni, F.; Crocce, M.; Cabre, A.; Fosalba, P.; Alonso, D. Tracing The Sound Horizon Scale With Photometric Redshift Surveys. Mon. Not. R. Astron. Soc. 2011, 411, 277–288. [Google Scholar] [CrossRef]
- Carvalho, G.C.; Bernui, A.; Benetti, M.; Carvalho, J.C.; Alcaniz, J.S. Baryon Acoustic Oscillations from the SDSS DR10 galaxies angular correlation function. Phys. Rev. D 2016, 93, 023530. [Google Scholar] [CrossRef]
- Alcaniz, J.S.; Carvalho, G.C.; Bernui, A.; Carvalho, J.C.; Benetti, M. Measuring baryon acoustic oscillations with angular two-point correlation function. Fundam. Theor. Phys. 2017, 187, 11–19. [Google Scholar] [CrossRef]
- de Carvalho, E.; Bernui, A.; Carvalho, G.C.; Novaes, C.P.; Xavier, H.S. Angular Baryon Acoustic Oscillation measure at z=2.225 from the SDSS quasar survey. J. Cosmol. Astropart. Phys. 2018, 4, 064. [Google Scholar] [CrossRef]
- Carvalho, G.C.; Bernui, A.; Benetti, M.; Carvalho, J.C.; de Carvalho, E.; Alcaniz, J.S. The transverse baryonic acoustic scale from the SDSS DR11 galaxies. Astropart. Phys. 2020, 119, 102432. [Google Scholar] [CrossRef]
- Camarena, D.; Marra, V. Local determination of the Hubble constant and the deceleration parameter. Phys. Rev. Res. 2020, 2, 013028. [Google Scholar] [CrossRef]
- Schöneberg, N.; Abellán, G.F.; Sánchez, A.P.; Witte, S.J.; Poulin, V.; Lesgourgues, J. The H0 Olympics: A fair ranking of proposed models. arXiv 2021, arXiv:2107.10291. [Google Scholar]
- Sekiguchi, T.; Takahashi, T. Early recombination as a solution to the H0 tension. Phys. Rev. D 2021, 103, 083507. [Google Scholar] [CrossRef]
- Efstathiou, G. To H0 or not to H0? Mon. Not. R. Astron. Soc. 2021, 505, 3866–3872. [Google Scholar] [CrossRef]
- Heymans, C.; Tröster, T.; Asgari, M.; Blake, C.; Hildebrandt, H.; Joachimi, B.; Kuijken, K.; Lin, C.A.; Sánchez, A.G.; van den Busch, J.L.; et al. KiDS-1000 Cosmology: Multi-probe weak gravitational lensing and spectroscopic galaxy clustering constraints. Astron. Astrophys. 2021, 646, A140. [Google Scholar] [CrossRef]
- Amon, A. et al. [DES]. Dark Energy Survey Year 3 results: Cosmology from cosmic shear and robustness to data calibration. Phys. Rev. D 2022, 105, 023514. [Google Scholar] [CrossRef]
- Calabrese, E.; Slosar, A.; Melchiorri, A.; Smoot, G.F.; Zahn, O. Cosmic Microwave Weak lensing data as a test for the dark universe. Phys. Rev. D 2008, 77, 123531. [Google Scholar] [CrossRef]
- Aghanim, N. et al. [Planck]. Planck 2018 results. VIII. Gravitational lensing. Astron. Astrophys. 2020, 641, A8. [Google Scholar] [CrossRef]
- Rosenberg, E.; Gratton, S.; Efstathiou, G. CMB power spectra and cosmological parameters from Planck PR4 with CamSpec. arXiv 2022, arXiv:2205.10869. [Google Scholar]
- Addison, G.E.; Huang, Y.; Watts, D.J.; Bennett, C.L.; Halpern, M.; Hinshaw, G.; Weiland, J.L. Quantifying discordance in the 2015 Planck CMB spectrum. Astrophys. J. 2016, 818, 132. [Google Scholar] [CrossRef]
- Di Valentino, E.; Bridle, S. Exploring the Tension between Current Cosmic Microwave Background and Cosmic Shear Data. Symmetry 2018, 10, 585. [Google Scholar] [CrossRef]
- Di Valentino, E.; Melchiorri, A.; Silk, J. Cosmological constraints in extended parameter space from the Planck 2018 Legacy release. J. Cosmol. Astropart. Phys. 2020, 1, 013. [Google Scholar] [CrossRef]
- Aghanim, N. et al. [Planck]. Planck 2018 results. V. CMB power spectra and likelihoods. Astron. Astrophys. 2020, 641, A5. [Google Scholar] [CrossRef]
- Di Valentino, E.; Melchiorri, A.; Silk, J. Planck evidence for a closed Universe and a possible crisis for cosmology. Nat. Astron. 2019, 4, 196–203. [Google Scholar] [CrossRef]
- Efstathiou, G. Is the low CMB quadrupole a signature of spatial curvature? Mon. Not. R. Astron. Soc. 2003, 343, L95. [Google Scholar] [CrossRef]
- Efstathiou, G.; Gratton, S. The evidence for a spatially flat Universe. Mon. Not. R. Astron. Soc. 2020, 496, L91–L95. [Google Scholar] [CrossRef]
- Handley, W. Curvature tension: Evidence for a closed Universe. Phys. Rev. D 2021, 103, L041301. [Google Scholar] [CrossRef]
- Vagnozzi, S.; Di Valentino, E.; Gariazzo, S.; Melchiorri, A.; Mena, O.; Silk, J. The galaxy power spectrum take on spatial curvature and cosmic concordance. Phys. Dark Univ. 2021, 33, 100851. [Google Scholar] [CrossRef]
- Anselmi, S.; Carney, M.F.; Giblin, J.T.; Kumar, S.; Mertens, J.B.; Dwyer, M.O.; Starkman, G.D.; Tian, C. What is flat ΛCDM, and may we choose it? arXiv 2022, arXiv:2207.06547. [Google Scholar]
- Di Valentino, E.; Melchiorri, A.; Silk, J. Investigating Cosmic Discordance. Astrophys. J. Lett. 2021, 908, L9. [Google Scholar] [CrossRef]
- Gonzalez, J.E.; Benetti, M.; von Marttens, R.; Alcaniz, J. Testing the consistency between cosmological data: The impact of spatial curvature and the dark energy EoS. J. Cosmol. Astropart. Phys. 2021, 11, 060. [Google Scholar] [CrossRef]
- Handley, W.; Lemos, P. Quantifying the global parameter tensions between ACT, SPT and Planck. Phys. Rev. D 2021, 103, 063529. [Google Scholar] [CrossRef]
- Forconi, M.; Giarè, W.; Di Valentino, E.; Melchiorri, A. Cosmological constraints on slow roll inflation: An update. Phys. Rev. D 2021, 104, 103528. [Google Scholar] [CrossRef]
- Poulin, V.; Smith, T.L.; Bartlett, A. Dark energy at early times and ACT data: A larger Hubble constant without late-time priors. Phys. Rev. D 2021, 104, 123550. [Google Scholar] [CrossRef]
- Hill, J.C.; Calabrese, E.; Aiola, S.; Battaglia, N.; Bolliet, B.; Choi, S.K.; Devlin, M.J.; Duivenvoorden, A.J.; Dunkley, J.; Ferraro, S.; et al. The Atacama Cosmology Telescope: Constraints on Pre-Recombination Early Dark Energy. arXiv 2021, arXiv:2109.04451. [Google Scholar] [CrossRef]
- Di Valentino, E.; Melchiorri, A. Neutrino Mass Bounds in the Era of Tension Cosmology. Astrophys. J. Lett. 2022, 931, L18. [Google Scholar] [CrossRef]
Publisher’s Note: MDPI stays neutral with regard to jurisdictional claims in published maps and institutional affiliations. |
© 2022 by the author. Licensee MDPI, Basel, Switzerland. This article is an open access article distributed under the terms and conditions of the Creative Commons Attribution (CC BY) license (https://creativecommons.org/licenses/by/4.0/).
Share and Cite
Di Valentino, E. Challenges of the Standard Cosmological Model. Universe 2022, 8, 399. https://doi.org/10.3390/universe8080399
Di Valentino E. Challenges of the Standard Cosmological Model. Universe. 2022; 8(8):399. https://doi.org/10.3390/universe8080399
Chicago/Turabian StyleDi Valentino, Eleonora. 2022. "Challenges of the Standard Cosmological Model" Universe 8, no. 8: 399. https://doi.org/10.3390/universe8080399
APA StyleDi Valentino, E. (2022). Challenges of the Standard Cosmological Model. Universe, 8(8), 399. https://doi.org/10.3390/universe8080399