Article

Clusters of Solar Radio Spikes Modulated by Quasi-Periodic Pulsations in a Confined Flare

1
CAS Key Laboratory of Solar Activities, National Astronomical Observatories, Chinese Academy of Sciences, 20A Datun Road, Chaoyang District, Beijing 100101, China
2
University of Chinese Academy of Sciences, No.19(A) Yuquan Road, Shijingshan District, Beijing 100049, China
3
State Key Laboratory of Space Weather, National Space Science Center, Chinese Academy of Sciences, NO.1 Nanertiao, Zhongguancun, Haidian District, Beijing 100190, China
4
School of Physics & Astronomy, University of Glasgow, Glasgow G12 8QQ, UK
*
Author to whom correspondence should be addressed.
Universe 2022, 8(7), 348; https://doi.org/10.3390/universe8070348
Submission received: 24 May 2022 / Revised: 13 June 2022 / Accepted: 20 June 2022 / Published: 24 June 2022
(This article belongs to the Special Issue Solar Coronal Loop Dynamics)

Abstract

:
Spikes are typical radio bursts in solar flares, which are proposed to be the signal of energy release in the solar corona. The whole group of spikes always shows different spectral patterns in the dynamic spectrum. Here, we present a special new feature at 0.6–2 GHz in a confined flare. Each group of spikes is composed of many quasi-periodic sub-clusters, which are superposed on the broadband quasi-periodic pulsations (QPPs). The quasi-periodic cluster of spikes (QPSs) have very intense emissions, and each cluster includes tens of individual spikes. When the intensity of background pulsation is increased, the intensity, duration and bandwidth of the spike cluster are also enlarged. There are 21 groups of QPSs throughout the confined flare. The central frequency of the whole group shifts from 1.9 to 1.2 GHz, and the duration of each cluster shows a negative exponential decay pattern. We propose that nonthermal electron beams play a crucial role in emitting both pulsations and spikes. The tearing-mode oscillations of a confined flux rope produce periodic accelerated electron beams. These electron beams travel inside the closed magnetic structure to produce frequency drifting pulsations via plasma emission and scattered narrowband spikes by electron-cyclotron maser emission (ECME). The slow rise of flux rope makes the source region move upward, and thus, QPSs shift towards low frequency. We propose that the confined flux rope may provide the essential conditions for the formation of QPSs.

1. Introduction

The radio emission from millimeter to meter wavelengths brightens up by more than an order of magnitude during solar flares, which shows various features at different wavelengths. Based on the spectral parameters, such as emission frequency, bandwidth, duration and frequency-drifting rate, etc., plenty of radio fine structures (FSs) such as zebra pattern, fiber, quasi-periodic pulsations, spikes are identified in the dynamic radio spectrum (i.e., [1,2,3,4,5,6,7,8,9,10,11,12]). These radio bursts are supposed to be produced by a wide variety of emission processes, which are related to energy release, plasma heating, particle acceleration, and particle transport in magnetized plasmas [13,14,15].
In these bursts, solar radio spikes appear as very short and bright structures in the spectrum, which have been followed with interest for many years [16,17,18,19,20,21,22,23,24]. The spikes are recorded in a very broad frequency band from 0.01 MHz to 8.4 GHz. Each cluster would contain millions of individual bursts with short durations (1–100 ms), narrowband (0.05–100 s MHz), brightness temperature (up to 10,000 s sfu) and a high degree of polarization (≥60%) [25,26,27,28]. The radio spikes normally appear as one single group in the observed bands. Sometimes, the clusters manifest harmonic structures with the ratio of the harmonic spike groups at about 1.4 [29,30,31]. The whole cluster would also drift towards high or low-frequency bands in some events [32]. In the spectrum, the temporal and frequency distribution of spikes is not homogeneous in each cluster. In reference [33], four clusters of spikes at 1–1.25 GHz occur intermittently in about 20 s, with a large number of spikes at low frequency. Reference [34] found the clusters of spikes show as quasi-periodic pulsations, and each individual pulsation contains plenty of spikes with a large amount of bursts at low frequency.
The narrowband spikes often occur together with type IV burst, type III burst, type II burst, pulsations, fiber or other fine structures [28,35,36,37]. Reference [27] analyzed the spikes superposed on the microwave gyrosynchrotron continuum. It is found that the spikes and gyrosynchrotron emission (thin limit) continuum have the same sense of polarization and the flux intensity is tightly correlated with the high-frequency spectral index of the microwave continuum. Reference [38] found the spikes at 282–330 MHz occur simultaneously with the type III bursts lower than 276 MHz. The temporal coincidence of spikes at 450–550 MHz and pulsations at 300–450 MHz has also been reported by reference [35]. In addition, the spikes are found inside or close to type II bursts, which coexist with herringbone and pulsating structures [28,39]. Based on the multi-band images of the Sun, the locations of spikes sources are found to be far from the site of hard X-ray or soft X-ray emission [35]. In the limb events, the spike sources are also at higher altitudes than the main flaring region [23,32,40,41]. In reference [32], the pulsations and spikes occur simultaneously but with different senses of polarization. The locations of spike sources also originate from pulsations and the continuum.
The short duration and narrowband intense spikes are proposed to be produced by the coherent emission of the energetic electrons during the flaring process. They would be a signal of electron acceleration or transportation on millisecond timescales. The electron-cyclotron maser emission (ECME) [42,43,44] is one possible theory, which is caused by the loss-cone instability of energetic electrons in the strong magnetic field area. Another possible mechanism is plasma emission in the frame of the Bernstein modes [45] or upper-hybrid waves [46,47], which would take place in the weak magnetic field region. Reference [48] proposed that the microwave drifting spikes are produced by a group of solitary kinetic Alfvén waves of small cross-field scales, in which the electrons are accelerated self-consistently.
The MingantU SpEctral Radioheliograph (MUSER) of China is a broadband radio spectral-imaging array for the Sun [49]. The low-frequency array (MUSER-I) has the observing frequency range from 0.4 to 2.0 GHz with a frequency resolution of 25 MHz and the temporal resolution of 25 ms. It recorded very special spectral structure of spikes during a confined flare on 21 June 2015. These spikes include many quasi-periodic sub-clusters, which coexist with quasi-periodic pulsations (QPPs) in the same sense of polarization. The new configurations of spikes and the spectral analysis are presented in Section 2. The results and discussion are included in Section 3. Section 4 is the summary.

2. Observations

2.1. The Spectral Observations during the Flares on 21 June 2015

On 21 June 2015, two M class flares occurred in the active region (AR) 12371. The M2.0 flare started firstly at 01:02 UT and ended at 01:42 UT. Then the M2.6 flare occurred from 02:06 UT to 03:02 UT. At the same period, LASCO/C2 recorded a halo coronal mass ejection (CME) at 02:36:05 UT, which originated from the same region as the flares. MUSER-I observed the Sun from 00:30 UT to 07:50 UT at 0.4–2 GHz on 21 June 2015. It recorded the whole burst process of these two flares. Figure 1 presents the soft X-ray (SXR) flux at 1–8 Å (a) from the Geostationary Operational Environmental Satellites (GOES) and the spectrum in the left-circular polarization (LCP) and the right-circular polarization (RCP) of MUSER-I (Figure 1b,c) from 01:00 UT to 05:00 UT. The black gaps at 0.725–0.75 and 0.8–1.0 GHz in the spectra are bad channels. The spectral data have been calibrated in solar flux unit (sfu, 1 sfu = 10,000 Jansky) by the bandpass calibration method in References [50,51,52].
In Figure 1b,c, it is found that the LCP and RCP spectrum has similar large-scale structures. By zooming in on these spectra, lots of short bright structures are distinguished, such as QPPs, lace, spikes, fibers and slow drifting bursts and so on. From these bright bright structures, we sort out 64 groups of spikes, which present two different spectral features. From 01:31 UT to 01:58 UT, 21 groups of spikes are recorded in RCP spectrum. Each group of spikes is divided into many quasi-periodic clusters and each cluster contains many individual spike bursts. From 01:58 UT to 02:55 UT, the spikes are found to be randomly scattered in a broader frequency band. There are 34 groups in the LCP spectrum, 3 groups in the RCP spectrum and 6 groups in both LCP and RCP spectrums. They have the common spectral feature as in former work. In this work, we focus on the spectral analysis of the 21 groups of QPSs during the M2.0 flare.

2.2. The Spectral Analysis of the QPSs

We select four samples during the rise phase (sample I&II), peak (sample III) and decay phase (sample IV) of the M2.0 flare for detail analysis. Then, we make a statistical analysis of all the 21 groups of QPSs to study the evolution of the spectral parameters. We also compare the spectral characters of QPSs and QPPs in sample III to understand their relationship. The following sections present a detailed analysis.

2.2.1. Sample I

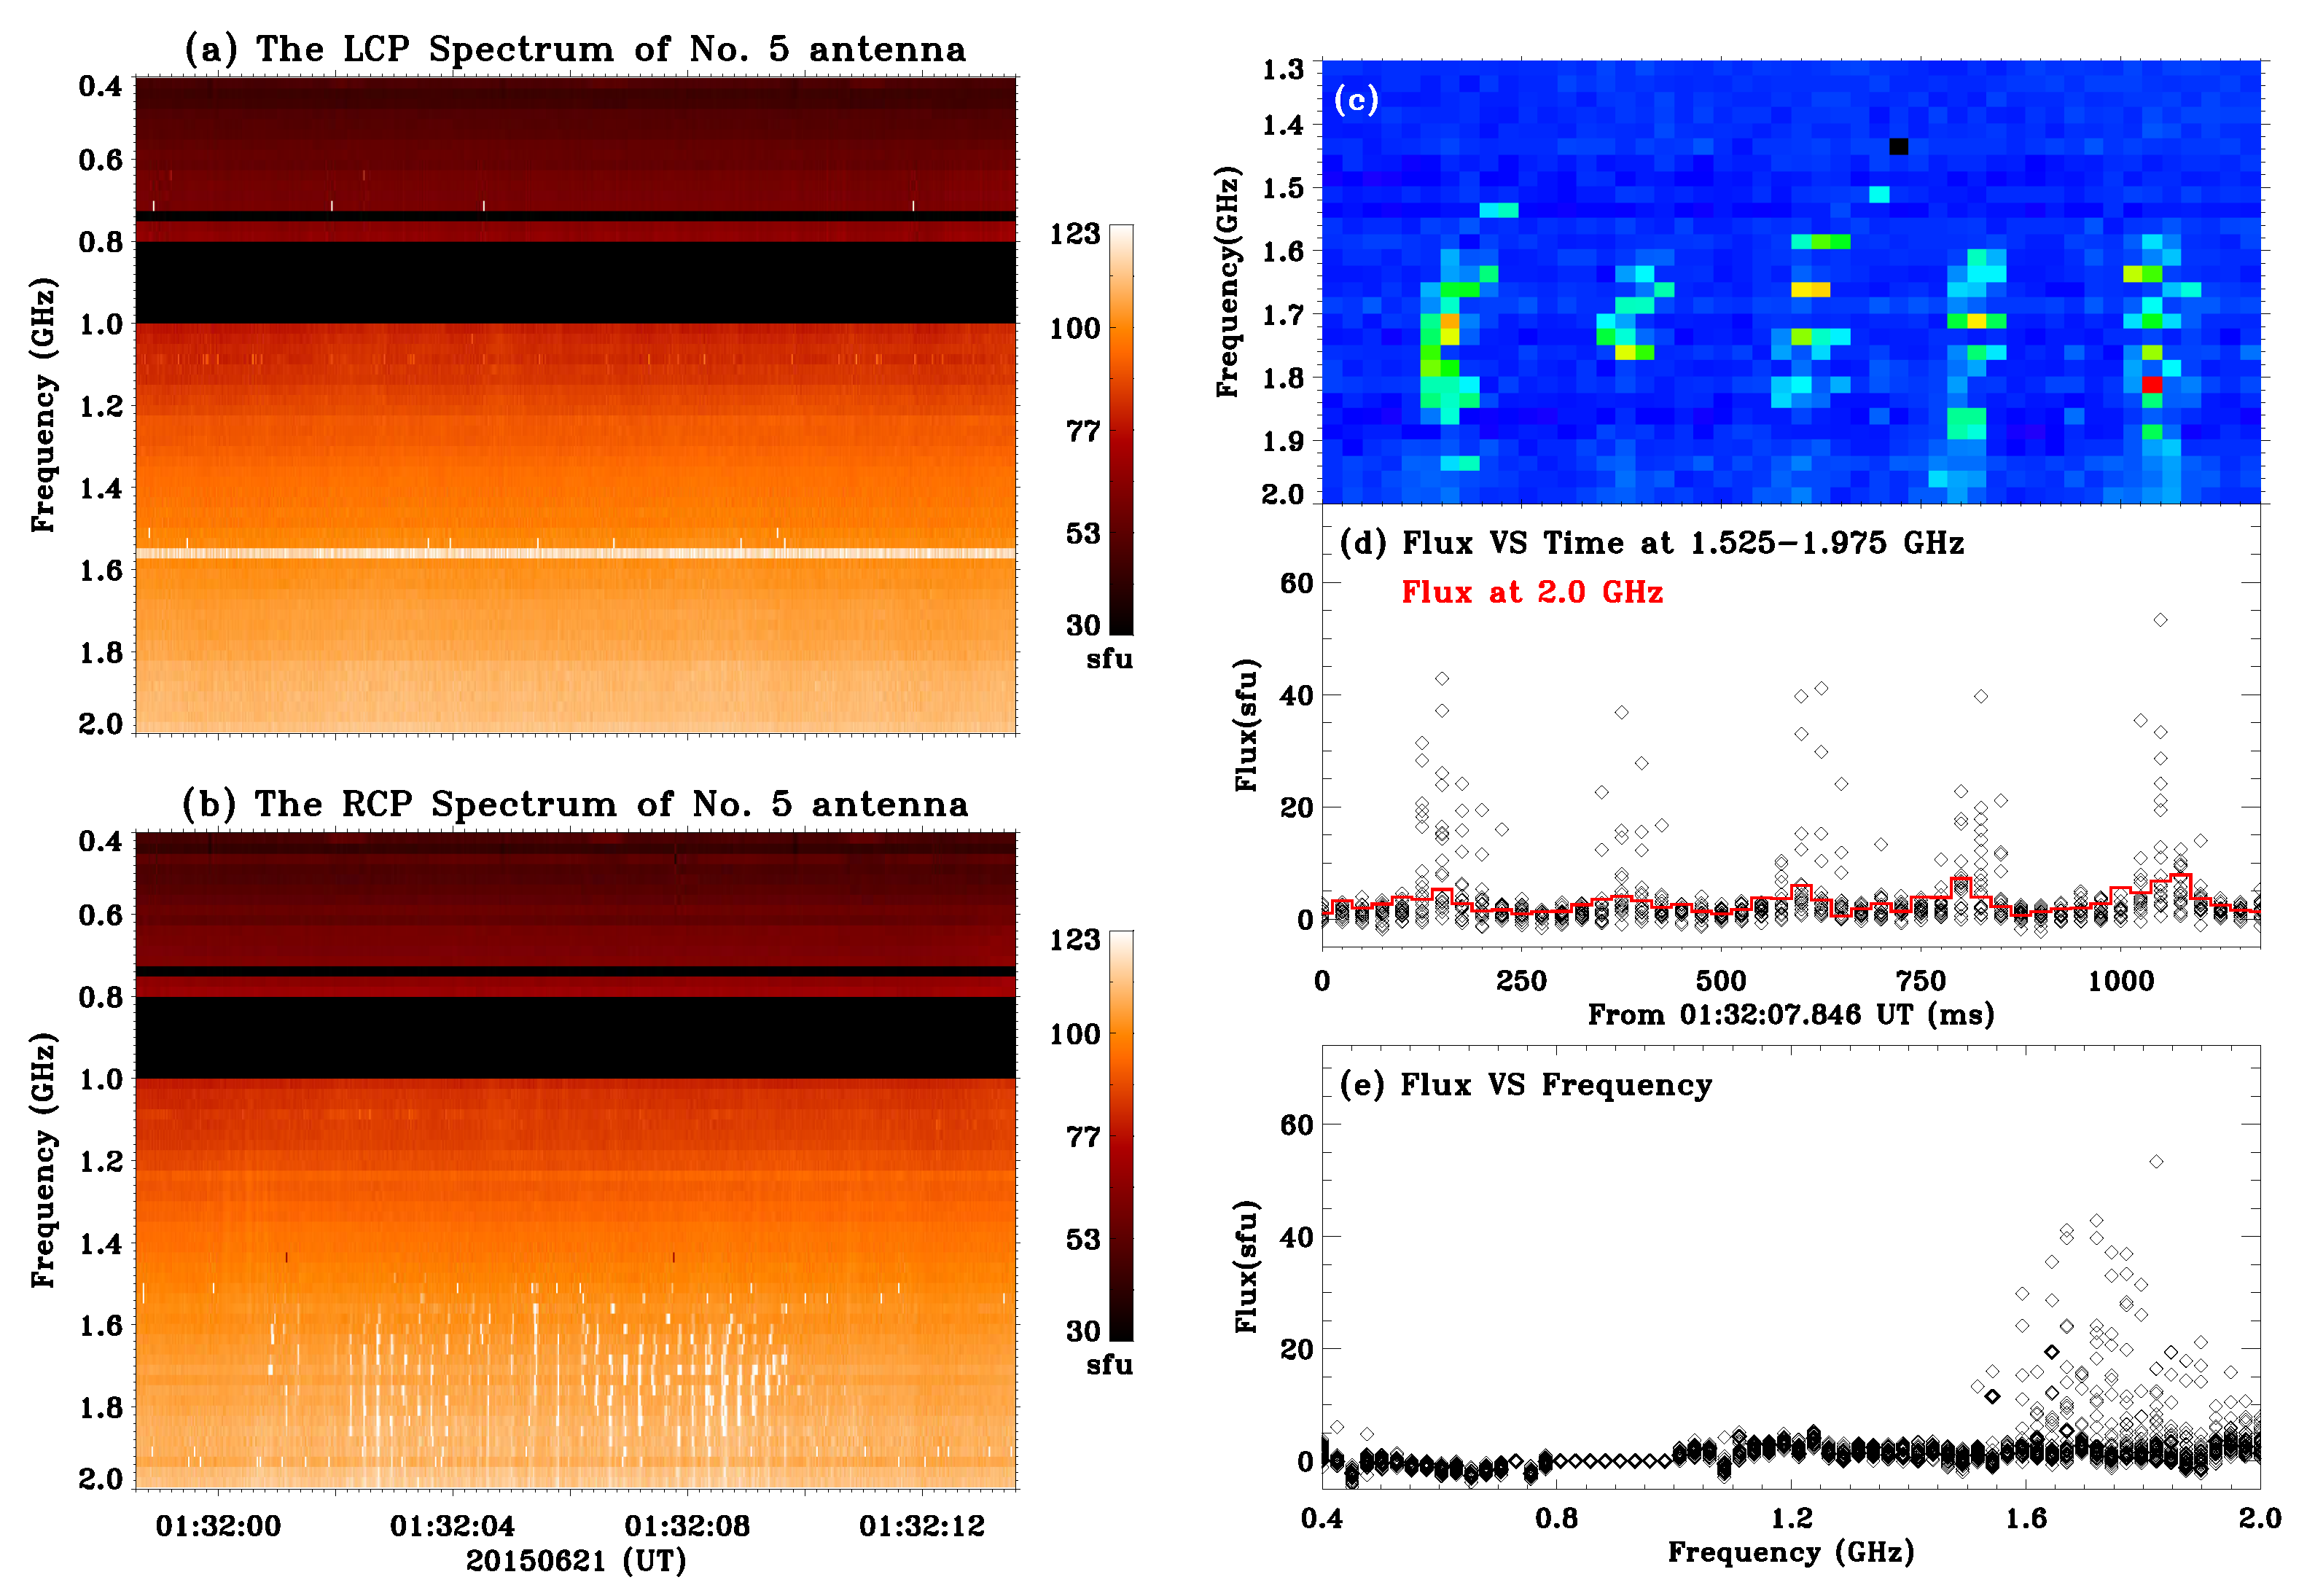
Figure 2a,b presents the first group of QPSs at 1.5–1.975 GHz during the impulsive phase of the M2.0 flare. It occurred before the impulsive radio emission. The QPSs are only recorded in the RCP spectrum, and there are 35 sub-clusters in it. Figure 2c shows the detailed distribution of each cluster. It can be seen that the spectral structure of each cluster is discontinuous but contains many random bright points. In view of the very short duration and narrow bandwidth of individual spikes recorded by spectrometers in the former work [25,26,27,28], the 25-ms and 25-MHz resolution of MUSER-I, devoted to spectral imaging of the radio sources, is incapable of resolving the spike structure. Each bright point would be overlaid by several spikes. In our analysis, each bright point is regarded as a single spike burst. This would affect the value of the intensity of individual spikes. However, it does not affect the primary analysis of the clusters of spikes.
We plot the flux of each frequency band at 1.5–1.975 GHz in Figure 2d. The component of the continuum emission in the selected period has been subtracted, and the diamond represents the emission of spikes. They appear as solid black diamonds due to many overlaid cases. It can be seen that the intensity of spikes ranges from several sfu to about 54 sfu. The duration of each cluster is about 100 ms. There are tens of individual spikes in each cluster, and the strongest spikes are more likely to appear in the middle of each cluster. For comparison, the flux at 2 GHz, with no spike being recorded, is plotted with a red solid line. It presents a similar temporal evolution with small enhancement (several sfu) during each cluster of spikes. Figure 2e presents the frequency distribution of the QPSs. We plot all the points of the whole frequency band during the selected period in Figure 2d. It is obvious that the QPSs appear at 1.5–1.95 GHz, and the emission bandwidth of sample-I is about 450 MHz. We set the central frequency of this group of QPSs as 1.75 GHz. The intensity distribution of spikes has a semi-Gaussian distribution with frequency. The strongest spikes are likely to appear around the center of the emission bandwidth.

2.2.2. Sample II

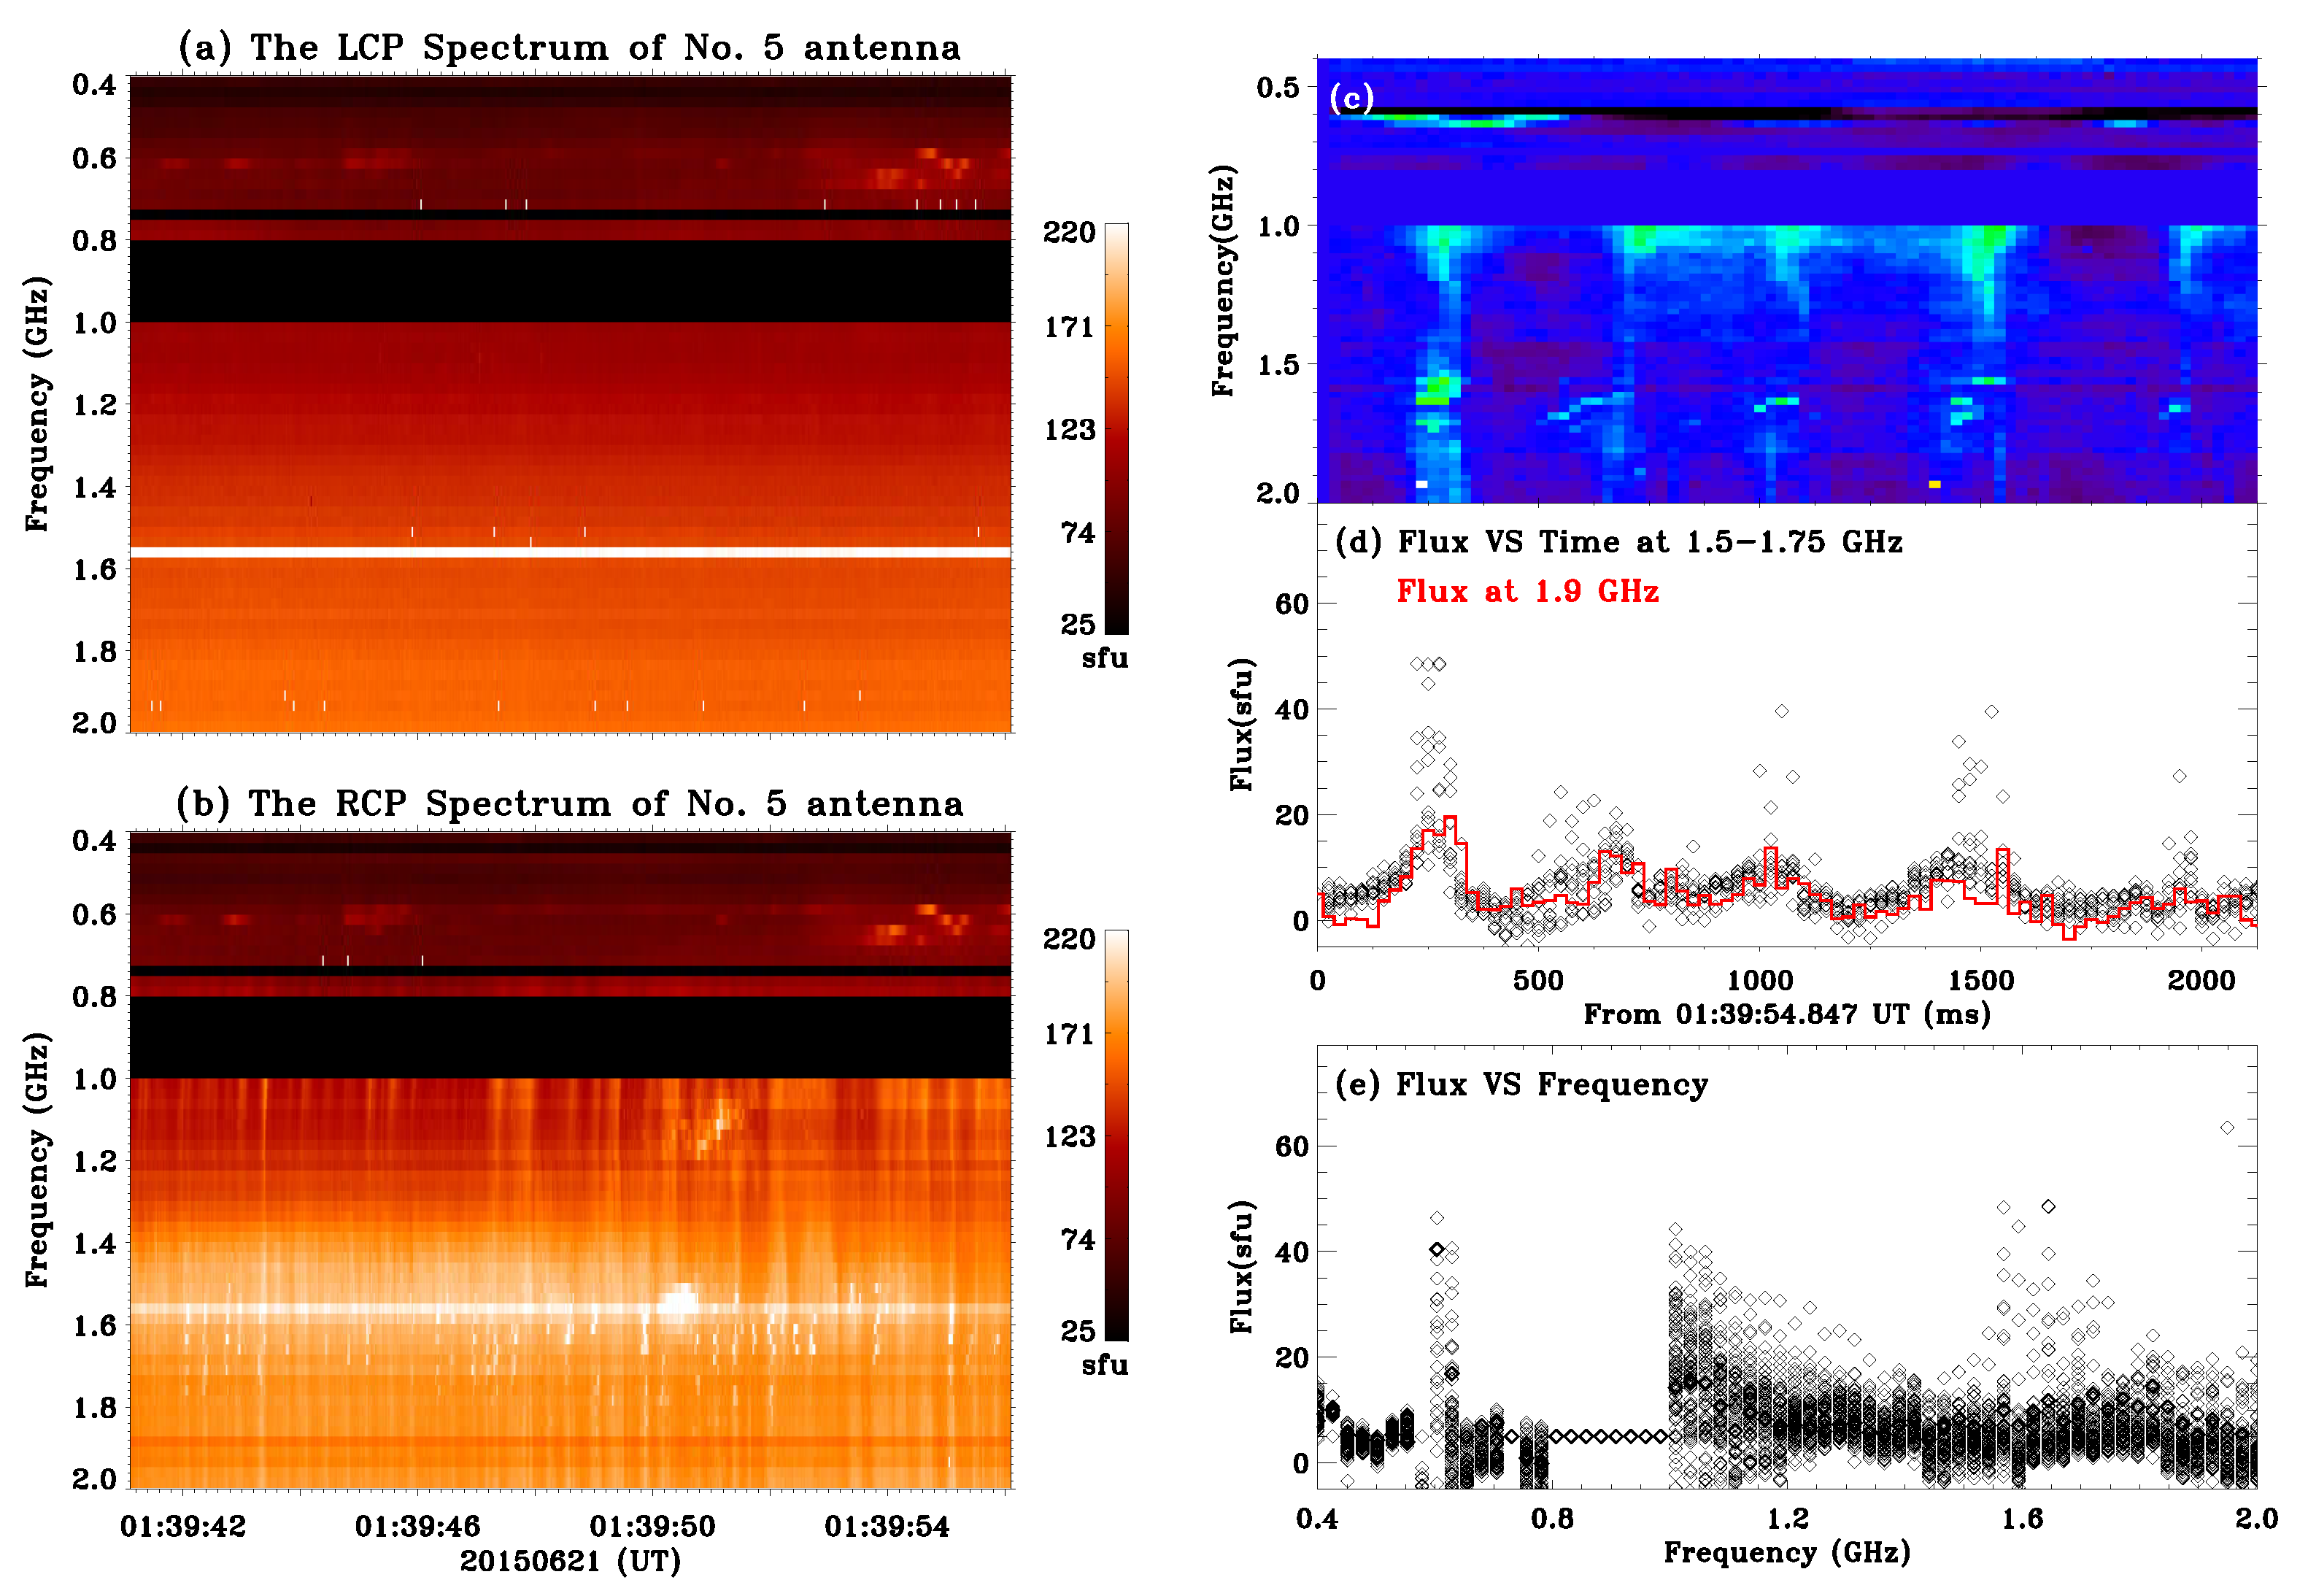
Sample II shows the QPSs before the peak of the M2.0 flare (Figure 3). In the RCP spectrum, the QPSs at 1.5–1.75 GHz are recorded synchronously with a group of broadband QPPs at 0.7–2 GHz. The QPPs are composed of plenty of smooth, bright pulses and each pulsation drifts rapidly from high to low frequency. In these bright pulses, there are about 41 clusters of spikes superposed on with particularly strong intensity over a narrow frequency band. Each cluster coincides with one piece of pulsation, and they have the same lifetime. However, not all of the pulsations coincide with the intensive spikes. The flux of QPSs of sample II are also plotted by subtracting the continuum in Figure 3d. The intensity of QPSs also ranges from several sfu to about 50 sfu. The duration of each cluster increases to 125 ms but includes fewer spikes. The flux at 1.9 GHz without the spike (red solid line) also shows a small enhancement during each cluster. In Figure 3e, two prominent emission components are distinguished in the whole frequency band. The emission of QPSs covers from 1.5 to 1.75 GHz, and the bandwidth of the whole cluster is about 250 MHz, with the center frequency at 1.625 GHz. The emission of the smooth QPPs is enhanced from 1 to 1.4 GHz and has a peak at 40 sfu. The bright emission below 0.7 GHz is from another burst at the low-frequency band.

2.2.3. Sample III

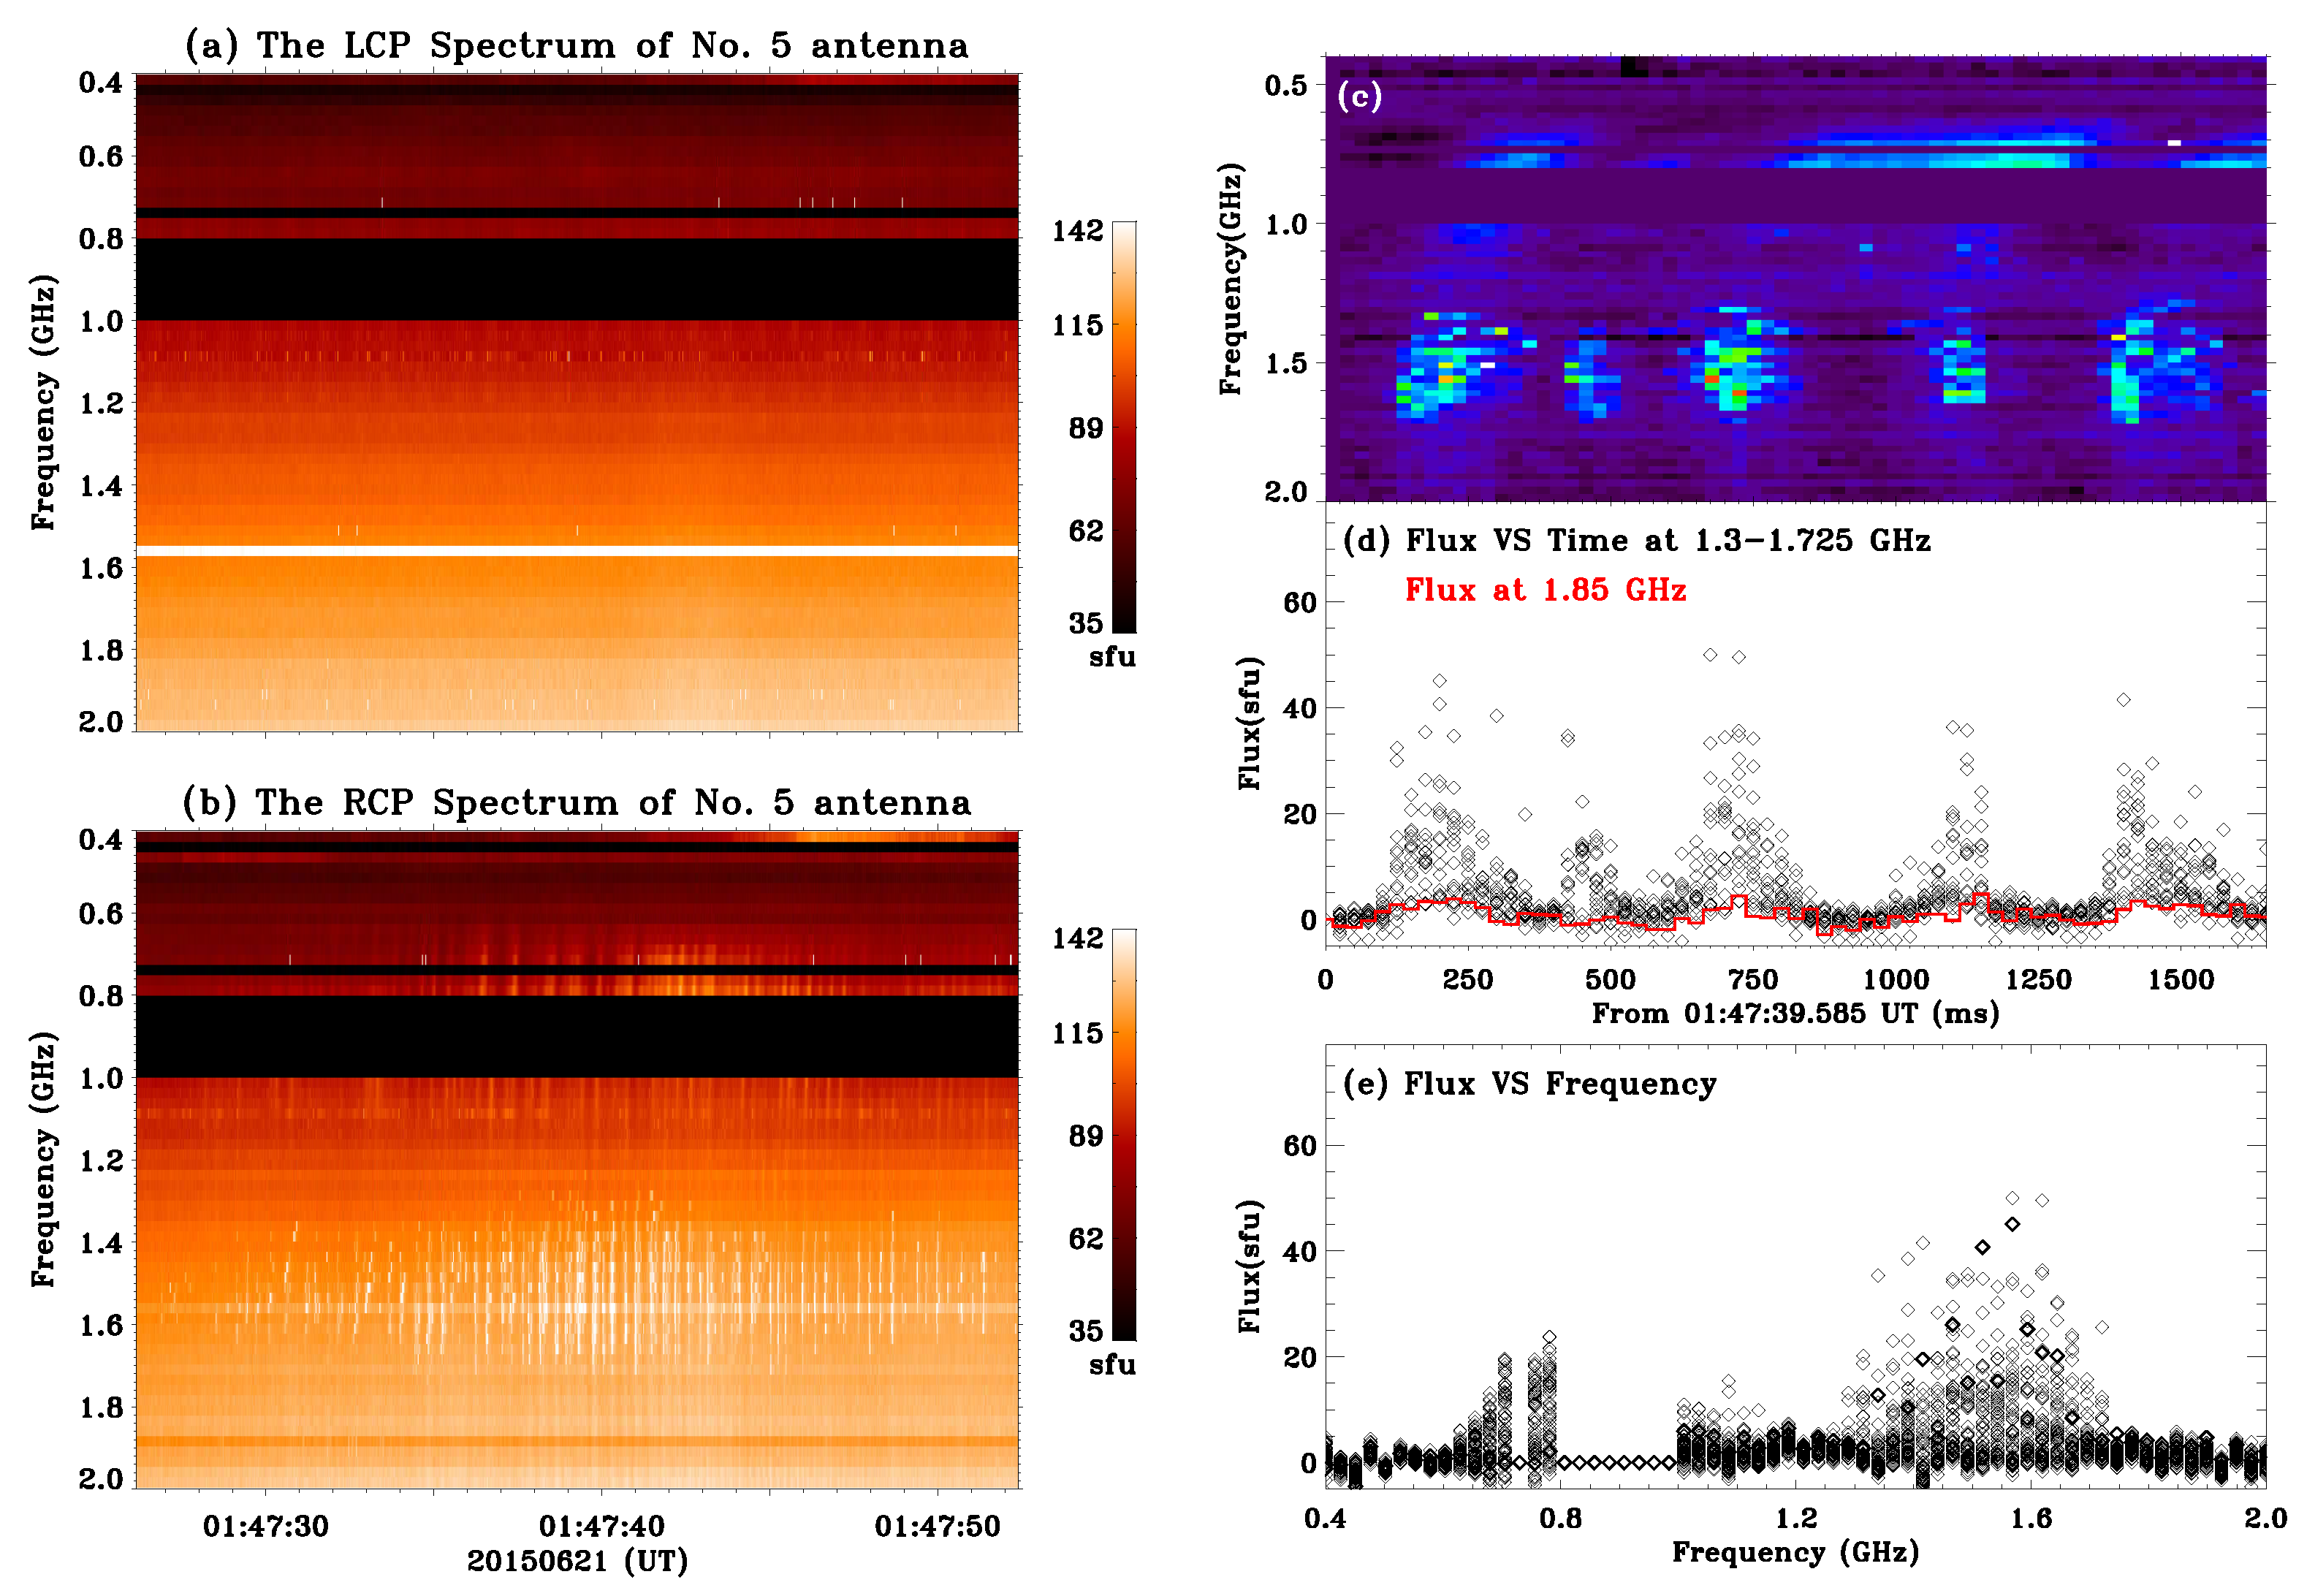
Figure 4 plots another sample of QPSs around the peak of the M2.0 flare, which is also recorded in the RCP spectrum. The main emission of QPSs covers the frequency range at 1.3–1.7 GHz and a group of QPPs at 0.6–2 GHz appears simultaneously. This group of QPSs lasts for about 40 s and more than 100 clusters of spikes are distinguished. Figure 4 presents part of the QPSs for about 25 s. In Figure 4c, each cluster contains more individual spikes than sample I&II. The flux of QPSs at 1.3–1.7 GH is plotted by subtracting the continuum in Figure 4d. The intensity of spikes also ranges from several sfu to about 50 sfu. However, the duration of each cluster increases to 250 ms. The distribution of the intensity of individual spikes has no distinct evolution in time. The strongest spikes seem to appear in the middle of the cluster. The flux at 1.85 GHz without a spike shows a similar intensity enhancement during each cluster of QPSs. In Figure 4e, we also found two components as sample II. The emission bandwidth of QPSs is about 425 MHz with the center frequency at 1.5 GHz. The intensity of spikes are also randomly distributed at different frequencies, and the most intensive ones seem to appear at the center frequency of the QPSs. The emission of the pulsations is weaker than QPSs, which has a peak of 25 sfu at about 0.775 GHz.

2.2.4. Sample IV

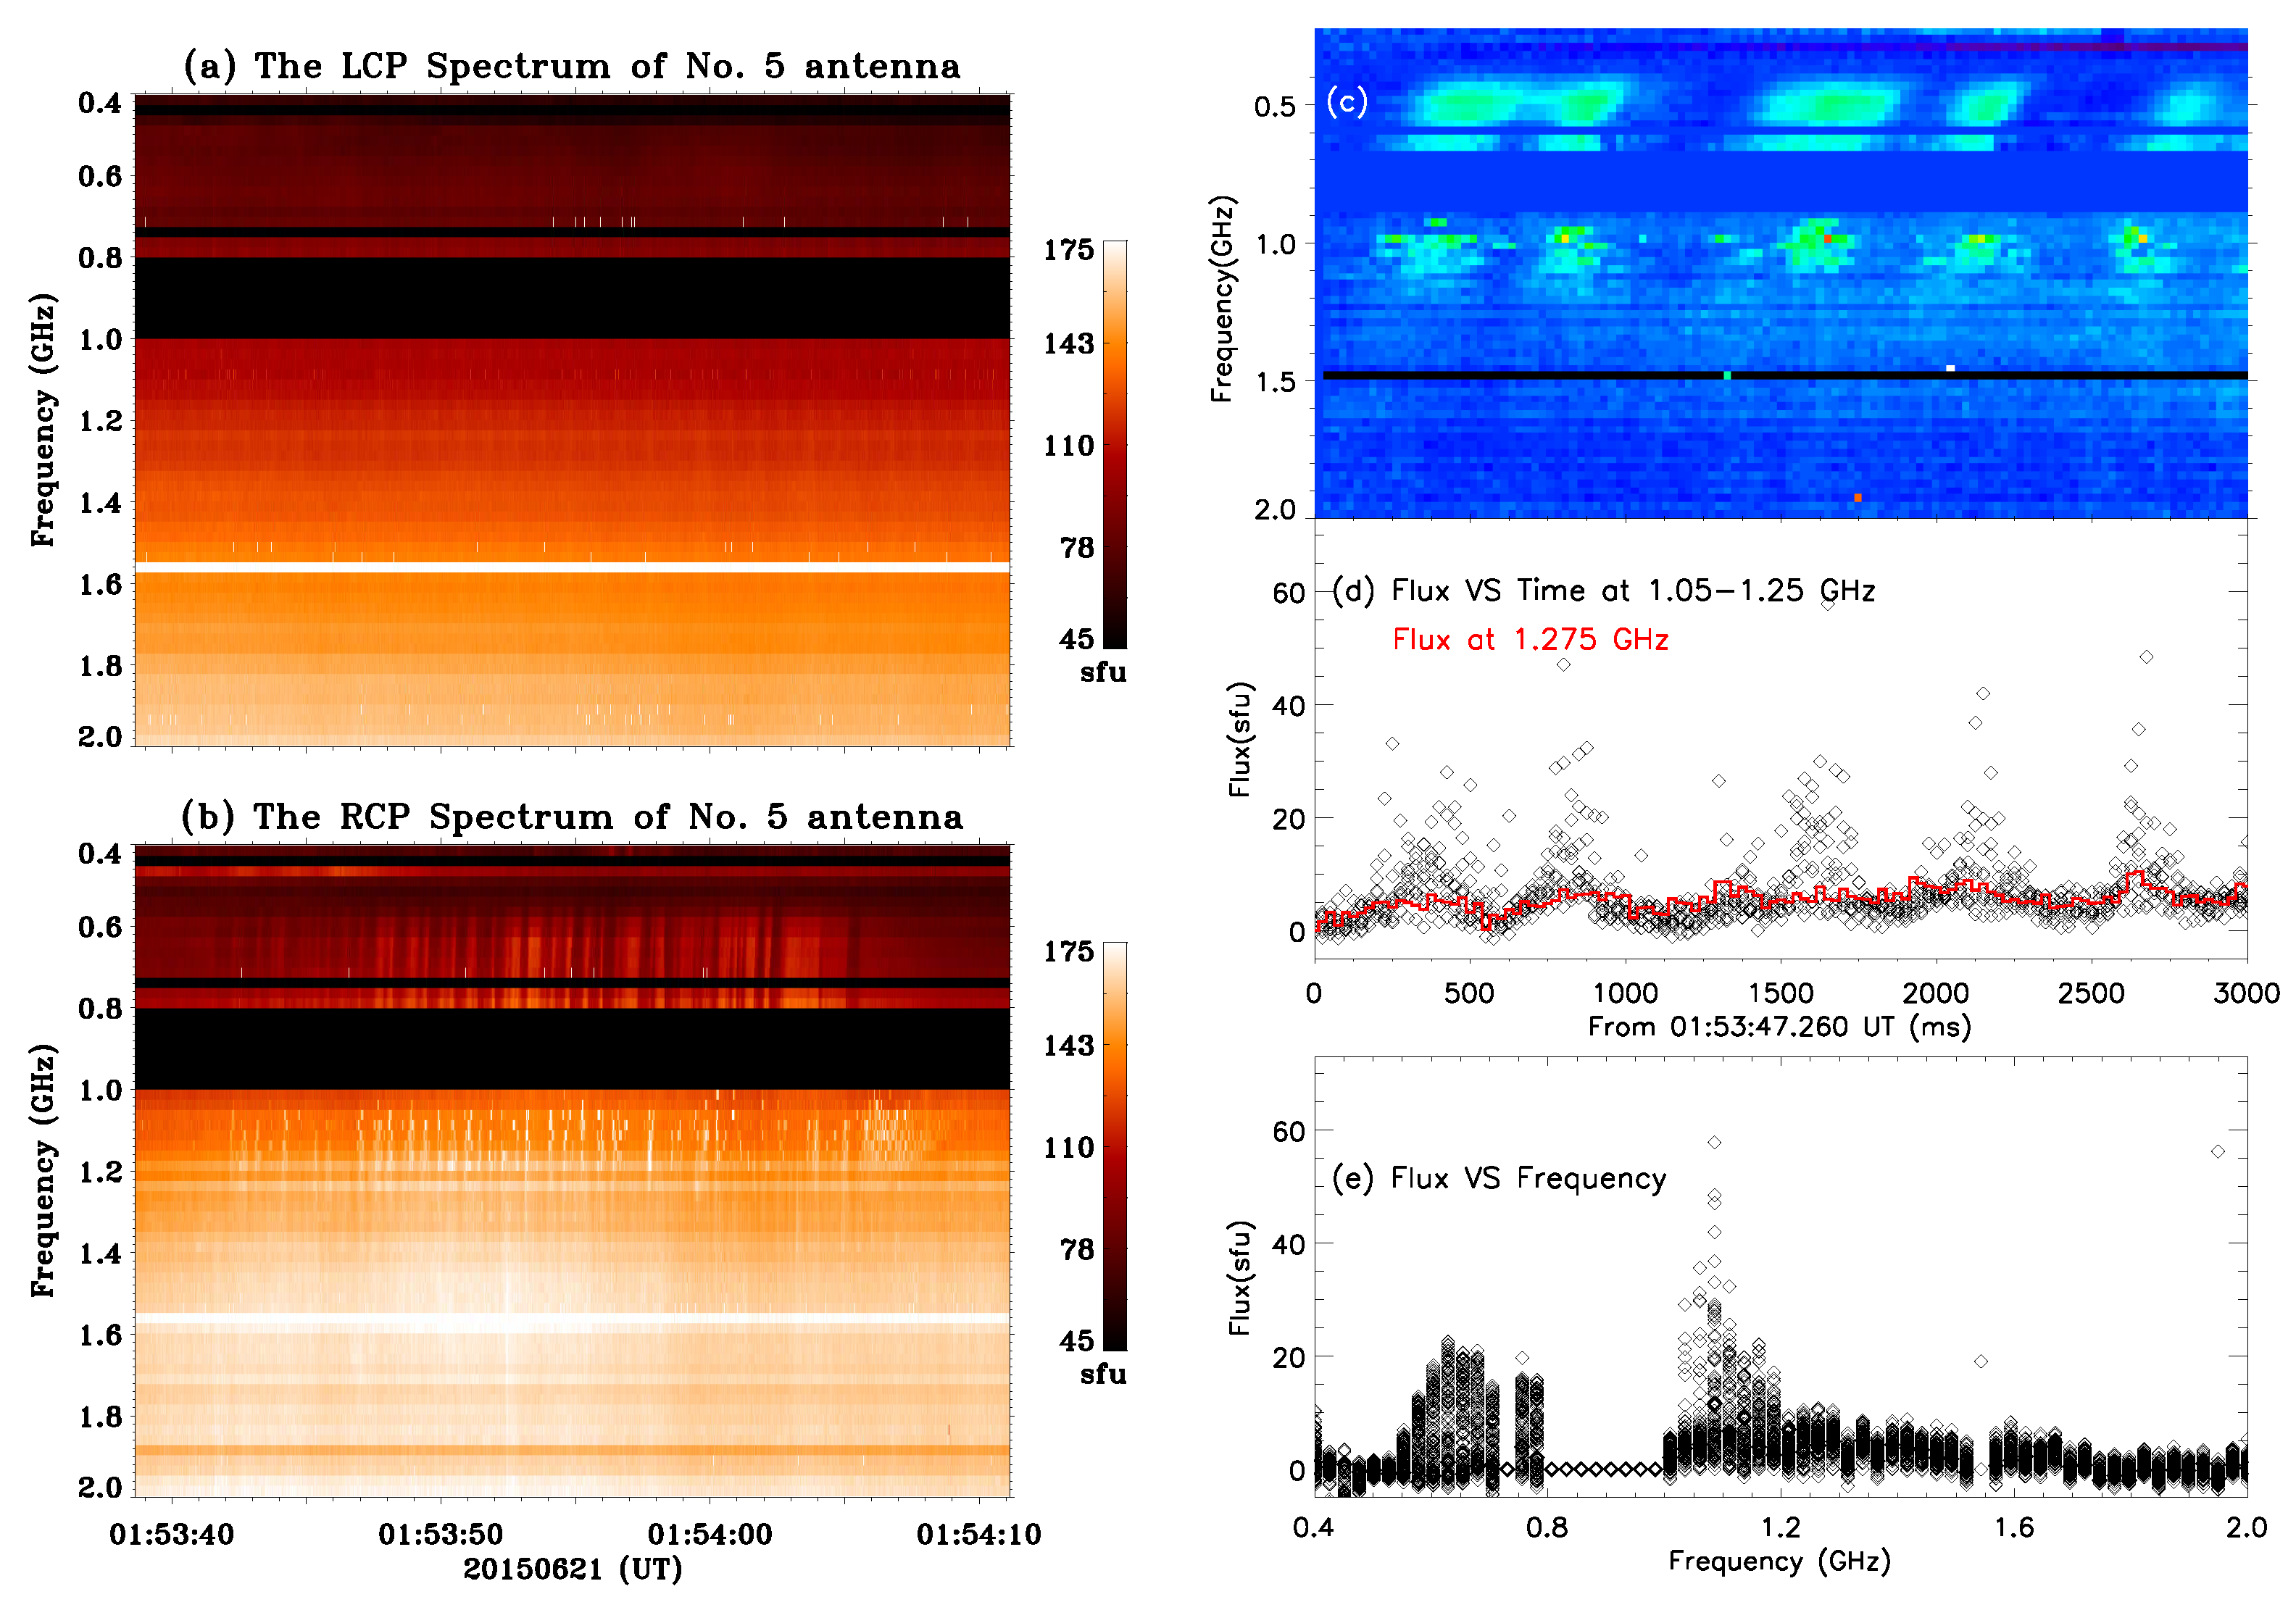
We select the sample-IV of QPSs in the decay phase of the M2.0 flare at 01:53:38.635 UT. As seen in Figure 5a,b, the QPSs shift to a lower frequency at 1.05–1.25 GHz in RCP, coinciding with QPPs at 0.6–0.8 GHz. This group of QPSs lasts for 30 seconds, and there is a smooth tail of spikes at the end. In the enlarged spectrum (Figure 5c), each cluster of spikes corresponds to one bright pulse. Although the emission of QPPs above 1.25 GHz can not be clearly distinguished, the flux at 1.85 GHz (red line in Figure 5d) shows similar oscillations as QPSs. The peak intensity of sample IV is about 58 sfu, and the duration of each cluster grows to about 300 ms. Figure 5d shows that the bandwidth of sample IV is about 250 MHz, and the central frequency shifts to 1.15 GHz. The maximum emission of QPPs is about 22 sfu at 0.675 GHz (Figure 5d). As per the above samples, the strongest spikes of QPSs would occur in the middle time and at the central frequency of each cluster.

2.3. The Statistical Analysis of QPSs

Among the 21 groups of QPSs, we found that 17 groups are concurrent with the broadband QPPs, and four groups present only periodic-narrowband clusters as sample-I. Figure 6a shows the light curves at 0.6 (blue), 1.1 (red) and 2 (black) GHz from 01:30 to 02:00 UT during the M2.0 flare. It can be seen that the light curves have three main peaks with plenty of pulses superposed. The main peaks correspond to three broadband continua in both LCP and RCP spectrums, and the pulses are related to the fast-changing fine structures at different frequency bands. All the QPSs are labeled as green boxes on the spectrum in Figure 6b. Each box labels the lifetime and bandwidth of each group of QPSs. It is found that the QPSs appear in the whole process of the M2.0 flare, and all the QPSs are inclined to appear beyond the three main peaks. The durations of each group of QPSs before the peak are shorter than that after the peak. The bandwidth becomes larger in the decay phase of the flare. Furthermore, the center of the emission band of QPSs shifts towards a lower frequency. The peak flux of each group of QPSs ranges from 10 to 60 sfu, which has a random distribution in the whole process.
We analyzed the spectral distribution of the relative frequency bandwidth of the whole group of QPSs and the duration of each cluster in QPSs of all the events (Figure 6). The relative frequency bandwidth is the ratio between the bandwidth and the central frequency of the whole group of the narrowband QPSs. It can be seen that the relative bandwidth ranges from 9% to 35%, and it tends to be larger at the low-frequency band. We collected the typical values of the duration of the cluster (Tc) in each group of QPSs, which ranges from 50 to 425 ms. Figure 6d presents the distribution of Tc with the central frequency. It shows a negative exponential decay pattern with the central frequency. We made the exponential function fitting and obtained the value of the index of about −1.33. The wavelet analysis of sample I, III &IV at selected frequencies has been performed, and the QPSs show oscillating features as QPPs at about 0.2 s (1.75 GHz of sample I), 0.4 s (1.575 GHz of sample III) and 0.7 s (1.125 GHz of sample IV), respectively. The oscillating period grows longer at the low-frequency band, which evolves a similar change to that of the duration of the cluster.
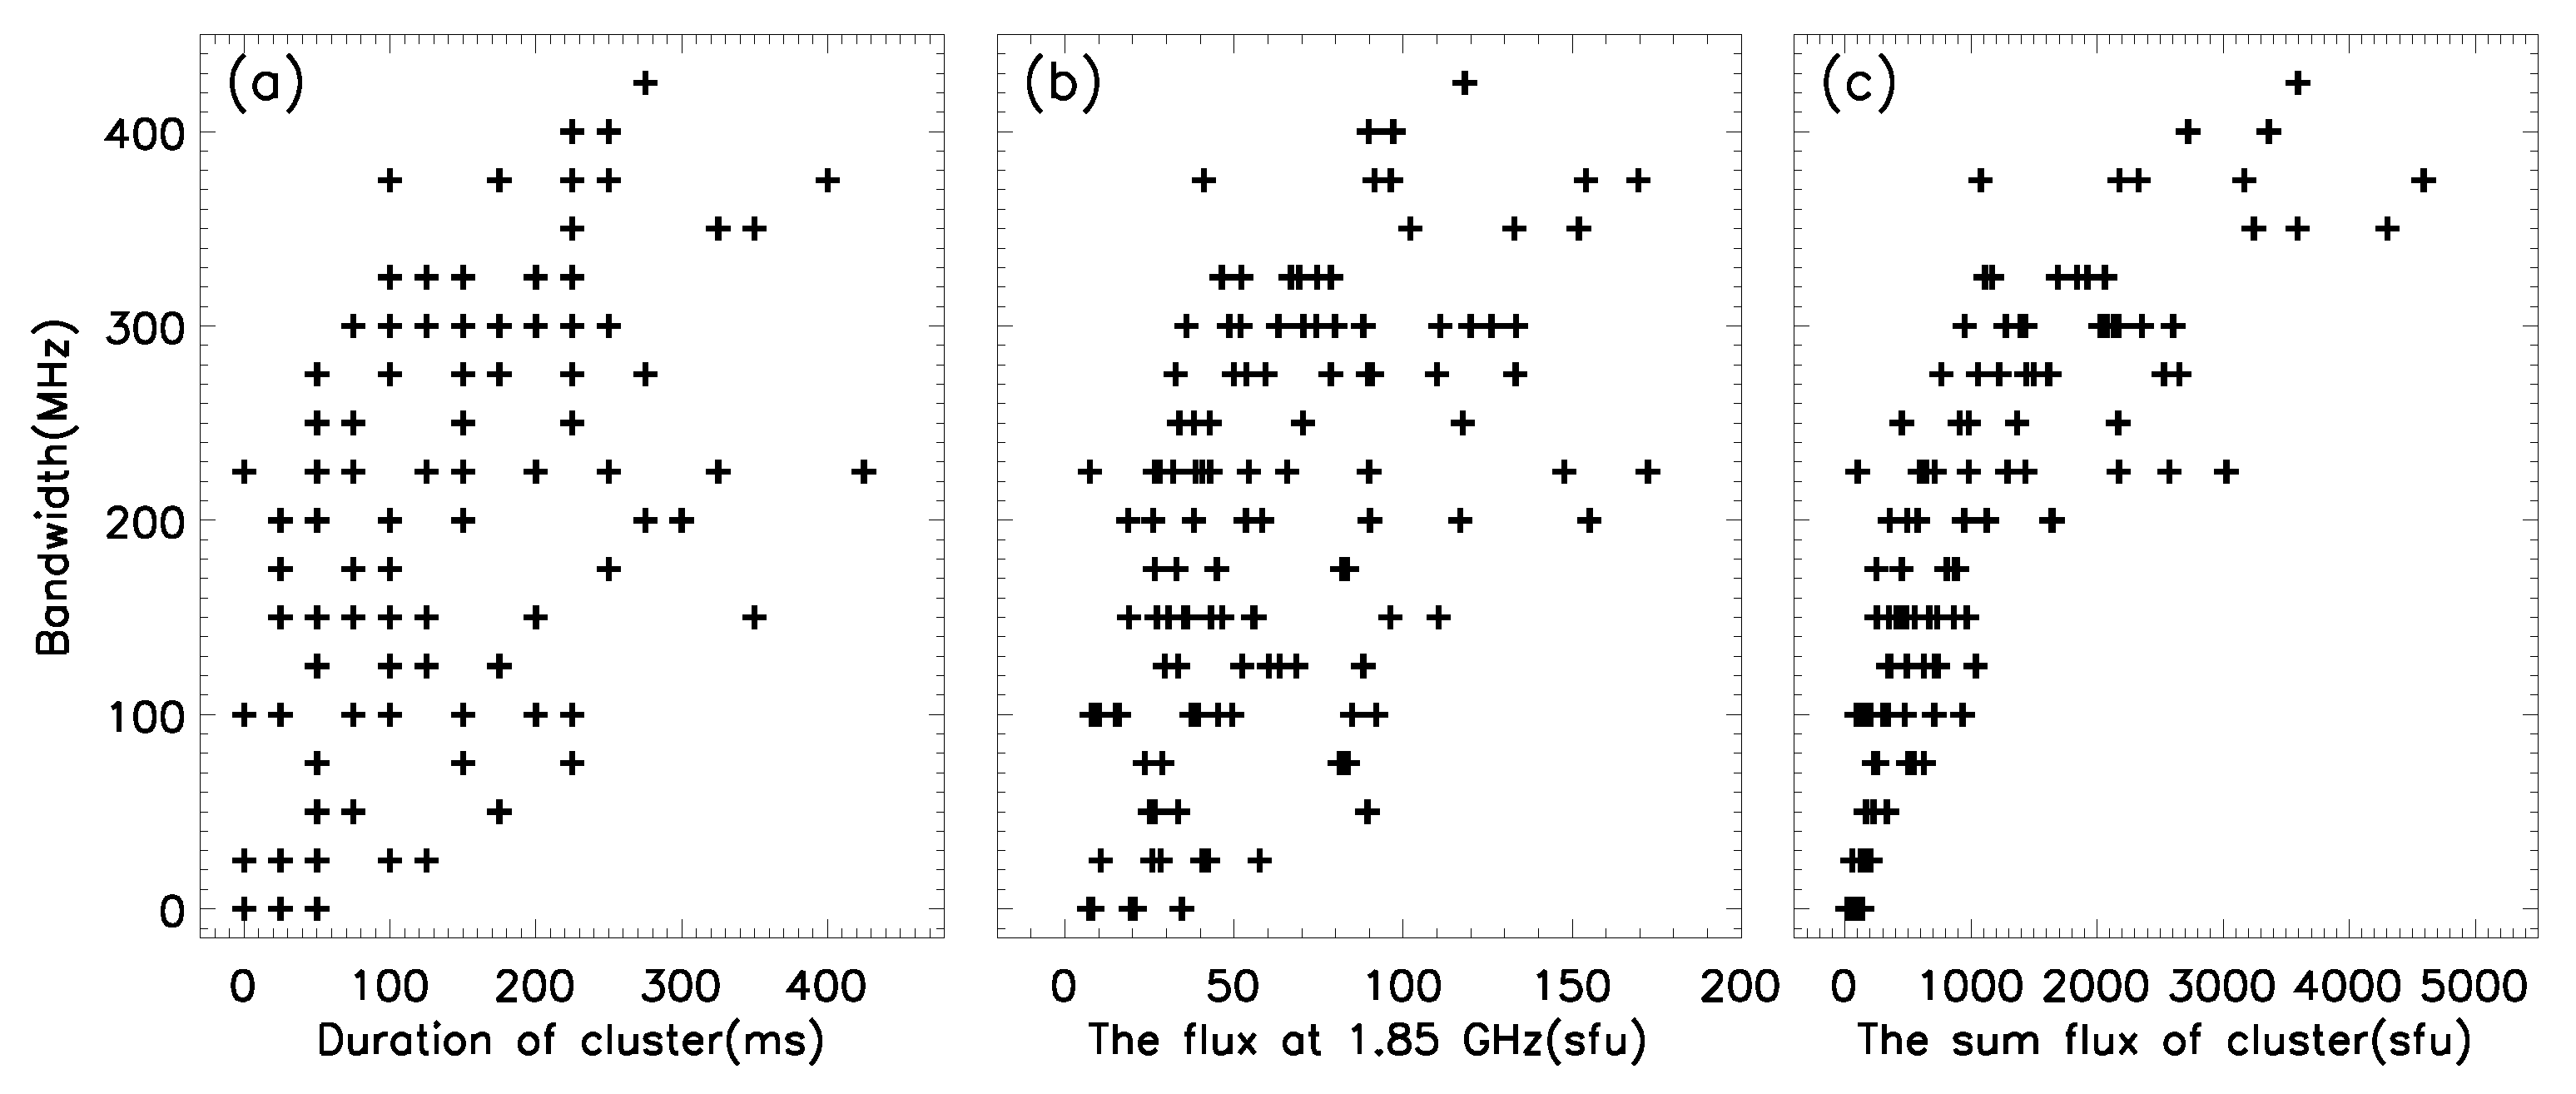
In the above analysis, we set the biggest bandwidth as the typical value for each group of QPSs for the statistical analysis. In some groups, the bandwidth of the cluster is not exactly the same. In particular, when a group of QPSs lasts for a long period, and there is no other fine structure mixing in the spectrum (such as sample III&IV), the bandwidth of the cluster has an obvious temporal evolution. We analyzed the duration, bandwidth, intensity of the clusters in sample III (Figure 7). It is found that the clusters with long duration would have larger bandwidth. We compared the sum of the emission of QPPs at 1.85 GHz and the sum of the flux of all the spikes in each cluster. It is found that their light curves have a similar evolution, i.e., the emission of QPPs and QPSs are enhanced and weakened synchronously. In addition, we found the bandwidth would become larger when the emission of both the QPPs and QPSs becomes more intensive.

3. Results and Discussion

3.1. Summary of the Observed Features

During the M2.0 flare on 21 June 2015, the microwave emission at 0.4–2 GHz contains plenty of fine structure bursts in the entire flaring process. Among these bright structures, we distinguished 21 groups of spikes in the RCP spectrum, which are composed of many quasi-periodic subclusters. We summarize the spectral features as follows:
(1)
Each group of QPSs contains many quasi-periodic sub-clusters, and almost all of the QPSs occur synchronously with QPPs. They have the same oscillating period and both of them appear only in the RCP spectrum. Three groups of QPPs are not accompanied by QPPs, but have an in-phase enhanced background.
(2)
All the QPSs cover a narrow group bandwidth (150–550 MHz), which grows larger when the QPSs shift to low-frequency band. In contrast, QPPs occur over a broader frequency band, with the largest one covering 0.625 to 2 GHz. Each pulse in QPPs has a cut-off frequency at the low-frequency band, and it has a relatively strong emission around the cut-off frequency.
(3)
The duration of each cluster of spikes ranges from 50 to 425 ms in different groups, which increases at low-frequency bands. This duration has a negative exponential decay pattern with the central frequency, with a fitting index of −1.33. When the cluster has a longer lifetime, it would include a larger amount of spikes.
(4)
The emission of QPSs is stronger than that of QPPs. The intensity of individual spikes ranges from 10 to 60 sfu by subtracting the continua component, which has a Gaussian-like distribution in both time and frequency. The light curves of QPSs include two components: the intensive scattered emission of spikes and the smooth weak enhanced background. For the emission without spikes at a higher frequency, the light curve also presents a similar periodical enhancement as QPSs.
(5)
In one group of QPSs, the duration, bandwidth and intensity of the cluster have a symbiotic mode of evolution. When the emission of QPPs is enhanced, the duration, bandwidth and intensity of QPSs would increase correspondingly. However, the central frequency of the cluster does not show any significant change.
(6)
All the QPSs took place in a confined flare, and they appear throughout the entire process. The central frequency of the QPSs shift towards lower frequency bands, resulting in longer duration and broader bandwidth of the cluster. The radio emission presents four main peaks during the flaring process and QPSs would prefer to appear out of the peak time. At the end of the flaring process, the central frequency of QPSs shifts somewhat to a high frequency.
(7)
After that, the M2.6 flare took place in the same region, which is accompanied by a fast CME. In this flare, most of the spikes appear in the LCP spectrum, which covers almost the whole frequency range and shows an irregular distribution. In the decay phase of the M2.6 flare, most of the fine structures appear at the low-frequency band with no or weak polarization degree.

3.2. Discussion

QPPs are a common signature in solar flares, which exist over a broad wavelength range and have an oscillating period ranging from sub-second to several minutes (see, e.g., [53,54,55,56,57,58]). The QPPs with long periods could be produced by MHD oscillations in magnetic structures of different scales. The sub-second QPPs are always recorded in radio and HXR emission, which are proposed to be related to the wave–particle or wave–wave interaction in plasma or the resistive tearing-mode oscillations in current-carrying magnetic loop. In this event, QPPs and QPSs present the synchronous sub-second (0.1–0.9 s) oscillation. The oscillating period becomes larger when QPPs or QPSs appear at a low-frequency band.
Most of QPPs cover a broad frequency band, and the individual bright pulse drifts from high to low frequency with a frequency drifting rate of about 2 GHz/s. The global structure of each group of QPPs has no obvious shift or change, which suggests that the source region is at a stable location. The decay time of the bright pulse at different frequency has a negative exponential decay pattern, which has the similar decay feature as type III bursts. Thus, we propose that the bright pulses are produced by nonthermal electron beams via a plasma emission mechanism as type III bursts. The radiation intensity is closely related to the density and speed of electron beams. In addition, the pulsations have bright tails at the low-frequency band, where the emission is cut off and the intensity is significantly enhanced. These features would indicate that the electron beams have traveled in a closed magnetic structure, and they are accumulated around the region where they stop motion. The quasi-periodic acceleration or injection of electron beams would generate the quasi-periodic bright pulsations.
The M2.0 flare is a confined flare, which could exactly provide a stable and closed flux rope. The oscillating period of QPPs is in the range of sub-seconds, and thus, we rule out the possibility of MHD oscillations of a flux rope. The tearing-mode oscillations of a current-carrying flux rope would be a reasonable choice. The nonthermal electron beams are quasi-periodically accelerated in the magnetic islands and transported inside the flux rope to produce QPPs.
For most of QPSs bursts, a narrowband cluster of spikes is found to be superposed on the smooth broadband pulse. In the early phase, the QPSs appear in the middle band of the pulse, while in the late phase, they appear beyond the starting high frequency of QPPs. In either case, the spikes are found to superpose on an in-phase smooth background. When the background is strong enough to be distinguished, they are shown as bright pulsations. When it is very weak, we could diagnose it in the light curves (see Sample I&IV). In particular, when the background emission becomes more intensive, the intensity, duration and global bandwidth of the cluster would also be enlarged. We may conclude that the enhanced background, which is emitted by electron beams, would be the essential condition for the occurrence of spikes. Thus, the fast moving electron beams would also produce spikes on the way of traveling.
We think the Electron Cyclotron Maser Emission (ECME) could be the alternative mechanism for this kind of QPS. In the closed flux rope, the loss cone distribution of electron beams could be easily generated. The duration and bandwidth of each spike depend on the lifetime of the loss cone distribution and its spatial scale. In this event, QPSs have a high polarization degree and there is no harmonic structure in them. The observed frequency is proposed to be at the low harmonic frequency of the electron cyclotron frequency. In the flaring process, the whole group of spikes shifts from high to low frequency; thus, we could speculate that the magnetic field of the source region becomes weak during this period.
In each cluster, the spikes have larger intensity in the middle of the frequency band and in the middle of the lifetime. There is no regulation for the appearance of spikes in each cluster. That is to say that the loss cone distribution of electrons may be generated randomly, without any systematic modulation. However, when the background emission is enhanced, a larger amount and stronger spikes would appear at a wider frequency range. This may indicate that a larger density of electron beams would not only produce intenser emission of spikes but also provide a greater possibility of generating a loss cone distribution of electron beams.
As shown in Figure 6b, these QPSs prefer to appear out of the main peaks. It suggests that QPS is more liable to occur when the flaring process is relatively stable. In that case, it may be easier to generate a loss cone distribution of electron beams in the flux rope. The global group shift of spikes from high to low frequency may indicate that the region with the loss cone distribution of electrons moves smoothly upward. The expansion or rise of the flux rope may result in this movement. However, around the end of this flare, QPSs shift reversely towards high frequency. This means that the flux rope stops rising or expanding, and it collapses downward a bit. Thus, this flare manifests as a confined flare. In the M2.6 flare, the flux rope ejected outward and QPSs disappeared. The spikes then have a random distribution at a wider range in the LCP spectrum, which could be produced in an entirely different condition.
In an M2.0 flare, both QPPs and QPSs are recorded in the RCP spectrum. They have the same sense of polarization and a relatively high polarized degree. The plasma emission at fundamental and ECME at lower harmonics can exactly produce QPPs and QPSs with high polarized degrees, respectively. The LCP and RCP spectrum recorded the signals in the opposite rotation direction of the electric vector of electronic waves. The polarized degree of the observed signals is also decided by the angle between the line of sight and the magnetic field direction. Thus, the same sense of polarization of QPPs and QPSs would suggest that they originated from the regions of similar magnetic field direction. They may be emitted from the same leg of the confined flux rope. Based on their emission process, the source of QPSs would have a stronger magnetic field and that of QPPs need a relatively weak magnetic field. Thus, they should originate from different locations in the flux rope.

4. Summary

Spikes are very important radio emissions in solar flares, which show different spectral patterns in the dynamic spectrum. In this paper, we present a new signature of spikes, that is, each group of spikes is divided into many quasi-periodic clusters with high polarization degree. Each cluster includes tens of individual spikes and coexists with one pulsation of QPPs. We study the spectral characters of the clusters of QPSs to understand their radiation process.
Most QPSs are concurrent with QPPs, and they appear in the middle or around the starting frequency of the pulsations. The emission of QPSs is stronger than that of QPPs, and the light curves include many bright short peaks and a smooth enhanced background. The pulses of QPPs clearly present frequency drifting from high to low frequency. There is a cut-off at the low-frequency range, and the emission is also enhanced there. The cluster of spikes has the same duration as the pulsations, and both of them present a negative exponential decay pattern as type III bursts. Thus, QPSs are closely related to the electron beams that also produce QPPs.
In each group of QPSs and QPPs, the global structure has no evident shift, so the source region may have a stable location. In addition, QPSs appear throughout the confined flare, but they appear out of the bright main peaks. QPSs disappear after the ejection of CME in the M2.6 flare. Hence, we conclude that both of QPSs and QPPs are emitted by nonthermal electron beams in the confined flux rope, not from the main flaring region. In the current-carrying flux rope, the tearing-mode oscillations modulate the evolution of small scale magnetic islands, which produce a periodical acceleration of electrons. These electron beams are transported inside the flux rope and generate QPSs and QPPs in the proper regions, respectively. When they stop in the closed magnetic field, the accumulated electrons may produce enhanced emissions there.
When fast electron beams travel in the thermal plasma, they generate pulsations via plasma emission (stream instability) and spikes via ECME (loss cone instability). They originated from the same leg of flux rope and presented the same sense of polarization. However, they are produced from different locations with different conditions of magnetic field and plasma. Both of them are modulated by the same acceleration process of electron beams. In each cluster, the spikes have no systematic distribution, both temporal and frequency. Hence, the formation of loss cone instability of electron beams could be stochastic around the suitable region. The increased density of electron beams would generate intenser emission and produce more sites of loss cone distribution of electrons. Therefore, more spikes are emitted in a wider frequency band. When the flux rope slowly rises, the source region of spikes would also shift upward. The evolution of the confined flux rope dominates the global change of the group structure, which provides the essential condition for the formation of QPSs. We did not present the image of QPSs and QPPs in this work, so we can not determine the exact locations. Our future objective is to process the imaging results to study the detailed distribution and evolution of QPSs.

Author Contributions

Software, C.T., Z.Z., W.W. and L.C.; validation, B.T., Y.Y. and Y.Z.; investigation, J.H. and X.C.; data curation, C.T., S.M. and M.Z.; writing—original draft preparation, J.H.; writing—review and editing, J.H. and B.T.; supervision, Y.Y.; project administration, J.H., B.T. and Y.Y. All authors have read and agreed to the published version of the manuscript.

Funding

This work is supported by NSFC Grants 11790301, 12173050, 11973057, 12003048 and 11941003, National Key R&D Program of China 2021YFA1600500, 2021YFA1600503, and the International Partnership Program of the Chinese Academy of Sciences (183311KYSB20200003). It is also supported by the Specialized Research Fund for State Key Laboratories.

Institutional Review Board Statement

Not applicable.

Informed Consent Statement

Not applicable.

Data Availability Statement

The data presented in this study are available on request from the corresponding author. The original data are not publicly available as the public link is being established.

Acknowledgments

We thank Lihong Geng, Lide Su and all the engineers in the MUSER team for operating and maintaining the equipment.

Conflicts of Interest

The authors declare no conflict of interest. The funders had no role in the design of the study; in the collection, analyses, or interpretation of data; in the writing of the manuscript, or in the decision to publish the results.

References

  1. Chernov, G.P. Microstructure in continuous emission of type IV meter bursts. Modulation of continuous emission by wave packets of whistlers. Sov. Astron. 1976, 20, 582. [Google Scholar]
  2. Isliker, H.; Benz, A.O. Catalogue of 1–3 GHz solar flare radio emission. Astron. Astrophys. Suppl. Ser. 1994, 104, 145–160. [Google Scholar]
  3. Chernov, G.P.; Fu, Q.J.; Lao, D.B.; Hanaoka, Y. Ion-Sound Model of Microwave Spikes with Fast Shocks in the Reconnection Region. Sol. Phys. 2001, 201, 153–180. [Google Scholar] [CrossRef]
  4. Karlický, M.; Bárta, M.; Jiřička, K.; Mészárosová, H.; Sawant, H.S.; Fernandes, F.C.R.; Cecatto, J.R. Radio bursts with rapid frequency variations—Lace bursts. Astron. Astrophys. 2001, 375, 638–642. [Google Scholar] [CrossRef] [Green Version]
  5. Fu, Q.J.; Yan, Y.H.; Liu, Y.Y.; Wang, M.; Wang, S.J. A New Catalogue of Fine Structures Superimposed on Solar Microwave Bursts. Chin. J. Astron. Astrophys. 2004, 4, 176–188. [Google Scholar] [CrossRef]
  6. Liu, Y.Y.; Fu, Q.J.; Yan, Y.H.; Tan, C.M. New results obtained from the solar radio spectrometer in decimeter wavelength with super-high temporal resolution. Publ. Natl. Astron. Obs. China 2006, 3, 119–127. [Google Scholar]
  7. Huang, J.; Yan, Y.; Liu, Y. An analysis of solar radio burst events on 1 December 2004. Adv. Space Res. 2007, 39, 1439–1444. [Google Scholar] [CrossRef]
  8. Kontar, E.P.; Yu, S.; Kuznetsov, A.A.; Emslie, A.G.; Alcock, B.; Jeffrey, N.L.S.; Melnik, V.N.; Bian, N.H.; Subramanian, P. Imaging spectroscopy of solar radio burst fine structures. Nat. Commun. 2017, 8, 1515. [Google Scholar] [CrossRef] [Green Version]
  9. Karlický, M.; Yasnov, L.V. Determination of Plasma Parameters in Radio Sources of Solar Zebra-patterns Based on Relations between the Zebra-stripe Frequencies and Gyro-harmonic Numbers. Astrophys. J. 2018, 867, 28. [Google Scholar] [CrossRef]
  10. Kuznetsov, A.A.; Kontar, E.P. First imaging spectroscopy observations of solar drift pair bursts. Astron. Astrophys. 2019, 631, L7. [Google Scholar] [CrossRef] [Green Version]
  11. Chen, X.; Kontar, E.P.; Chrysaphi, N.; Jeffrey, N.L.S.; Gordovskyy, M.; Yan, Y.; Tan, B. Subsecond Time Evolution of Type III Solar Radio Burst Sources at Fundamental and Harmonic Frequencies. Astrophys. J. 2020, 905, 43. [Google Scholar] [CrossRef]
  12. Reid, H.A.S.; Kontar, E.P. Fine structure of type III solar radio bursts from Langmuir wave motion in turbulent plasma. Nat. Astron. 2021, 5, 796–804. [Google Scholar] [CrossRef]
  13. Bastian, T.S.; Benz, A.O.; Gary, D.E. Radio Emission from Solar Flares. Annu. Rev. Astron. Astrophys. 1998, 36, 131–188. [Google Scholar] [CrossRef] [Green Version]
  14. Gary, D.E.; Keller, C.U. (Eds.) Solar and Space Weather Radiophysics–Current Status and Future Developments; Astrophysics and Space Science Library, Kluwer Academic Publishers: Dordrecht, The Netherlands, 2004; Volume 314. [Google Scholar]
  15. Aschwanden, M.J. Physics of the Solar Corona: An Introduction; Praxis Publishing Ltd.: Chichester, UK; Springer: Berlin, Germany, 2004. [Google Scholar]
  16. Benz, A.O. Radio Spikes and the Fragmentation of Flare Energy Release. Sol. Phys. 1985, 96, 357–370. [Google Scholar] [CrossRef]
  17. Guedel, M.; Benz, A.O. Time profiles of solar radio spikes. Astron. Astrophys. 1990, 231, 202–212. [Google Scholar]
  18. Altyntsev, A.T.; Grechnev, V.V.; Zubkova, G.N.; Kardapolova, N.N.; Lesovoi, S.V.; Rosenraukh, Y.M.; Treskov, T.A. Observations of solar microwave spikes with high spatial resolution at the SSRT: First results. Astron. Astrophys. 1995, 303, 249. [Google Scholar]
  19. Zlobec, P.; Karlický, M. Narrowband dm-SPIKES Observed during the 15 June 1991 Flare. Sol. Phys. 1998, 182, 477–496. [Google Scholar] [CrossRef]
  20. Ma, Y.; Xie, R.; Zheng, X.; Huang, G. Observations and analyses of solar radio metric narrow-band fast pulsation phenomena. Sol. Phys. 2003, 214, 353–360. [Google Scholar] [CrossRef]
  21. Rozhansky, I.V.; Fleishman, G.D.; Huang, G.L. Millisecond Microwave Spikes: Statistical Study and Application for Plasma Diagnostics. Astrophys. J. 2008, 681, 1688–1697. [Google Scholar] [CrossRef] [Green Version]
  22. Melnik, V.N.; Shevchuk, N.V.; Konovalenko, A.A.; Rucker, H.O.; Dorovskyy, V.V.; Poedts, S.; Lecacheux, A. Solar Decameter Spikes. Sol. Phys. 2014, 289, 1701–1714. [Google Scholar] [CrossRef]
  23. Chen, B.; Bastian, T.S.; Shen, C.; Gary, D.E.; Krucker, S.; Glesener, L. Particle acceleration by a solar flare termination shock. Science 2015, 350, 1238–1242. [Google Scholar] [CrossRef] [Green Version]
  24. Clarkson, D.L.; Kontar, E.P.; Gordovskyy, M.; Chrysaphi, N.; Vilmer, N. First Frequency-time-resolved Imaging Spectroscopy Observations of Solar Radio Spikes. Astrophys. J. Lett. 2021, 917, L32. [Google Scholar] [CrossRef]
  25. Benz, A.O.; Su, H.; Magun, A.; Stehling, W. Millisecond microwave spikes at 8 GHz during solar flares. Astron. Astrophys. Suppl. Ser. 1992, 93, 539–544. [Google Scholar]
  26. Csillaghy, A.; Benz, A.O. The bandwidth of millisecond radio spikes in solar flares. Astron. Astrophys. 1993, 274, 487. [Google Scholar]
  27. Fleishman, G.D.; Gary, D.E.; Nita, G.M. Decimetric Spike Bursts versus Microwave Continuum. Astrophys. J. 2003, 593, 571–580. [Google Scholar] [CrossRef]
  28. Armatas, S.; Bouratzis, C.; Hillaris, A.; Alissandrakis, C.E.; Preka-Papadema, P.; Moussas, X.; Mitsakou, E.; Tsitsipis, P.; Kontogeorgos, A. Detection of spike-like structures near the front of type-II bursts. Astron. Astrophys. 2019, 624, A76. [Google Scholar] [CrossRef] [Green Version]
  29. Guedel, M. Solar radio spikes—Radiation at harmonics S = 2–6. Astron. Astrophys. 1990, 239, L1–L4. [Google Scholar]
  30. Krucker, S.; Benz, A.O. The frequency ratio of bands of microwave spikes during solar flares. Astron. Astrophys. 1994, 285, 1038–1046. [Google Scholar]
  31. Feng, S.W. The properties of solar radio spikes with harmonics and the associated EUV brightenings. Astrophys. Space Sci. 2019, 364, 4. [Google Scholar] [CrossRef]
  32. Luo, Y.; Chen, B.; Yu, S.; Bastian, T.S.; Krucker, S. Radio Spectral Imaging of an M8.4 Eruptive Solar Flare: Possible Evidence of a Termination Shock. Astrophys. J. 2021, 911, 4. [Google Scholar] [CrossRef]
  33. Battaglia, M.; Sharma, R.; Luo, Y.; Chen, B.; Yu, S.; Krucker, S. Multiple Electron Acceleration Instances during a Series of Solar Microflares Observed Simultaneously at X-Rays and Microwaves. Astrophys. J. 2021, 922, 134. [Google Scholar] [CrossRef]
  34. Tan, B.l.; Cheng, J.; Tan, C.m.; Kou, H.x. Scaling-laws of Radio Spike Bursts and Their Constraints on New Solar Radio Telescopestwo. Chin. Astron. Astrophys. 2019, 43, 59–74. [Google Scholar] [CrossRef]
  35. Benz, A.O.; Saint-Hilaire, P.; Vilmer, N. Location of narrowband spikes in solar flares. Astron. Astrophys. 2002, 383, 678–684. [Google Scholar] [CrossRef] [Green Version]
  36. Shevchuk, N.V.; Melnik, V.N.; Poedts, S.; Dorovskyy, V.V.; Magdalenic, J.; Konovalenko, A.A.; Brazhenko, A.I.; Briand, C.; Frantsuzenko, A.V.; Rucker, H.O.; et al. The Storm of Decameter Spikes During the Event of 14 June 2012. Sol. Phys. 2016, 291, 211–228. [Google Scholar] [CrossRef]
  37. Bouratzis, C.; Hillaris, A.; Alissandrakis, C.E.; Preka-Papadema, P.; Moussas, X.; Caroubalos, C.; Tsitsipis, P.; Kontogeorgos, A. High resolution observations with Artemis-IV and the NRH. I. Type IV associated narrow-band bursts. Astron. Astrophys. 2016, 586, A29. [Google Scholar] [CrossRef] [Green Version]
  38. Benz, A.O.; Jaeggi, M.; Zlobec, P. Fine structure near the starting frequency of solar type III radio bursts. Astron. Astrophys. 1982, 109, 305–313. [Google Scholar]
  39. Chen, B.; Shen, C.; Reeves, K.K.; Guo, F.; Yu, S. Radio Spectroscopic Imaging of a Solar Flare Termination Shock: Split-band Feature as Evidence for Shock Compression. Astrophys. J. 2019, 884, 63. [Google Scholar] [CrossRef] [Green Version]
  40. Khan, J.I.; Aurass, H. Observations of the coronal dynamics associated with solar radio spike burst emission. Astron. Astrophys. 2006, 457, 319–328. [Google Scholar] [CrossRef] [Green Version]
  41. Battaglia, M.; Benz, A.O. Do solar decimetric spikes originate in coronal X-ray sources? Astron. Astrophys. 2009, 499, L33–L36. [Google Scholar] [CrossRef] [Green Version]
  42. Brown, R.L.; Crane, P.C. On the rapidly variable circular polarization of HR 1099 at radio frequencies. Astron. J. 1978, 83, 1504–1509. [Google Scholar] [CrossRef]
  43. Melrose, D.B.; Dulk, G.A. Electron-cyclotron masers as the source of certain solar and stellar radio bursts. Astrophys. J. 1982, 259, 844–858. [Google Scholar] [CrossRef]
  44. Robinson, P.A. Electron Cyclotron Maser Emission in Solar Microwave Spike Bursts. Sol. Phys. 1991, 134, 299–314. [Google Scholar] [CrossRef]
  45. Karlický, M.; Benáček, J.; Rybák, J. Narrowband Spikes Observed during the 2013 November 7 Flare. Astrophys. J. 2021, 910, 108. [Google Scholar] [CrossRef]
  46. Stepanov, A.V.; Kliem, B.; Krüger, A.; Hildebrandt, J.; Garaimov, V.I. Second-Harmonic Plasma Radiation of Magnetically Trapped Electrons in Stellar Coronae. Astrophys. J. 1999, 524, 961–973. [Google Scholar] [CrossRef]
  47. Bárta, M.; Karlický, M. Turbulent plasma model of the narrowband dm-spikes. Astron. Astrophys. 2001, 379, 1045–1051. [Google Scholar] [CrossRef] [Green Version]
  48. Wu, D.J.; Huang, J.; Tang, J.F.; Yan, Y.H. Solar Microwave Drifting Spikes and Solitary Kinetic Alfvén Waves. Astrophys. J. 2007, 665, L171–L174. [Google Scholar] [CrossRef]
  49. Yan, Y.; Chen, Z.; Wang, W.; Liu, F.; Geng, L.; Chen, L.; Tan, C.; Chen, X.; Su, C.; Tan, B. Mingantu Spectral Radioheliograph for Solar and Space Weather Studies. Front. Astron. Space Sci. 2021, 8, 20. [Google Scholar] [CrossRef]
  50. Yan, Y.; Tan, C.; Xu, L.; Ji, H.; Fu, Q.; Song, G. Nonlinear calibration and data processing of the solar radio burst. Sci. China A Math. 2002, 45, 89–96. [Google Scholar] [CrossRef]
  51. Tan, C.; Yan, Y.; Tan, B.; Xu, G. Calibration of the solar radio spectrometer. Sci. China Phys. Mech. Astron. 2009, 52, 1760–1764. [Google Scholar] [CrossRef]
  52. Tan, C.; Yan, Y.; Tan, B.; Fu, Q.; Liu, Y.; Xu, G. Study of Calibration of Solar Radio Spectrometers and the Quiet-Sun Radio Emission. Astrophys. J. 2015, 808, 61. [Google Scholar] [CrossRef] [Green Version]
  53. Nakariakov, V.M.; Melnikov, V.F. Quasi-Periodic Pulsations in Solar Flares. Space Sci. Rev. 2009, 149, 119–151. [Google Scholar] [CrossRef]
  54. Tan, B.; Zhang, Y.; Tan, C.; Liu, Y. Microwave Quasi-Periodic Pulsations in Multi-timescales Associated with a Solar Flare/CME Event. Astrophys. J. 2010, 723, 25–39. [Google Scholar] [CrossRef] [Green Version]
  55. Tan, B.; Tan, C. Microwave Quasi-periodic Pulsation with Millisecond Bursts in a Solar Flare on 2011 August 9. Astrophys. J. 2012, 749, 28. [Google Scholar] [CrossRef] [Green Version]
  56. Chen, X.; Yan, Y.; Tan, B.; Huang, J.; Wang, W.; Chen, L.; Zhang, Y.; Tan, C.; Liu, D.; Masuda, S. Quasi-periodic Pulsations before and during a Solar Flare in AR 12242. Astrophys. J. 2019, 878, 78. [Google Scholar] [CrossRef]
  57. Li, D.; Feng, S.; Su, W.; Huang, Y. Preflare very long-periodic pulsations observed in Hα emission before the onset of a solar flare. Astron. Astrophys. 2020, 639, L5. [Google Scholar] [CrossRef]
  58. Hong, Z.; Li, D.; Zhang, M.; Tan, C.; Ma, S.; Ji, H. Multi-Wavelength Observations of Quasi-Periodic Pulsations in a Solar Flare. Sol. Phys. 2021, 296, 171. [Google Scholar] [CrossRef]
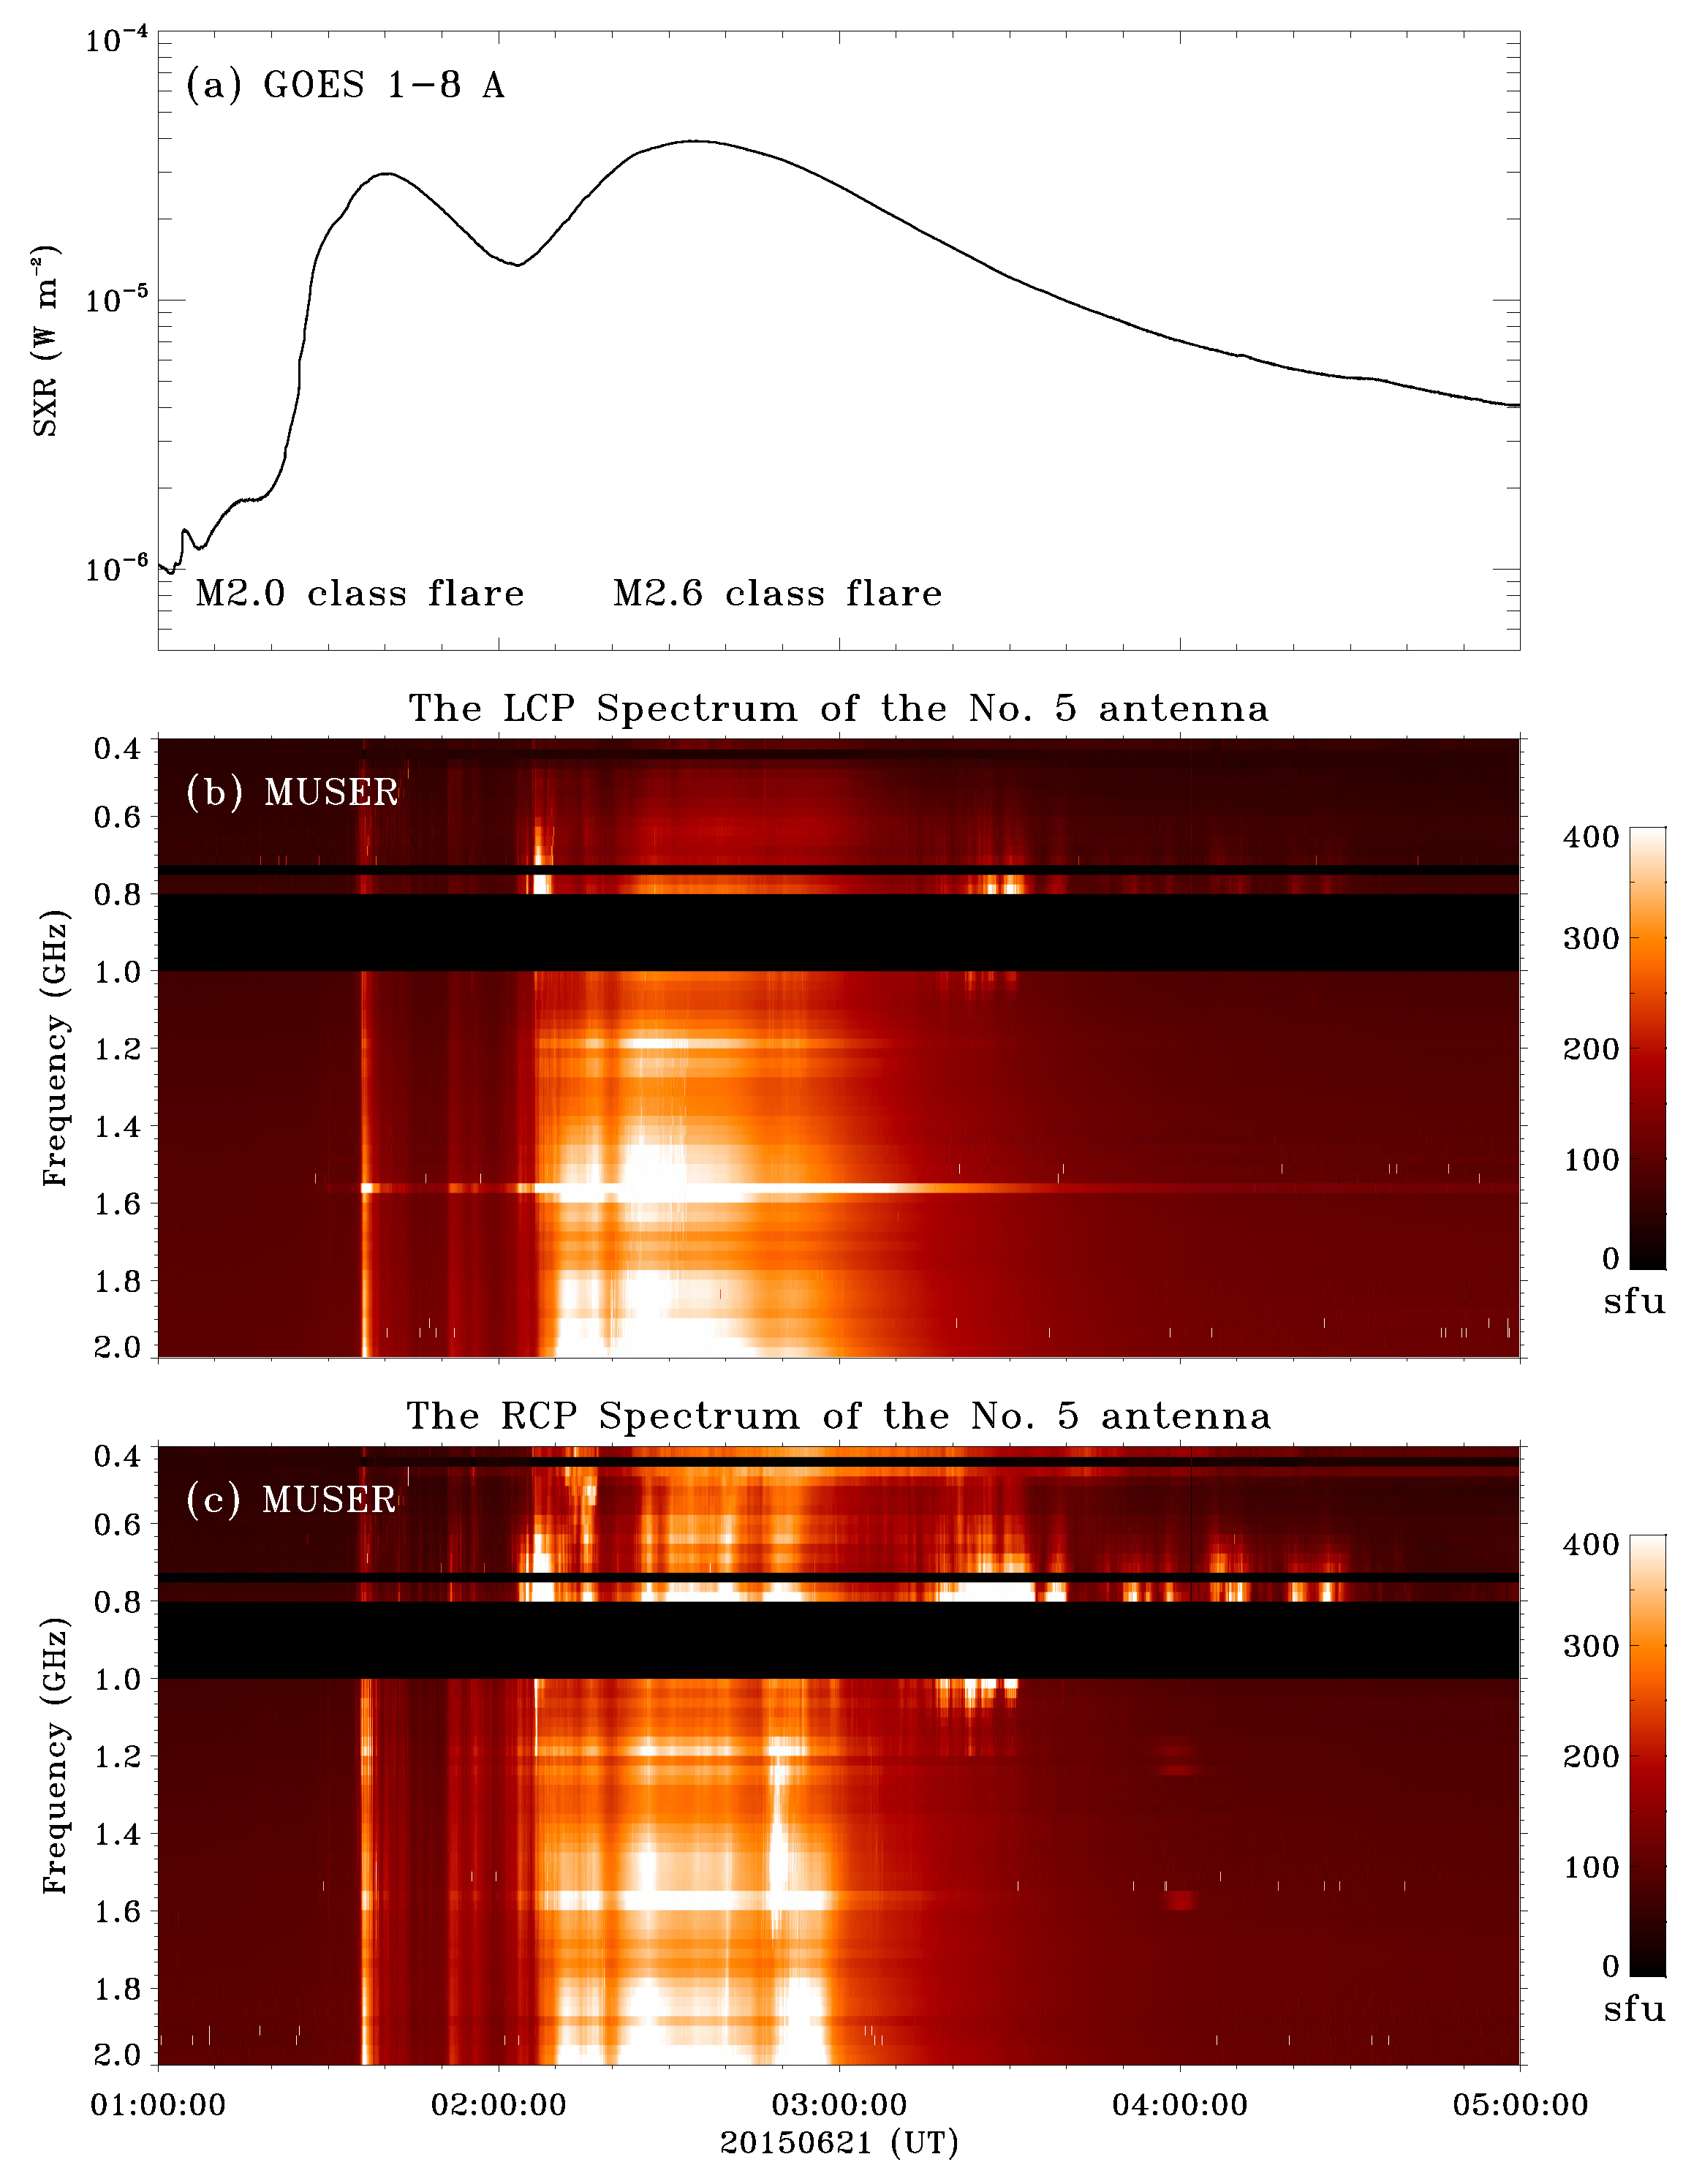
Figure 1. (a) The GOES SXR flux at 1–8 Å from 01:00 UT to 05:00 UT. (b) The LCP spectrum at 0.4–2 GHz observed by the No.5 antenna of MUSER-I. (c) The RCP spectrum at 0.4–2 GHz observed by the No.5 antenna of MUSER-I.
Universe 08 00348 g001
Figure 2. (a,b) The LCP and RCP spectrum from 01:31:58.597 UT to 01:32:13.597 UT observed by No.5 antenna of MUSER-I. (c) The zoomed-in spectral structure of QPSs from 01:32:07.846 UT. (d) The temporal evolution of the intensity of spikes by subtracting the continuum emission. (e) The frequency distribution of the intensity of spikes by subtracting the continuum emission.
Universe 08 00348 g002
Figure 3. (a,b) The spectrum from 01:39:41.97 UT to 01:39:56.97 UT in LCP and RCP observed by the No.5 antenna of MUSER-I. (c) The zoomed-in spectral structure of QPSs from 01:39:54.847 UT. (d) The temporal evolution of the intensity of spikes by subtracting the continuum emission. (e) The frequency distribution of the intensity of spikes by subtracting the continuum emission.
Universe 08 00348 g003
Figure 4. (a,b) The spectrum from 01:47:26.135 UT to 01:47:51.135 UT in LCP and RCP observed by the No.5 antenna of MUSER-I. (c) The zoomed-in spectral structure of QPSs from 01:47:39.585 UT. (d) The temporal evolution of the intensity of spikes by subtracting the continuum emission. (e) The frequency distribution of the intensity of spikes by subtracting the continuum emission.
Universe 08 00348 g004
Figure 5. (a,b) The spectrum from 01:53:38.635 UT to 01:54:11.135 UT in LCP and RCP observed by the No.5 antenna of MUSER-I. (c) The zoomed-in spectral structure of QPSs from 01:53:47.260 UT. (d) The temporal evolution of the intensity of spikes by subtracting the continuum emission. (e) The frequency distribution of the intensity of spikes by subtracting the continuum emission.
Universe 08 00348 g005
Figure 6. (a) The radio flux at 0.6 (blue), 1.1 (red) and 2 (black) GHz by the No.5 antenna of MUSER-I from 01:30 UT to 02:00 UT. (b) The RCP spectrum at 0.4–2 GHz observed by the No.5 antenna of MUSER-I. The white dashed line is the GOES flux, and the green boxes cover the temporal and frequency range of QPSs. (c) The spectral distribution of the relative bandwidth of the whole group of QPSs. (d) The spectral distribution of the duration of the clusters in QPSs.
Universe 08 00348 g006
Figure 7. (a) The plot of the duration and the bandwidth of the clusters in sample III. (b) The plot of the sum of the flux at 1.85 GHz of QPPs and the bandwidth of the clusters in sample III. (c) The plot of the sum of the flux of spikes and the bandwidth of the clusters in sample III.
Universe 08 00348 g007
Publisher’s Note: MDPI stays neutral with regard to jurisdictional claims in published maps and institutional affiliations.