Article

One-Minute Quasi-Periodic Pulsations during an M-Class Solar Flare

1
Key Laboratory of Dark Matter and Space Science, Purple Mountain Observatory, Chinese Academy of Sciences, Nanjing 210033, China
2
School of Astronomy and Space Science, University of Science and Technology of China, Hefei 230026, China
*
Author to whom correspondence should be addressed.
Universe 2022, 8(2), 104; https://doi.org/10.3390/universe8020104
Submission received: 7 January 2022 / Revised: 1 February 2022 / Accepted: 3 February 2022 / Published: 5 February 2022
(This article belongs to the Special Issue Solar Coronal Loop Dynamics)

Abstract

:
We study the Quasi-Periodic Pulsations (QPPs) of an M4.4 class solar flare, which occurred in active region NOAA 11165 on 8 March 2011. With the Fast Fourier Transform (FFT) method, we decompose the flare light curve into fast- and slowly-varying components. The 100 s (0.01 Hz) is selected as the cutoff threshold between the fast- and slowly-varying components. One-minute QPPs are found around flare peak at soft X-ray (SXR) and Extreme Ultraviolet (EUV). Using the data from the Atmospheric Imaging Assembly (AIA) onboard the Solar Dynamics Observatory (SDO), the intermittent jets are detected and the interesting fact is that the jets also display one-minute period. The correlationship between the fast-varying components of SXR or EUV emissions and the jets suggests that the QPPs on light curves and periodic jets could come from the same origination, e.g., the periodic magnetic reconnection in this event.

1. Introduction

Quasi-Periodic Pulsations (QPPs) are the common phenomena of flare light curves with periodic behavior. They are observed in almost all ranges of the electromagnetic spectrum, from radio waves to γ -rays, and at various stages of flares [1]. Based on previous observations, the periods of QPPs were discovered with a wide range, from subseconds to seconds or minutes [2]. Some events are discovered to show QPPs with multiple periods [2,3,4]. In addition, in a same flare, QPPs display the time delay in the various wavelengths [5]. Sych et al. [6] and Kashapova et al. [7] found three-minute long period QPPs in the flare which situated close to the sunspot, respectively. Li et al. [8] found medium period QPPs about 50 s and 100 s in X-ray emission during the impulsive phase of a flare, they also reported one-minute QPPs in other flares with multi-wavelength observations [9,10]. Nakariakov et al. [11] identified the short period QPPs around 1.4 s and 0.7 s in radio emission during a microflare, which shows irregular QPPs pattern.
Different periods may be related with different physical processes. For example, long periods such as about three minutes may originate from the modulation of sunspot oscillations [6,7], five-minute period could relate to the solar photospheric 5 min oscillations [2,12]. Short periods (subseconds and seconds) detected in the radio emission can be explained in terms of plasma waves interact with the accelerated particles [13]. The medium periods (tens of seconds) are usually explained by magnetohydrodynamic (MHD) oscillations, i.e., eigenmodes of a magnetic flux tube oscillations, especially sausage [14,15,16] and kink [16,17] modes. Furthermore, periodic magnetic reconnection is also one possible mechanism, including reconnection triggered periodically by external waves [3,18] and oscillatory reconnection (i.e., repetitive spontaneous reconnection) [19]. Various possibilities make it a very important task to identify the specific mechanism responsible for the observed QPPs events.
Many progresses about the QPPs have been made in observations and simulations. So far, at least fifteen mechanisms have been proposed to explain QPPs in solar flares [1]. However, the current observations can not provide all the necessary information about the sources of QPPs, there is far from a consensus on the origin of QPPs. If the mechanism was understood, then QPPs could provide information for diagnosis of astrophysical plasmas. Nakariakov [20] suggested that QPPs of flaring energy releases can be associated with MHD oscillations, and discussed the use of MHD waves for remote diagnostics of coronal plasmas. Kolotkov et al. [16] estimated the aspect ratio of the flare loop L/R ≈ 12 by assuming the short period of QPPs was attributed to the fundamental sausage mode.
In this article, one-minute QPPs are observed in soft X-ray (SXR) and Extreme Ultraviolet (EUV) wavelengths during an M-class solar flare on 8 March 2011. The data used here are from the Geostationary Operational Environmental Satellites (GOES), the Reuven Ramaty High Energy Solar Spectroscopic Imager (RHESSI) [21], the Atmospheric Imaging Assembly (AIA) [22] and the Extreme Ultraviolet Variability Experiment (EVE) [23] onboard the Solar Dynamics Observatory (SDO) [24]. It is interesting that this event display the QPPs with one-minute period and they seem to be originated from the periodic jets, which will help us to further understand the QPPs mechanism.

2. Observation and Measurement

The event studied here is an M4.4 class flare on 8 March 2011. According to GOES SXR observations, it started at 18:08 UT, peaked at 18:20 UT and ended at around 18:30 UT. This flare occurred in active region NOAA 11165, which is located at solar limb and the coordinate of the active region is S20W91 (891″,−320″). It is a limb event and the flare ribbons at optics and footpoints sources at hard X-ray (HXR) are occulted by the solar disk. Therefore, the HXR emissions, especially above 50 keV are missed by RHESSI. Additionally, this flare was also accompanied with coronal mass ejection (CME) detected by SOHO/LASCO1, whose width is only 43 degrees, and it is a narrow CME. Its initial speed was low (283 km/s). The onset time was 17:44:34 or 17:55:05 UT. This means that the flare (start time 18:08 UT) and the CME, they are simultaneous events.
Figure 1a shows the original GOES light curves of this event. Low-frequency or aperiodic trend make it difficult to distinguish the QPPs by naked eye. The QPPs are superposed on the strong background emission. In order to recognize the QPPs, we use several mathematical tools. Firstly, with Fast Fourier Transform (FFT) method [25], the original GOES light curves are decomposed into slowly-varying components (purple curves in Figure 1a, having multiplied by 0.8 to prevent overlap with original curves) and fast-varying components (Figure 1b). The FFT power spectrum is calculated from the GOES light curve. Similar to the past study [26], we selected the 0.01 Hz (100 s) to split the FFT power spectra into a lower and a higher frequency domain. Then, the lower and higher frequency signals in frequency domain are transformed to slowly- and fast-varying components, respectively. Figure 1b shows that the fast-varying components exhibit the oscillatory behavior, i.e., QPPs at both 0.5–4 A ˚ (red) and 1–8 A ˚ (green). They are almost oscillating in the same phase, and their correlation coefficient is 0.94. Secondly, Figure 1c is the wavelet spectrum of the fast-varying component of GOES 0.5–4 A ˚ between 18:06 UT and 18:34 UT. It is clear to see that the period is around one minute and the significant level is over 95%. The maximum amplitude of QPPs occurred at around 18:14 UT correspond to the impulsive phase of the flare.
These QPPs are also detected by the RHESSI and SDO/EVE. RHESSI observed this event before 18:23 UT due to the nighttime latter. Figure 2 (top panels) shows the light curves of RHESSI at 6–12 keV and 12–25 keV, and SDO/EVE ESP at 0.1–7 nm. Using the same method as before, the original light curves are decomposed into the slowly-varying components (purple curves in top panels, multiplied by 0.8), and fast-varying components (middle panels), which exhibit the QPPs at 6–12 keV, 12–25 keV and 0.1–7 nm, respectively. Similar to the oscillating behavior between GOES 0.5–4 A ˚ and 1–8 A ˚ , the QPPs are almost oscillating in the same phase between RHESSI 6–12 keV and 12–25 keV, and their correlation coefficient is 0.89. Therefore, bottom panels show the wavelet spectra of the fast-varying components at RHESSI 6–12 keV and ESP 0.1–7 nm. The dominant oscillating period is also around one minute and the significant level is over 95%.
As mentioned before, this flare is a limb event and well detected by SDO/AIA at 9 wavelengths. Figure 3 gives the flare images around 18:21 UT at 94 A ˚ , 131 A ˚ , 171 A ˚ , 193 A ˚ , 211 A ˚ , 304 A ˚ , 335 A ˚ , 1600 A ˚ , and 1700 A ˚ . It is an occulted event, and the structures on disk such as flare ribbons or footpoint sources are missed from AIA and RHESSI. Figure 3 also shows RHESSI X-ray sources superposed with the contours or triangles at 6–12 keV (a,d), 12–25 keV (b,e) and 25–50 keV (c,f), respectively. Here RHESSI X-ray sources were imaged by the detectors 3-9F and the CLEAN Image Reconstruction Algorithm2. Different colors represent the time evolution as shown by the colorbar. These X-ray sources are located outside the solar disk and they are coronal sources [27,28]. The X-ray coronal sources move upward on the impulsive phase, i.e., from 18:13 UT to 18:15 UT, and then return back. Figure 4 gives the relative distance between RHESSI X-ray sources and that at 18:10:42 UT, whose locations are shown in black triangle in the middle panels of Figure 3. The X-ray sources reach the maximum height around 30 arc seconds at 18:16:33 UT. It is interesting that the QPPs take place at the interval of X-ray source movement, i.e., from 18:13 UT to 18:17 UT in Figure 2 (left panels).
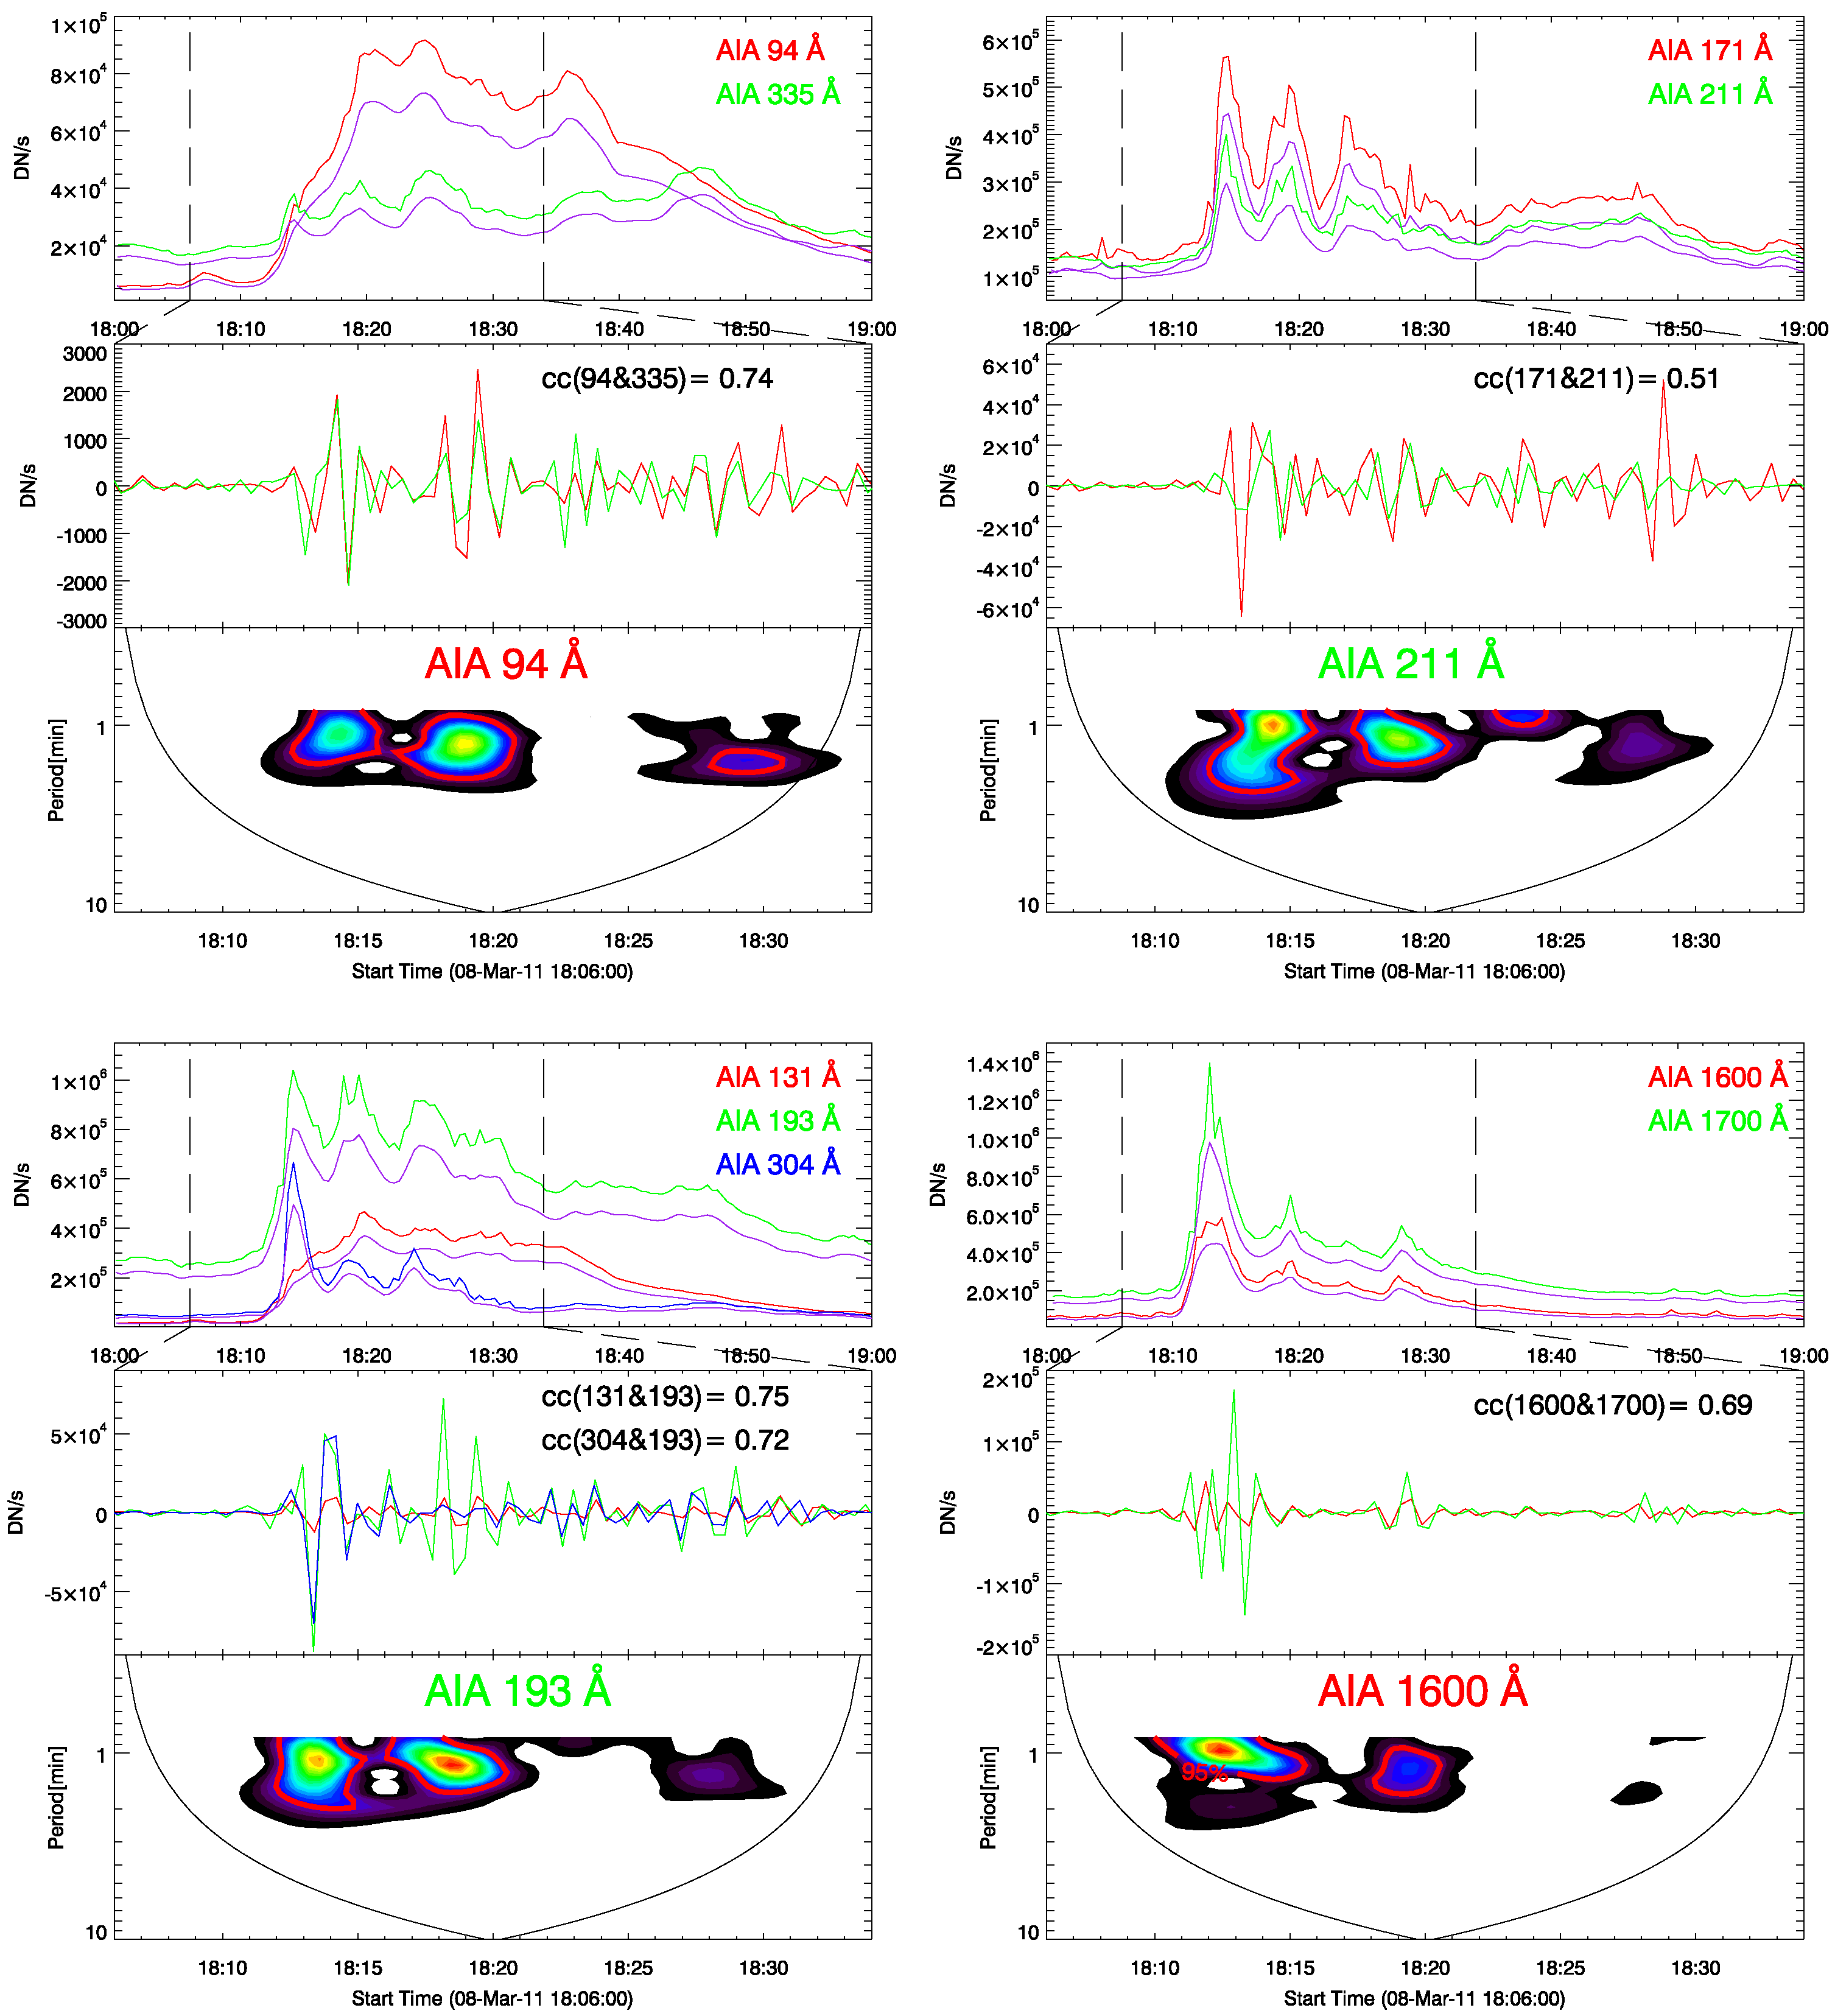
As noted earlier, although this event is an occulted flare, its intense radiation results into the saturation on AIA images. Except for the saturated region, it is possible for us to detect the one-minute QPPs from AIA data. The black box in Figure 3 is near flare footpoint without any saturation during its lifetime. Figure 5 gives the light curves of this region at AIA nine wavelengths. Using the same method, the original light curves are decomposed into the fast- and slowly-varying components. As shown in the middle panels, the fast-varying components of all 9 AIA channels are expected to display the QPP behavior, and they are oscillating almost in the same phase. The correlation coefficients are given. Each bottom panel shows the wavelet spectrum. Four channels such as 94 A ˚ , 211 A ˚ , 193 A ˚ and 1600 A ˚ are given here because the wavelet analysis of 9 AIA channels are similar each other. Their wavelet spectra further confirm the one-minute QPPs during the interval from 18:13 UT to 18:20 UT.

3. Results

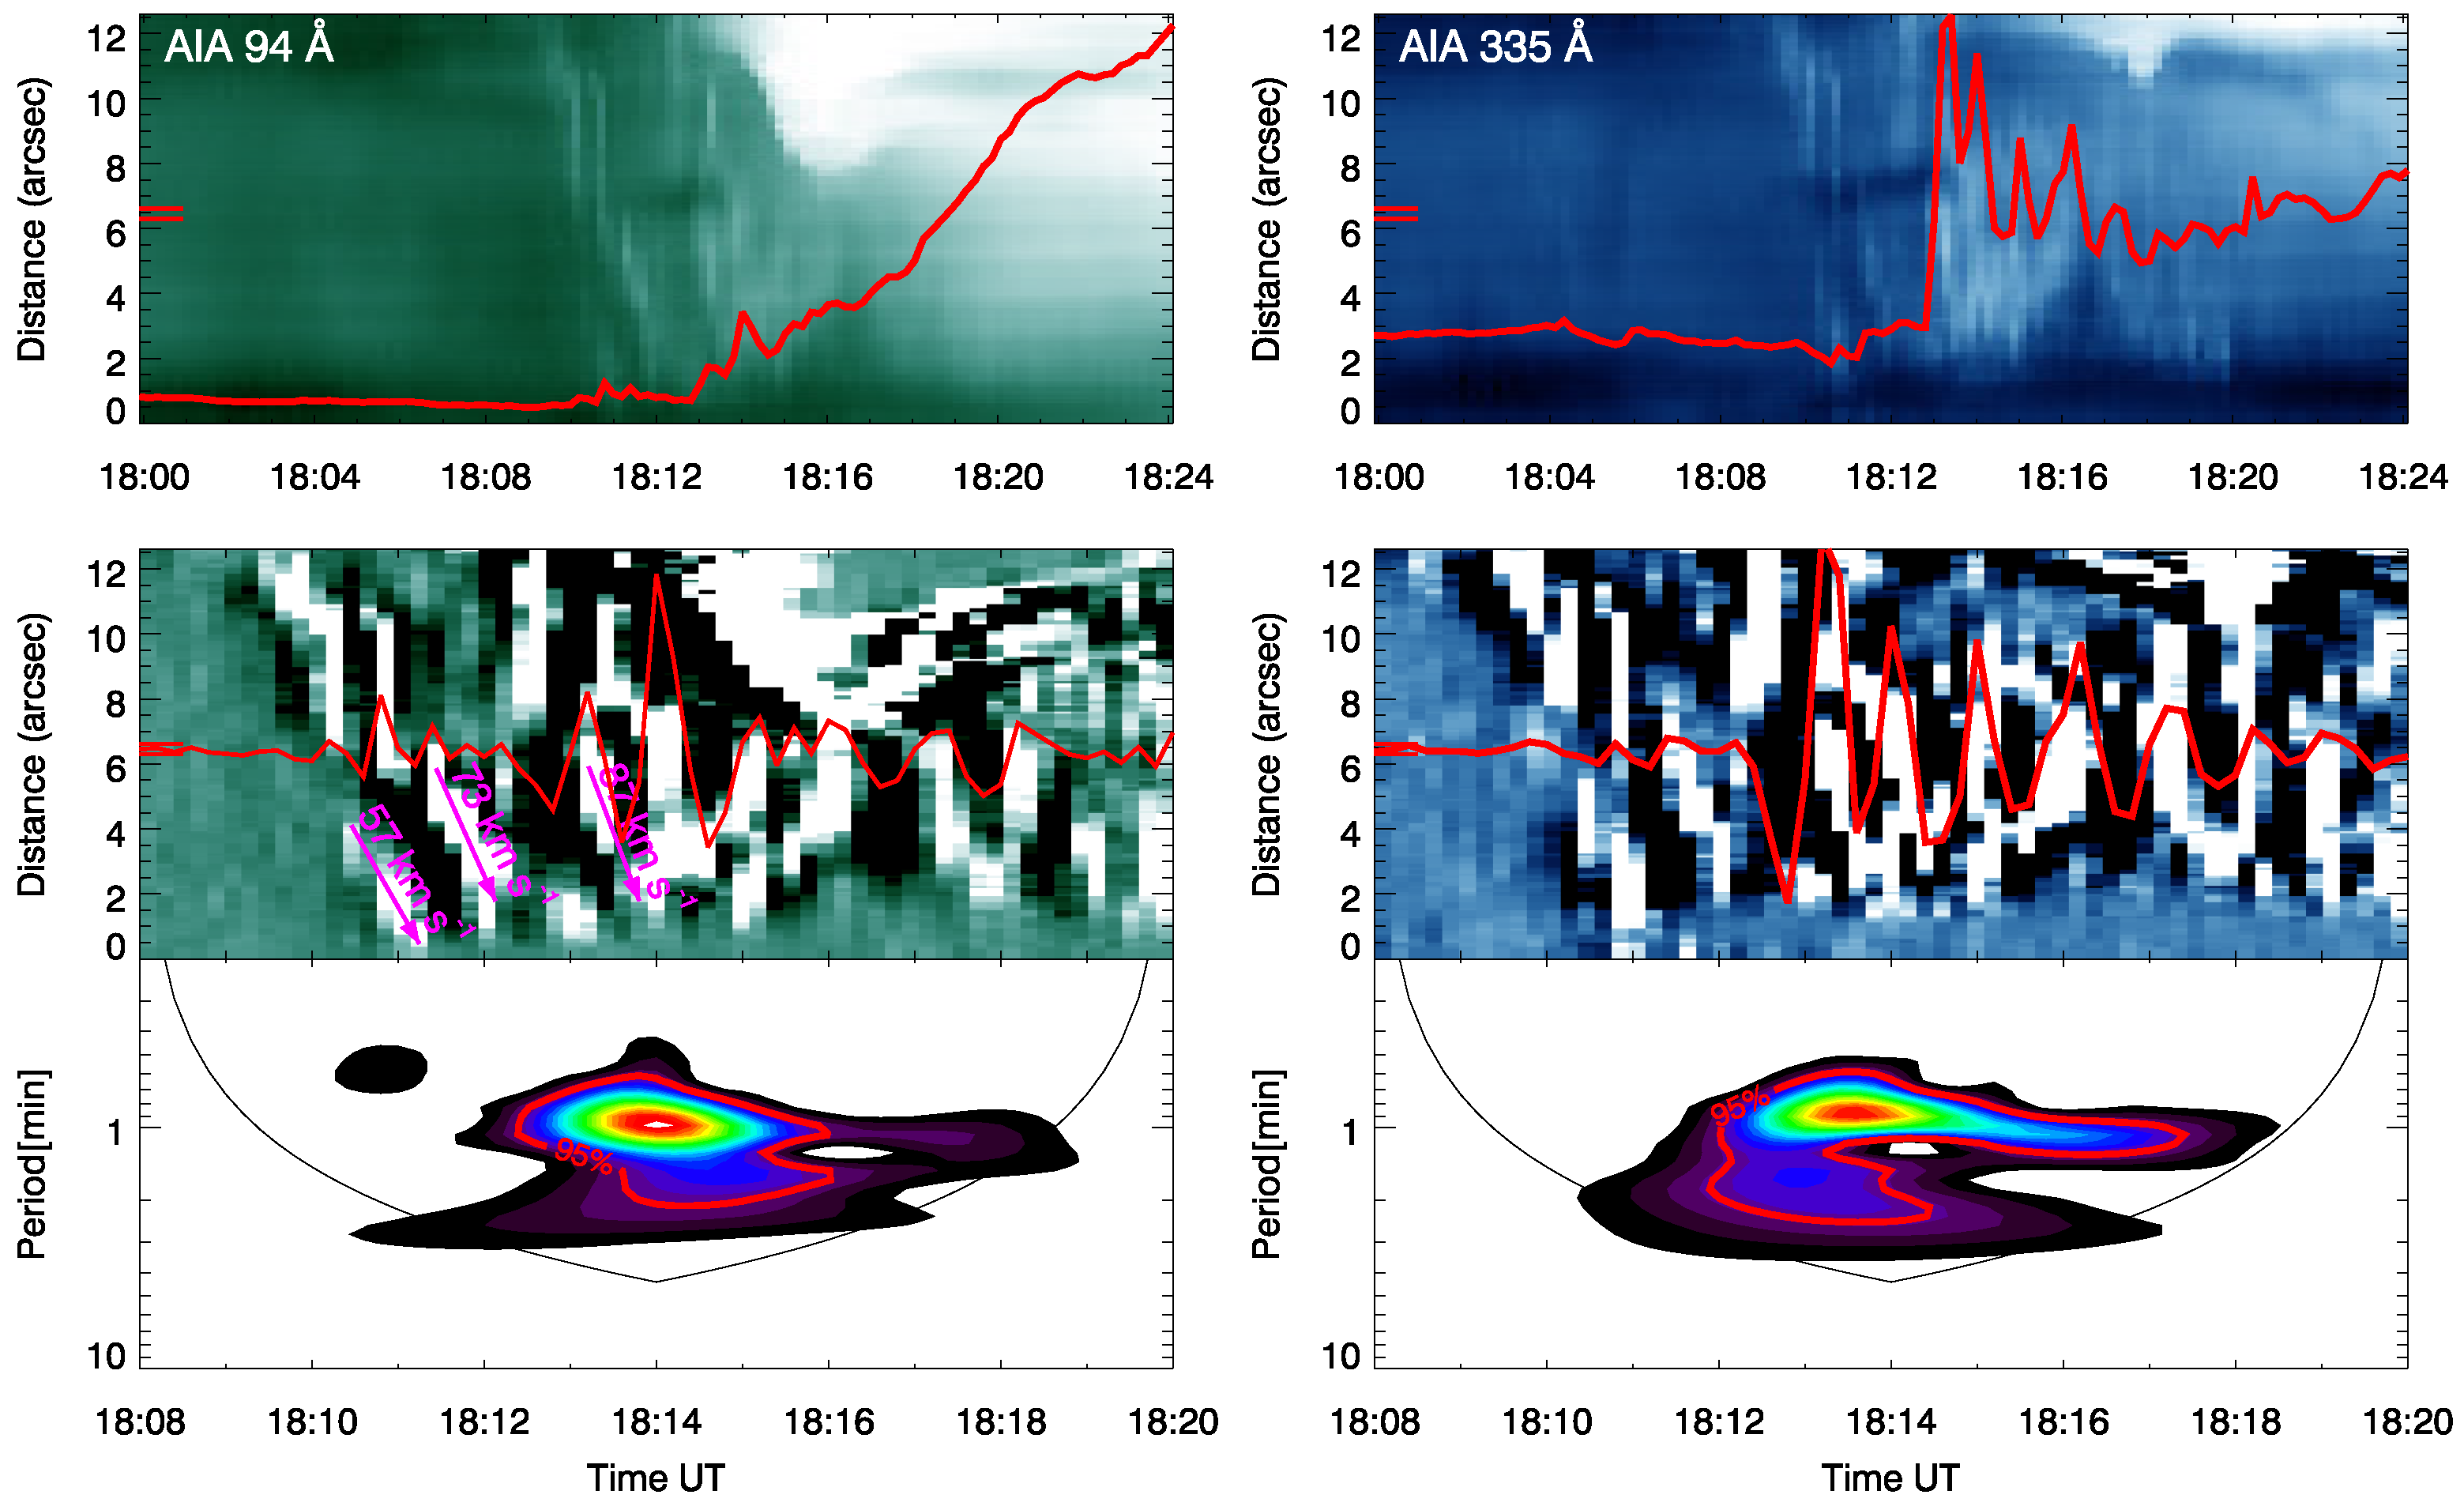
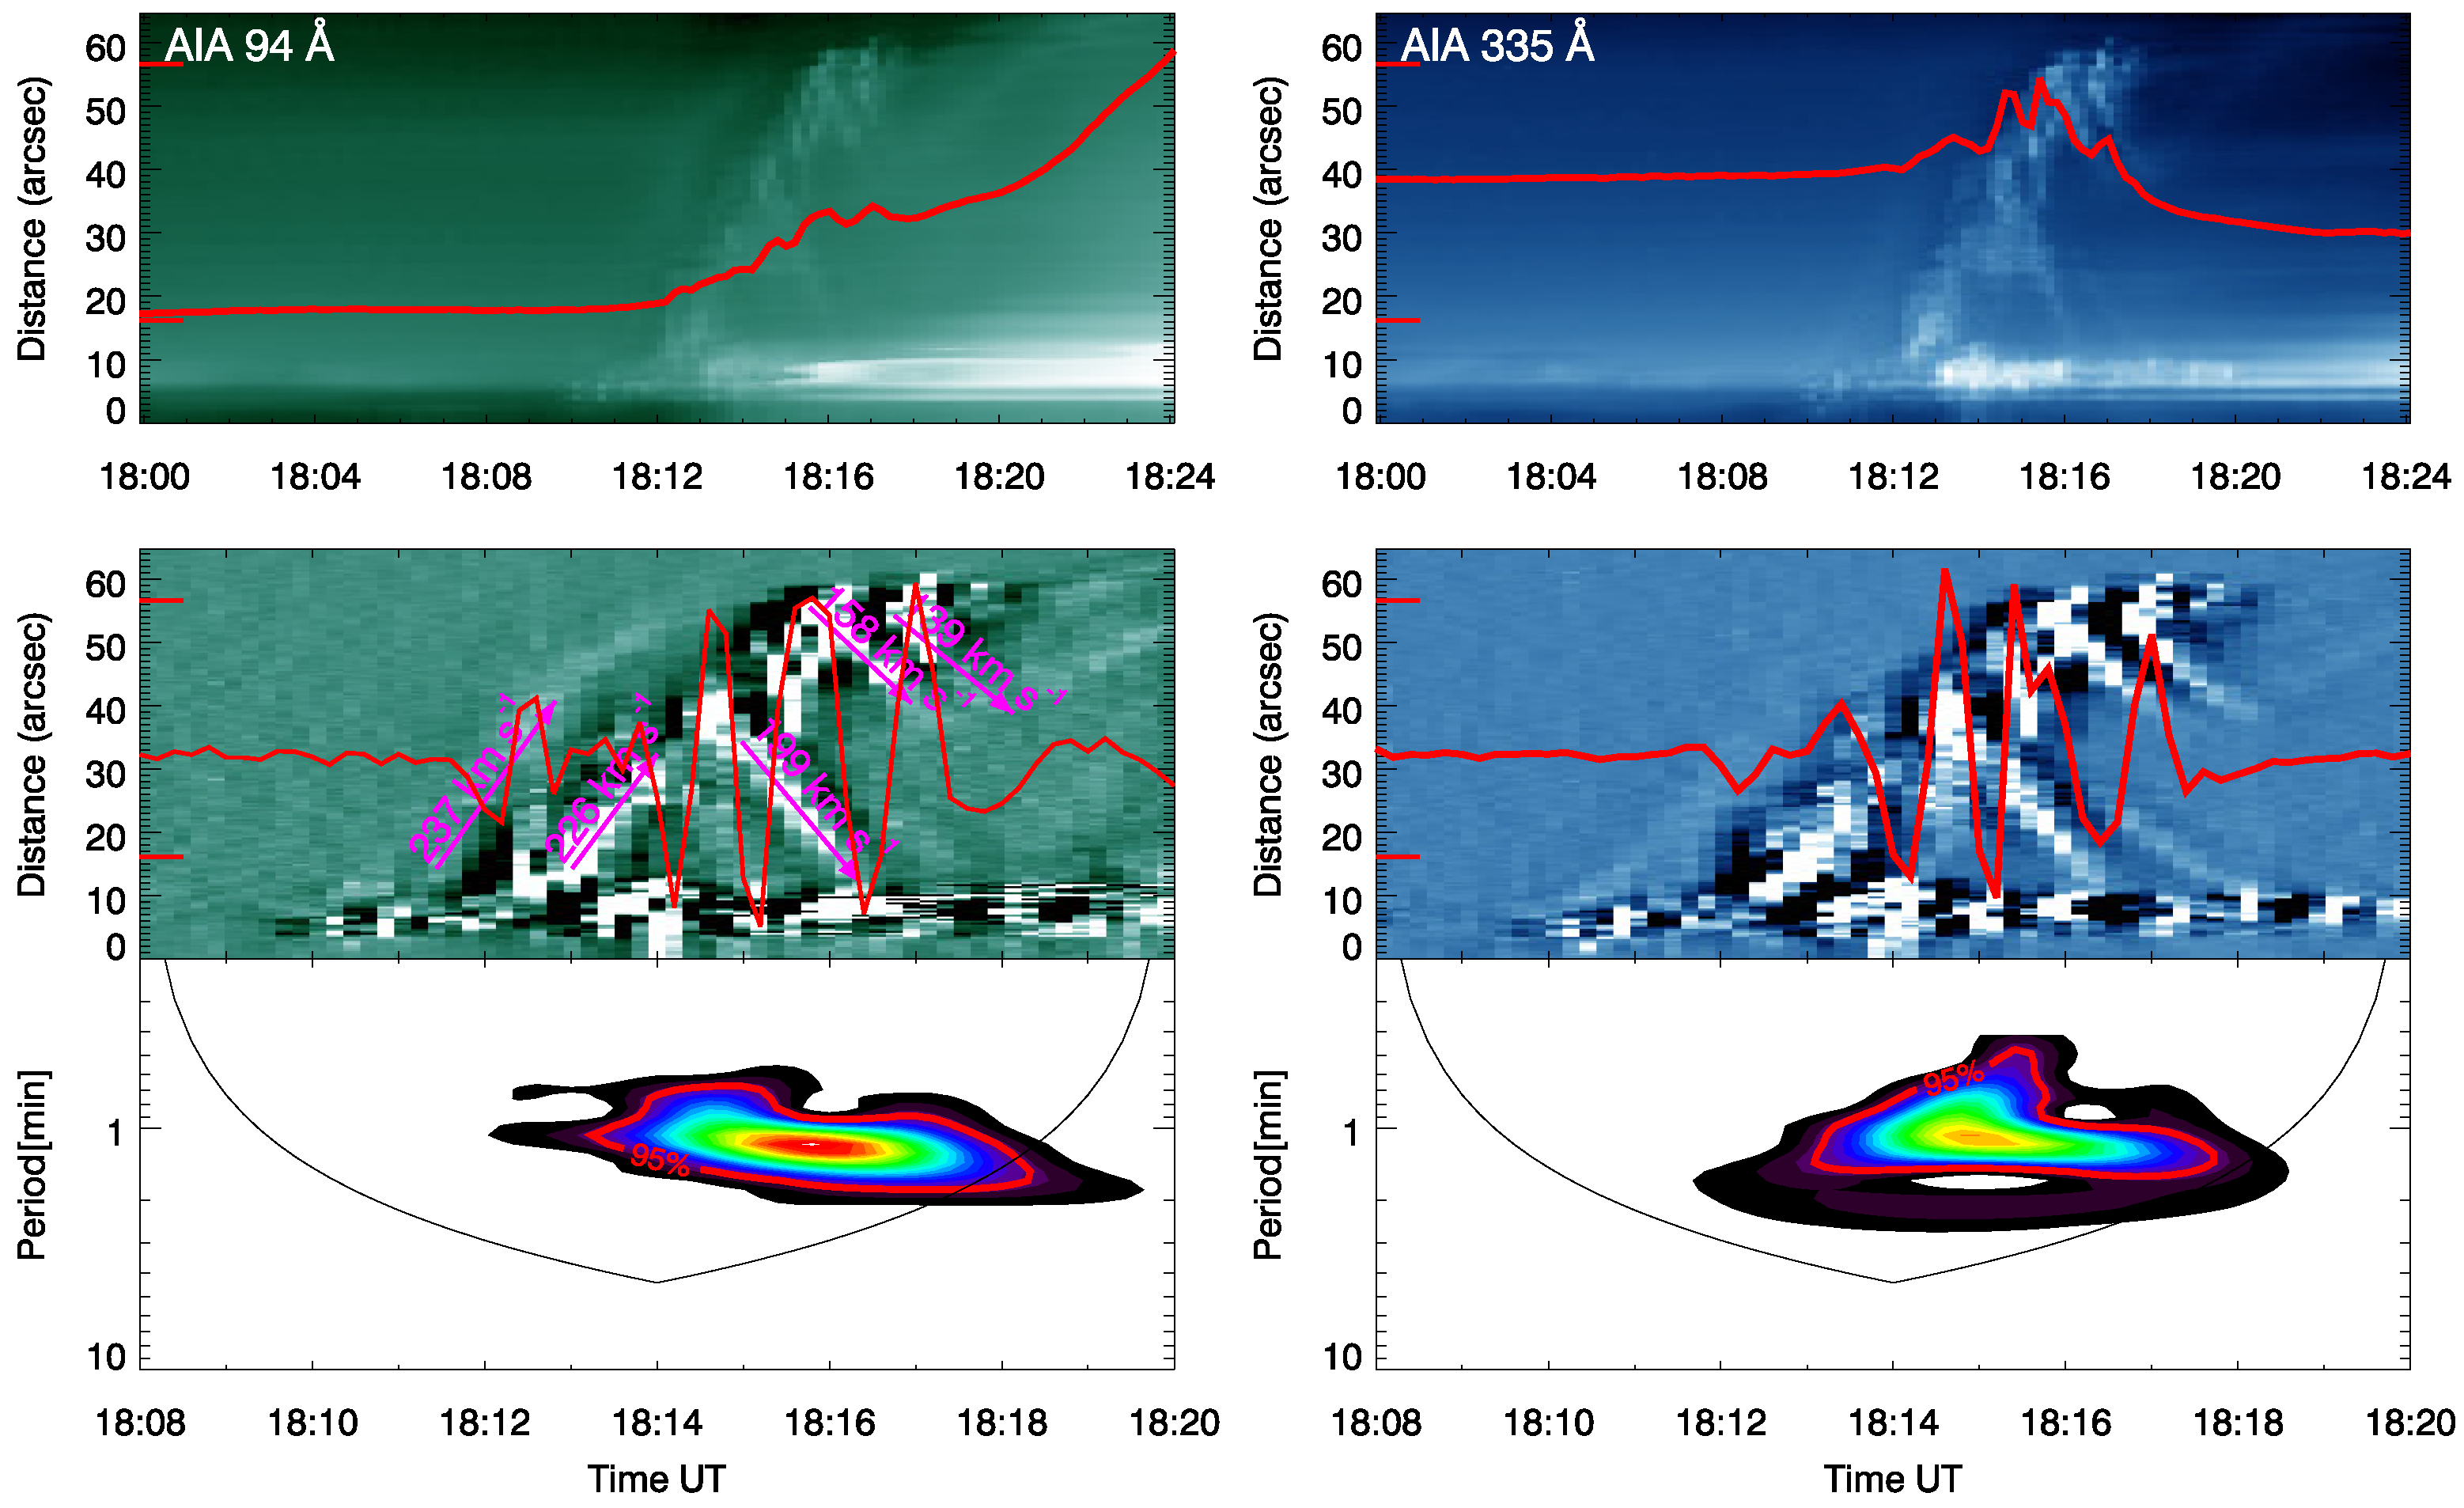
QPPs mechanism is still an open issue in solar physics. For this event, it is an interesting question which process result into the one-minute QPPs. It is obvious that the QPPs in this flare come from the coronal region, because the flare ribbon and footpoints are occulted. On the other hand, the intermittent jets are detected by the SDO/AIA, as shown in the movie (additional files of this manuscript). Figure 6 shows the time evolution of jets between 18:14:11 UT and 18:18:08 UT. In order to analyze the periodicity of the jets, Figure 7 and Figure 8 give the time-distance diagrams at two slices located at S1 and S2, which are outlined in Figure 3. S1 is perpendicular to the radial direction while S2 is parallel to. Two wavelengths of 94 A ˚ and 335 A ˚ are used due to no saturation during the whole flare. Figure 7 (top panels) shows the time-distance diagrams of S1 at 94 A ˚ and 335 A ˚ from 18:00 UT to 18:24 UT. The Y-axis is along the arrow direction, i.e., from the southeast to northwest. The red light curves are the intensity integration between two horizontal red lines on Y-axis. There are a plenty of oblique streaks seen in these images at both 94 A ˚ and 335 A ˚ simultaneously, although they are a little faint here. These oblique streaks are intermittent jets, which move from the northwest to southeast. It is obvious that S1 located at the flare loop top. Thus, these jets should be originated from loop footpoints and move along these closed loops. In order to see these jets clearly, Figure 7 (middle panels) gives the smooth-subtracted images of top panels, i.e., after subtracting the slowly-varying component, which is a 72-s running average of original intensity. Therefore, each jet is divided into a pair of white and dark oblique streaks, and the white streak is following the dark one. The velocity of jets can be directly measured from each white or dark streak from the smooth-subtracted image, and several examples are labeled. The red curves show the fast-varying components of light curves between two horizontal red lines on Y-axis. It display the oscillating behavior, which suggests that the intermittent jets have a periodicity. It must be explained here that each peak of this red curve represent one jet, and different peaks are various jets. Figure 7 (bottom panels) gives the wavelet spectra of the red curves, and it is interesting that one-minute period is found in these jets, which is the same as the period of SXR and EUV. Same as Figure 7, Figure 8 gives the time-distance diagrams along S2 at 94 A ˚ and 335 A ˚ . Using the same method, the intermittent jets also display one-minute period. However, S2 is almost parallel to the radial direction, which indicates these jets are along the open magnetic field lines and intermittent moving outer the corona, and their average speed is above 200 km/s, which is almost the same with the initial speed of the CME.
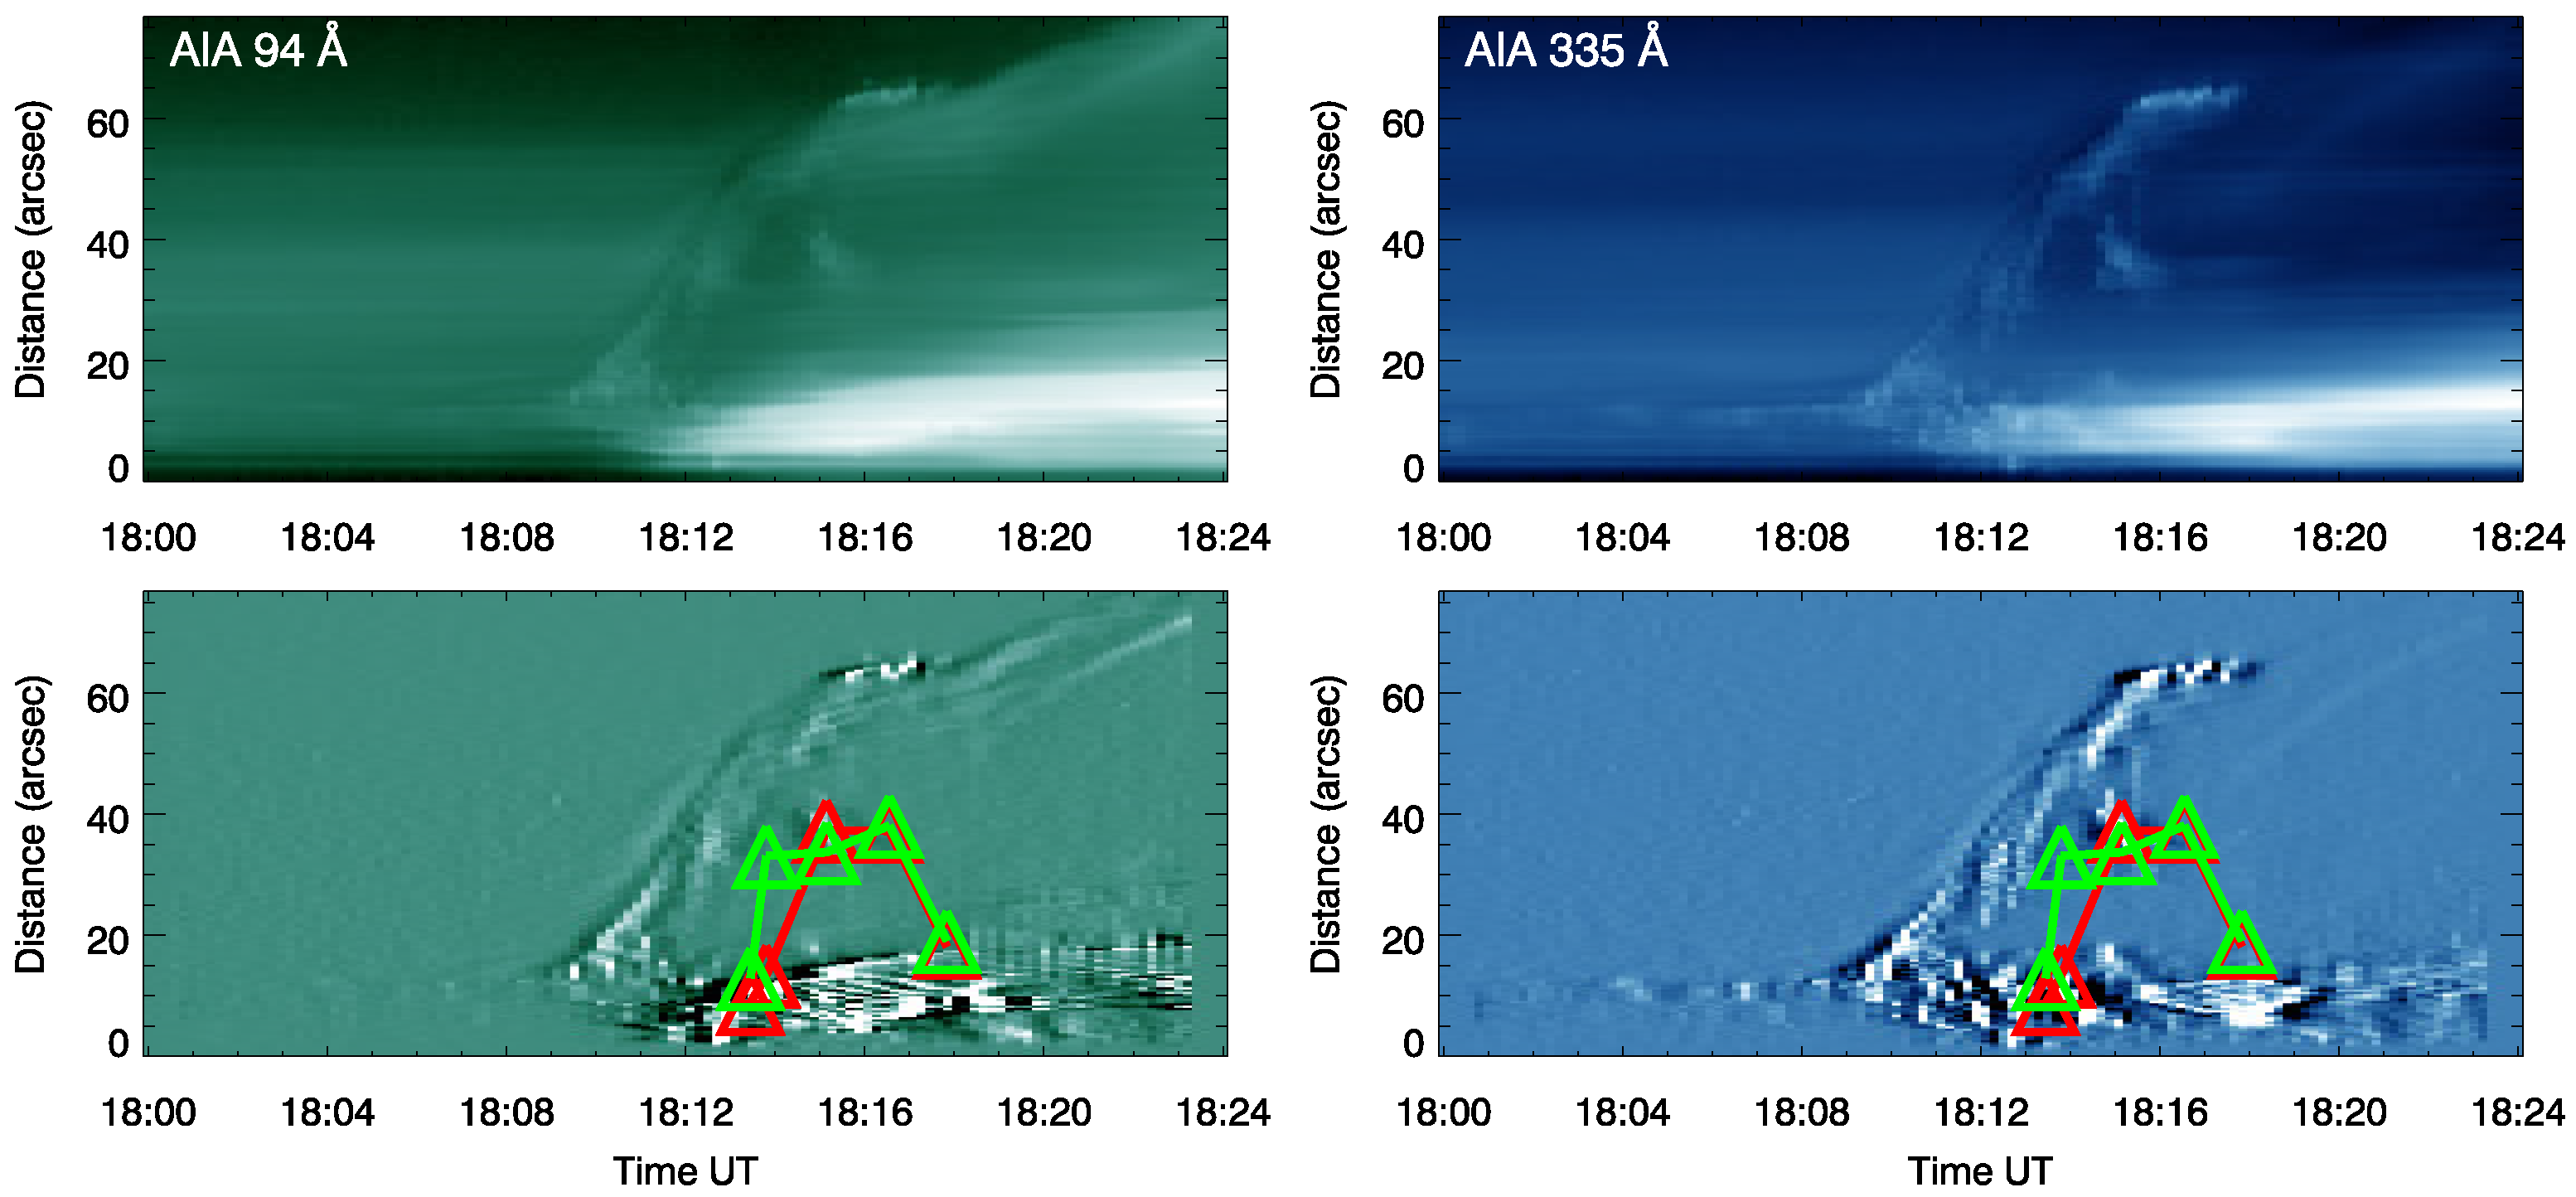
Figure 9 shows the time-distance diagrams along the slice of S3 at 94 A ˚ and 335 A ˚ . Figure 3 outlines the S3 which covers the trajectory of RHESSI X-ray sources movement. Similar as in Figure 7 and Figure 8, Figure 9 shows the original data (top panels), and the fast-varying components (bottom panels) after subtracting the slowly-varying components (a 72-s running average from raw data). The flare loops are detected along S3, and RHESSI X-ray sources position are overlapped on bottom panels. Red triangles represent 6–12 keV while green are 12–25 keV. From Figure 9 the jets erupt earlier about 4 min than X-ray source start upward, which indicates that the SXR source movement is related to the flare loop expansion.
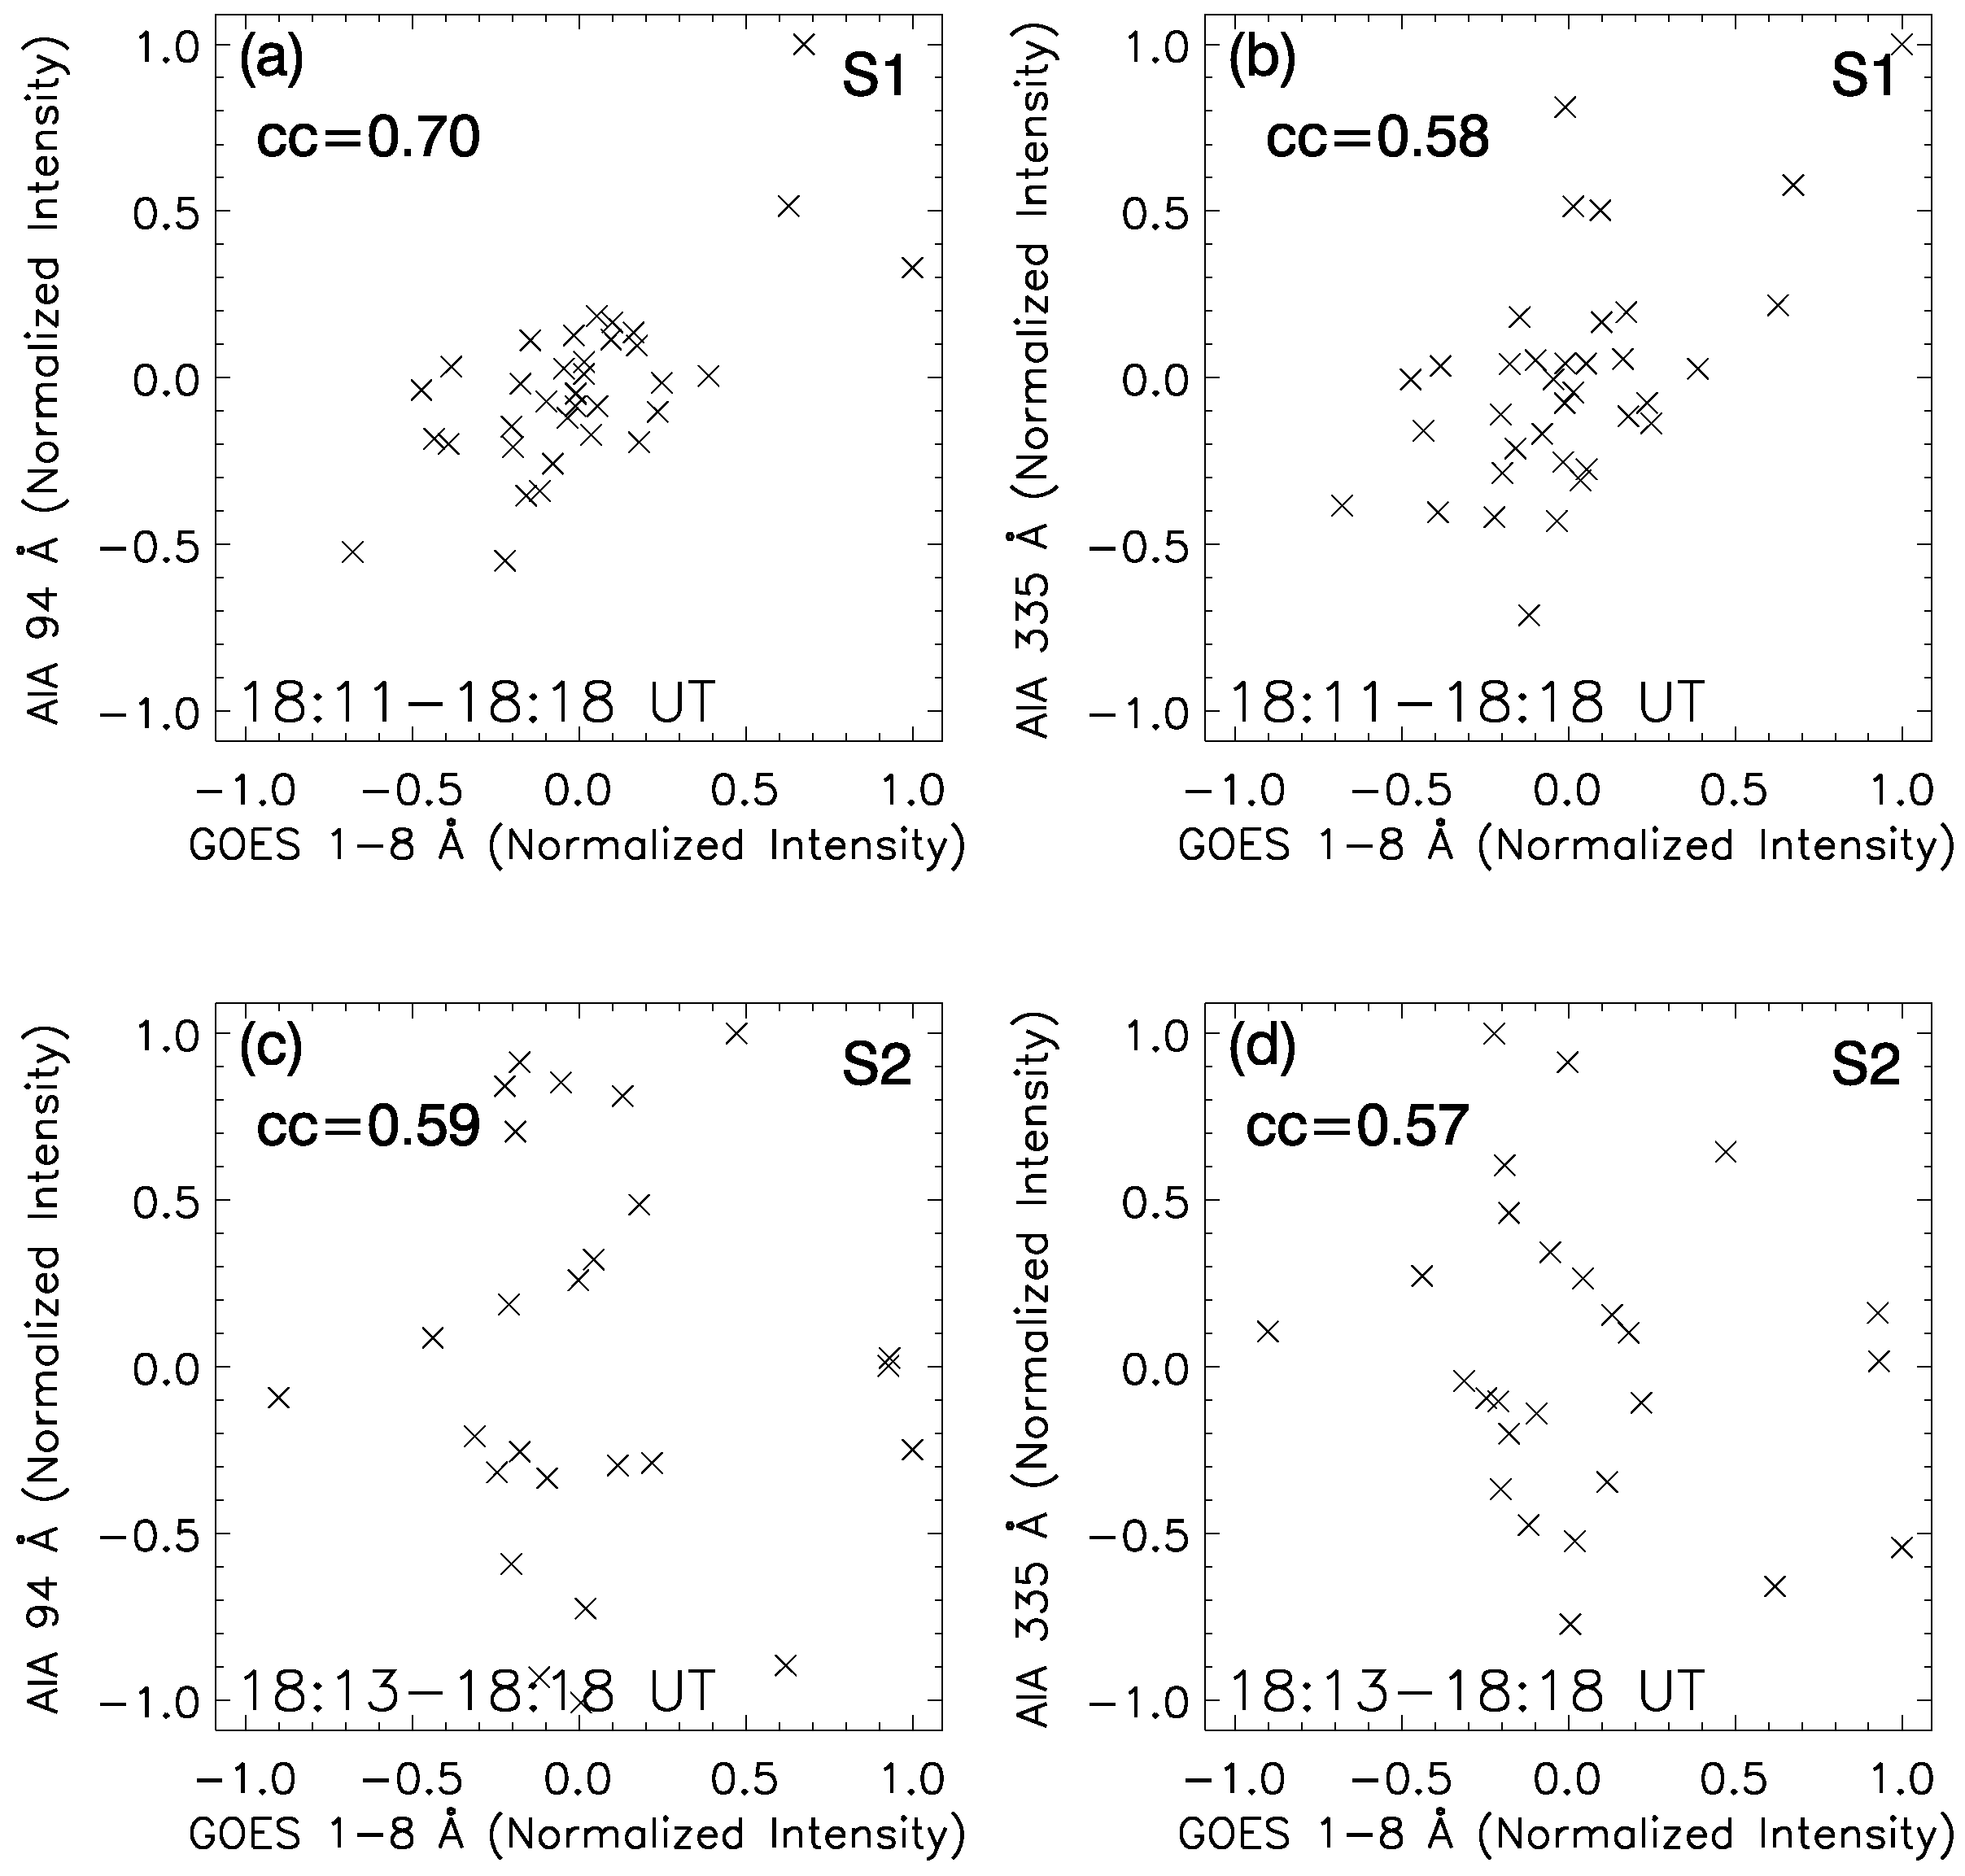
According to above analysis, we identified the presence of one-minute QPPs in different wavelength bands by several instruments during the flare, they are GOES 0.5–4 A ˚ , 1–8 A ˚ , RHESSI 6–12 keV, 12–25 keV, SDO/EVE ESP 0.1–7 nm, and SDO/AIA nine wavelengths (94 A ˚ , 131 A ˚ , 171 A ˚ , 193 A ˚ , 211 A ˚ , 304 A ˚ , 335 A ˚ , 1600 A ˚ , and 1700 A ˚ ). Figure 10 plots the correlation between the fast-varying components of GOES 1–8 A ˚ and of two AIA wavelengths (94 A ˚ and 335 A ˚ ). Here the fast-varying components of AIA refer to the oscillatory red curves as shown in Figure 7 and Figure 8. The maximum correlation coefficient reach as 0.7 and the minimum value is 0.57. The correlationship indicate that the one-minute QPPs really occurred at SXR and EUV simultaneously.

4. Discussion and Conclusions

Using the data from GOES, RHESSI, SDO/AIA and EVE, we studied the QPPs in an M4.4 class solar flare. Although it is an occulted event whose ribbons and HXR footpoint sources are missed by SDO/AIA and RHESSI, this flare is still intensive enough to saturate on AIA images. Using the FFT and wavelet methods, the one-minute QPPs are detected in the fast-varying components of the light curves at SXRs and EUV.
SDO/AIA observations give the intermittent jets accompanying this flare eruption. The time-distance diagrams are analyzed at two slices of S1 and S2 perpendicular and parallel to the radial direction. It is interesting that the jets display one-minute periodicity. The correlationship between the QPPs at GOES and jet light curves suggests that the one-minute QPPs on the flare light curves and periodic jets could come from the same origination, e.g., one-minute periodic magnetic reconnection. A simulation work was done by Shen et al. [29], in which the magnetic reconnection rate displays the fast oscillations due to the appearance of plasma blobs in the current sheet. McLaughlin et al. [19] quantitatively simulated the period of oscillatory reconnection by a nonlinear fast magnetoacoustic wave deforming a 2D magnetic X-point, they found driving amplitude of 6.3–126.2 km/s corresponds to periods in the range 56.3–78.9 s, which is consistent with the one-minute QPPs in this study. More observations and statistical works are needed to study the one-minute QPPs in the future.

Author Contributions

Software: F.S. and D.L.; Writing—original draft, F.S.; Writing—review & editing, F.S. and Z.N. All authors have read and agreed to the published version of the manuscript.

Funding

This research was funded by NSFC under grants 12073081, 11973092, 11790302, 11603077, as well as CAS Strategic Pioneer Program on Space Science, grant Nos. XDA15052200 and XDA15320301. D.L. is supported by Surface Project of Jiangsu No. BK20211402. The Laboratory No. is 2010DP173032.

Data Availability Statement

The data presented in this study are openly available in the homepage of SDO, GOES and RHESSI.

Acknowledgments

Data were made available courtesy of SDO/AIA and the SDO/EVE, and GOES science teams. We are also grateful to the RHESSI teams for public access to calibrated data. We thank the anonymous referees for helpful comments on the manuscript.

Conflicts of Interest

The authors declare no conflict of interest.

Notes

1
2

References

  1. Zimovets, I.V.; McLaughlin, J.A.; Srivastava, A.K.; Kolotkov, D.Y.; Kuznetsov, A.A.; Kupriyanova, E.G.; Cho, I.H.; Inglis, A.R.; Reale, F.; Pascoe, D.J.; et al. Quasi-Periodic Pulsations in Solar and Stellar Flares: A Review of Underpinning Physical Mechanisms and Their Predicted Observational Signatures. Space Sci. Rev. 2021, 217, 66. [Google Scholar] [CrossRef]
  2. Tan, B.; Zhang, Y.; Tan, C.; Liu, Y. Microwave Quasi-Periodic Pulsations in Multi-timescales Associated with a Solar Flare/CME Event. Astrophys. J. 2010, 723, 25–39. [Google Scholar] [CrossRef] [Green Version]
  3. Inglis, A.R.; Nakariakov, V.M. A multi-periodic oscillatory event in a solar flare. Astron. Astrophys. 2009, 493, 259–266. [Google Scholar] [CrossRef] [Green Version]
  4. Van Doorsselaere, T.; De Groof, A.; Zender, J.; Berghmans, D.; Goossens, M. LYRA Observations of Two Oscillation Modes in a Single Flare. Astrophys. J. 2011, 740, 90. [Google Scholar] [CrossRef]
  5. Zimovets, I.V. Harmonic oscillations of the X-ray emission of a solar flare. Astron. Rep. 2010, 54, 657–674. [Google Scholar] [CrossRef]
  6. Sych, R.; Nakariakov, V.M.; Karlicky, M.; Anfinogentov, S. Relationship between wave processes in sunspots and quasi-periodic pulsations in active region flares. Astron. Astrophys. 2009, 505, 791–799. [Google Scholar] [CrossRef] [Green Version]
  7. Kashapova, L.K.; Kupriyanova, E.G.; Xu, Z.; Reid, H.A.S.; Kolotkov, D.Y. The origin of quasi-periodicities during circular ribbon flares. Astron. Astrophys. 2020, 642, A195. [Google Scholar] [CrossRef]
  8. Li, D.; Zhang, Q.M.; Huang, Y.; Ning, Z.J.; Su, Y.N. Quasi-periodic pulsations with periods that change depending on whether the pulsations have thermal or nonthermal components. Astron. Astrophys. 2017, 597, L4. [Google Scholar] [CrossRef] [Green Version]
  9. Li, D.; Lu, L.; Ning, Z.; Feng, L.; Gan, W.; Li, H. Quasi-periodic Pulsation Detected in Lyα Emission During Solar Flares. Astrophys. J. 2020, 893, 7. [Google Scholar] [CrossRef] [Green Version]
  10. Li, D.; Ge, M.; Dominique, M.; Zhao, H.; Li, G.; Li, X.; Zhang, S.; Lu, F.; Gan, W.; Ning, Z. Detection of Flare Multiperiodic Pulsations in Mid-ultraviolet Balmer Continuum, Lyα, Hard X-Ray, and Radio Emissions Simultaneously. Astrophys. J. 2021, 921, 179. [Google Scholar] [CrossRef]
  11. Nakariakov, V.M.; Anfinogentov, S.; Storozhenko, A.A.; Kurochkin, E.A.; Bogod, V.M.; Sharykin, I.N.; Kaltman, T.I. Quasi-periodic Pulsations in a Solar Microflare. Astrophys. J. 2018, 859, 154. [Google Scholar] [CrossRef]
  12. Chen, P.F.; Priest, E.R. Transition-Region Explosive Events: Reconnection Modulated by p-Mode Waves. Sol. Phys. 2006, 238, 313–327. [Google Scholar] [CrossRef]
  13. Aschwanden, M.J. Theory of Radio Pulsations in Coronal Loops. Sol. Phys. 1987, 111, 113–136. [Google Scholar] [CrossRef]
  14. Van Doorsselaere, T.; Kupriyanova, E.G.; Yuan, D. Quasi-periodic Pulsations in Solar and Stellar Flares: An Overview of Recent Results (Invited Review). Sol. Phys. 2016, 291, 3143–3164. [Google Scholar] [CrossRef]
  15. Tian, H.; Young, P.R.; Reeves, K.K.; Wang, T.; Antolin, P.; Chen, B.; He, J. Global Sausage Oscillation of Solar Flare Loops Detected by the Interface Region Imaging Spectrograph. Astrophys. J. Lett. 2016, 823, L16. [Google Scholar] [CrossRef]
  16. Kolotkov, D.Y.; Nakariakov, V.M.; Kupriyanova, E.G.; Ratcliffe, H.; Shibasaki, K. Multi-mode quasi-periodic pulsations in a solar flare. Astron. Astrophys. 2015, 574, A53. [Google Scholar] [CrossRef] [Green Version]
  17. Yuan, D.; Van Doorsselaere, T. Forward Modeling of Standing Kink Modes in Coronal Loops. II. Applications. Astrophys. J. Suppl. Ser. 2016, 223, 24. [Google Scholar] [CrossRef] [Green Version]
  18. Nakariakov, V.M.; Zimovets, I.V. Slow Magnetoacoustic Waves in Two-ribbon Flares. Astrophys. J. Lett. 2011, 730, L27. [Google Scholar] [CrossRef]
  19. McLaughlin, J.A.; Thurgood, J.O.; MacTaggart, D. On the periodicity of oscillatory reconnection. Astron. Astrophys. 2012, 548, A98. [Google Scholar] [CrossRef]
  20. Nakariakov, V.M. MHD oscillations in solar and stellar coronae: Current results and perspectives. Adv. Space Res. 2007, 39, 1804–1813. [Google Scholar] [CrossRef]
  21. Lin, R.P.; Dennis, B.R.; Hurford, G.J.; Smith, D.M.; Zehnder, A.; Harvey, P.R.; Curtis, D.W.; Pankow, D.; Turin, P.; Bester, M.; et al. The Reuven Ramaty High-Energy Solar Spectroscopic Imager (RHESSI). Sol. Phys. 2002, 210, 3–32. [Google Scholar] [CrossRef]
  22. Lemen, J.R.; Title, A.M.; Akin, D.J.; Boerner, P.F.; Chou, C.; Drake, J.F.; Duncan, D.W.; Edwards, C.G.; Friedlaender, F.M.; Heyman, G.F.; et al. The Atmospheric Imaging Assembly (AIA) on the Solar Dynamics Observatory (SDO). Sol. Phys. 2012, 275, 17–40. [Google Scholar] [CrossRef] [Green Version]
  23. Woods, T.N.; Eparvier, F.G.; Hock, R.; Jones, A.R.; Woodraska, D.; Judge, D.; Didkovsky, L.; Lean, J.; Mariska, J.; Warren, H.; et al. Extreme Ultraviolet Variability Experiment (EVE) on the Solar Dynamics Observatory (SDO): Overview of Science Objectives, Instrument Design, Data Products, and Model Developments. Sol. Phys. 2012, 275, 115–143. [Google Scholar] [CrossRef] [Green Version]
  24. Pesnell, W.D.; Thompson, B.J.; Chamberlin, P.C. The Solar Dynamics Observatory (SDO). Sol. Phys. 2012, 275, 3–15. [Google Scholar] [CrossRef] [Green Version]
  25. Ning, Z. Imaging Observations of X-Ray Quasi-periodic Oscillations at 3 - 6 keV in the 26 December 2002 Solar Flare. Sol. Phys. 2014, 289, 1239–1256. [Google Scholar] [CrossRef]
  26. Ning, Z. One-Minute Quasi-Periodic Pulsations Seen in a Solar Flare. Sol. Phys. 2017, 292, 11. [Google Scholar] [CrossRef]
  27. Ning, Z.; Li, D.; Zhang, Q.M. Emission Measure and Temperature Analysis of the Upper Coronal Source of a Solar Flare. Sol. Phys. 2016, 291, 1783–1798. [Google Scholar] [CrossRef]
  28. Sui, L.; Holman, G.D. Evidence for the Formation of a Large-Scale Current Sheet in a Solar Flare. Astrophys. J. 2003, 596, L251–L254. [Google Scholar] [CrossRef] [Green Version]
  29. Shen, C.; Lin, J.; Murphy, N.A. Numerical Experiments on Fine Structure within Reconnecting Current Sheets in Solar Flares. Astrophys. J. 2011, 737, 14. [Google Scholar] [CrossRef]
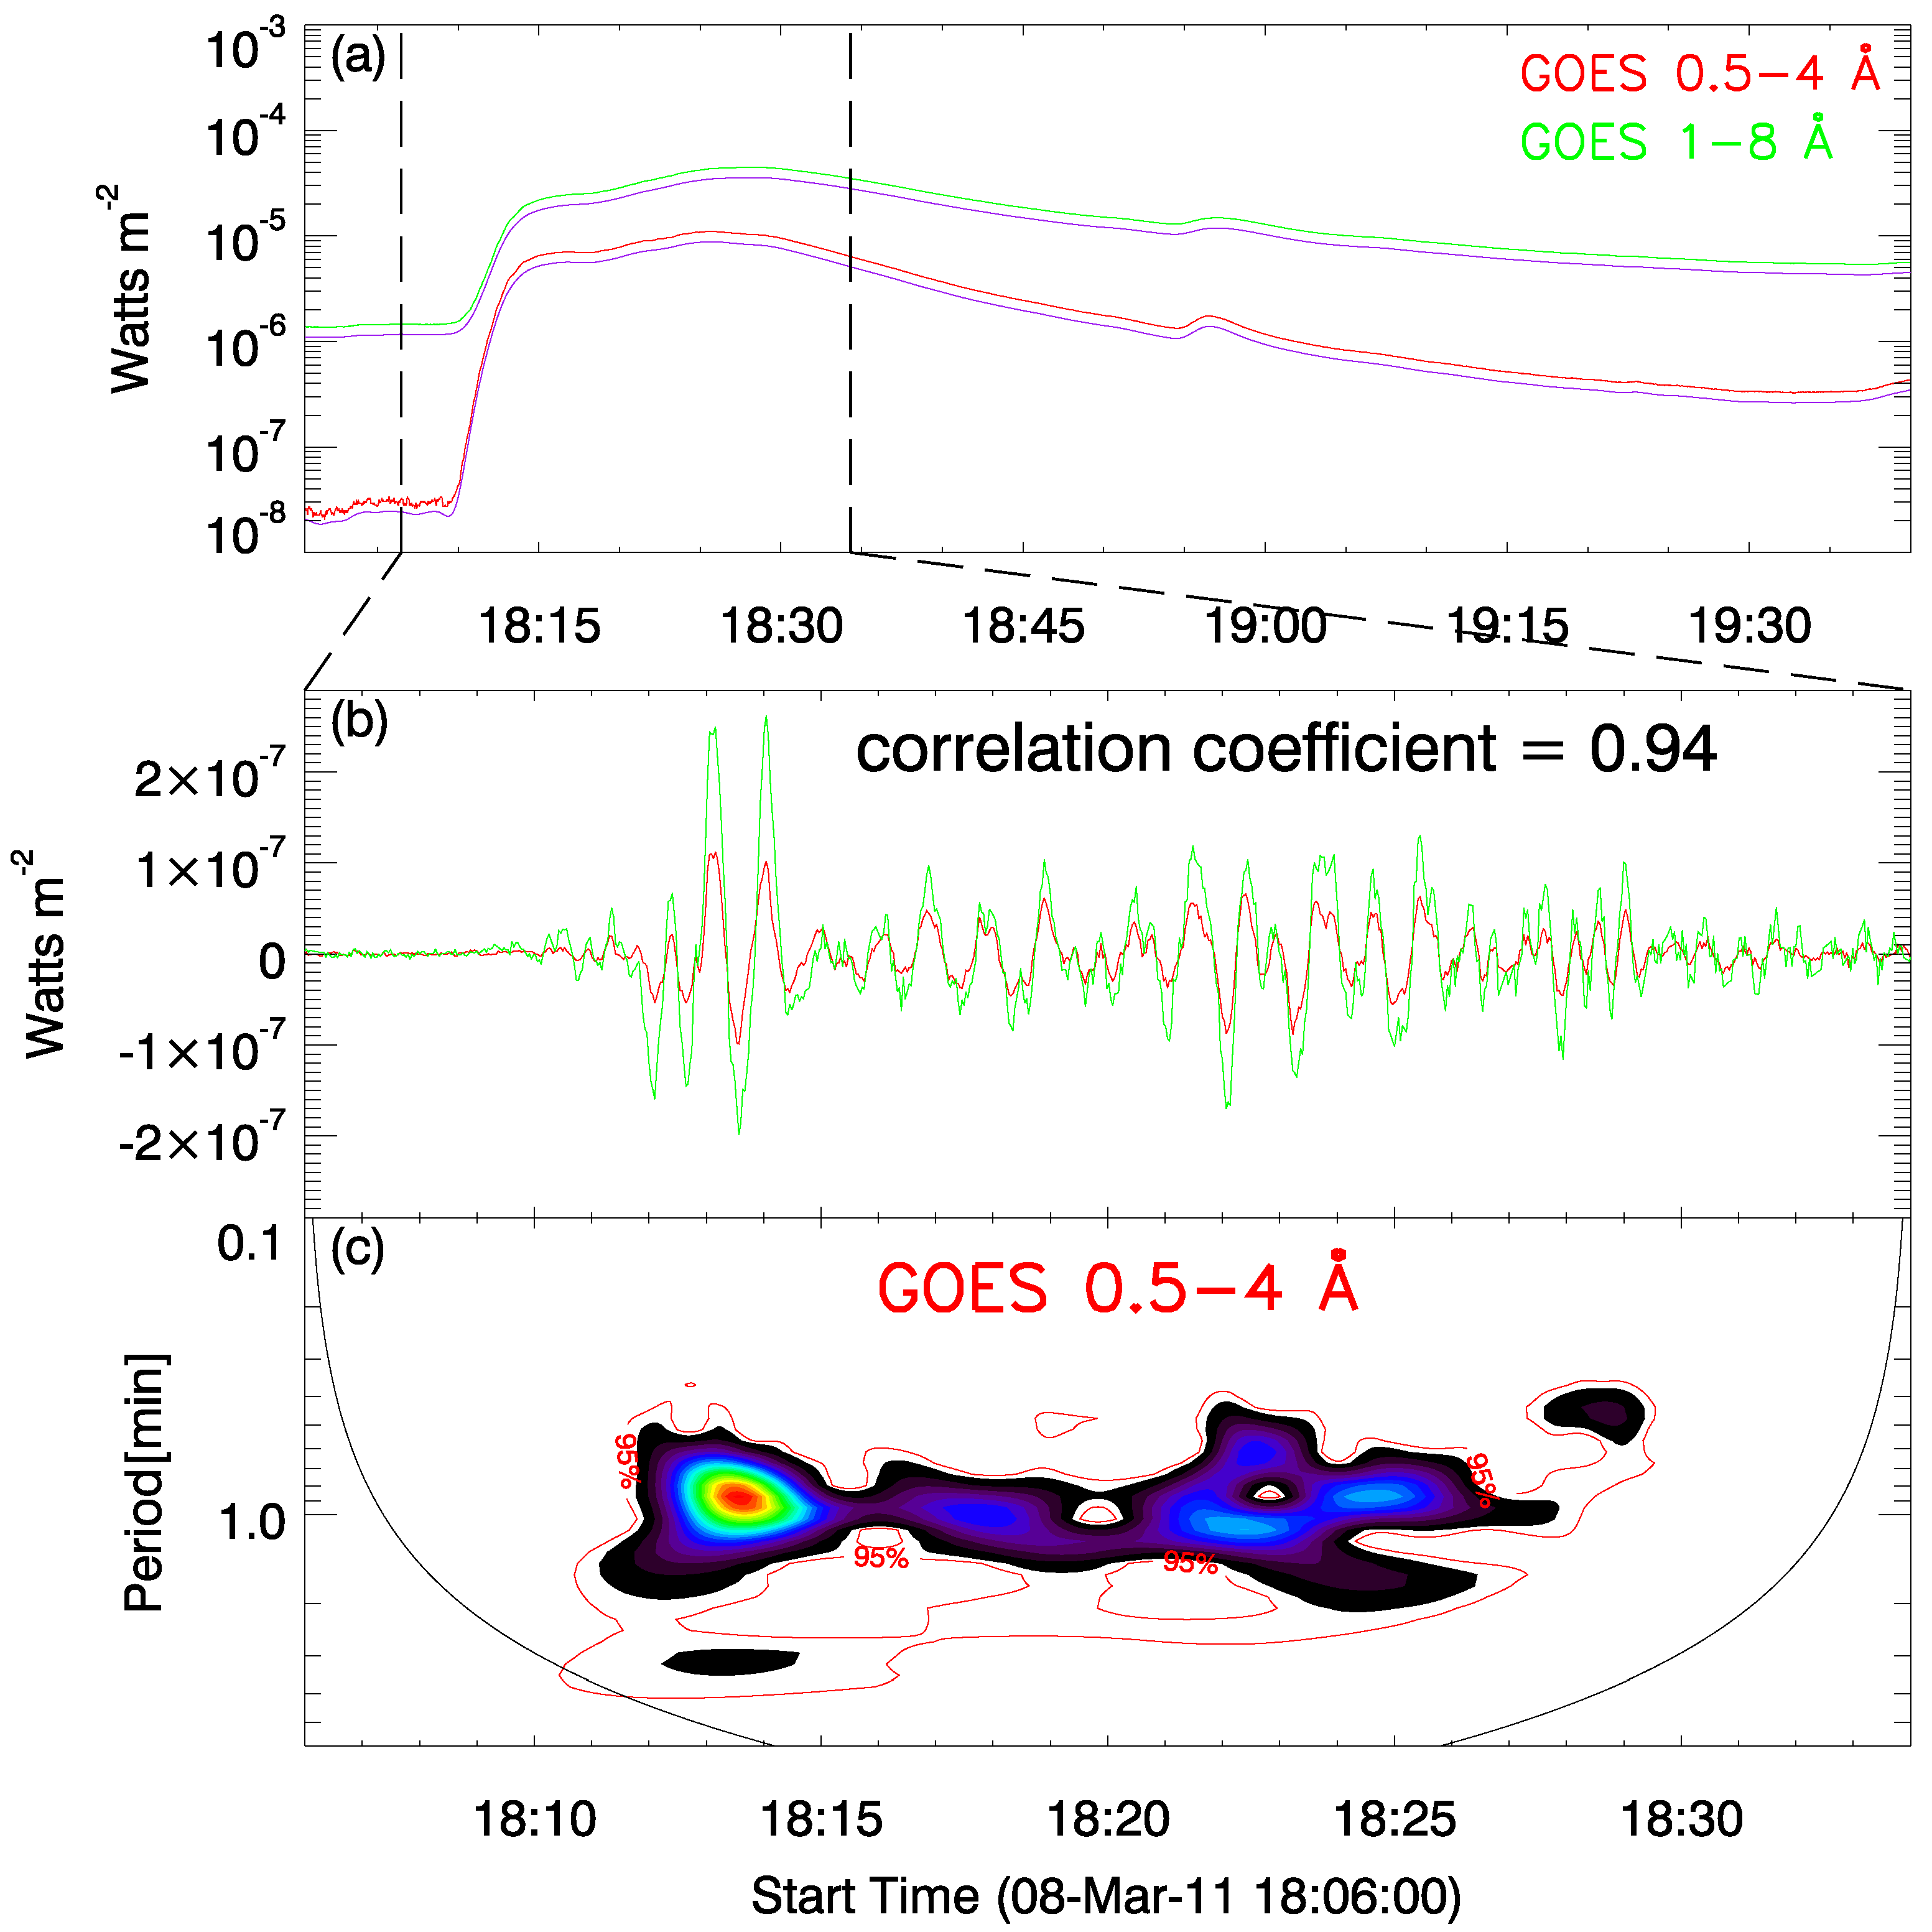
Figure 1. (a) The light curves of GOES 0.5–4 A ˚ (red), and 1–8 A ˚ (green), and their slowly-varying components (purple, already multiplied by 0.8) for the 8 March 2011 solar flare. (b) Fast-varying components in the interval between two vertical dotted lines, the correlation coefficient is given. (c) The wavelet spectrum of the fast-varying component at GOES 0.5–4 A ˚ . The red contours represent a significance level of 95%.
Universe 08 00104 g001
Figure 2. Top panels: the light curves of RHESSI at 6–12 keV (red) and 12–25 keV (green), and SDO/EVE ESP at 0.1–7 nm (black), their slowly-varying components (purple, already multiplied by 0.8). Middle and bottom panels: the fast-varying components and their wavelet spectra. The correlation coefficient between the fast-varying components of RHESSI 6–12 keV and 12–25 keV is given. The red contours represent a significance level of 95%.
Universe 08 00104 g002
Figure 3. Flare images at nine wavelengths of SDO/AIA around 18:21 UT, they are 94 A ˚ (a), 131 A ˚ (b), 171 A ˚ (c), 193 A ˚ (d), 211 A ˚ (e), 304 A ˚ (f), 335 A ˚ (g), 1600 A ˚ (h), and 1700 A ˚ (i). The contours and triangles represent the X-ray sources at 6–12 keV, 12–25 keV and 25–50 keV in different times (colorbar). Contour levels are 90% and 82% of the peak intensity. Three groups of red solid lines outlines the slit positions in Figures 7–9 and arrows indicate their Y-axes. The black box represents the region where we integrate AIA light curves in Figure 5.
Universe 08 00104 g003
Figure 4. The time evolution of the distance between RHESSI X-ray sources at 18:10:42 UT and that at other times.
Universe 08 00104 g004
Figure 5. Similar to Figure 1, the light curves of nine AIA wavelengths, their slowly (purple curves, already multiplied by 0.8) and fast-varying components with their wavelet spectra. The correlation coefficient (cc) between the fast-varying components of different wavelengths are given. The red contours represent a significance level of 95%.
Universe 08 00104 g005
Figure 6. The time evolution of jets between 18:14:11 UT and 18:18:08 UT.
Universe 08 00104 g006
Figure 7. Top panels: time-distance diagrams of the S1 marked in Figure 3g at AIA 94 A ˚ (left) and AIA 335 A ˚ (right) , and the red curves represent the light curves between two horizontal red lines on Y-axis. Middle panels: the smooth-subtracted images of top panels. Red curves represent the fast-varying components between two horizontal red lines on Y-axis. The arrows and numbers label the various jets and their speeds. Bottom panels: the wavelet spectra of the red curves. The red contours represent a significance level of 95%.
Universe 08 00104 g007
Figure 8. Top panels: time-distance diagrams of the S2 marked in Figure 3h at AIA 94 A ˚ (left) and AIA 335 A ˚ (right), and the red curves represent the light curves between two horizontal red lines on Y-axis. Middle panels: the smooth-subtracted images of top panels. Red curves represent the fast-varying components between two horizontal red lines on Y-axis. The arrows and numbers label the velocity of jets and the falling matter. Bottom panels: the wavelet spectra of the red curves. The red contours represent a significance level of 95%.
Universe 08 00104 g008
Figure 9. Top panels: time-distance diagrams of the S3 marked in Figure 3i at AIA 94 A ˚ (left) and AIA 335 A ˚ (right). Bottom panels: the smooth-subtracted images of top panels. Red triangles represent the movement trajectories of 6–12 keV X-ray sources, while green are 12–25 keV.
Universe 08 00104 g009
Figure 10. Correlation between the fast-varying components of GOES 1–8 A ˚ and of AIA 94 A ˚ at S1 (panel a) and S2 (panel c) or of AIA 335 A ˚ at S1 (panel b) and S2 (panel d). The correlation coefficients (cc) are given.
Universe 08 00104 g010
Publisher’s Note: MDPI stays neutral with regard to jurisdictional claims in published maps and institutional affiliations.