Abstract
The variations of neutral temperature in the mesosphere and lower thermosphere (MLT) region, during the 7–8 September 2017 intense geomagnetic storm, are studied using observations by the Sounding of the Atmosphere using Broadband Emission Radiometry (SABER) instrument onboard the Thermosphere Ionosphere Mesosphere Energetics and Dynamics (TIMED) satellite. They are also studied using simulations by the Thermosphere-Ionosphere-Mesosphere-Electrodynamics General Circulation Model (TIMEGCM). The neutral temperature data cover the altitudes from 80 km to 110 km between 83° N and 52° S latitude, obtained from both SABER observations and model simulations. The SABER observations reveal that temperature increases (the maximum increase is larger than 35 K at ~108 km) and decreases (the maximum decrease is larger than 20 K at ~105 km) during the geomagnetic storm. The storm effects penetrate down to ~80 km. In observations, temperature variations corresponding to the storm show hemispheric asymmetry. That is, the variations of temperature are more prominent in the northern hemisphere than in the southern hemisphere. Conversely, the TIMEGCM outputs agree with the observations in general but overestimate the temperature increases and underestimate the temperature decreases at high and middle latitudes. Meanwhile, the simulations show stronger temperature decreases and weaker temperature increases than observations at low latitudes. After analyzing the temperature variations, we suggest that vertical winds may play an important role in inducing these significant variations of temperature in the MLT region.
1. Introduction
During geomagnetic storms, strong convective electric fields produce enhanced Joule heating and particle precipitation in the auroral oval. The enhanced Joule heating and auroral particle precipitation not only change the atmospheric circulation but also cause perturbations of neutral temperature and density, winds, composition, and ionospheric electron densities [1,2,3]. These disturbances can be transported to the mesosphere and lower thermosphere (MLT) region and lower latitudes through dynamic and chemical processes [4,5,6,7,8]. Conversely, Nitric oxide (NO) and CO2 play significant roles in cooling and therefore regulating the energy budget of the MLT region [9,10,11,12].
In recent years, many researchers are devoted to exploring neutral temperature variations in the MLT region during storms using numerical simulations and both satellite- and ground-based observations. For instance, by analyzing the nighttime temperature derived from a sodium lidar at middle latitudes in the four storms on 17 April 2002, 6 November 2004, 8 May 2005, and 1 October 2012, Yuan et al. [13] showed that MLT temperature increased with a peak about 55 K at 105 km above 95 km. They suggested that the temperature changes were associated with changes of the storm time density of O/N2. Using satellite data during the storm in 2013 St. Patrick’s Day, Liu et al. [14] extracted that MLT temperature increased depending on altitude and latitude with the increased value from ∼15 K to ∼30 K. They found that the increase of temperature was greater than ∼10 K below 100 km and ∼15 K above 100 km. Using the temperature measured from the Sounding of the Atmosphere using Broadband Emission Radiometry (SABER) instrument onboard the Thermosphere Ionosphere Mesosphere Energetics and Dynamics (TIMED) satellite, after the case study and statistical analysis, Wang et al. [15] reported a temperature increase larger than ~20 K at 80° N, which occurred in the MLT region during geomagnetic storms.
However, some contradictory results on geomagnetic storms that influence temperature in the MLT region have been obtained. Fagundes et al. [16], using the nocturnal temperature data from a Fabry-Perot interferometer at 23° S, showed that the nocturnal temperature in the mesosphere did not respond to geomagnetic storms on 6–10 July 1991, 4–9 August 1991, and 25 June-1 July 1992. Von Savigny et al. [17] analyzed the temperature from the Microwave Limb Sounder instrument on the Aura satellite and reported that during the geomagnetic storm with solar proton events (SPEs) in January 2005, the temperature increased at 85 km. They proposed that the temperature disturbance was associated with the enhancement of Joule heating caused by the increase of ions. Using the temperature data detected by the meteor radar at Andenes, Pancheva et al. [18] found a significant negative temperature response (−25 K) at about 90 km during geomagnetic storms in October 2003. They also found that the temperature changes were caused by the sharp reduction of ozone. By analyzing temperature data detected by the ALOMAR Na lidar (69° N) and the SABER instrument onboard the TIMED satellite, Nesse Tyssøy et al. [19,20] showed that the temperature above 90 km was increased during relatively strong geomagnetic storms. They suggested that the temperature variation above 100 km might be due to energy generated by particle precipitation and Joule heating, whereas the temperature enhancement below 100 km was mainly affected by atmospheric waves and not directly associated with such auroral heating. Xu et al. [21] further proved that auroral heating effects on neutral temperature can penetrate down to around 105 km at high latitudes during storms by analyzing the data obtained from TIMED/SABER, Environmental Satellite (Envisat)/the Michelson Interferometer for Passive Atmospheric Sounding (MIPAS) observations, and Thermosphere-Ionosphere-Electrodynamics General Circulation Model (TIEGCM) simulations. Recently, using the Thermosphere-Ionosphere-Mesosphere-Electrodynamics General Circulation Model (TIMEGCM), including simulations at middle latitudes during the 17 April 2002 storm, Li et al. [6,7] found that the neutral temperature variations in the MLT region were dominated by vertical advection and adiabatic heating/cooling related to storm-time changes in vertical winds.
Due to the lack of observations and the complex physical and chemical processes in this region, it is difficult to understand the nature and causes of temperature variations in the MLT region during geomagnetic storms. The above results on the responses of MLT region temperature to geomagnetic storms were not always consistent, and most of the works focused on altitudes above ~90 km. In the present paper, the temperature data from SABER observations and TIMEGCM simulations between 80 and 110 km, during the 7–8 September 2017 geomagnetic storm, are compared to extract the temperature variations of the geomagnetic storm and the causes for the variations. The selected storm is a special storm because it is a two-step storm with two intense main phases [22].
We describe the TIMED/SABER observations and the TIMEGCM simulations in Section 2. In Section 3, we illustrate the details of the geomagnetic storm on 7–8 September 2017. Then we show the temperature variations of SABER and TIMEGCM in Section 4, followed by discussion in Section 5 and conclusions in Section 6.
2. Data and Model
2.1. SABER Temperature Data
The temperature data set derived from the SABER instrument onboard the NASA TIMED satellite analyzed covers from 80 to 110 km in altitude and between 80° N and 50° S latitude during the geomagnetic storm of 7–8 September 2017. The TIMED satellite was launched on 7 December 2001 into a 74° inclination orbit to explore the global structure in the stratosphere, mesosphere, and lower thermosphere. The SABER instrument measured temperature and several trace species’ profiles extend from 20 km to 110 km in altitude with a ~2 km vertical resolution [23]. The latitude coverage ranges from 52° in one hemisphere to 83° in the other due to the yaw cycle of ∼60 days of the satellite. The local migration time is 12 min every day. The systematic temperature instrument bias of SABER is around ±5 K in the MLT region [24]. The version 2.0 data set is used in this study. An advantage of the SABER temperature data analysis is that a single observed data source is used to establish the responses over a wide range of latitudes and heights. Therefore, differences in temperature variations at different latitudes and altitudes are more credibly attributed to physical mechanisms, rather than differences in measurement technique [25].
We focus on the temperature variations in the MLT region during the storm. Thus, we need to exclude the effects of other factors such as the tides. The zonal running mean on the actual temperature data is calculated to remove tides and small-scale waves [14,26]. To obtain the zonal running mean, we first align the temperature profiles in the height range of 80–110 km in chronological order. Then we perform the zonal daily (24 h) running mean of the temperature profiles in each 5° latitude bin from 50° S to 80° N. For instance, the zonally averaged temperature profiles between 77.5° N and 82.5° N are used to represent the profiles at 80° N. In addition, the average temperature of 5–6 September 2017 (two days before the storm onset) is defined as the quiet-time temperature. The differences between the storm-time temperature and the quiet-time temperature are used to indicate the temperature variations.
2.2. TIMEGCM
The TIMEGCM [27,28,29] is a three-dimensional, global general circulation model coupled mesosphere-thermosphere-ionosphere system from approximately 30 km to 500 km altitude and developed at NCAR (National Center of Atmosphere Research). It calculates the temperature, circulation, compositional structure, photoionization, chemistry, electrodynamics, and dynamics of these regions by self-consistently solving continuity, momentum, and energy equations of neutral atmosphere as well as ions. The inputs of momentum and energy from the magnetosphere are obtained by the high-latitude ion convection and auroral precipitation patterns and are driven by the Kp index. The Global Scale Wave Model (GSWM) [30,31] is used to specify diurnal and semi-diurnal tides at the lower boundary of the TIMEGCM. The high-resolution TIMEGCM version, which has a resolution of 2.5° × 2.5° in latitude and longitude along with a vertical resolution of a quarter-scale height, is utilized in this work. The model time step is set to 10 seconds.
In this work, TIMEGCM runs with real Kp values. Moreover, we use the model calculation data to track the satellite observation points and process the model temperature in the same analysis method as processing the satellite data.
3. The Geomagnetic Storm of 7–8 September 2017
The storm period began after September 6 and is one of the most significant events during the solar cycle 24. The Active Region AR2673 has produced four X-class eruptions, including the strongest solar flare (class X9.3) of the solar cycle 24, which emerged on 6 September [32]. A coronal mass ejection (CME) event associated with the X9.3 flare triggered the severe geomagnetic storm on 7–8 September 2017. This severe storm is the second strongest storm in solar cycle 24, which has two main phases with great intensity separated by about 14 h.
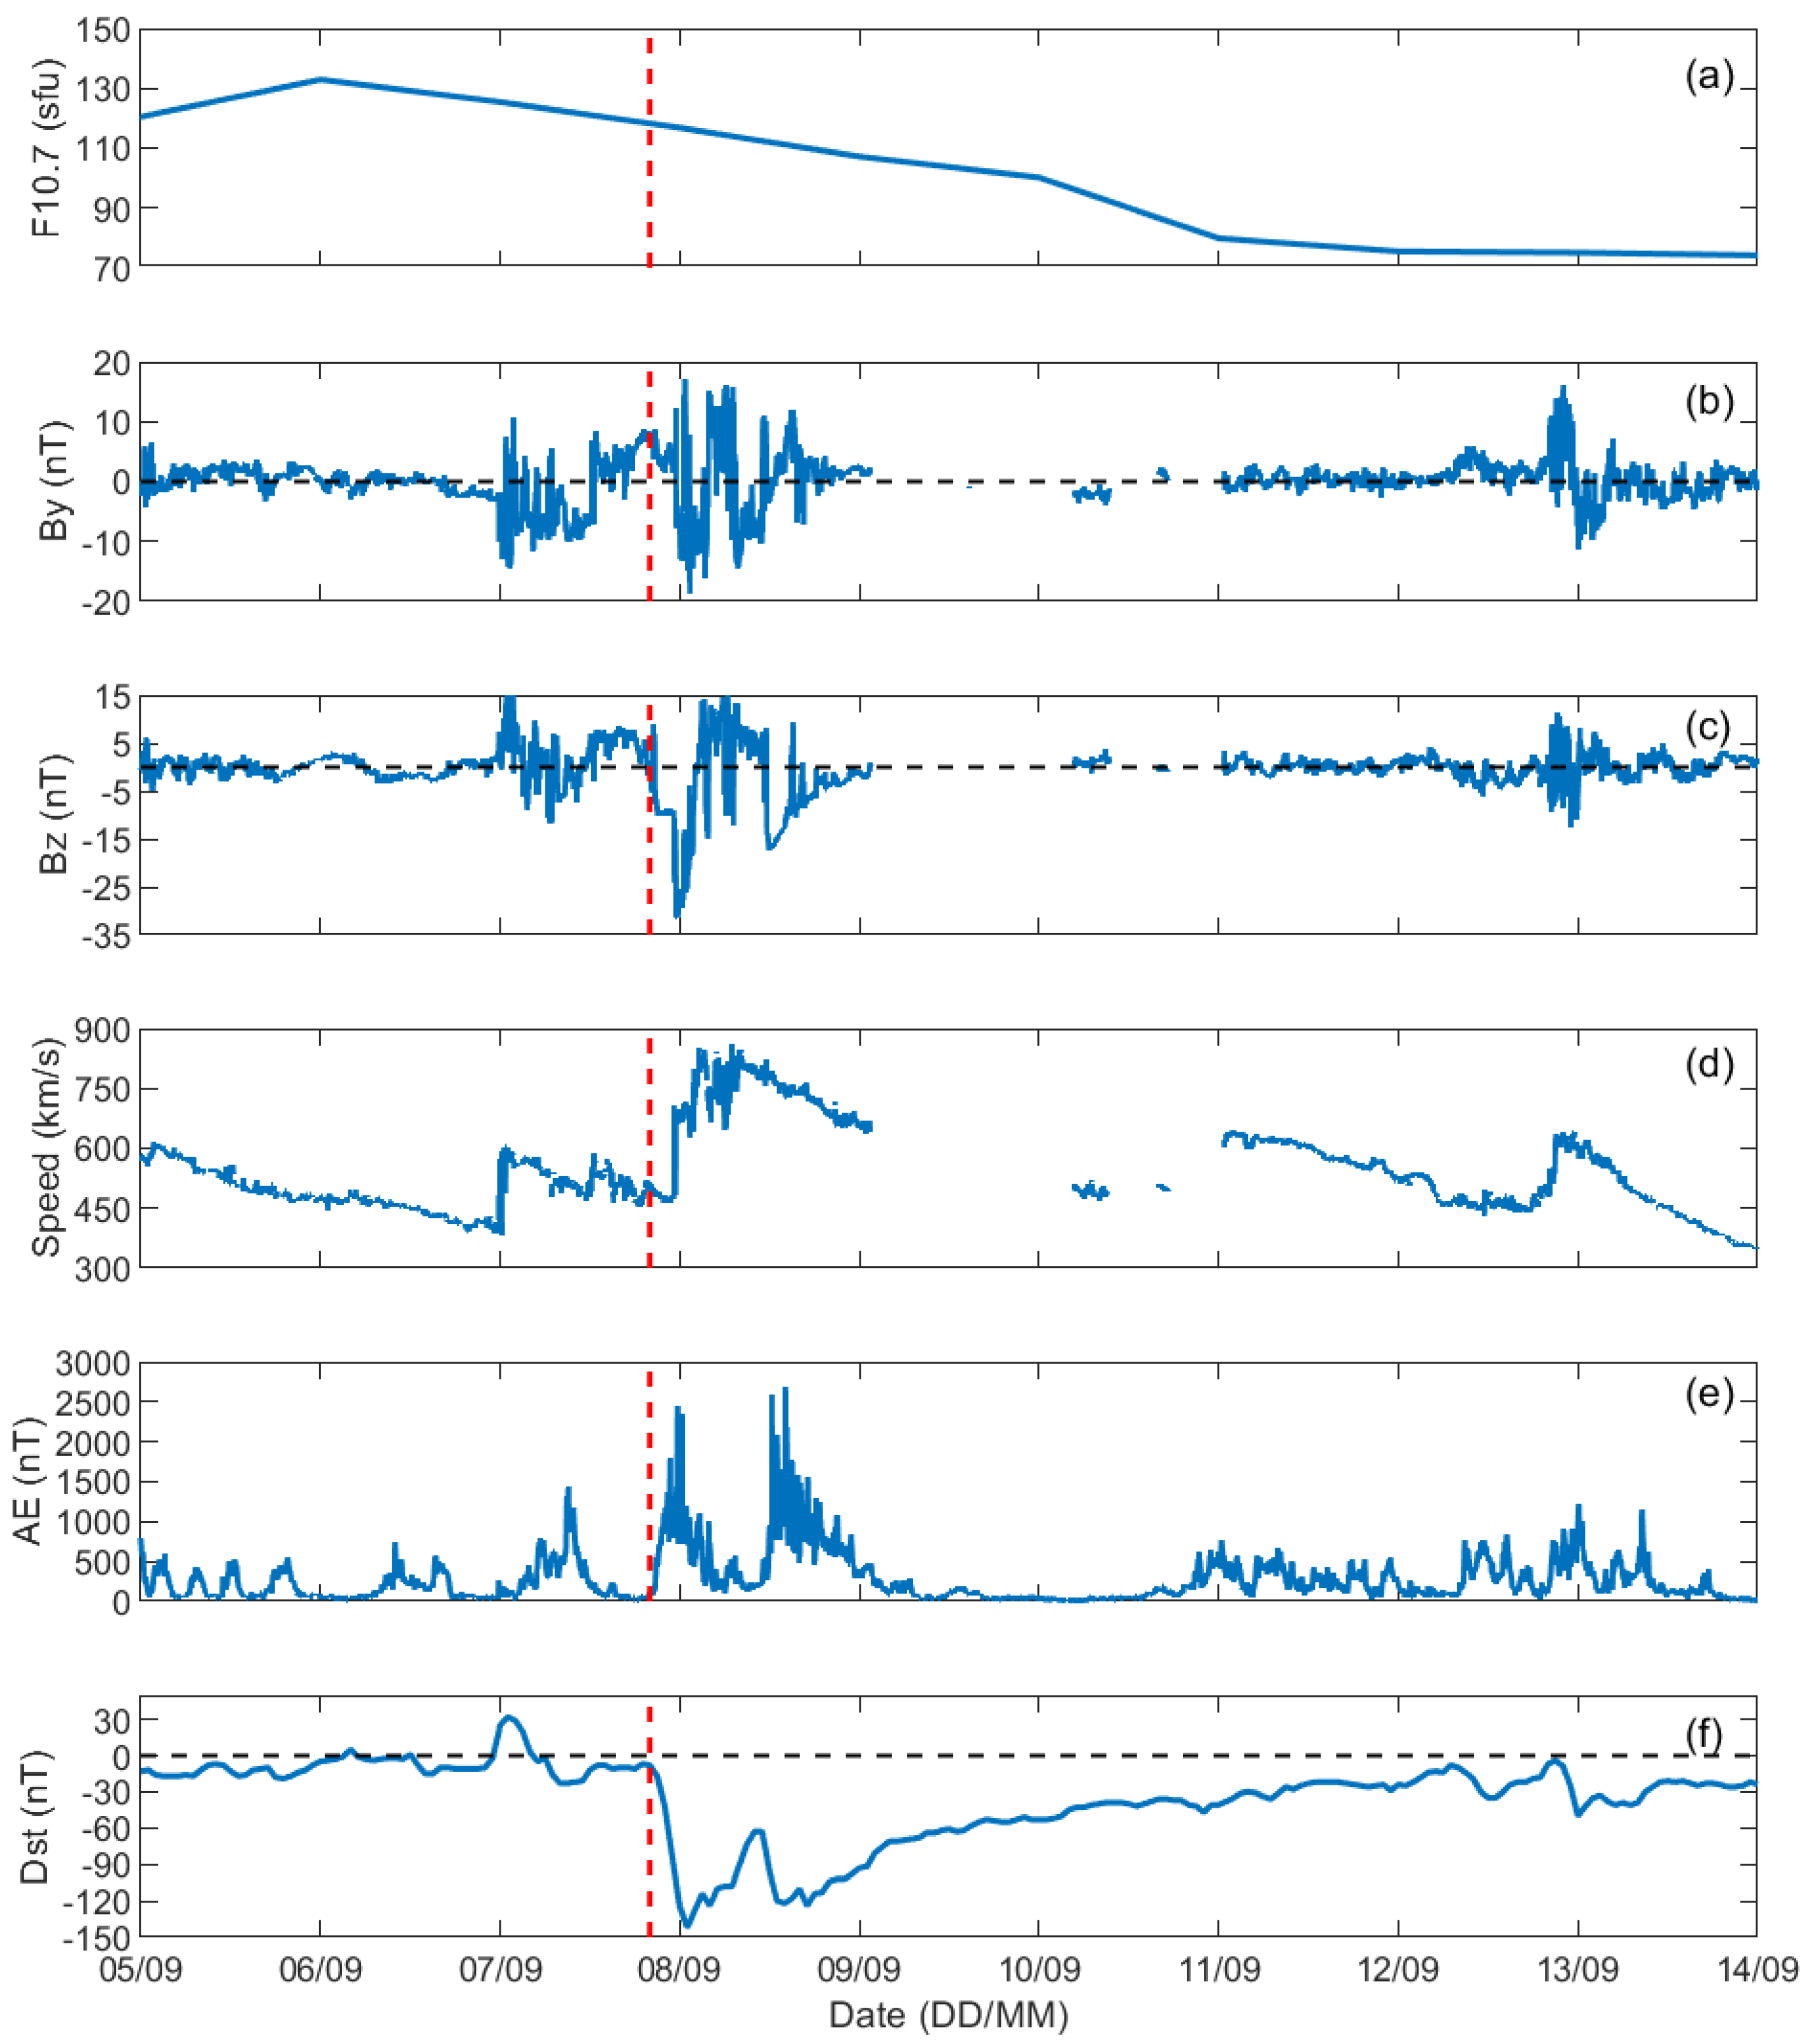
Figure 1 shows several parameters and indices that represent the solar radiation, and interplanetary and geomagnetic conditions, for 5–13 September 2017: (a) F10.7 index, (b) the interplanetary magnetic field (IMF) By, (c) IMF Bz, (d) solar wind speed, (e) AE index, (f) Dst index. During the storm, the solar EUV proxy F10.7 had a significant decrease from ~120 sfu (solar flux unit) to ~80 sfu. The IMF Bz component began to turn northward at about 00:25 UT on 7 September. Meanwhile, the IMF By began to turn directions frequently, as well as the solar wind speed increased abruptly from ~400 to ~600 km/s. After a violent fluctuation for approximately 23 hours, the IMF Bz suddenly dropped to negative and reached the minimum value of -31.21 nT along with the solar wind encountering the second increase to above 800 km/s at ~23:31 UT on 7 September. As the commencement of the storm’s first main phase, the Dst index decreased sharply from a quiescent condition. In addition, two pronounced minimums of Dst are observed at 01:00 UT on 8 September (−142 nT) and at 14:00 UT on 8 September (−122 nT). It should be noted that the AE index had two peaks greater than 2000 nT while the primary and secondary minimums of Dst appeared. However, different from the two minimums of Dst, the second peak value of AE is higher than the first. After analyzing the parameters and indices shown in Figure 1, we found that these small disturbances had appeared about 20 h before the first main phase of the storm.
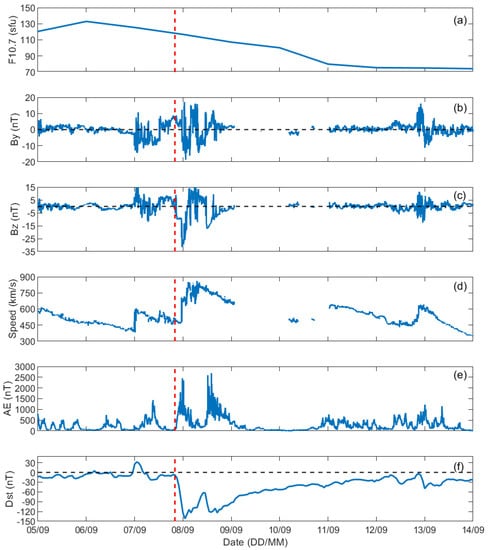
Figure 1.
Solar radiation, and interplanetary and geomagnetic parameters, for the period of 05–13 September 2017: (a) F10.7 index, (b) IMF By, (c) IMF Bz, (d) solar wind speed, (e) AE index, and (f) Dst index. A geomagnetic storm commenced at 20 UT on September 7, 2017. The red vertical dotted line in each panel indicates the first main phase onset time of this storm, and the black horizontal dashed lines in (b,c,f) mark the zero values for By, Bz, and Dst, respectively.
4. Results
During the 7–8 September geomagnetic storm, the variations of temperature from SABER observations and TIMEGCM simulations show different characteristics at different latitudes. Thus, our results are divided into three parts according to the latitude.
4.1. Temperature Variations at High Latitudes in the Northern Hemisphere
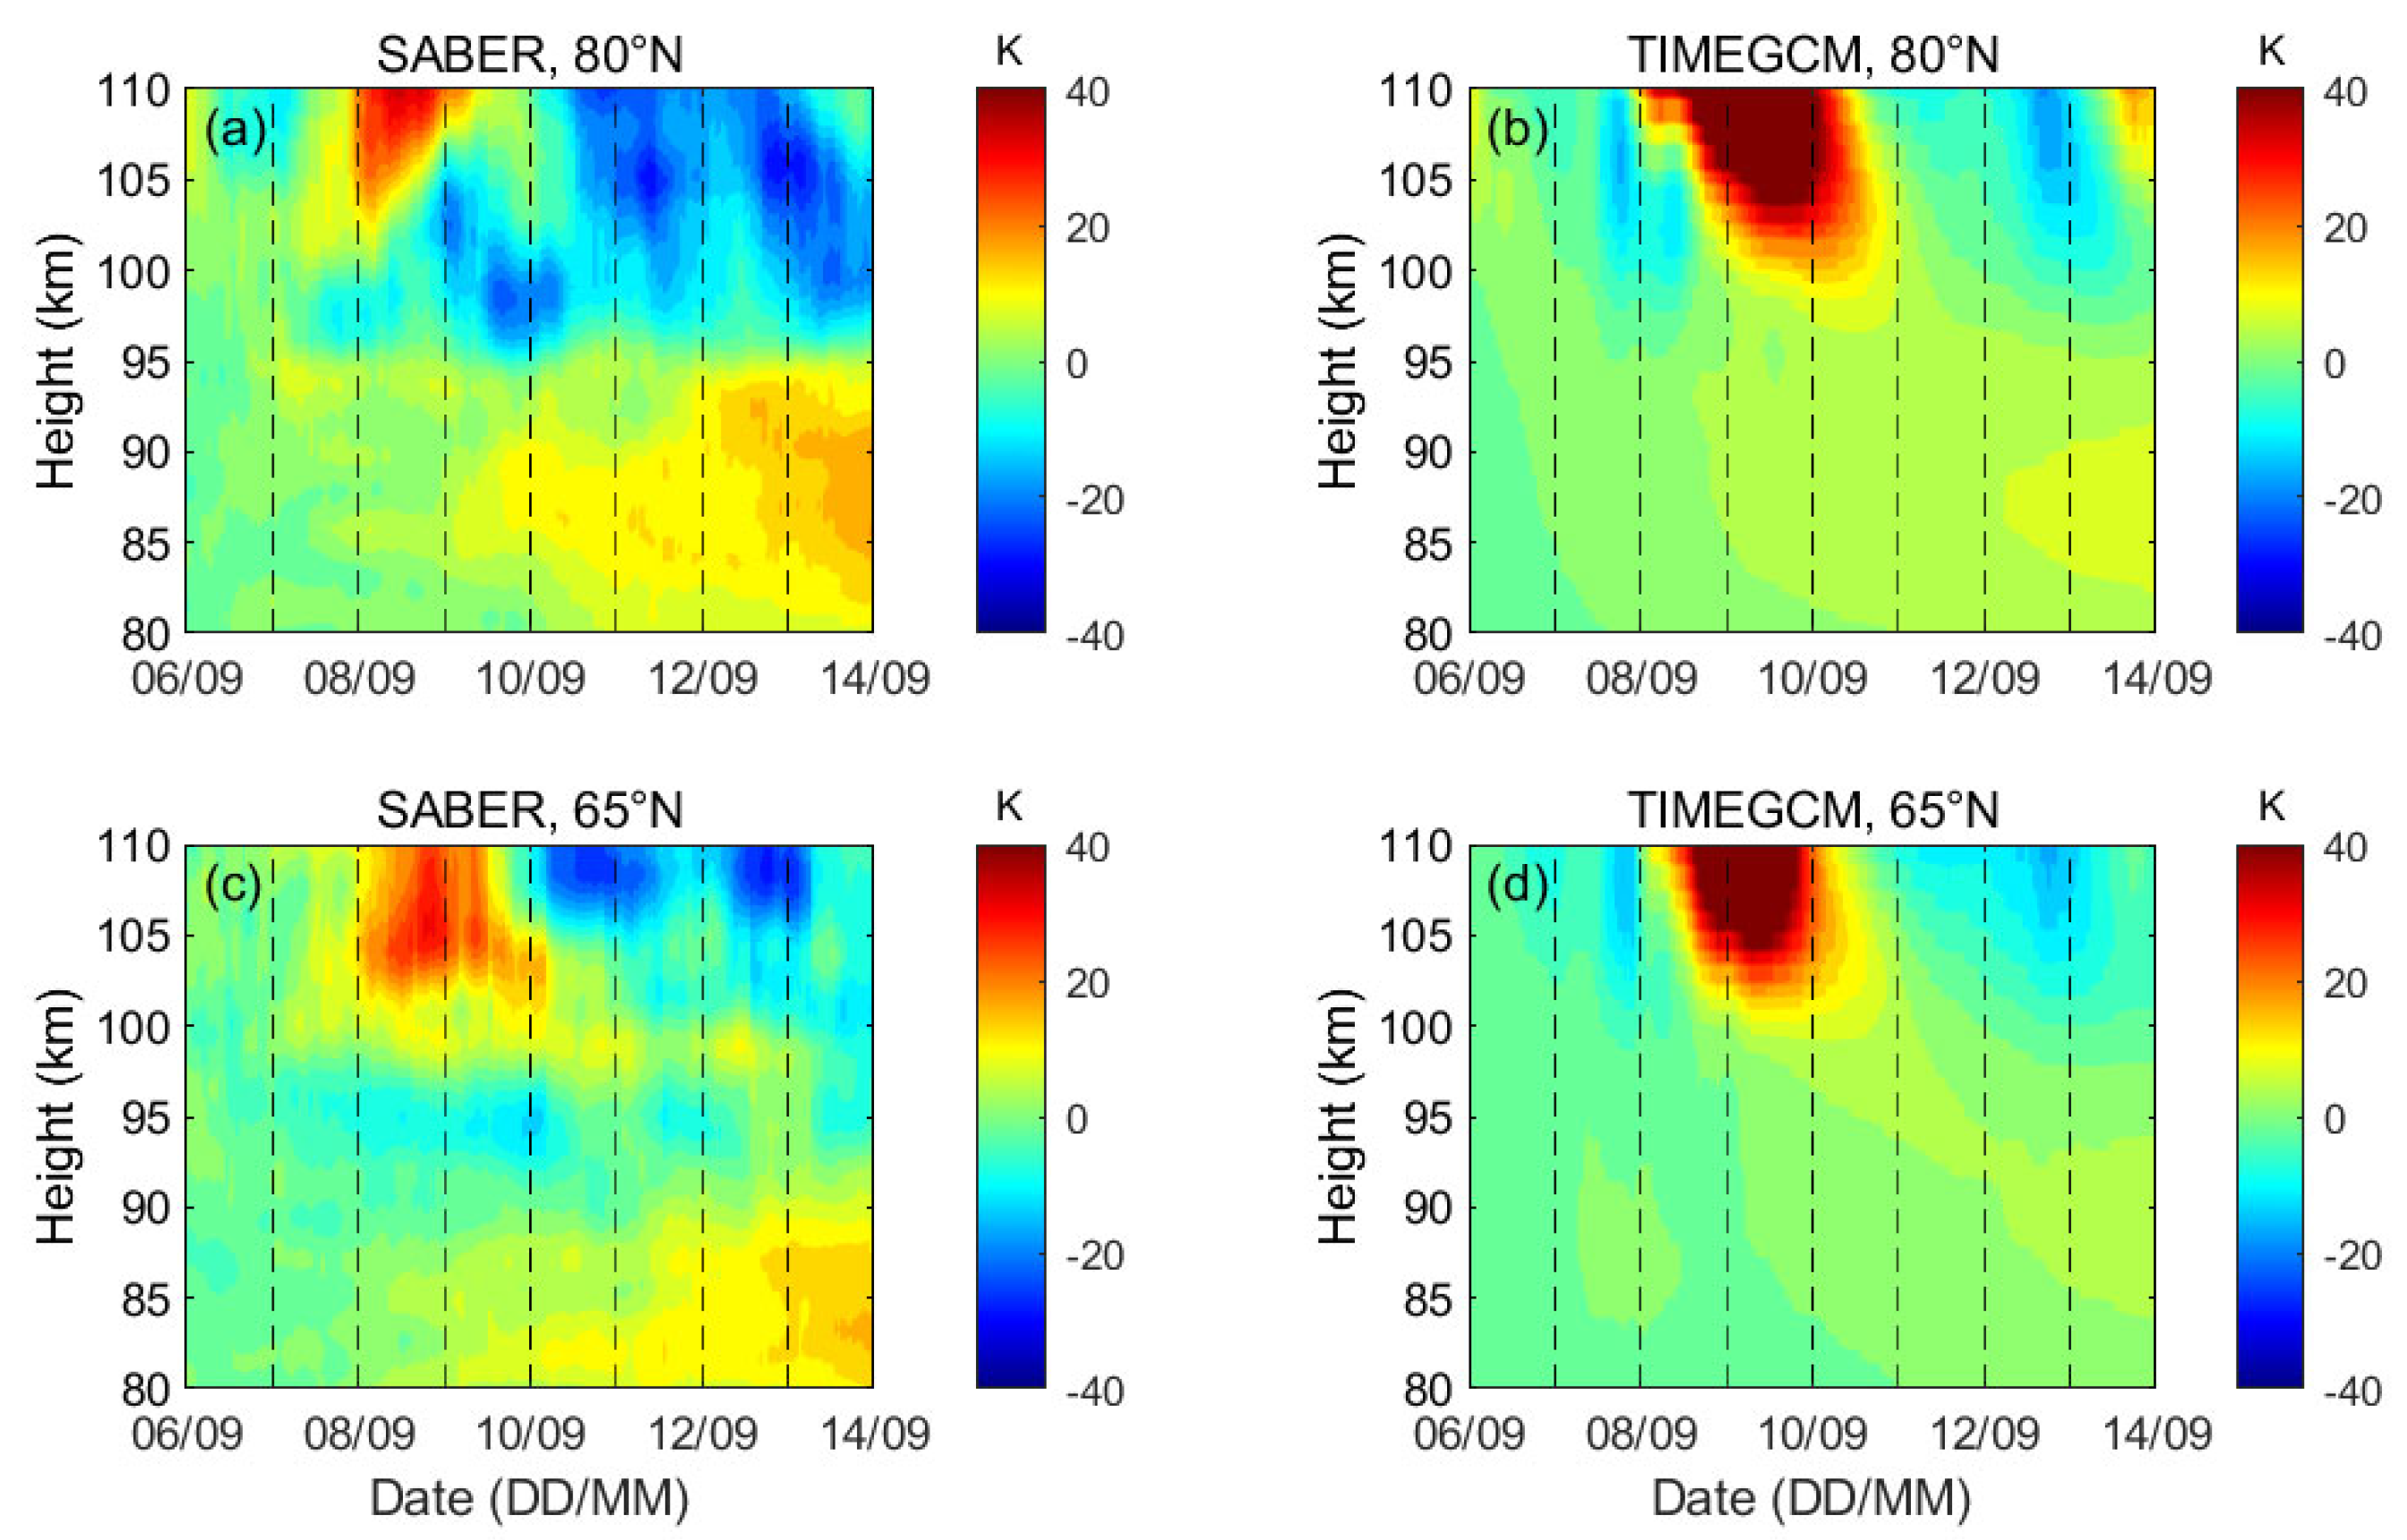
Figure 2 presents the variations of temperature in SABER data and TIMEGCM outputs on 6–13 September 2017 for the 5° bins centered at 80° N and 65° N. The use of different ranges of color bars is not conducive to our comparison and analysis. Thus, the same range of color bars was used for all figures. If the range of color bars is relatively large, such as -90 K to 90 K, the temperature variations observed by SABER would be difficult to reflect, especially at low and middle latitudes. Combining various factors, we used a color bar range of -40 K to 40 K. During this severe geomagnetic storm, the peak of the SABER temperature increase was greater than ~35 K above 100 km at 80° N (Figure 2a) and larger than ~30 K above 98 km at 65° N (Figure 2c). The storm effects on high latitudes in the northern hemisphere lasted for ~three days (7–9 September). The increase commenced before the storm onset as clearly shown in Figure 2a,c, which might be due to the small geomagnetic disturbances at that time. Conversely, the peak of the TIMEGCM temperature enhancement was ~90 K above 98 km at 80° N (Figure 2b), and ~75 K above 100 km at 65° N (Figure 2d). Both at 80° N and 65° N, the peaks of TIMEGCM temperature increase were more than twice that of SABER temperature. The storm effects on the TIMEGCM temperature continued from 8 September to 10 September. In both SABER observations and TIMEGCM simulations, there was a temperature decrease followed by an increase. The temperature decrease was stronger and lasted longer in SABER data and the decrease of 80° N was larger than that of 65° N in both observations and simulations. The SABER observations showed that, at 65° N, the temperature decrease can be observed at ~103 km, while at 80° N, the temperature decrease appeared at lower altitudes around 96 km. Conversely, the TIMEGCM temperature decrease penetrated down to ~98 km at both 80° N and 65° N. Furthermore, a noticeable characteristic is that the 5–20 K temperature increases below 95 km in SABER data and TIMEGCM outputs occurred almost simultaneously with the temperature decrease above 95 km.
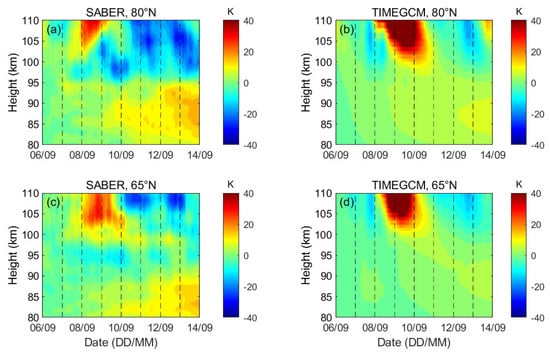
Figure 2.
The storm time variations of the zonal running temperature from SABER (left column) and TIMEGCM (right column) within a 5° latitude band in the altitude range of 80–110 km during 6–13 September 2017. The latitudes are 80° N (top row) and 65° N (bottom row) for both SABER and TIMEGCM. The color bar scale ranges from -40 K to 40 K. The x-axis represents the date on 2017; for example, 06/09 means September 6, 2017. The y-axis represents the heights. The black vertical dotted lines point to the 00:00 UT of the date marked on the x-axis.
By comparing the left column and the right column of Figure 2, we found that although the temperature decrease in TIMEGCM simulations was weaker than that in SABER observations above ~95 km during the storm at high latitudes in the northern hemisphere, the TIMEGCM temperature variation structure was consistent with that of SABER in general. Furthermore, both SABER data and TIMEGCM outputs showed the prominent responses of temperature at high latitudes. In addition, the responses penetrated down to ~80 km.
4.2. Temperature Variations at Low and Middle Latitudes in the Northern Hemisphere
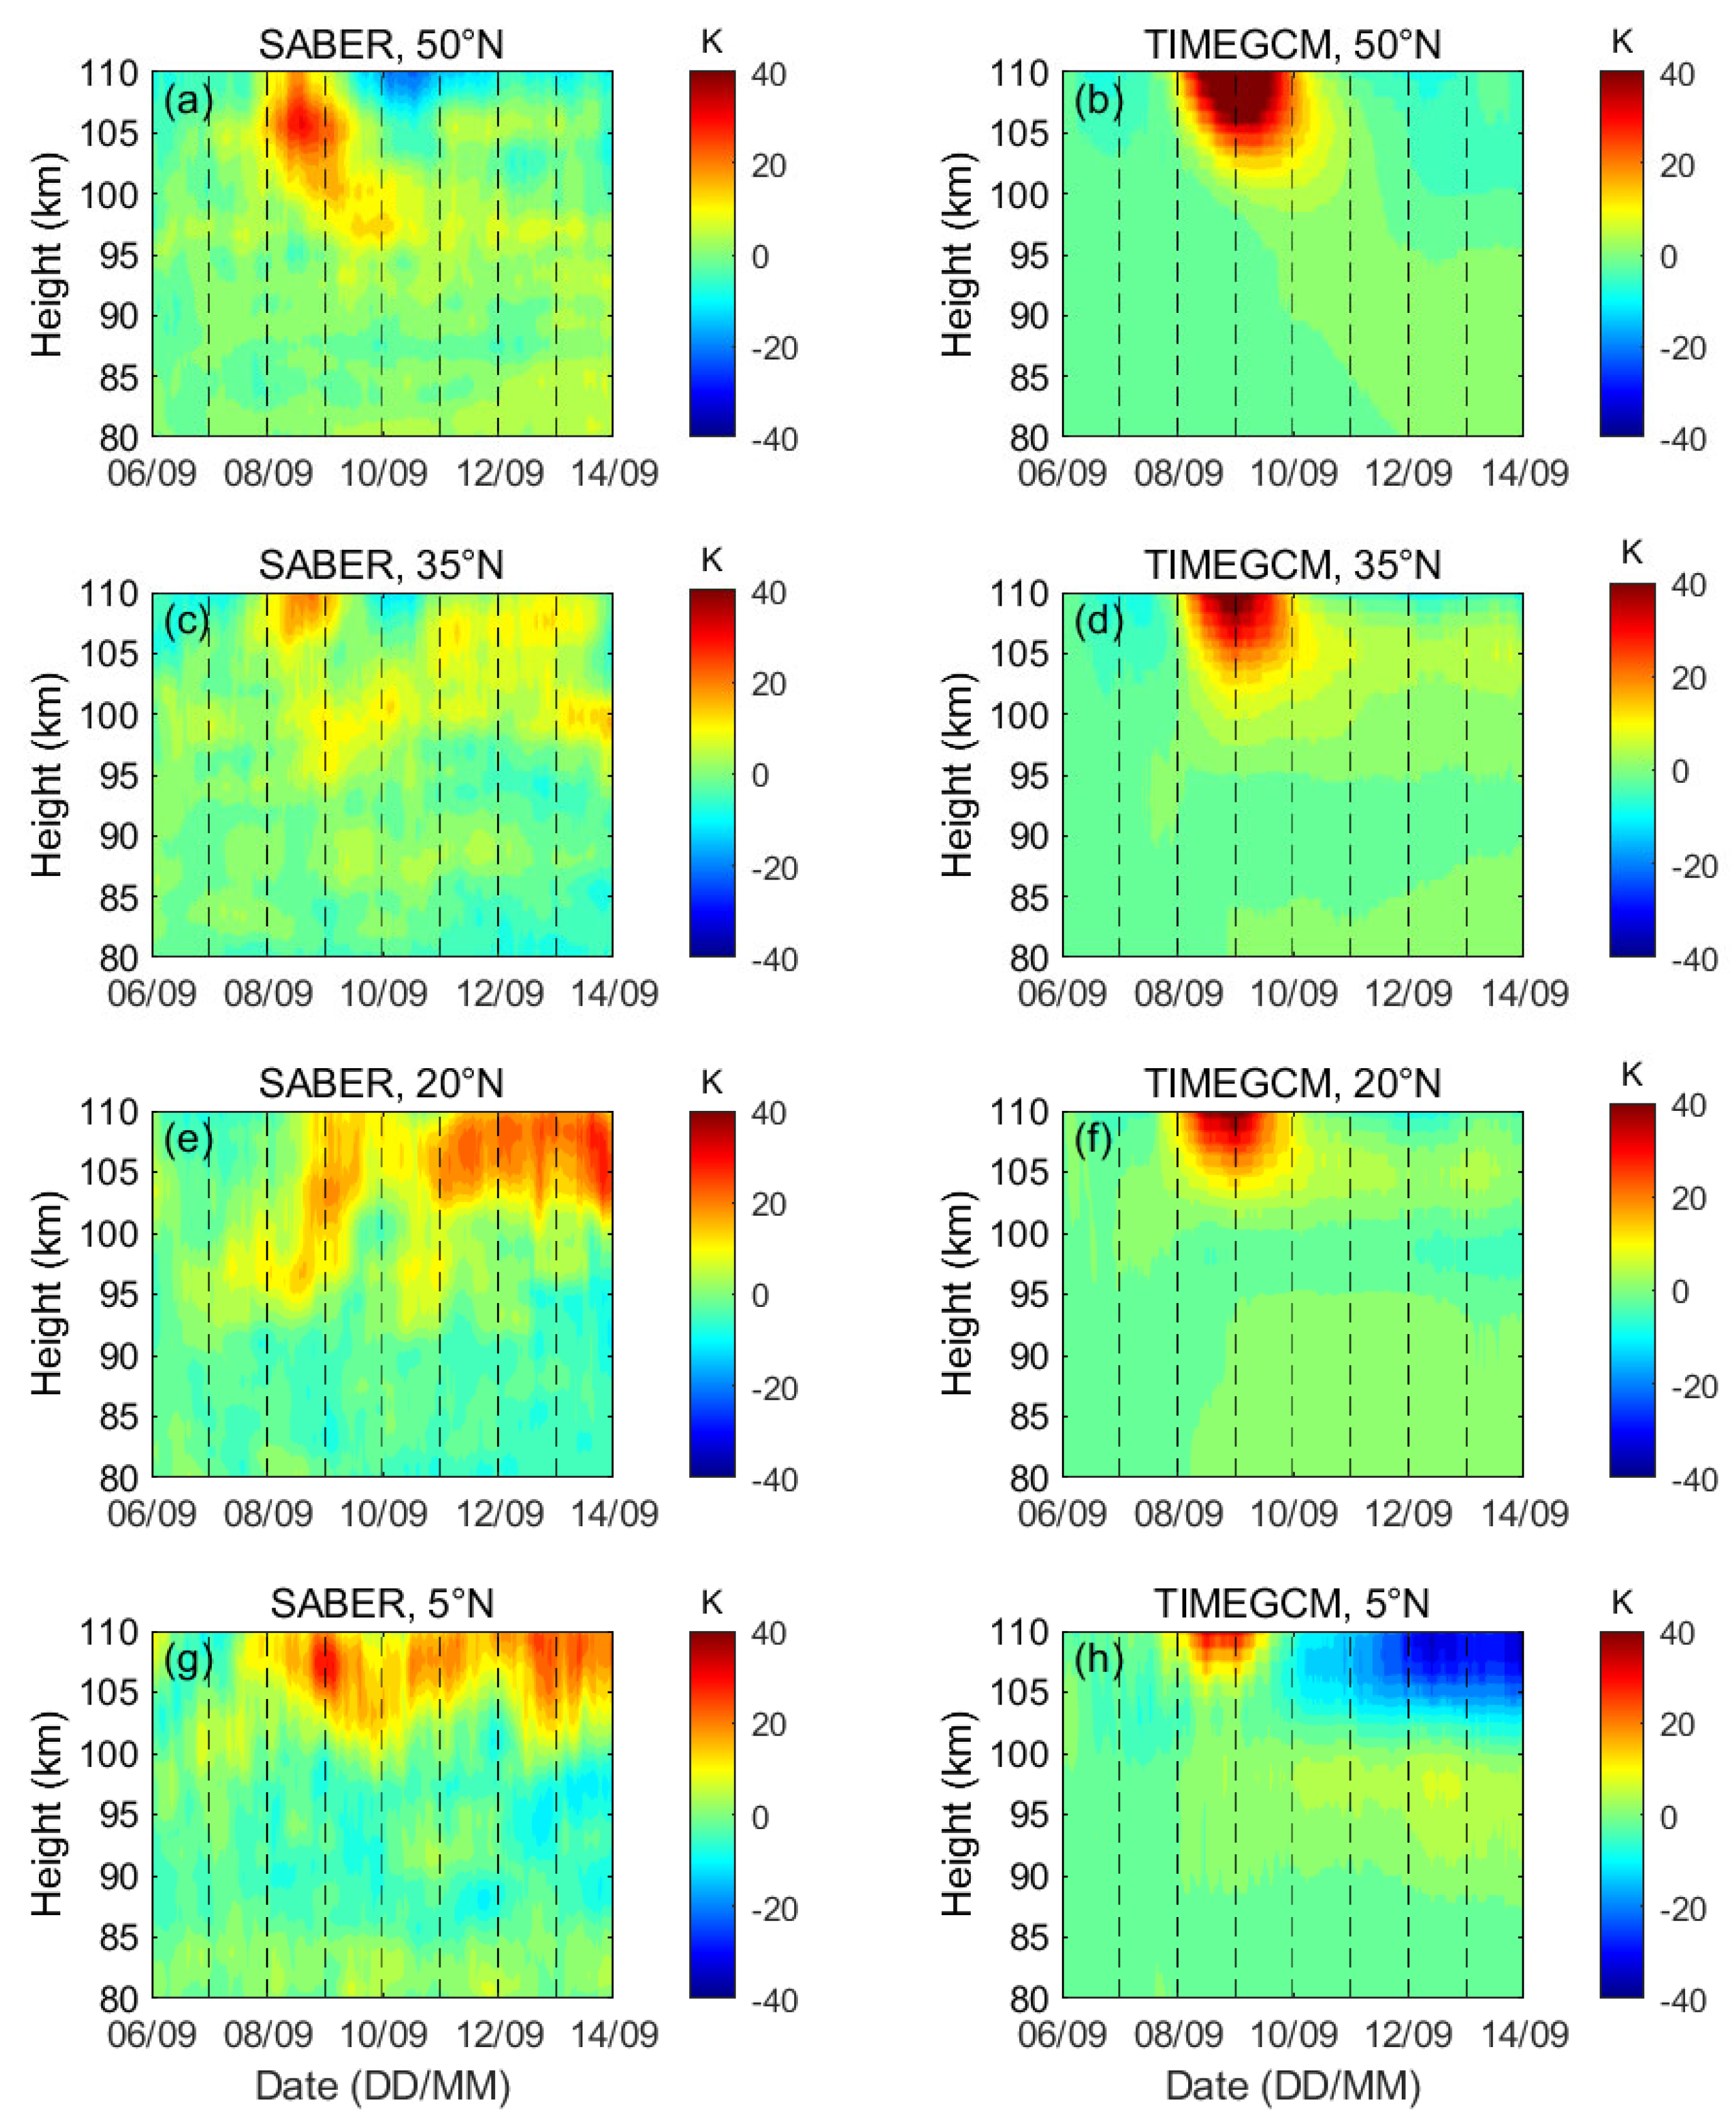
Figure 3 provides our results in SABER data (left column) and TIMEGCM outputs (right column) as a function of altitude from 80 km to 110 km at 50° N, 35° N, 20° N, and 5° N. During the severe geomagnetic storm, the peak of SABER temperature increase (the left column of Figure 3) was larger than 30 K above ~96 km at 50° N (Figure 3a), and the storm responses continued for ~two days. Moreover, at 50° N, there was a weak temperature decrease (~20 K) above ~107 km lasting for only ~one day, which followed the temperature increase. At 35° N (Figure 3c), the peak temperature enhancement was relatively weak, which was about 20 K above 105 km and lasted for ~one and a half days. At lower latitudes (5° N and 20° N, Figure 3e,g), the temperature increases induced by the storm extended down to ~100 km, with a peak of ~30 K. Of note is that the storm effects on the temperature lasted for ~six days.
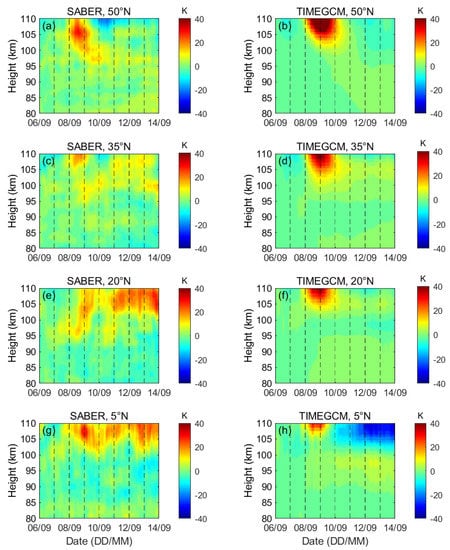
Figure 3.
Similar to Figure 2, but for a latitude range of 50° N–5° N.
In TIMEGCM simulations at 50° N (Figure 3b), the temperature increased with a peak of ~60 K and propagated down to ~102 km; the storm effects lasted for ~two days. The peak of model temperature changes at 35° N (Figure 3d) was larger than 50 K above ~103 km, and the storm influences lasted for ~two days. Conversely, at 20° N (Figure 3f), the enhancement of TIMEGCM temperature was downward to ~104 km and continued only ~two days, with a temperature response peak of ~40 K. Furthermore at 5° N, there was a temperature increase in TIMEGCM about ~two days above 106 km. Another essential feature at 5° N (Figure 3h) is that the temperature increase was followed by a temperature decrease with a peak of 30 K and lasted for ~four days.
The temperature variations in both observations and simulations during the storm appeared with the commence of the storm’s first main phase at the low and middle latitudes in the northern hemisphere in the MLT region. These variations were mainly manifested in the increase of temperature with peak values greater than ~20 K. The temperature responses were changing with altitude, especially larger temperature variations at higher altitudes. During this storm, there was little response at temperatures below ~95 km.
At middle latitudes in the northern hemisphere (Figure 3a,d), the variations of TIMEGCM temperature were more intense than that of SABER temperature. However, the variations in model simulations had similar patterns to those in observations. Compared to the variations at lower latitudes in the northern hemisphere (Figure 3e,h), the temperature features of model outputs (Figure 3f,h) were inconsistent with the features of observations (Figure 3e,g) in the geomagnetic storm recovery phase and after the storm. The temperature increase of SABER observations in the recovery phase of the storm was not reflected in the model simulations, even the model simulations corresponded to the temperature decrease. Overall, both SABER observations and TIMEGCM simulations displayed weaker responses at low and middle latitudes than at high latitudes in the MLT region.
4.3. Temperature Variations at Low and Middle Latitudes in the Southern Hemisphere
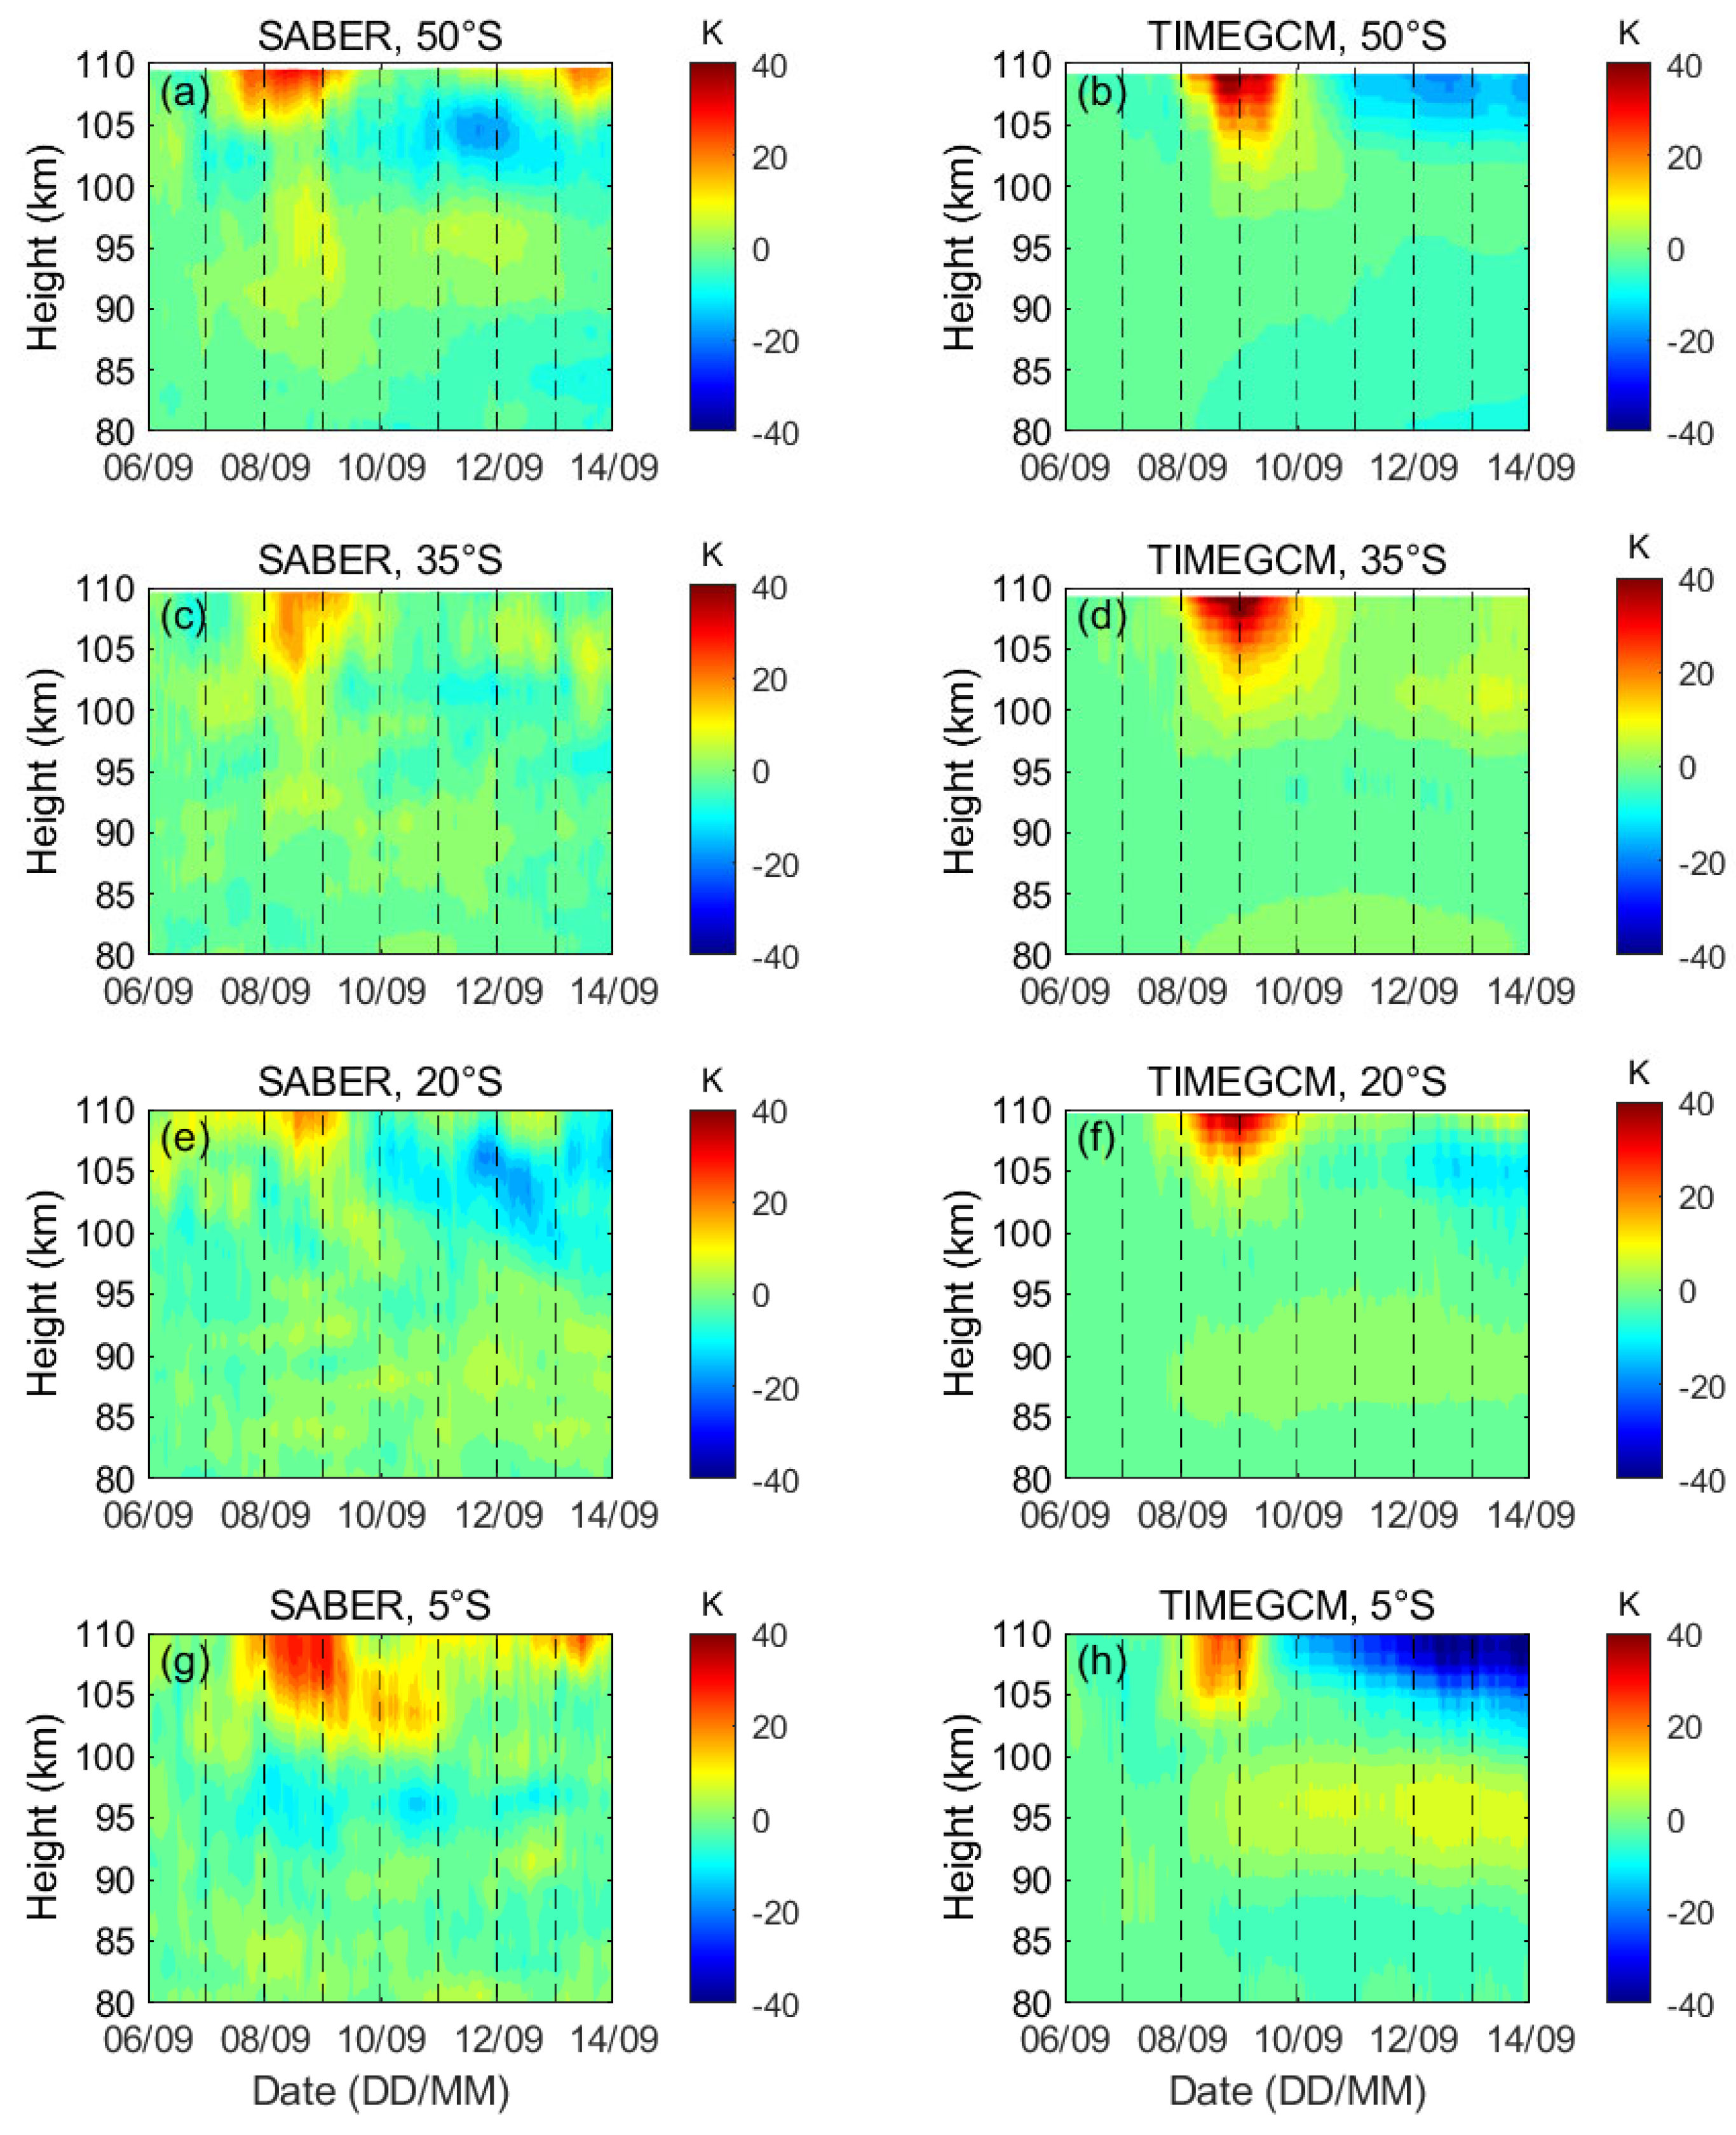
Analysis of the geomagnetic storm responses on fixed latitude levels at 50° S, 35° S, 20° S, and 5° S is shown in Figure 4. From late 7 September to early 9 September, although SABER temperature increases had similar manners over the range of 50° S–20° S (Figure 4a,c,e), their peaks decreased from ~30 K to ~20 K with decreasing latitudes and the peaks always appeared on 8 September. The storm-induced temperature increases penetrated down to ~105 km. In TIMEGCM simulations, over the range 50° S–20° S (Figure 4b,d,f), temperature enhancements also had similar patterns during 8–9 September. The peaks were larger than ~45 K, and the maximum occurred at 35° S. These storms influence transmitted downward to ~103 km. In addition, at 50° S, both SABER and TIMEGCM results show the temperature decrease with a peak of ~15 K, which followed the temperature enhancements. However, the height of the temperature decrease in the model outputs was ~5 km higher than in the SABER observation, and its duration was longer than the observed temperature decrease. Moreover, the temperature decrease was found again at 20° S in the SABER results, and the peak value of the temperature decrease was about 15 K. However, there was no obvious temperature decrease in the variations of TIMEGCM simulations. The other noticeable result from Figure 4 was a great divergence of the temperature variations between the model outputs and the SABER data at lower latitudes in the southern hemisphere (Figure 4g,h). For instance, during this geomagnetic storm, the SABER temperature changed with a peak of ~30 K above 102 km at 5° S, and the storm effects lasted for ~three days. However, TIMEGCM failed to capture the temperature increase occurring in SABER at 5° S. Specifically, the TIMEGCM temperature enhancement continued only ~one day with a peak larger than 25 K above ~104 km. A salient aspect at 5° S was a temperature decrease with a peak of ~40 K lasting more than four days that followed the TIMEGCM temperature enhancement, and the effects of the temperature decrease propagated down to ~103 km.
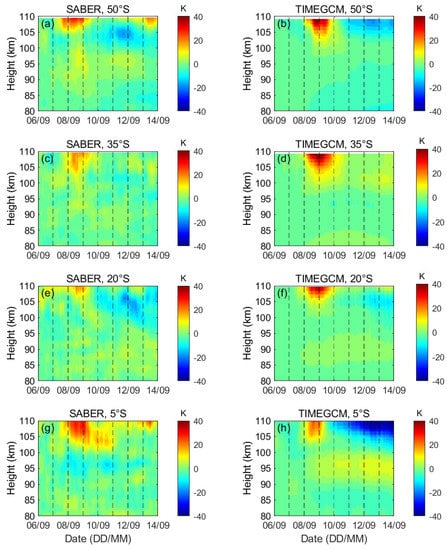
Figure 4.
Same as Figure 2, but for a latitude range 50° S–5° S.
In general, both in observations and simulations, the temperature responses at low and middle latitudes in the southern hemisphere (Figure 4) were weaker than the storm responses at the same latitudes in the northern hemisphere (Figure 3) during the 7–8 September storm. Below ~100 km, the severe storm barely affected the SABER and TIMEGCM temperatures. Therefore, there was hemispheric asymmetry in the temperature responses to this storm in the MLT region. However, there are noteworthy features that existed in both hemispheres, such as both the SABER and TIMEGCM temperature changes were enhanced with the increase of height. The comparison of the temperature changes in two hemispheres does not agree with the conclusion by Wang et al. [15], who indicated that the temperature changes were more prominent in the southern hemisphere than in the northern hemisphere.
The results in Figure 4 show that the temperature variations in the model outputs were more violent than that in the observations at the middle and low latitudes in the southern hemisphere, whereas the trends of SABER and TIMEGCM temperature change were similar at 50° S (Figure 4a,b) and 35° S (Figure 4c,d). At 20° S and 5° S, the different temperature variations between SABER data and TIMEGCM outputs were particularly large as shown in Figure 4e–h, especially at 20° S. By comparing the behaviors of SABER and TIMEGCM temperature in the southern hemisphere (Figure 4) and the northern hemisphere (Figure 3), we found that the MLT correspondences between SABER observations and TIMEGCM simulations were basically consistent in the two hemispheres.
5. Discussion
In the lower thermosphere (above ~95 km), the weaker temperature decreases in TIMEGCM simulations relative to SABER observations as shown in Figure 2 (high latitudes) could be an indicator that the NO and CO2 radiative cooling coefficient in this region may be lower in the model than in reality [2,12]. However, there are overestimated temperature decreases as shown in Figure 3a–f and Figure 4a–f (low latitudes), which may be due to the NO and CO2 radiative cooling coefficient being overrated. At high and middle latitudes, the significant temperature increase in model outputs, as shown in Figure 3g,h as well as Figure 4g,h, may be induced by the overestimated downward vertical winds and Joule heating in TIMEGCM. Nevertheless, further investigations are needed to fully understand those deficiencies in TIMEGCM..
Our investigations show that there are significant temperature variations in the MLT region during the 7–8 September 2017 geomagnetic storm. At high latitudes, the temperature increases, and decreases are large during the storm as shown in Figure 2. We also found that the observed MLT temperature increases occurred in the middle and low latitudes, as shown in Figure 3 and Figure 4. During geomagnetic storms, the change of the circulation at high latitude and vertical convection are transmitted to the equator and change the dynamics of middle and low latitudes in the MLT region [15]. Li et al. [6] found that the adiabatic heating and the vertical heat advection, caused by downward vertical winds in the MLT region and middle latitudes, are the major driving forces of the temperature changes. They suggested that the horizontal heat advection also takes effect to the temperature increases. In addition, the Joule heating also has a small contribution to the temperature enhancements in the auroral zone, although it cannot be the direct source of temperature variations at the low latitudes in the MLT region [33,34,35]. Conversely, the enhanced NO and CO2 infrared radiative cooling can be contributed to the temperature decreases in the MLT region during the storm [2,10,12,36]. Solar activity also influences the temperature in the MLT, which can be represented by F10.7 [25]. The large decreased F10.7 during the storm as shown in Figure 1a is related to the temperature decreases at high latitudes. Finally, the temperature variations displayed in these observations may also be interrelated with lower atmospheric dynamical processes, such as tides.
6. Conclusions
The SABER temperature observations revealed correlation with respect to the 7–8 September geomagnetic storm. The SABER data set extends from 6 to 13 September 2017, between ±52° latitude (almost continuously) and up to 83° latitude in the northern hemisphere, due to the TIMED satellite 60-days yaw cycle. Specifically, the SABER data cover from 80 km to 110 km in altitude, which is distinguished from the previous data altitudes applied to this problem. The SABER data are analyzed on fixed latitude. We also compare the SABER observations with the NCAR’s TIMEGCM simulations. The main results are summarized as follows:
- The temperature response to geomagnetic storm increases with altitude from 96 km to 110 km, and the response is larger at higher latitudes. In addition, the temperature increases below 95 km at high latitudes in the northern hemisphere, and the increased peak value reaches ~20 K;
- The effects of the intense storm on temperature are hemispherical asymmetric. The temperature changes are more significant in the northern hemisphere than in the southern hemisphere during a storm;
- No obvious bimodal structures correspond to the two main phases of a severe storm;
- In the lower thermosphere, the TIMEGCM temperature responses are generally consistent with that in SABER from 80° N to 35° N as well as from 20° S to 50° S. However, the model overestimates the temperature increases and underestimates the temperature decreases. Nevertheless, over the latitude range 20° N–5° S, the model outputs are prominently different from the SABER observations.
Our results suggest that adiabatic heating/cooling and vertical advection, both induced by changes of global vertical winds, play key roles in heating and cooling processes in the MLT region during the storm. In addition, horizontal winds, Joule heating, and infrared radiative cooling of NO and CO2 may be also contributed to the temperature variations. Nonetheless, fully understanding the physical and chemical processes in the MLT region during storms requires further investigation in the future.
Author Contributions
Conceptualization, M.S., Z.L. and J.L. (Jingyuan Li); methodology, M.S.; validation, M.S. and J.L. (Jingyuan Li); formal analysis, M.S., J.L. (Jingyuan Li) and J.L. (Jianyong Lu); investigation, M.S. and Z.L.; resources, Z.L. and J.L. (Jingyuan Li); data curation, M.S. and Z.L.; writing—original draft preparation, M.S.; writing—review & editing, M.S., Z.L., J.L. (Jingyuan Li), J.L. (Jianyong Lu), C.G., M.Z. and Y.T.; visualization, M.S.; supervision, J.L. (Jianyong Lu), C.G. and M.Z.; project administration, Z.L., J.L. (Jingyuan Li) and J.L. (Jianyong Lu). All authors contributed significantly to this work. All authors have read and agreed to the published version of the manuscript.
Funding
This research was funded by the National Natural Science Foundation of China, grants number 42030203, 42074183, and 42004132.
Data Availability Statement
The SABER-measured temperature data are available online at the SABER website (http://saber.gats-inc.com/data_services.php, accessed on 29 January 2022). The F10.7 index, solar wind, and IMF data are provided by the OMNI database (https://omniweb.gsfc.nasa.gov/, accessed on 29 January 2022). The AE and Dst indices are provided by the World Data Center, Kyoto (http://wdc.kugi.kyoto-u.ac.jp/, accessed on 29 January 2022). Simulation data, codes, and analysis routines are saved on the NCAR High Performance Storage System (https://www2.cisl.ucar.edu/resources/storage-and-file-systems/hpss, accessed on 29 January 2022). The National Center for Atmospheric Research is sponsored by the National Science Foundation.
Conflicts of Interest
The authors declare no conflict of interest.
References
- Rees, M.H.; Emery, B.A.; Roble, R.G.; Stamnes, K. Neutral and ion gas heating by auroral electron precipitation. J. Geophys. Res. 1983, 88, 6289–6300. [Google Scholar] [CrossRef]
- Killeen, T.L.; Won, Y.I.; Niciejewski, R.J.; Burns, A.G. Upper thermosphere winds and temperatures in the geomagnetic polar cap: Solar cycle, geomagnetic activity, and interplanetary magnetic field dependencies. J. Geophys. Res. 1995, 100, 21327–21342. [Google Scholar] [CrossRef]
- Yi, W.; Reid, I.M.; Xue, X.; Murphy, D.J.; Hall, C.M.; Tsutsumi, M.; Ning, B.; Li, G.; Younger, J.P.; Chen, T.; et al. High- and middle-latitude neutral mesospheric density response to geomagnetic storms. Geophys. Res. Lett. 2018, 45, 436–444. [Google Scholar] [CrossRef] [Green Version]
- Banks, P.M. Observations of joule and particle heating in the auroral zone. J. Atmos. terr. Phy. 1977, 39, 179–193. [Google Scholar] [CrossRef]
- Roble, R.G.; Emery, B.A.; Killeen, T.L.; Reid, G.C.; Solomon, S.; Garcia, R.R.; Evans, D.S.; Hays, P.B.; Carignan, G.R.; Heelis, R.A.; et al. Joule heating in the mesosphere and thermosphere during the July 13, 1982, solar proton event. J. Geophys. Res. 1987, 92, 6083–6090. [Google Scholar] [CrossRef]
- Li, J.; Wang, W.; Lu, J.; Yuan, T.; Yue, J.; Liu, X.; Zhang, K.; Burns, A.G.; Zhang, Y.; Li, Z. On the responses of mesosphere and lower thermosphere temperatures to geomagnetic storms at low and middle latitudes. Geophys. Res. Lett. 2018, 45, 10128–10137. [Google Scholar] [CrossRef]
- Li, J.; Wang, W.; Lu, J.; Yue, J.; Burns, A.G.; Yuan, T.; Chen, X.; Dong, W. A modeling study of the responses of mesosphere and lower thermosphere winds to geomagnetic storms at middle latitudes. J. Geophys. Res. 2019, 124, 3666–3680. [Google Scholar] [CrossRef]
- Zhao, X.R.; Sheng, Z.; Li, J.W.; Yu, H.; Wei, K.J. Determination of the “wave turbopause” using a numerical differentiation method. J. Geophys. Res. 2019, 124, 10592–10607. [Google Scholar] [CrossRef]
- Roble, R.G. Energetics of the mesosphere and thermosphere, in The Upper Mesosphere and Lower Thermosphere: A Review of Experiment and Theory. Geophys. Monogr. Ser. 1995, 87, 1–21. [Google Scholar] [CrossRef]
- Mlynczak, M.G.; Martin-Torres, F.J.; Crowley, G.; Kratz, D.P.; Funke, B.; Lu, G.; López-Puertas, M.; Russell, J.M.; Kozyra, J.; Mertens, C.; et al. Energy transport in the thermosphere during the solar storms of April 2002. J. Geophys. Res. 2005, 110, A12S25. [Google Scholar] [CrossRef] [Green Version]
- Mlynczak, M.G.; Hunt, L.A.; Mertens, C.J.; Marshall, B.T.; Russell, J.M.; Woods, T.; Thompson, R.E.; Gordley, L.L. Influence of solar variability on the infrared radiative cooling of the thermosphere from 2002 to 2014. Geophys. Res. Lett. 2014, 41, 2508–2513. [Google Scholar] [CrossRef] [PubMed] [Green Version]
- Li, Z.; Knipp, D.; Wang, W. Understanding the behaviors of thermospheric nitric oxide cooling during the 15 May 2005 geomagnetic storm. J. Geophys. Res. 2019, 124, 2113–2126. [Google Scholar] [CrossRef]
- Yuan, T.; Zhang, Y.; Cai, X.; She, S.-Y.; Paxton, L.J. Impacts of CME-induced geomagnetic storms on the midlatitude mesosphere and lower thermosphere observed by a sodium lidar and TIMED/GUVI. Geophys. Res. Lett. 2015, 42, 7295–7302. [Google Scholar] [CrossRef]
- Liu, X.; Yue, J.; Wang, W.; Xu, J.; Zhang, Y.; Li, J.; Russell, J.M.; Hervig, M.E.; Bailey, S.; Nakamura, T. Responses of lower thermospheric temperature to the 2013 St. Patrick’s Day geomagnetic storm. Geophys. Res. Lett. 2018, 45, 4656–4664. [Google Scholar] [CrossRef] [Green Version]
- Wang, N.; Yue, J.; Wang, W.; Qian, L.; Jian, L.; Zhang, J. A comparison of the CIR- and CME-induced geomagnetic activity effects on mesosphere and lower thermospheric temperature. J. Geophys. Res. 2021, 126, e2020JA029029. [Google Scholar] [CrossRef]
- Fagundes, P.R.; Sahai, Y.; Takahashi, H.; Gobbi, D.; Bittencourt, J.A. Thermospheric and mesospheric temperatures during geomagnetic storms at 23° S. J. Atmos. terr. Phy. 1996, 58, 1963–1972. [Google Scholar] [CrossRef]
- Von Savigny, C.; Sinnhuber, M.; Bovensmann, H.; Burrows, J.P.; Kallenrode, M.-B.; Schwartz, M. On the disappearance of noctilucent clouds during the January 2005 solar proton events. Geophys. Res. Lett. 2007, 34, L02805. [Google Scholar] [CrossRef] [Green Version]
- Pancheva, D.; Singer, W.; Mukhtarov, P. Regional response of the mesosphere-lower thermosphere dynamics over Scandinavia to solar proton events and geomagnetic storms in late October 2003. J. Atmos. Sol.-Terr. Phy. 2007, 69, 1075–1094. [Google Scholar] [CrossRef]
- Nesse Tyssøy, H.; Heinrich, D.; Stadsnes, J.; Sørbø, M.; Hoppe, U.P.; Evans, D.S.; Williams, B.P.; Honary, F. Upper-mesospheric temperatures measured during intense substorms in the declining phase of the January 2005 solar proton events. Ann. Geophys. 2008, 26, 2515–2529. [Google Scholar] [CrossRef] [Green Version]
- Nesse Tyssøy, H.; Stadsnes, J.; Sørbø, M.; Mertens, C.J.; Evans, D.S. Changes in upper mesospheric and lower thermospheric temperatures caused by energetic particle precipitation. J. Geophys. Res. 2010, 115, A10323. [Google Scholar] [CrossRef] [Green Version]
- Xu, J.Y.; Smith, A.K.; Wang, W. An observational and theoretical study of the longitudinal variation in neutral temperature induced by aurora heating in the lower thermosphere. J. Geophys. Res. 2013, 118, 7410–7425. [Google Scholar] [CrossRef]
- Kamide, Y.; Yokoyama, N.; Gonzalez, W.; Tsurutani, B.T.; Daglis, I.A.; Brekke, A.; Masuda, S. Two-step development of geomagnetic storms. J. Geophys. Res. 1998, 103, 6917–6921. [Google Scholar] [CrossRef] [Green Version]
- Russell, J.M., III; Mlynczak, M.G.; Gordley, L.L.; Tansock, J.; Esplin, R. An overview of the SABER experiment and preliminary calibration results. SPIE 1999, 3756, 277–288. [Google Scholar]
- Remsberg, E.E.; Marshall, B.T.; Garcia-Comas, M.; Krueger, D.; Lingenfelser, G.S.; Martin-Torres, J.; Mlynczak, M.G.; Russell, J.M.; Smith, A.; Zhao, Y.; et al. Assessment of the quality of the Version 1.07 temperature-versus-pressure profiles of the middle atmosphere from TIMED/SABER. J. Geophys. Res. 2008, 113, D17101. [Google Scholar] [CrossRef]
- Forbes, J.M.; Zhang, X.; Marsh, D.R. Solar cycle dependence of middle atmosphere temperatures. J. Geophys. Res. 2014, 119, 9615–9625. [Google Scholar] [CrossRef]
- Xu, J.; Smith, A.K.; Liu, M.; Liu, X.; Gao, H.; Jiang, G.; Yuan, W. Evidence for nonmigrating tides produced by the interaction between tides and stationary planetary waves in the stratosphere and lower mesosphere. J. Geophys. Res. 2014, 119, 471–489. [Google Scholar] [CrossRef]
- Roble, R.G.; Ridley, E.C.; Richmond, A.D.; Dickinson, R.E. A coupled thermosphere/ionosphere general circulation model. Geophys. Res. Lett. 1988, 15, 1325–1328. [Google Scholar] [CrossRef]
- Richmond, A.D.; Ridley, E.C.; Roble, R.G. A thermosphere/ionosphere general circulation model with coupled electrodynamics. Geophys. Res. Lett. 1992, 19, 601–604. [Google Scholar] [CrossRef]
- Roble, R.G.; Ridley, E.C. A thermosphere-ionosphere-mesosphere-electrodynamics general circulation model (time-GCM): Equinox solar cycle minimum simulations (30–500 km). Geophys. Res. Lett. 1994, 21, 417–420. [Google Scholar] [CrossRef]
- Hagan, M.E.; Forbes, J.M. Migrating and nonmigrating diurnal tides in the middle and upper atmosphere excited by tropospheric latent heat release. J. Geophys. Res. 2002, 107, 4754. [Google Scholar] [CrossRef]
- Hagan, M.E.; Forbes, J.M. Migrating and nonmigrating semidiurnal tides in the upper atmosphere excited by tropospheric latent heat release. J. Geophys. Res. 2003, 108, 1062. [Google Scholar] [CrossRef]
- Tassev, Y.; Velinov, P.I.; Tomova, D.; Mateev, L. Analysis of extreme solar activity in early September 2017: G4—Severe geomagnetic storm (07–08.09) and GLE72 (10.09) in solar minimum. Cr. Acad. Bulg. Sci. 2017, 70, 1437–1444. [Google Scholar]
- Huang, Y.S.; Richmond, A.D.; Deng, Y.; Roble, R. Height distribution of Joule heating and its influence on the thermosphere. J. Geophys. Res. 2012, 117, A08334. [Google Scholar] [CrossRef] [Green Version]
- Jee, G.; Burns, A.G.; Wang, W.; Solomon, S.C.; Schunk, R.W.; Scherliess, L.; Thompson, D.C.; Sojka, J.J.; Zhu, L. Driving the TING model with GAIM electron densities: Ionospheric effects on the thermosphere. J. Geophys. Res. 2008, 113, A03305. [Google Scholar] [CrossRef] [Green Version]
- Sinnhuber, M.; Nieder, H.; Wieters, N. Energetic particle precipitation and the chemistry of the mesosphere/lower thermosphere. Surv. Geophys. 2012, 33, 1281–1334. [Google Scholar] [CrossRef]
- Li, Z.; Knipp, D.; Wang, W.; Sheng, C.; Qian, L.; Flynn, S. A comparison study of NO cooling between TIMED/SABER measurements and TIEGCM simulations. J. Geophys. Res. 2018, 123, 8714–8729. [Google Scholar] [CrossRef]
Publisher’s Note: MDPI stays neutral with regard to jurisdictional claims in published maps and institutional affiliations. |
© 2022 by the authors. Licensee MDPI, Basel, Switzerland. This article is an open access article distributed under the terms and conditions of the Creative Commons Attribution (CC BY) license (https://creativecommons.org/licenses/by/4.0/).

