Article

Longitudinal Variations in Equatorial Ionospheric TEC from GPS, Global Ionosphere Map and International Reference Ionosphere-2016 during the Descending and Minimum Phases of Solar Cycle 24

by
Aghogho Ogwala
1,*,
Oluwole Johnson Oyedokun
2,
Olugbenga Ogunmodimu
3,
Andrew Ovie Akala
2,
Masood Ashraf Ali
4,
Punyawi Jamjareegulgarn
5 and
Sampad Kumar Panda
6,*
1
Department of Physics, Eko University of Medicine and Health Sciences, Ijanikin, Lagos 102101, Nigeria
2
Department of Physics, University of Lagos, Akoka, Lagos 101017, Nigeria
3
Department of Electrical Engineering, Manchester Metropolitan University, Manchester M15 6BH, UK
4
Department of Industrial Engineering, College of Engineering, Prince Sattam Bin Abdulaziz University, Al-Kharj 16273, Saudi Arabia
5
Department of Electrical Engineering, Faculty of Engineering, King Mongkut’s Institute of Technology Ladkrabang, Prince of Chumphon Campus, Chumphon 86160, Thailand
6
Department of Electronics and Communication Engineering, K L Deemed to be University, Koneru Lakshmaiah Education Foundation, Guntur 522302, India
*
Authors to whom correspondence should be addressed.
Universe 2022, 8(11), 575; https://doi.org/10.3390/universe8110575
Submission received: 30 September 2022 / Revised: 25 October 2022 / Accepted: 28 October 2022 / Published: 1 November 2022
(This article belongs to the Section Space Science)

Abstract

:
Research on longitudinal discrepancies in local ionospheric variability, especially in equatorial and low-latitude regions, is a focal point of interest for the space weather modeling community. The ionosphere over these regions is influenced by complex electrodynamics, wind, and temperature dynamics that can seriously impact dynamic technological systems such as satellite tracking and positioning, satellite radio communication, and navigation control systems. Here, we researched the longitudinal variability in the ionospheric total electron content (TEC) by analyzing observed global positioning system (GPS)-derived TEC values along with those extracted from the most reliable global ionospheric maps (GIMs) and the International Reference Ionosphere (IRI-2016) model at selected stations in the vicinity of the magnetic equator along the American, African, and Asian longitude sectors. The period of study covered the descending (2016–2017) and deep solar minimum (2018–2019) years in the 24th solar cycle. Apart from the decreasing trend of the TEC from the descending to deep solar minimum period irrespective of season and longitude sector, the results showed a relatively higher magnitude of TEC in the African longitude than the other two longitude sectors. Despite evident overestimation and underestimations of TEC in both models, GIM predictions generally looked better in terms of observed variation patterns, especially in the African longitude. The study also highlights the seasonal and semiannual effects of longitudinal variations in TEC, manifesting in local time offsets and some peculiar anomalies, which seemed to be different from previously reported results, especially during the solar minimum years at the three longitude sectors. The insignificant effects of longitudinal variations on the equinoctial asymmetry are attributed to the diverse electron density distribution and ionospheric morphology at the three longitude sectors that will prompt further investigations in the future. The outcomes from this study may augment the past efforts of scientists to understand the seasonal effects of the longitudinal variations in TEC, thereby complementing the improvements of ionospheric representations in global ionosphere models and maps.

1. Introduction

The ionospheric electron density variation in the Earth’s upper atmosphere acts as a potential threat to the modern space-based technological systems by either introducing delays due to the total electron content (TEC) or the fading/loss of lock due to scintillations in the satellite radio and navigation signals, such as in global navigation satellite systems (GNSSs). In adverse conditions, this variation can cause severe damage to the highly dynamic and sensitive technological systems that rely on the ionosphere for their functionality [1,2]. When space weather conditions are insignificant, standard global positioning system (GPS) receivers can compensate for the average or quiet-time ionosphere delays through integrated models or combined solutions for positioning and navigation that generally correspond to the first-order ionospheric effects. However, when the ionosphere is disturbed by space weather events (SWEs), the models are no longer accurate and the receivers are unable to effectively provide positioning and navigation accuracy [3]. The ionospheric effects on modern space-based technologies are highly dynamic and complicated, especially near the geomagnetic equator, where they tend to be subjected to some anomalies such as the seasonal anomaly, the semi-annual anomaly, the equinoctial anomaly, spread F, noon bite-out, and equatorial electrojet (EEJ) current [4,5,6,7]. A majority of these anomalies can be predicted and mitigated up to some level using certain engineering design solutions. It has been known that the total delay suffered by satellite radio signals propagating through the ionosphere depends on both the frequency of the radio signal and the TEC [8,9]. However, the TEC is known to suffer spatiotemporal variations, and neglecting these changes can introduce a few centimeters to several meters of error in position calculations [7,10,11,12,13,14,15]. The legacy GPS constellation provides input parameters associated with a simplistic empirical model of the ionosphere known as the Klobuchar model [16], which determines and mitigates the delay error in single-frequency positioning to some extent [17]. When conditions deviate from those predicted by the Klobuchar model, GPS/GNSS systems may have larger positioning errors, so the use of dual-frequency (L1 (f1 = 1575.42 MHz) and L2 (f2 = 1227.60 MHz)) GPS receivers becomes more accurate. The exploitation of GNSS radio and navigation systems, such as GPS, has tremendously increased in the last decade in modern technological infrastructure, as well as in the defining and modeling of the atmospheric and ionospheric variations and their effects [18,19]. GPS receivers are in-built in almost every cell phone, as well as in most automobiles, airplanes, trucks, ships, and other modern mobile equipment that demand a precise positioning and navigation solution today. The high precision of dual-frequency GPS is used in farming, construction, exploration, surveying, snow removal, and many other applications that are useful to modern society but are limited in cost-effectiveness. Hence, the implementation of a relatively low-cost robust ionospheric error mitigation method through the modeling of the day-to-day ionospheric effects is a challenging task for the scientific community, as it needs a thorough investigation of latitudinal and longitudinal uncertainty from global and regional perspectives.
Apart from exploring GNSS observables for monitoring the ionospheric TEC, various models developed by different research groups also help in understanding the climatological variability of the TEC and its associated physical mechanisms. Two representatives of such models that have been popularized among researchers are the global ionospheric maps (GIMs) [1], derived from a large dataset of GNSS observations across the globe, and the global empirical International Reference Ionosphere (IRI) [20], both of which have been undergoing routine improvements over the years. At present, GIMs are developed by eight ionospheric associate analysis centers (IAACs) under the flagship of the International GNSS Service (IGS) ionosphere working group (Iono-WG) task force by following their independent mathematical methods. The final combined IGS-GIMs are then generated by Iono-WG by assigning appropriate weightages to the individual TEC products released by IAACs. The IGS GIMs are provided in the IONEX (IONosphere map EXchange) format with a spatial resolution of 5° in longitude, a spatial resolution of 2.5° in latitude, and a temporal resolution of 2 h. Further detailed descriptions of IGS-GIM computation and validation can be found in the work of Hernandez-Pajares et al. [21]. Meanwhile, the source GIMs from the IAACs differ in temporal resolutions [22]. The IRI is a joint initiative by the Committee on Space Research (COSPAR) and the International Union of Radio Science (URSI) with the common goal of developing and improving the international standard for the parameters in the Earth’s ionosphere [20]. The IRI provides the vertical TEC (VTEC) from a lower boundary of 60 km to a user-specific upper boundary of 2000 km that can be extrapolated up to an altitude of 10,000 km [20]. The model has been improved over time, with the latest version of the model denoted as IRI-2020 having been recently released in 2022 [23].
TEC variation near the geomagnetic equator is a major concern to space physicists because of its complex and dynamic nature. Hence, there is a need for further studies to strengthen the understanding of TEC variations over the equatorial and low latitudes in order to develop more precise ionospheric models for nowcasting and forecasting applications. The complex behavior of the TEC across the low latitudes could be due to the effect of the vertical electric field and horizontal magnetic field (E×B drift) above the magnetic equator that results in the upliftment of plasma to higher altitudes through fountain effects, thereby transporting it away from the equator along the magnetic field tubes and producing a certain level of enhancements (equatorial ionization anomaly; EIA) around ±20° of the magnetic equator [7,24,25]. The fountain effect is an electrodynamic lifting of the plasma that drifts upwards until the pressure and gravity forces are high enough to push the plasma back through the geomagnetic field lines to higher latitudes [26,27]. Additionally, the level of solar activity plays a major role in producing huge disturbances to the electrodynamics of the equatorial ionosphere [28].
Several studies on TEC variations and assessments of physics-based, mathematical, and empirical ionospheric models at different latitudinal regions spanning the Euro–African, Asian and American longitudes have been presented in the past [1,7,20,29,30,31,32,33,34,35,36,37,38]. However, there are still some lapses in terms of model assessment accuracy across the American, African and Asian longitudes that need further improvements. Additionally, there is a need for further studies to reinforce the efforts of past researchers. Nogueira et al. [39] studied longitudinal variations in TEC and ion density over the American longitudinal sector, reporting that the TEC variation in the American longitude is larger over the east coast than the west coast and that the vertical drift and thermospheric winds control the longitudinal four-wave structure in TEC and ion density. Akala et al. [40] elucidated that there are higher VTEC values in the African longitude than in the American longitude, which further increase with solar activity. They also concluded that maximum and minimum VTEC values were recorded during the March equinox and the solstices, respectively. Oryema et al. [41] investigated the TEC variations over the magnetic equator and EIA region in Africa, highlighting a nighttime enhancement of TEC, mostly in the equinoctial months, and a higher percentage of TEC variability during the nighttime than during the day. Zhong et al. [42] demonstrated that the longitudinal variations of the topside TEC are different from the corresponding longitudinal variations of electron densities around the F2 peak. Olwendo et al. [43], reported that the crest of the equatorial ionization anomaly in the Eastern African sector is fully matured, thus yielding maximum values of TEC during the equinoxes (March/April and September/October) and minimum values of TEC in the solstice (June/July and November/December). They further reported TEC enhancements during the nighttime at stations away from the dip equator, showing that ionospheric plasma density diffuses from the dip equator and leads to the formation of EIA crests that can last for a few hours after local sunset time.
As a result of the erratic and problematic nature of TEC variations near the magnetic equator, there is still a need for further studies to strengthen the understanding of TEC variability around the geomagnetic equator that eventually escalates the prediction capabilities of ionospheric models with appropriate mathematical implementations. Hence, this research was aimed to investigate and understand the local-time offsets and peculiar anomalies in TEC at different longitudinal sectors by analyzing them in terms of the diurnal, seasonal, and solar cycle variations in GPS-TEC. The overestimation and underestimation characteristics of the GIM and IRI-2016 models were also assessed by focusing on the equatorial and low latitudes throughout the study. Moreover, the seasonal discrepancies in the longitudinal variation of TEC, which are the focal points of research in aeronomy science and model development nowadays, are addressed in this work. Section 2 deals with the data and methodology. In Section 3, we present the results from the current study and discussions. Finally, Section 4 highlights the concluding remarks drawn from the present study.

2. Materials and Methods

In the present study, we considered the GPS observation data in Receiver Independence Exchange (RINEX) format from three different longitudinal regions, namely, American (Sao Luis, Brazil (SALU) and Porto Velho, Brazil (POVE)), African (Cape Verde (CPVG) and Addis Ababa University, Ethiopia (ADIS)), and Asian (Hutbay, Nicobar Islands (HUTB) and Puerto Princesa, Phillipines (PPPC)) longitudes, when extracting the ionospheric TEC at the respective locations. The geographic coordinates, as well as geomagnetic latitudes, of individual stations are listed in Table 1. The 30-second sampling GPS observation data from the three longitudinal sectors were downloaded from the UNAVCO archives (https://data.unavco.org/archive/gnss/rinex/obs/; accessed on 25 October 2021). Figure 1 shows the exact location of the stations used in this research, while Table 1 shows their geographic coordinates and magnetic latitudes, as well as the full meaning of all the GPS observation station codes. Further, the TEC values at corresponding locations predicted by the IRI were obtained by executing the instant run version of the IRI-2016 model (https://ccmc.gsfc.nasa.gov/modelweb/models/iri2016_vitmo.php; accessed on 19 November 2021). The TEC values were also extracted from the hourly GIMs developed by the Center for Orbit Determination in Europe (CODE) at the University of Bern by adopting a four-point inverse distance weighted interpolation technique [1]. The CODE GIMs are available in the IONosphere map EXchange (IONEX) format, with the global map represented in the form of grids having a spatial resolution of 2.5° in latitude, a spatial resolution of 5° in longitude, and a temporal resolution of 1 h (25 maps per day). The corresponding GIM TEC at the GPS station locations in the grids can be extracted by interpolating the values from the four nearest grid points’ vertexes. The CODE GIMs were accessed from the CDDIS-NASA server (https://cddis.nasa.gov/archive/gnss/products/ionex/; accessed on 16 December 2021).
The obtained GPS-TEC data were processed using the GPS-TEC analysis application program developed by Gopi Seemala [44], which was obtained from his webpage (https://seemala.blogspot.com; accessed on 12 October 2021). To compute the relative values of vertical TEC (VTEC), the TEC analysis program uses the phase and code values for both L1 (1575.42 MHz) and L2 (1227.60 MHz) to minimize the impact of clock errors and tropospheric water vapor. The absolute values of TEC were determined by considering the differential code biases of the satellites and receivers, as given by the University of Bern, which were calculated by minimizing the TEC deviation between 02:00 and 06:00 LT [45]. In order to minimize the effects of multipath associated with low elevation angles, an elevation mask angle cut-off of 30° was used for an ionospheric shell height of approximately 350 km [28,45,46,47]. This allowed only GPS signals at a 350 km height to fall near the GPS receiver on the ground. The GPS-TEC analysis application program uses the 30-second sampling observables from each GPS satellite as input to provide 1-minute averages of VTEC calculated over all the visible GPS satellites during the epochs, which were further downsampled to hourly averaged VTEC values for analysis in this study. STEC, which is the TEC along a satellite pass, is expressed in Equation (1) as:
S T E C = r e c e i v e r s a t e l l i t e N ( s ) d s
where N(s) is the electron density and s is the satellite–receiver distance. VTEC, which is the perpendicular projection of STEC, can be obtained using Equation (2).
V T E C = S T E C × c o s [ s i n 1 ( R E c o s θ R E + h ) ]
where RE is the radius of the Earth, θ is the elevation angle at the ground station, and h is the ionospheric layer height, which is mostly assumed to be 350 km at equatorial and low latitudes. The values of the STEC and VTEC are expressed in TEC units (TECU), given that 1 TECU = 1016 electrons/m2.
There are possibilities for monitoring global ionosphere maps (GIMs) with the data from a huge number of permanent GPS receivers established under the IGS Associate Analysis Centers (IAACs). GIMs are semi-empirical models that are products of the International GNSS Service (IGS). The GIMs used in the present study were those developed by one of the IAACs, i.e., the Center for Orbit Determination in Europe (CODE) at the University of Bern, as the accuracy of the CODE-GIMs (1h is believed to be equivalent to that of the combined IGS-GIMs (2h) but with a relatively better temporal resolution. The IRI is an empirical ionospheric model that also plays a supplementary role in understanding TEC variability in the global ionosphere. A brief explanation of the IRI, which can be found in the introduction section of this research, was well-explained in the work of Bilitza et al. [20,48].
Diurnal variations in the GPS-TEC, GIM and IRI-2016 models (NeQuick topside option) were plotted using daily values, while the seasonal variations in the GPS-TEC, GIM and IRI-2016 models were plotted using monthly values. We adopted the universal time (UT), with an understanding of the local time (LT) difference at the stations spreading over three longitude sectors. The LTs for the American stations are: SALU (UT − 3) and POVE (UT − 4). The LTs for the African stations correspond to CPVG (UT − 1.5) and ADIS (UT + 3). The LTs for the Asian stations are equal to HUTB (UT + 5.30) and PPPC (UT + 8). In order to investigate the seasonal variation in the GPS-TEC, GIM and IRI-2016 models, the data were grouped into four seasons, namely: March equinox (February, March, and April), June solstice (May, June, and July), September equinox (August, September, and October) and December solstice (November, December, and January) by following the classifications of Oyedokun et al. [49] and Somoye and Akala [50]. The statistical analysis of GPS-TEC with model predictions of the GIM and IRI-2016 models using the root mean square error (RMSE) was considered.
R M S E = 1 n i = 1 n ( S i O i ) 2
where Oi represents observation values (GPS-TEC), Si represents predicted model values (GIM and IRI-2016), and n is the number of points considered in the error determination. In the present research, n = 24. The RMSE is can be used to measure accuracy by comparing the prediction errors of different models.

3. Results

3.1. Diurnal Variations

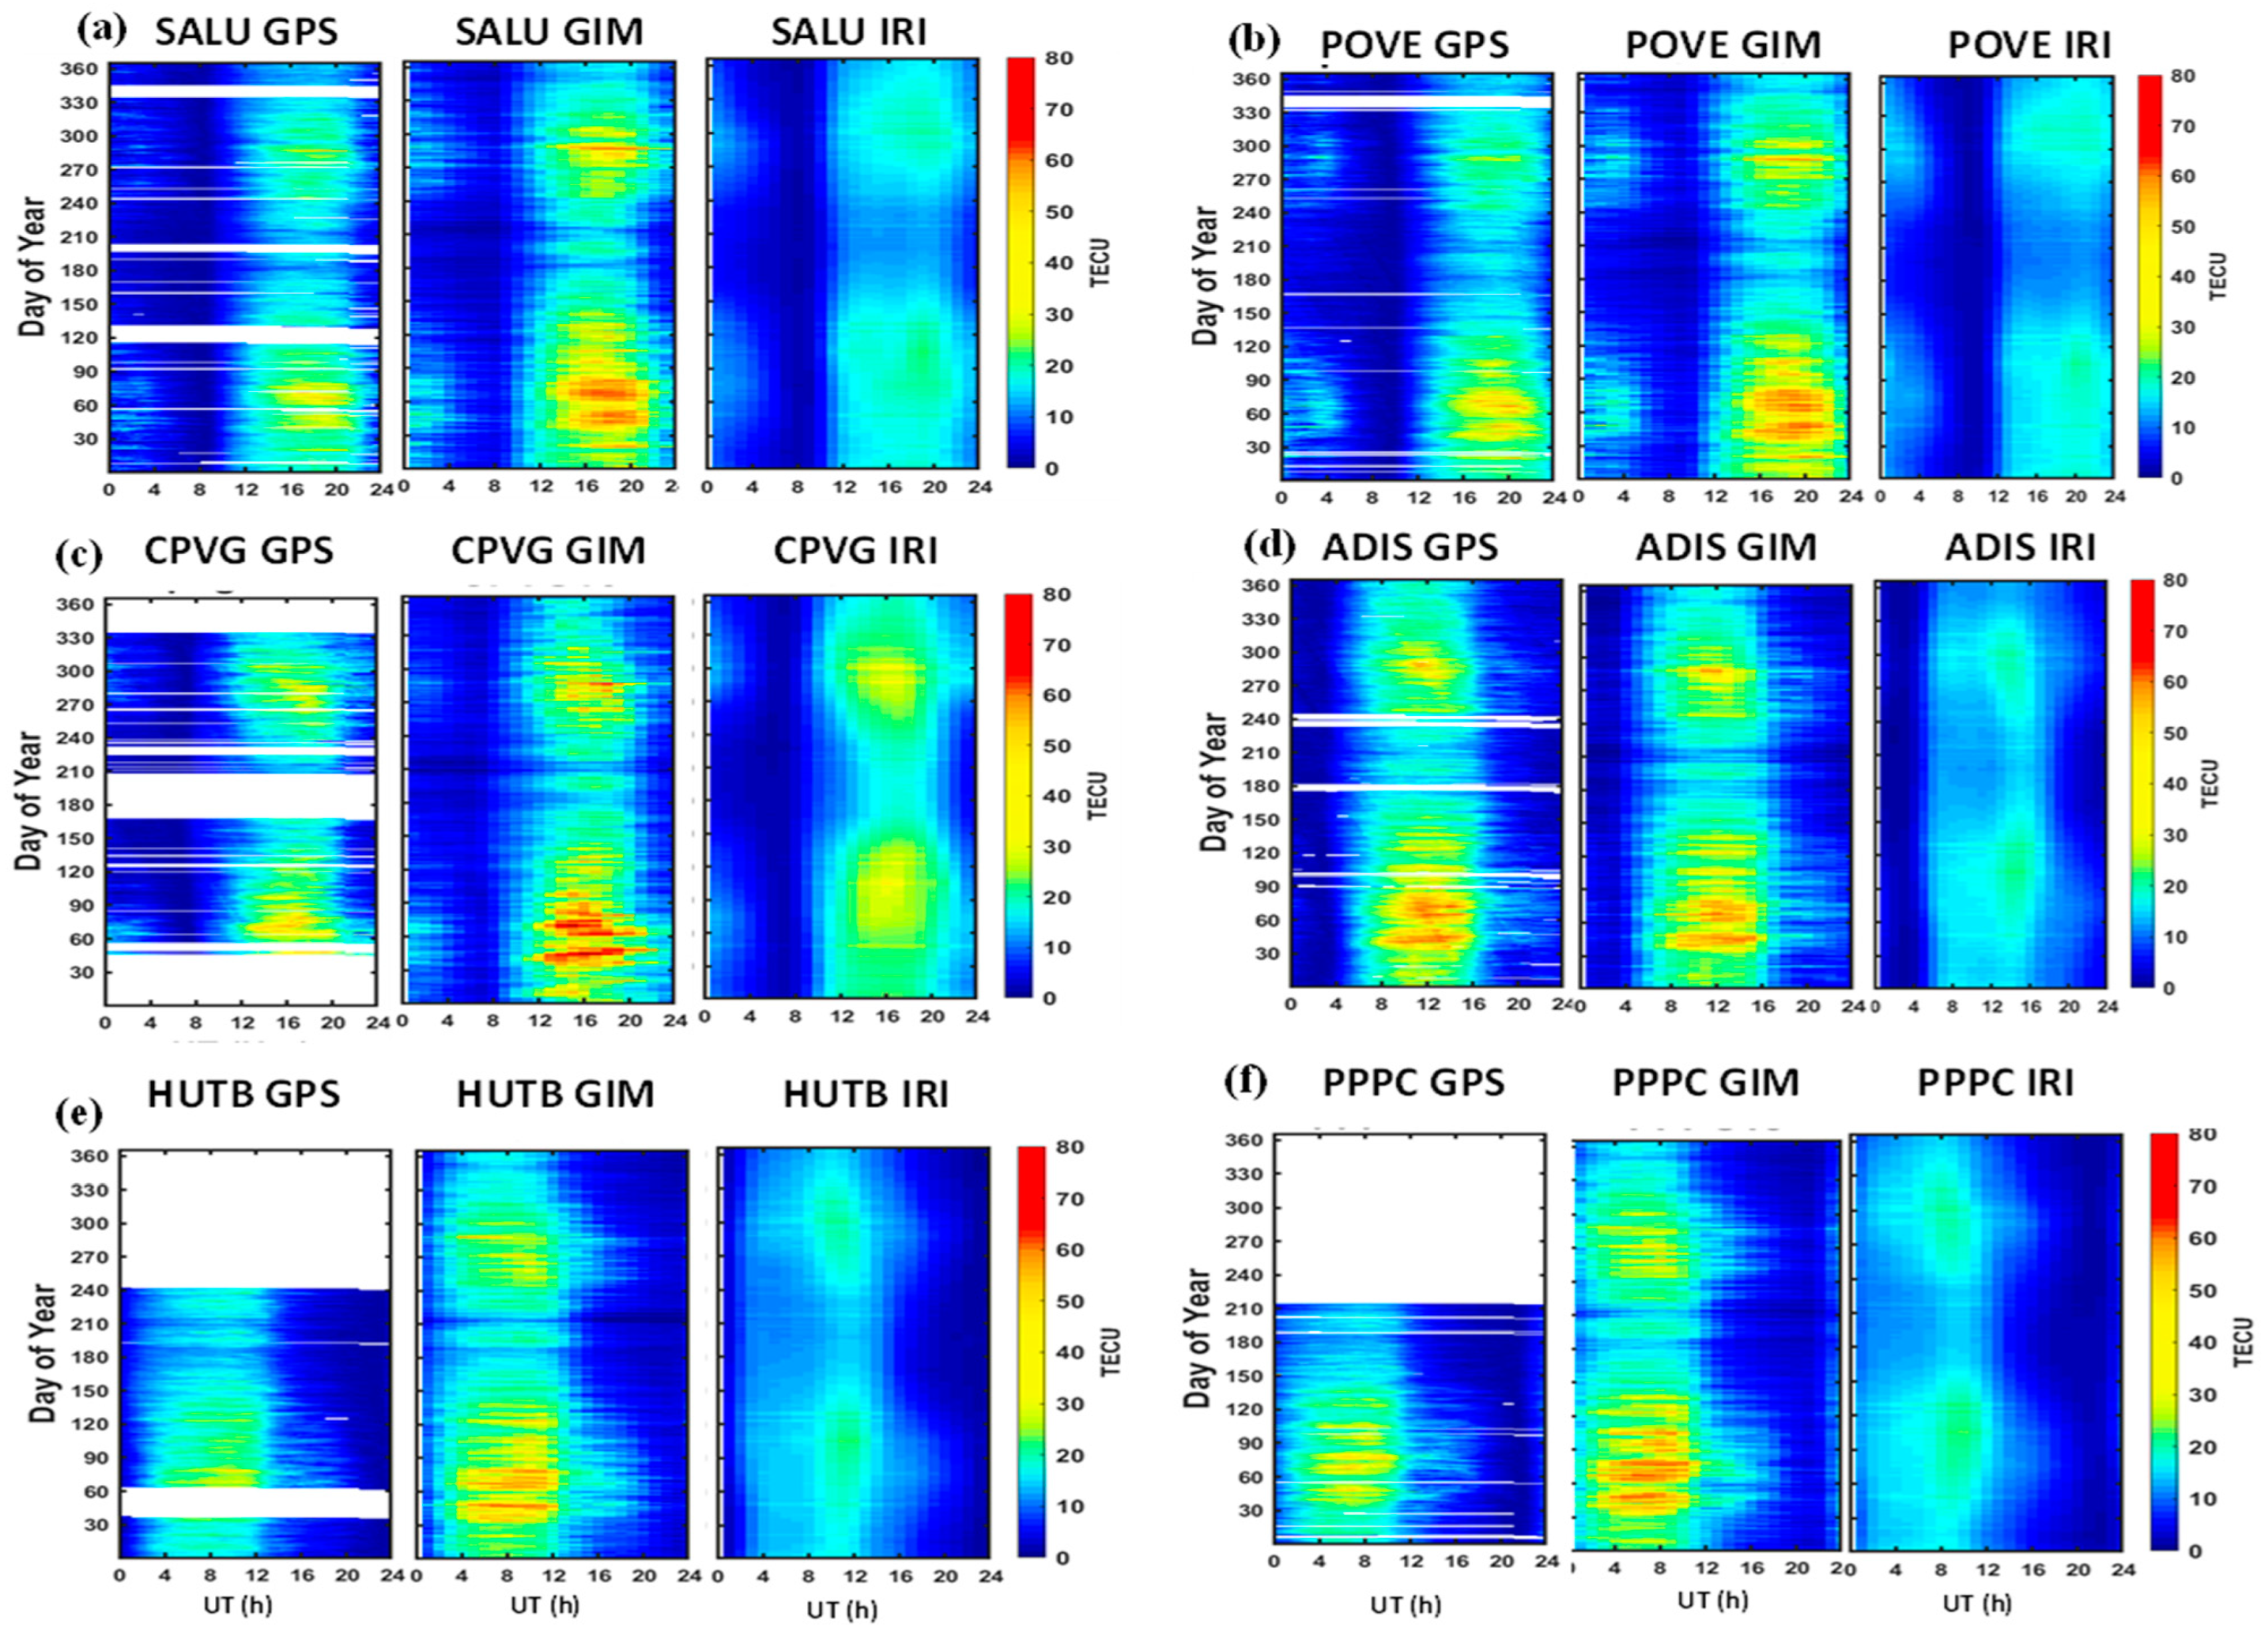
Figure 2, Figure 3, Figure 4 and Figure 5a–f show the plots of diurnal variations in the GPS-TEC, GIM and IRI-2016 models in the American (top panel), African (middle panel), and Asian (bottom panel) longitudes for the descending (2016–2017) and minimum (2018–2019) phases of solar cycle 24. These figures show decreases in the values of the GPS-TEC, GIM and IRI-2016 models from the descending to the minimum phase of solar cycle 24, as expected. During the descending phase year of 2016 in the American longitude, GPS-TEC was observed to start increasing from 09:00 UT (06:00 LT) at SALU (Figure 2a) and 10:00 UT (06:00 LT) at POVE (Figure 2b) from the lowest value of ~2 TECU to the maximum value between 14:00 and 22:00 UT (10:00–18:00 LT; ~45–52 TECU), and then it was reduced to the minimum value afterwards. The GIM showed a similar diurnal trend to GPS-TEC, though with slightly higher values. The IRI-2106 model values increased close to midday with respect to UT (07:00–08:00 LT; ~2 TECU) to the maximum between 16:00 and 22:00 UT (12:00–18:00 LT; ~20–26 TECU) before reducing to the minimum value afterward. The diurnal variations in the GIM values were higher in the American longitude, while the IRI-2016 showed the lowest diurnal values compared with the GPS-TEC values. Hence, GIM revealed a better assessment of GPS-TEC compared with the IRI-2016 model. In the African longitudinal sector, GPS-TEC showed an increase from 03:00 UT (06:00 LT) at ADIS (Figure 2d) and 08:00 UT (06:30 LT) at CPVG (Figure 2c) from the lowest value of ~2 TECU to the maximum value between 10:00 and 14:00 UT (13:00–16:00 LT) at ADIS and between 14:00 and 18:00 UT (12:30–16:30 LT) at CPVG of ~52–60 TECU at both stations before reducing to the minimum value afterward. The GIM also showed a similar diurnal trend to GPS-TEC, though with slightly higher values. The GIM early increase was from 2–3 TECU between 02:00 and 03:00 UT (05:00–06:00 LT) at ADIS and between 07:00 and 08:00 UT (05:30–06:30 LT) at CPVG to 56–65 TECU during the daytime with respect to UT at both stations, and then it reduced to the minimum value afterward. The IRI-2016 model increased from 04:00 UT (07:00 LT) at ADIS and 08:00 UT (06:30 LT) at CPVG (~2–3 TECU) to the maximum value of ~20–40 TECU between 14:00 and 16:00 UT (17:00–19:00 LT) at ADIS and between 14:00 and 20:00 UT (12:30–18:30 LT) at CPVG before reducing to the minimum value afterward. Again, the GIM showed a closer assessment of GPS-TEC than the IRI-2016 model at both stations. Lastly, for the descending phase year of 2016 in the Asian longitude, GPS-TEC values increased from ~2–3 TECU between 22:00 and 01:00 UT, corresponding to 03:30–06:30 LT at HUTB and 06:00–09:00 LT at PPPC, to maximum values of ~35–43 TECU between 06:00 and 12:00 UT, corresponding to 12:30–17:30 LT at HUTB (30–34 TECU) and 14:00–20:00 LT at PPPC, before reducing to the minimum value towards the post-sunset hour with respect to UT at both stations. The GIM showed a similar diurnal trend to GPS-TEC but with higher values (48–60 TECU) at both stations. The IRI-2016 model showed similar diurnal variations to GPS-TEC but with lower values (21–26 TECU) at both stations. The GIM also showed a closer magnitude to GPS-TEC than the IRI-2016 model. The GPS-TEC, GIM and IRI-2016 models showed slightly higher values at PPPC (Figure 2f) than at HUTB (Figure 2e). It is also very important to mention that most of the empty spaces for the GPS-TEC for the three longitudes showed that there were no available GPS data for the period. In some cases, data were available but could not be processed, so they were considered bad data that could not be used in the present research.
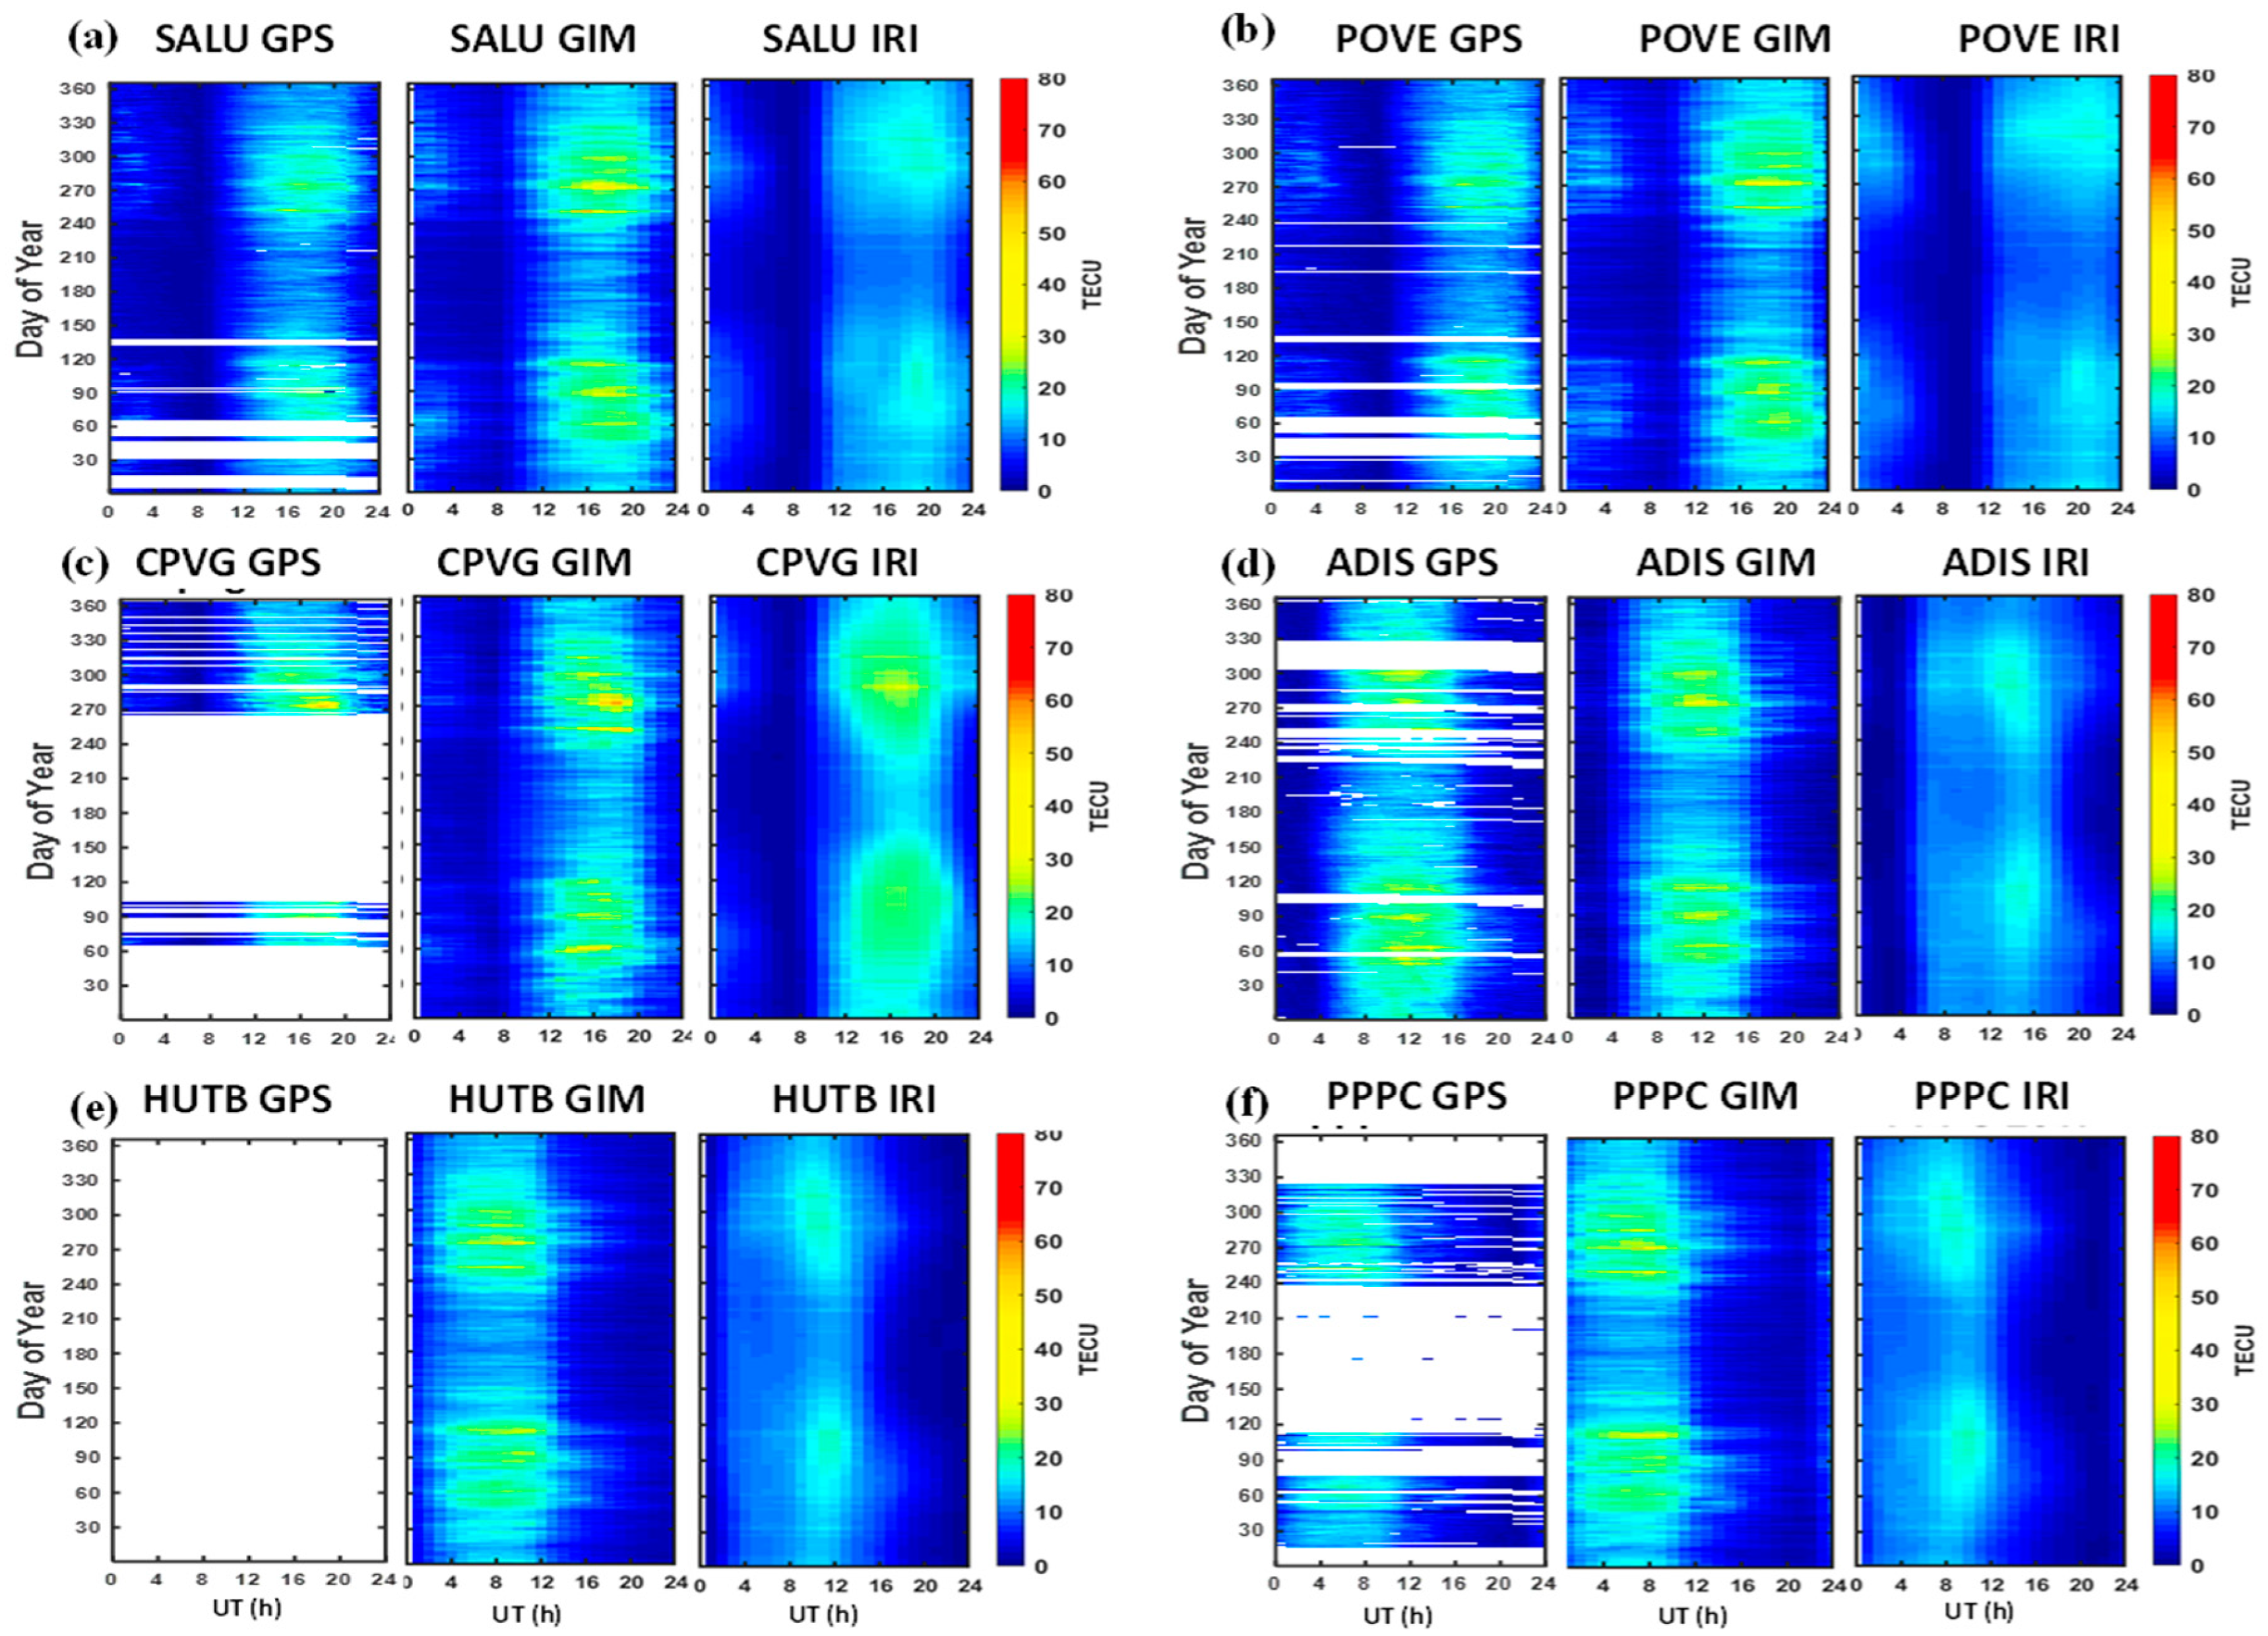
During the descending phase year of 2017 in the American longitude, GPS-TEC was observed to start increasing from 2–4 TECU between 09:00 and 10:00 UT, corresponding to 06:00–07:00 LT at SALU and 05:00–06:00 LT at POVE (Figure 3a,b), to the maximum value of ~24–31 TECU between 14:00 and 20:00 UT, corresponding to 11:00–17:00 LT at SALU and 10:00–16:00 LT at POVE, before reducing to the minimum value toward the pre-sunrise hour with respect to UT at both stations. The GIM diurnal variation pattern was similar to that of GPS-TEC, though with slightly higher values with a difference of up to ~5–12 TECU from post-noon to nighttime with respect to UT at both stations. The diurnal variations of the IRI-2016 model also showed a similar trend to that of GPS-TEC, though with lower values up to differences of ~14–15 TECU from post-noon to nighttime with respect to UT at both stations. In the African longitude, CPVG (Figure 3c) did not have GPS-TEC data for many days, but according the available data, GPS-TEC began its early rise from ~0–2 TECU between 02:00 and 07:00 UT, corresponding to 00:30–05:30 LT at CPVG (Figure 3c) and 05:00–10:00 LT at ADIS (Figure 3d), and reached maximum values of ~28–32 TECU at both stations between 10:00 and 18:00 UT, corresponding to 08:300–16:30 LT at CPVG and 13:00–21:00 LT at ADIS, before reducing to minimum values afterwards at both stations. The diurnal variations in the GIM and IRI-2016 models showed a similar pattern with GPS-TEC, except that the maximum value of the IRI-2016 model, especially at ADIS (~16 TECU), was significantly less than those of GPS-TEC and GIM, whereas the GPS-TEC and GIM values were in about the same range at both stations. During the descending phase year of 2017 in the Asian longitude, HUTB (Figure 3e) did not present GPS-TEC values. Additionally, there were a lot of missing data at PPPC (Figure 3f), hence leading to a difficulty in understanding the diurnal variations in GPS-TEC. However, from the available data at PPPC, there were observed increases in the GPS-TEC, GIM and IRI-2016 models from minimum values of ~1–3 TECU between 20:00 and 23:00 UT (04:00–07:00 UT) to enhanced values between 04:00 and 12:00 UT (12:00–20:00 LT) of 18–22 TECU for GPS-TEC, 26–32 TECU for GIM, and 19 TECU for IRI-2016, before reducing to minimum values afterwards. In terms of the assessment of GPS-TEC values, the GIM assessment reproduced the observed values better than the IRI-2016 model.
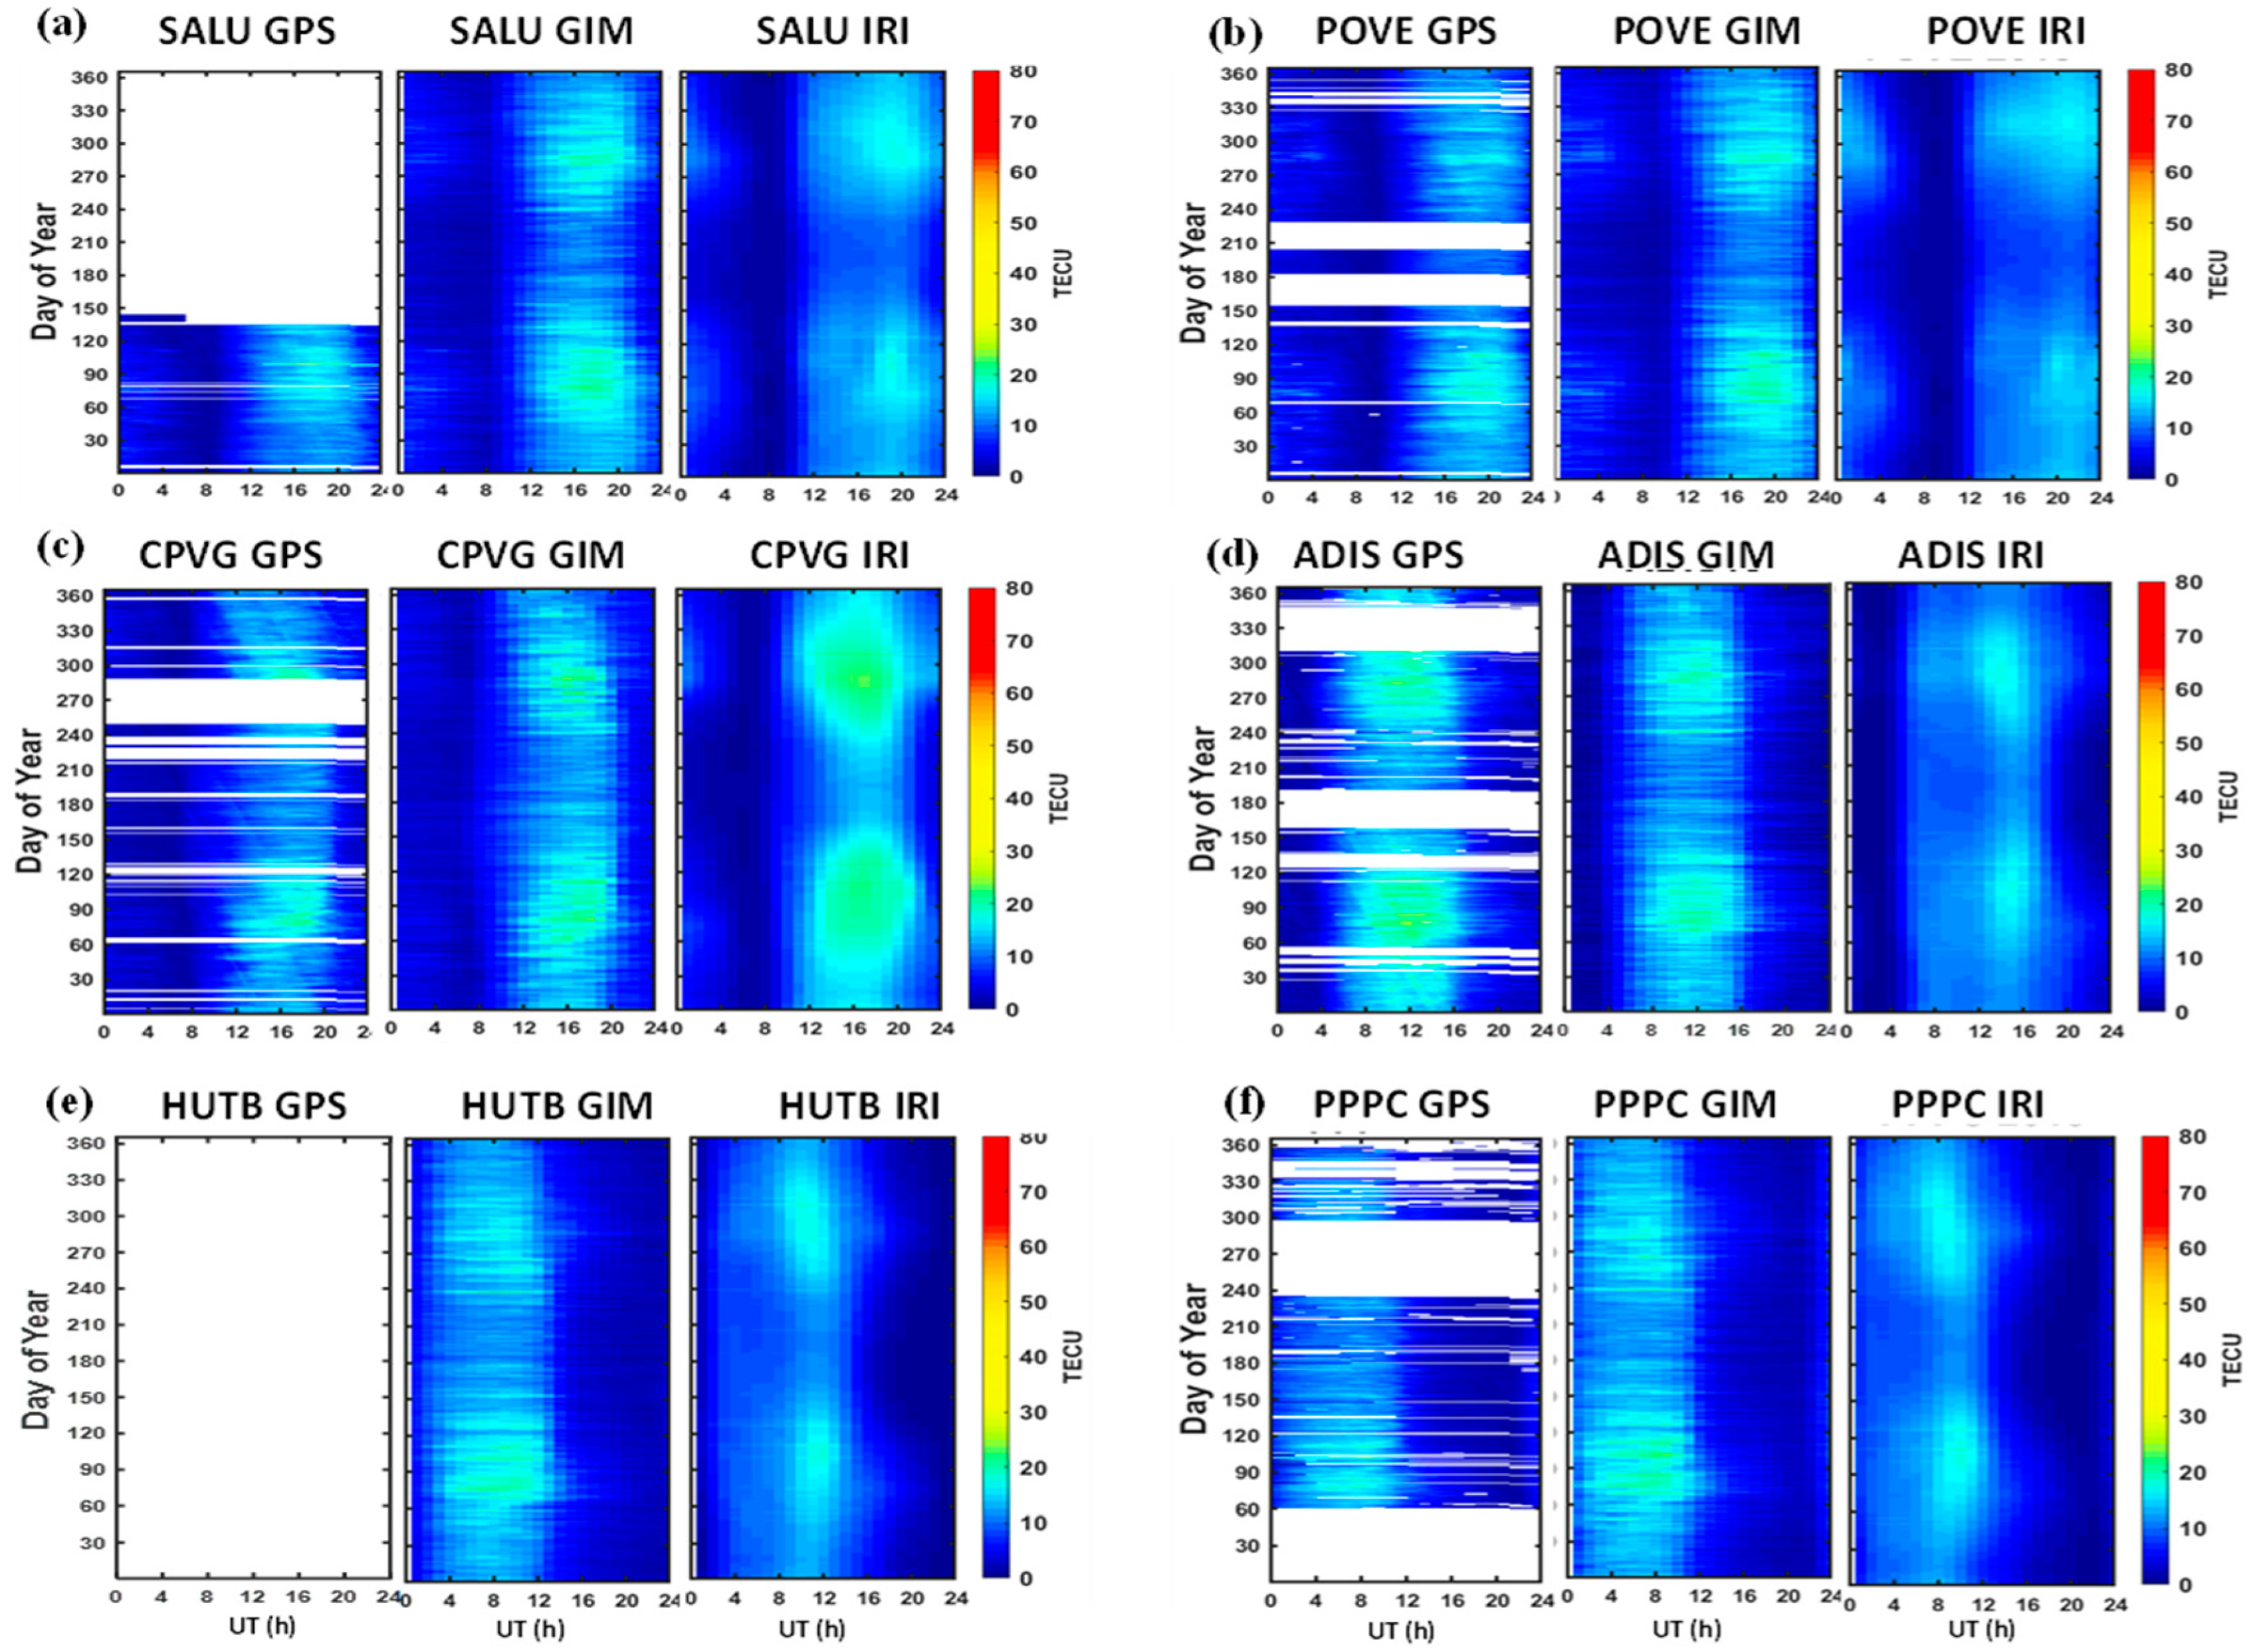
For the minimum phase year of 2018 in the American longitude, GPS-TEC presented data for more than 3 months at SALU (Figure 4a). Irrespective of the large sum of missing data at SALU, we were able to observe the diurnal trend of GPS-TEC in the American sector (Figure 4a,b). GPS-TEC increased from minimum values of about 1–3 TECU between 08:00 and 10:00 UT, corresponding to 05:00–07:00 LT at SALU and 04:00–06:00 LT at POVE, to maximum values of 10–14 TECU during post-noon hours with respect to UT at both stations before reducing to the minimum value afterwards. The diurnal variations of the GIM and IRI-2016 models also showed very similar diurnal trends to that of GPS-TEC, except that the IRI-2016 model values were lower than the GPS-TEC values at both stations and the GPS-TEC and GIM values were almost equal. In the African longitude (Figure 4c,d), GPS-TEC commenced rising from ~2–3 TECU between 02:00 and 04:00 UT (05:00–07:00 LT) at ADIS and between 07:00 and 08:00 UT (05:30–06:30 LT) at CPVG to maximum values between 10:00 and 16:00 UT, corresponding to 13:00–19:00 LT at ADIS (~28 TECU; Figure 4d) and 08:30–14:30 LT at CPVG (~18 TECU; Figure 4c), before further reducing to minimum values, as shown in Figure 4c,d.
The GIM showed a similar diurnal pattern to GPS-TEC, though with slightly lower values (23 TECU) at ADIS and slightly higher values (15 TECU) at CPVG. The IRI-2016 model values, which were observed to fade away at ADIS, were in contrasting, slightly higher than those of both GPS-TEC and GIM at CPVG. In the Asian longitude (Figure 4e,f), there were no GPS-TEC observation data at HUTB (Figure 4e), but at PPPC, GPS-TEC data were available for the majority of days. From the available data, the GPS-TEC, GIM and IRI-2016 models showed similar diurnal patterns, increasing from the minimum value of 0–2 TECU at 22:00 UT (06:00LT) to the maximum value of 10–16 TECU during the pre-sunrise hour with respect to UT before reducing to the minimum value during the post-sunset hour with respect to UT (Figure 4f). We decided to be silent on the diurnal variations of the GIM and IRI-2016 at HUTB (Figure 4e) because there were no GPS-TEC observation data throughout the year.
Finally, for the minimum phase year of 2019 (Figure 5a–e)) at the three longitudes used in this research, the GPS-TEC, GIM and IRI-2016 model values were seen to further reduce than the previous minimum phase year (i.e., 2018). The diurnal variations in the GPS-TEC, GIM and IRI-2016 models were very similar to the diurnal variations of the minimum phase year of 2018, though with slightly lower values. Unfortunately, there were no GPS-TEC observation values at SALU in the American longitude and HUTB in the Asian longitude, which made it difficult to evaluate the assessment of the GIM and IRI-2016 models on GPS-TEC. At POVE (Figure 5b) in the American longitude, the GPS-TEC, GIM and IRI-2016 models showed similar diurnal profiles, but the GIM showed slightly higher maximum values (~18–21 TECU) than GPS-TEC (~14–16 TECU) and IRI-2016 (~11–13 TECU). In the African longitude (Figure 5c,d), the GPS-TEC, GIM and IRI-2016 models showed similar diurnal trends, but at CPVG (Figure 5c), the IRI-2016 model was observed to show slightly higher maximum values (~22–28 TECU) than GPS-TEC values (~18 TECU) and GIM (~20 TECU). At ADIS (Figure 5d), GPS-TEC was observed to show the highest magnitude, followed by GIM, while the IRI-2016 model showed the least magnitude. Lastly, in the Asian longitude, GPS-TEC and GIM at PPPC (Figure 5f) were observed to show similar diurnal patterns that were slightly different than that of the IRI-2016 model. At PPPC, the diurnal magnitudes of the GPS-TEC, GIM and IRI-2016 models were less than 18 TECU from pre-sunrise to noon-time with respect to UT. However, at HUTB (Figure 5e), the values of the GIM and IRI-2016 models were shown to potentially be suitable to estimate the values of GPS-TEC, especially during the minimum phase, according to the consistent trend observed in this study.

3.2. Seasonal Variations

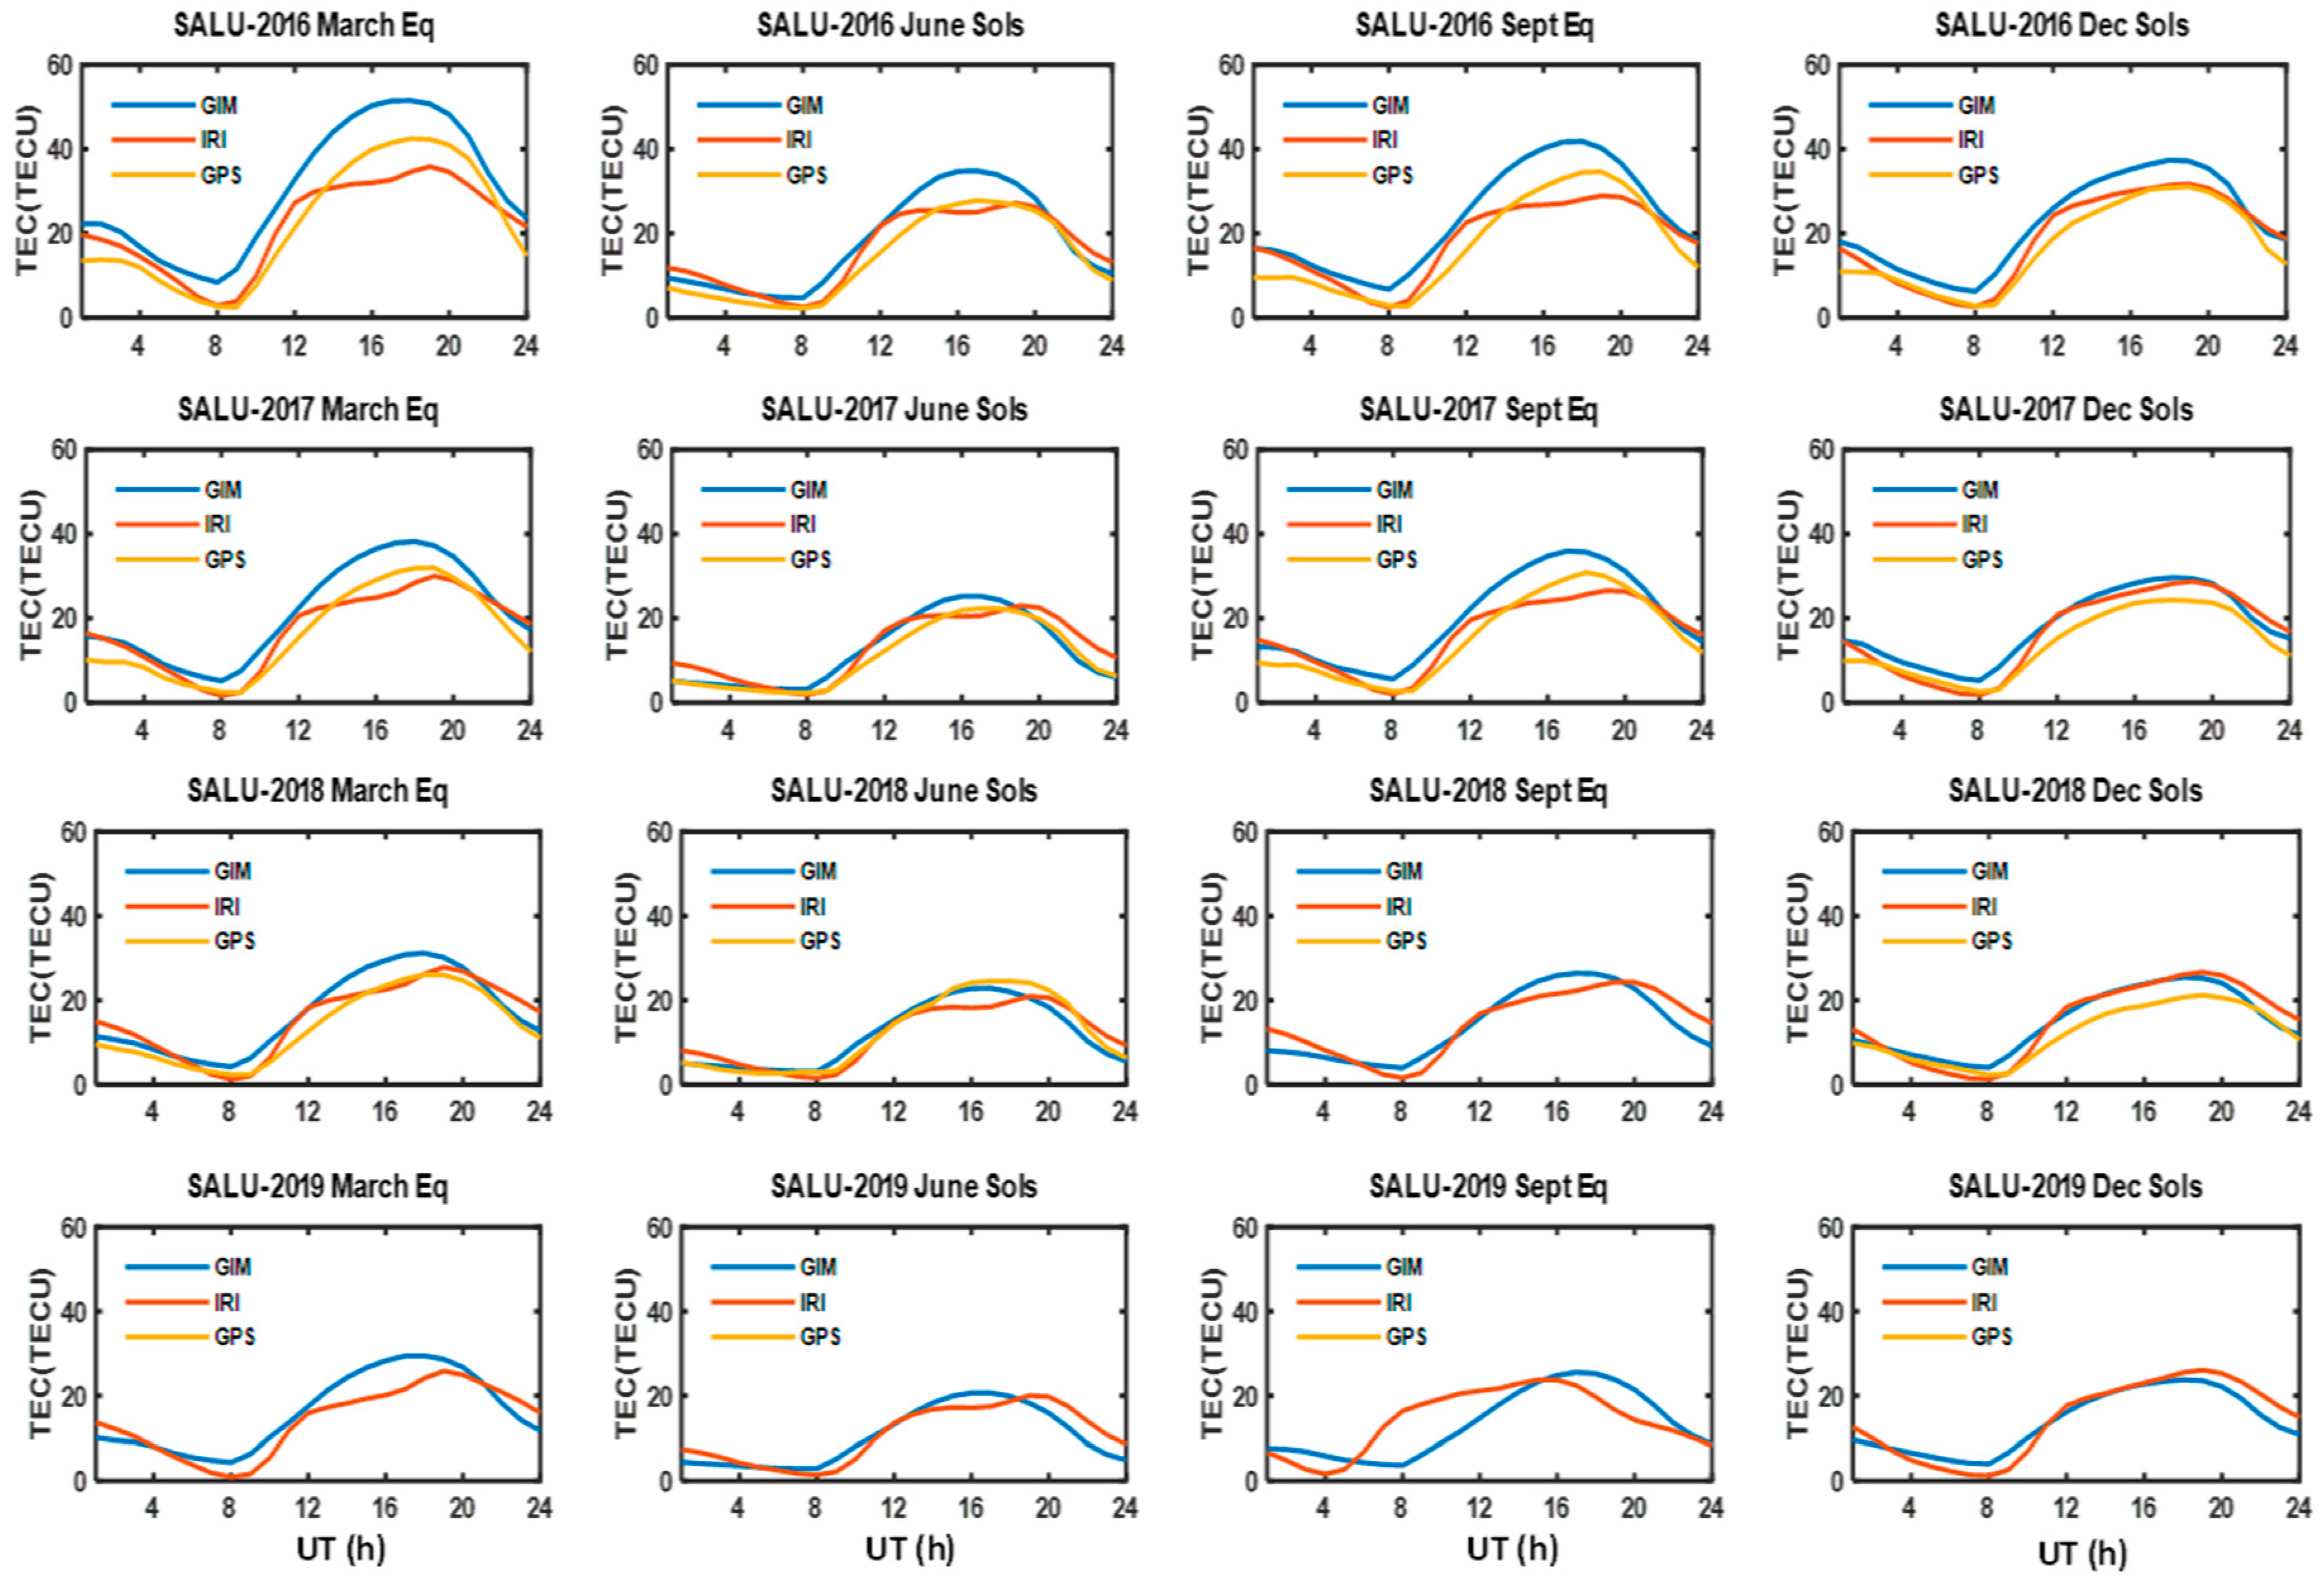
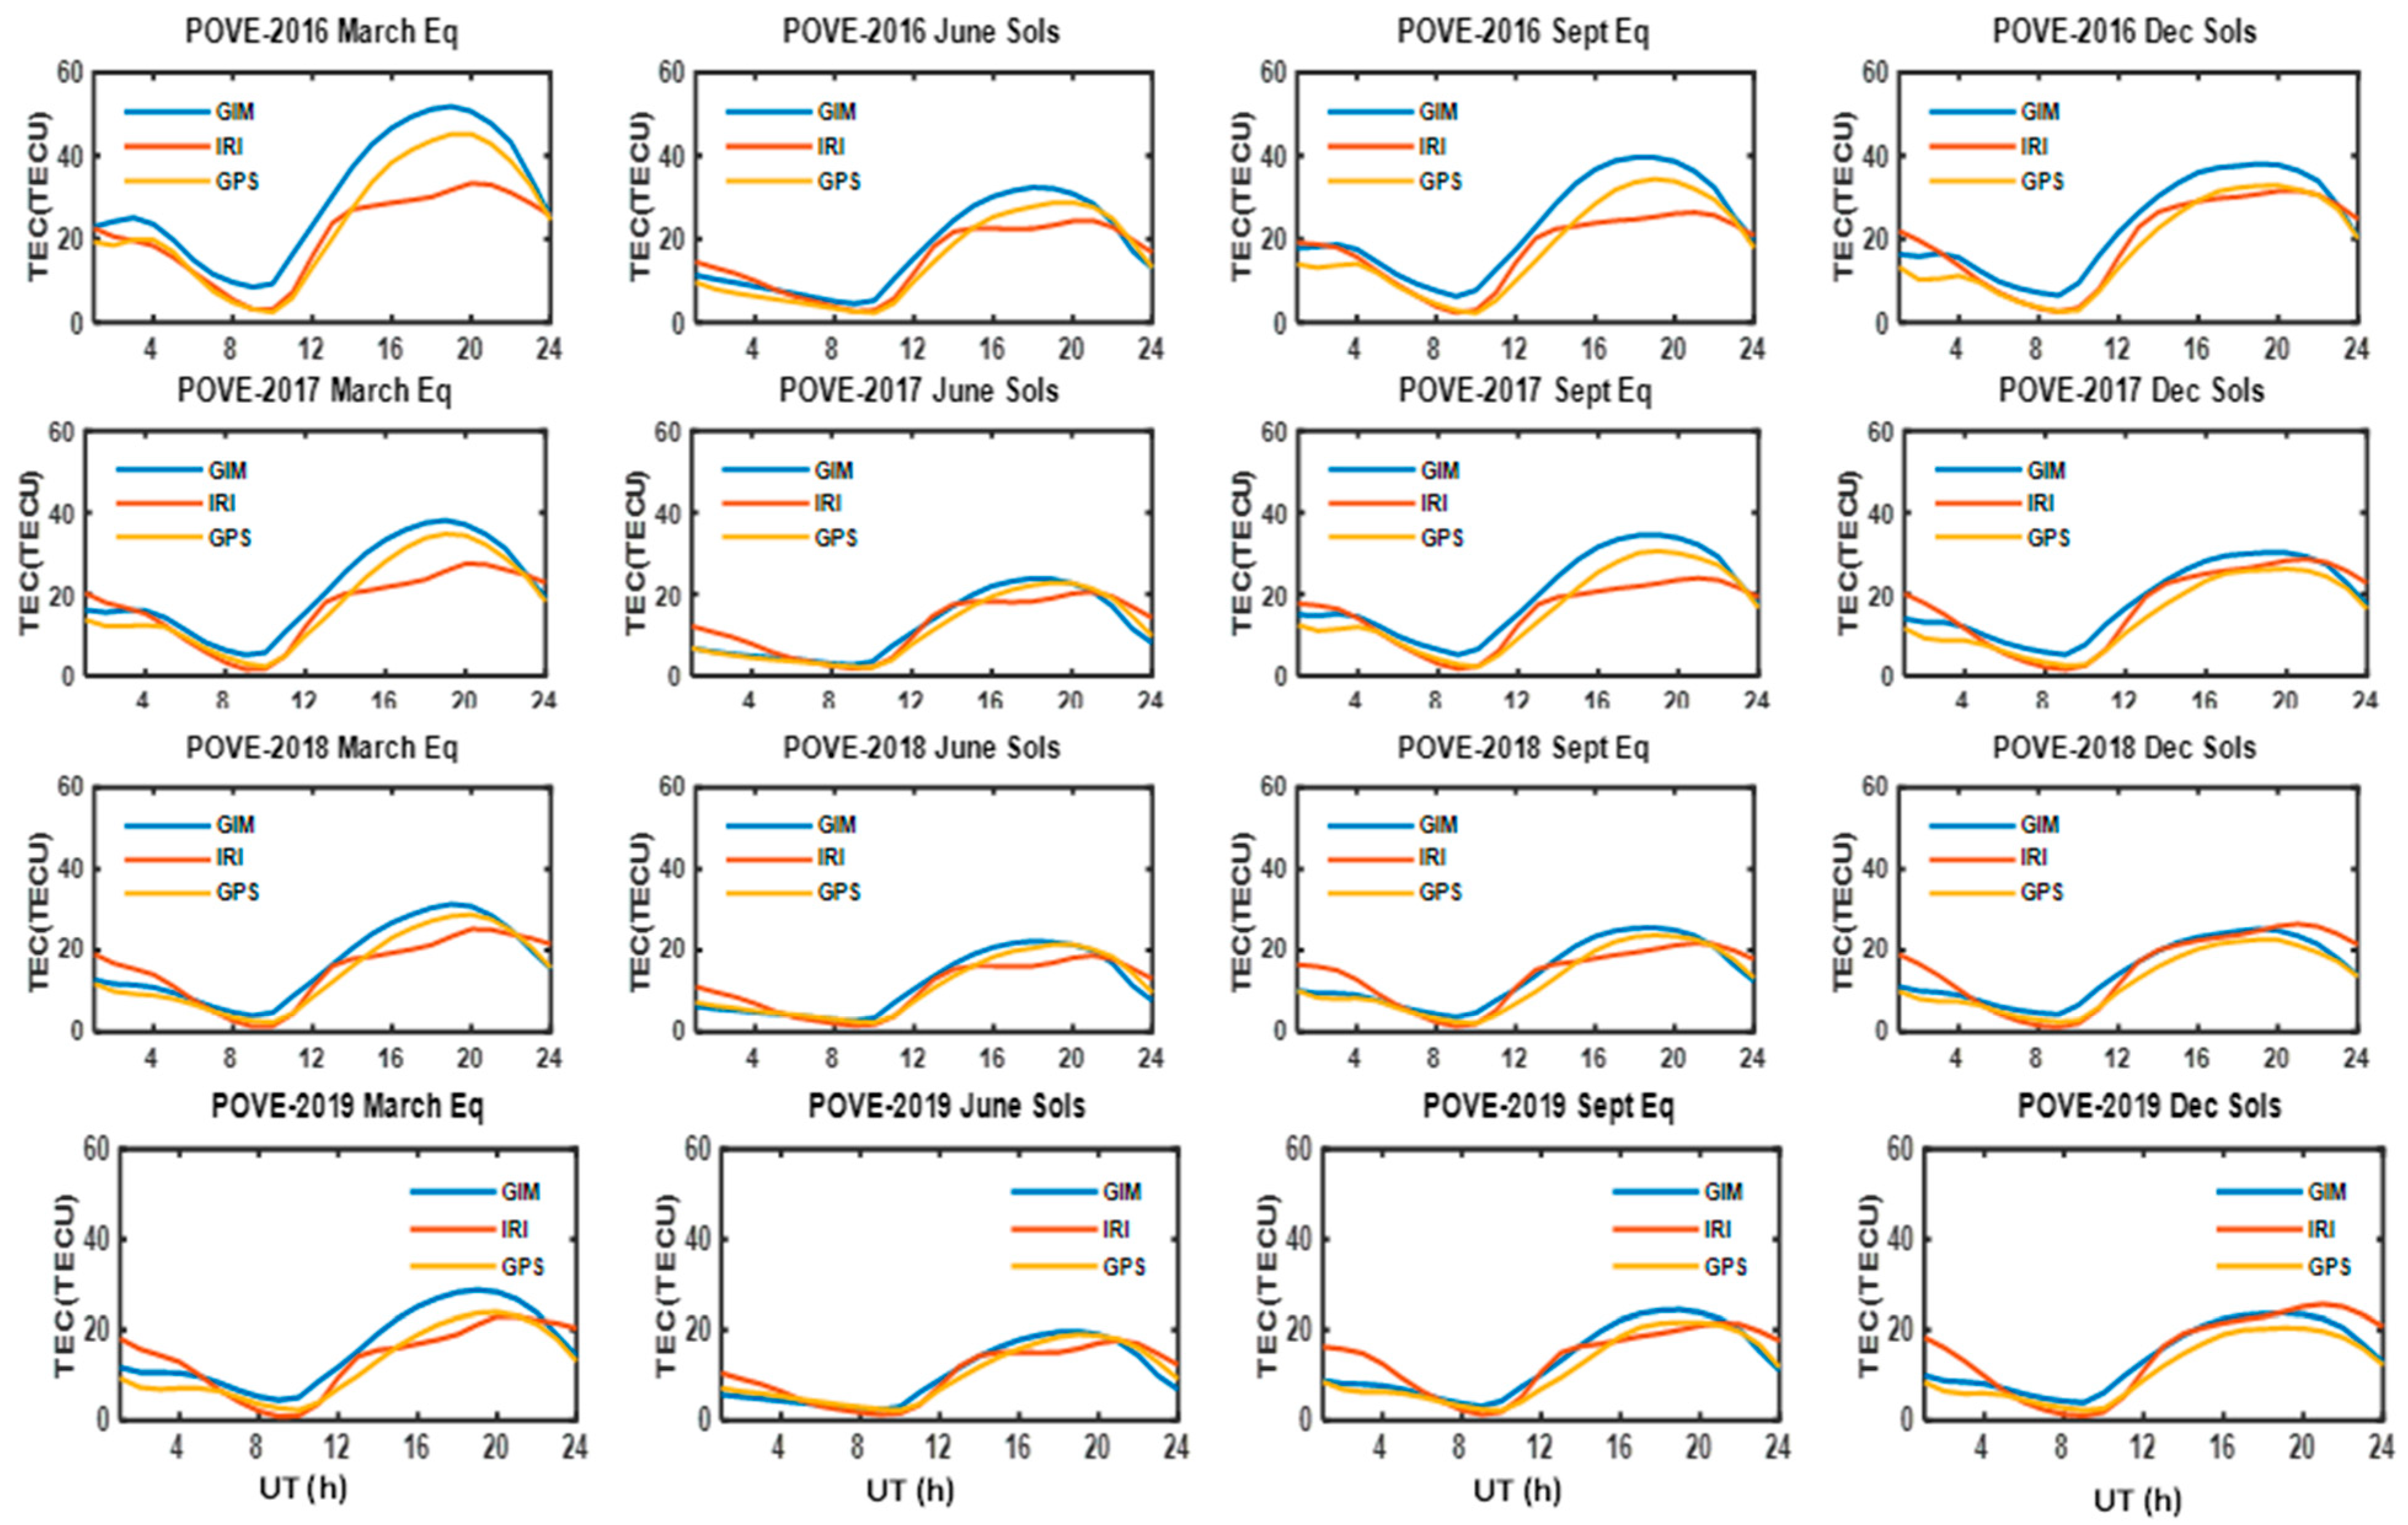
The plots for the seasonal variations in the GPS-TEC, GIM and IRI-2016 models for the descending phase years (2016–2017) and the minimum phase years (2018–2019) at SALU and POVE (American), CPVG and ADIS (African), and HUTB and PPPC (Asian) longitudes are shown in Figure 6, Figure 7, Figure 8, Figure 9, Figure 10 and Figure 11. Figure 6 and Figure 7 show the seasonal variations in the GPS-TEC, GIM and IRI-2016 models at SALU and POVE, respectively, during the descending phase (2016–2017) and the minimum phase (2018–2019) in the American longitude. At the American longitude, Figure 6 and Figure 7 show seasonal variations with higher values during the daytime than the nighttime with respect to the UT, as expected. At SALU, the seasonal variations showed semi-annual variations with higher magnitudes during the equinoxes than the solstices for both the descending and minimum phases. The seasonal profiles of GPS-TEC and GIM for all seasons were quite similar for both phases, showing a single peak that was shifted to 14:00–16:00 UT (11:00–13:00 LT). The IRI-2016 model showed a noontime bite-out profile with two unequal peaks during most seasons for both solar cycle phases, except for the September equinox and the December solstice, in which the noon bite-out profile appeared to be insignificant.
There were differences in the magnitudes of GPS-TEC and GIM that were more pronounced in the equinoxes during the descending phase (2016–2017) than in the minimum phase (2018–2019), except for the minimum phase year of 2019, in which GPS-TEC data were not available. Generally, for all seasons at SALU, GIM values were higher than those of both GPS-TEC and IRI-2016, except for the June solstice of the minimum phase year (2018), in which GPS-TEC and GIM values were in about the same range. Additionally, for the December solstice of the same year, the values of the GIM and IRI-2016 were almost equal. The maximum range of the GIM during the equinoxes of the descending phase (32–52 TECU) was higher than the maximum range of the GIM during the equinoxes of the minimum phase (21–32 TECU). The maximum value of GPS-TEC for both the descending and minimum phases during the equinoxes was between 29 and 43 TECU. The maximum value of the IRI-2016 model for both the minimum and maximum phases during the equinoxes was between 23 and 32 TECU. Although both the GIM and IRI-2016 assessments of GPS-TEC were poor, the GIM assessment looked better than that of IRI-2016. At POVE, the seasonal variations in GPS-TEC, GIM and IRI-2016 were very similar to the seasonal variations at SALU, showing similar seasonal profile shapes and magnitudes. In addition, the GIM assessment of GPS-TEC looked better than that of IRI-2016.
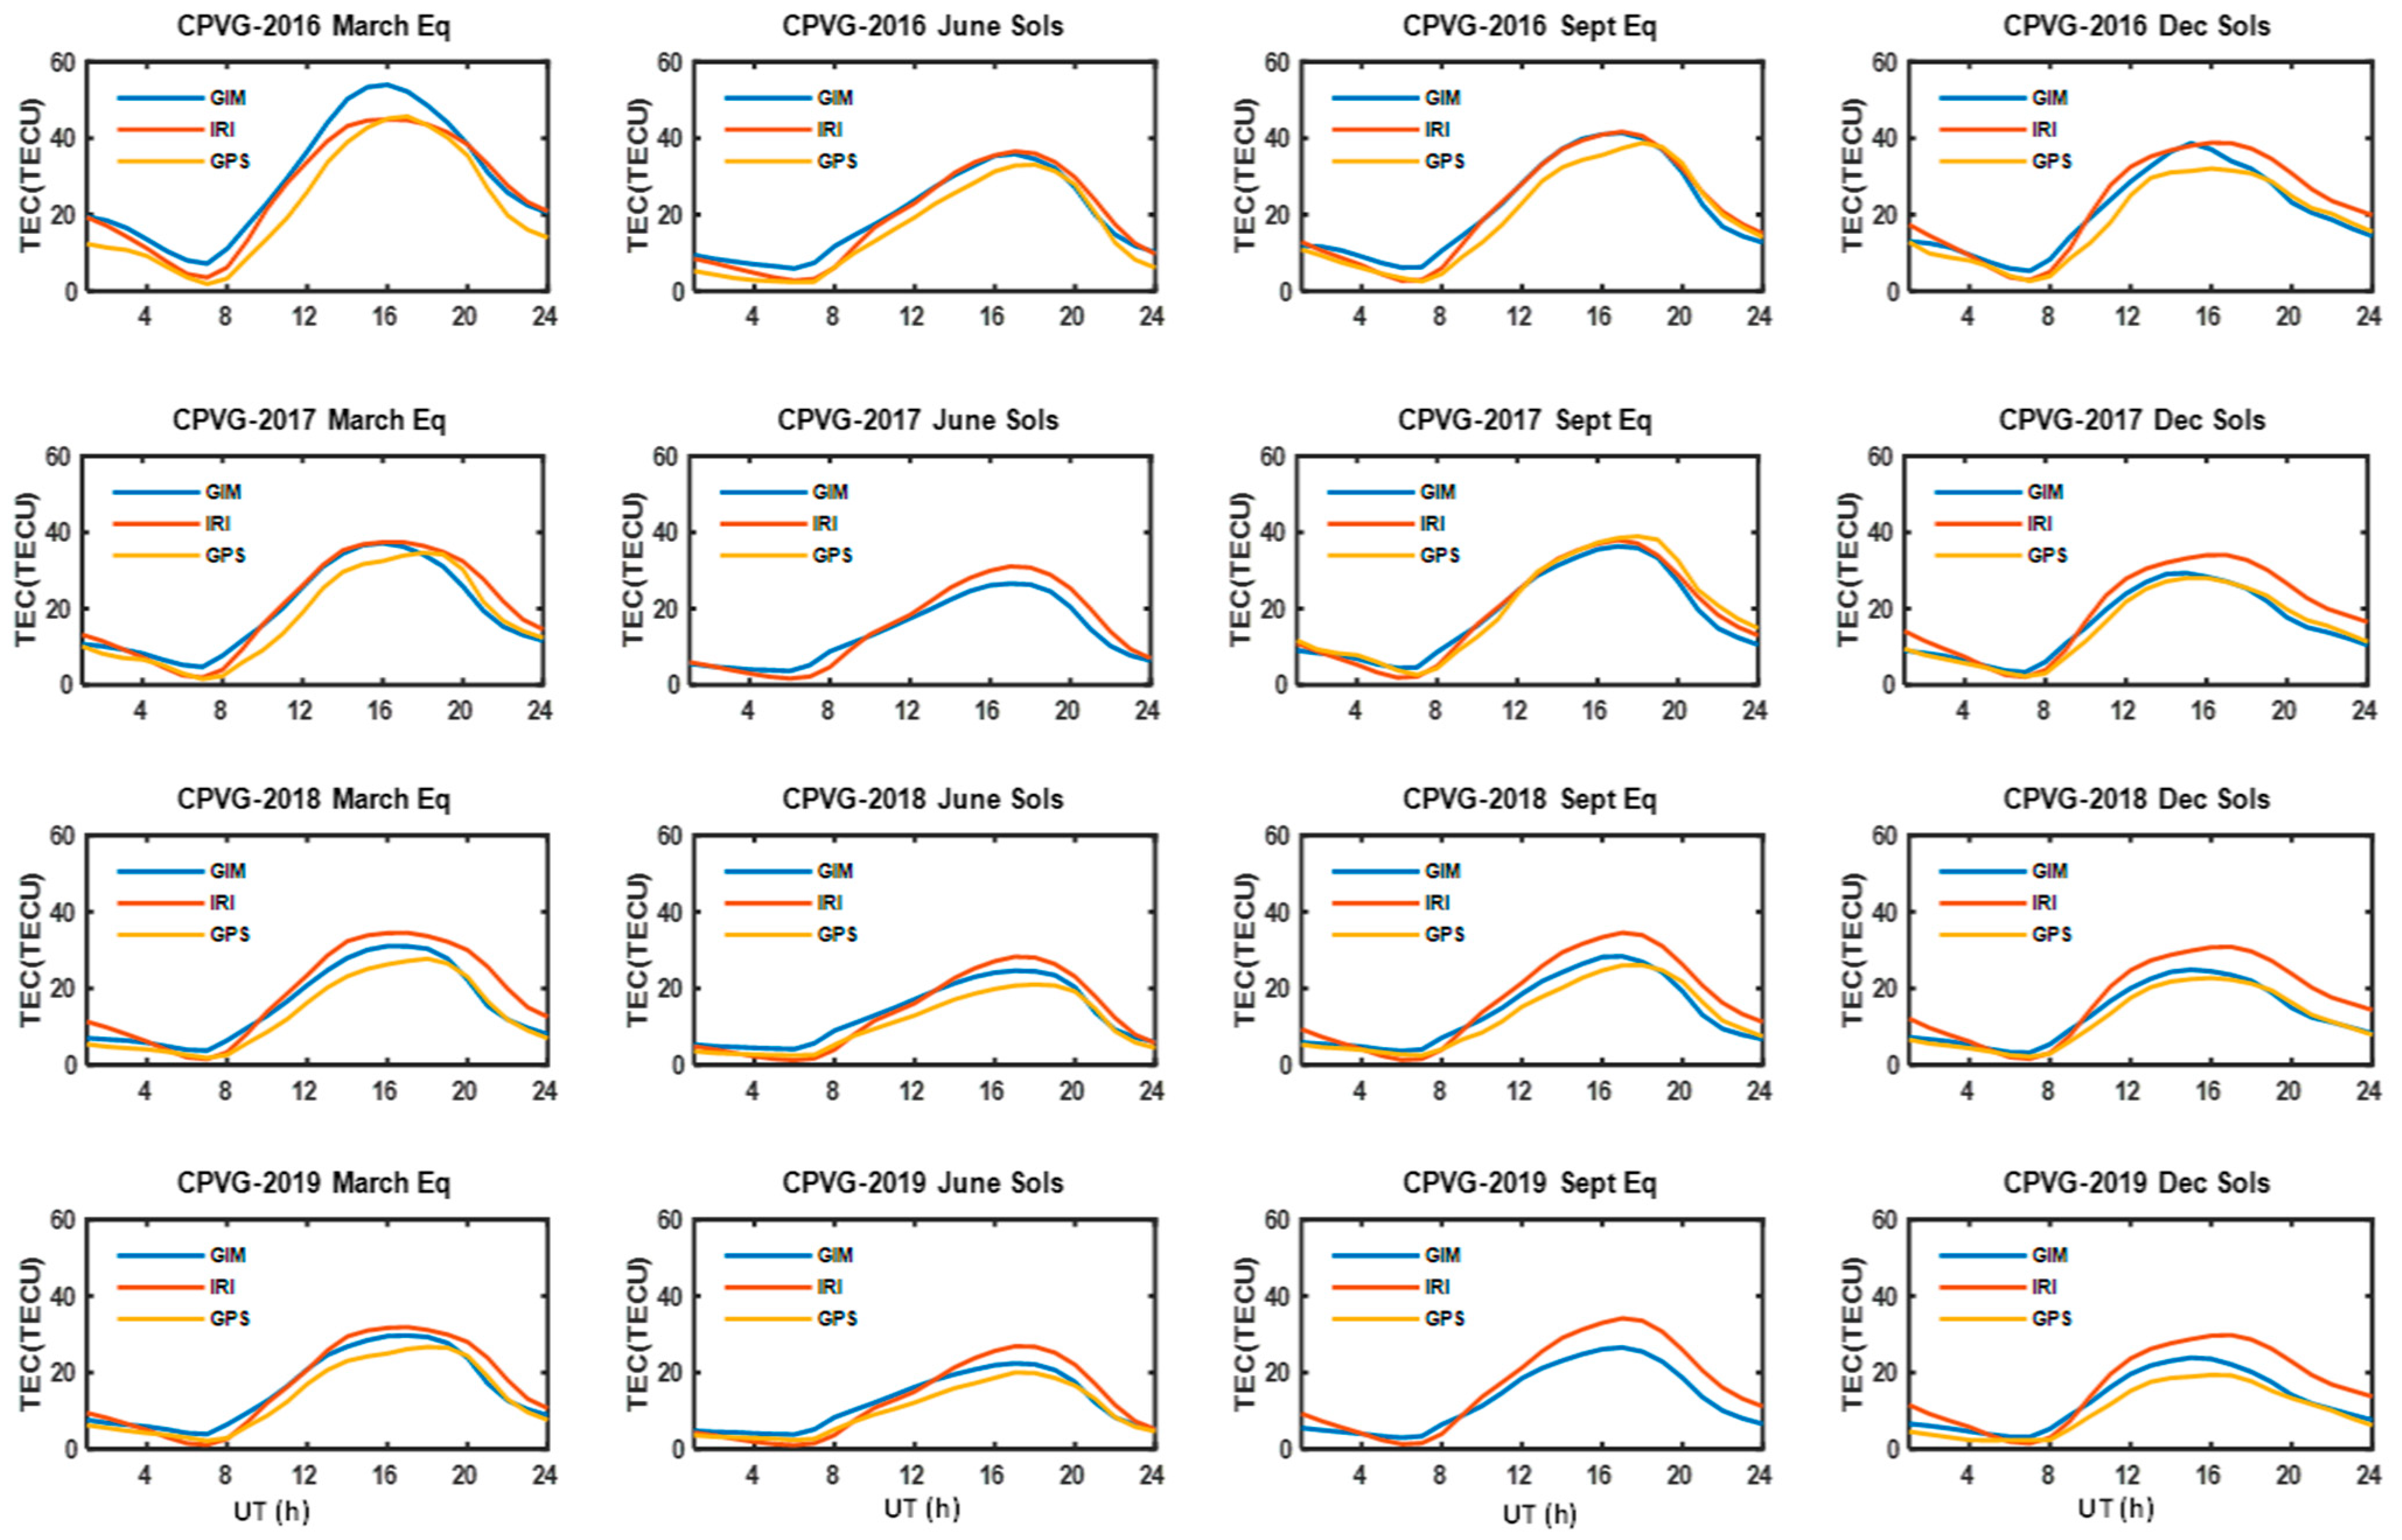
In the African longitude, during the descending phase (2016–2017) at CPVG (Figure 8), seasonal variations in GPS-TEC, GIM and IRI-2016 showed semi-annual variations, with higher values during the equinoxes than the solstices. Meanwhile, during the minimum phase (2018–2019) depicted in the Figure 8, the seasonal variations in GPS-TEC, GIM and IRI-2016 showed slightly higher values during the March equinox than the September equinox and the solstices. The differences in the semi-annual variations in the GPS-TEC, GIM and IRI-2016 models were more pronounced during the daytime between 08:00 and 18:00 UT (06:30–16:30 LT) than during the nighttime between 20:00 and 06:00 UT (18:30–04:30 LT). This shows that day-to-day variations in TEC were higher during the daytime than the nighttime. The ranges of the semi-annual variations in GPS-TEC were higher during the equinoxes (28–48 TECU) than the solstices (20–32 TECU). The semi-annual variations of the GIM and IRI-2016 models also followed a similar trend to that of GPS-TEC. The semi-annual variations of the GIM during the equinoxes and solstices were between 26 and 55 TECU and between 22 and 33 TECU, respectively. The semi-annual variations of IRI-2016 during the equinoxes were found to be higher (28–47 TECU) than during the solstices (20–39 TECU). It is equally important to mention that the highest values of the seasonal variations in GPS-TEC, GIM and IRI-2016 mostly occurred during the March equinox, while their lowest values mostly occurred during the June solstice.
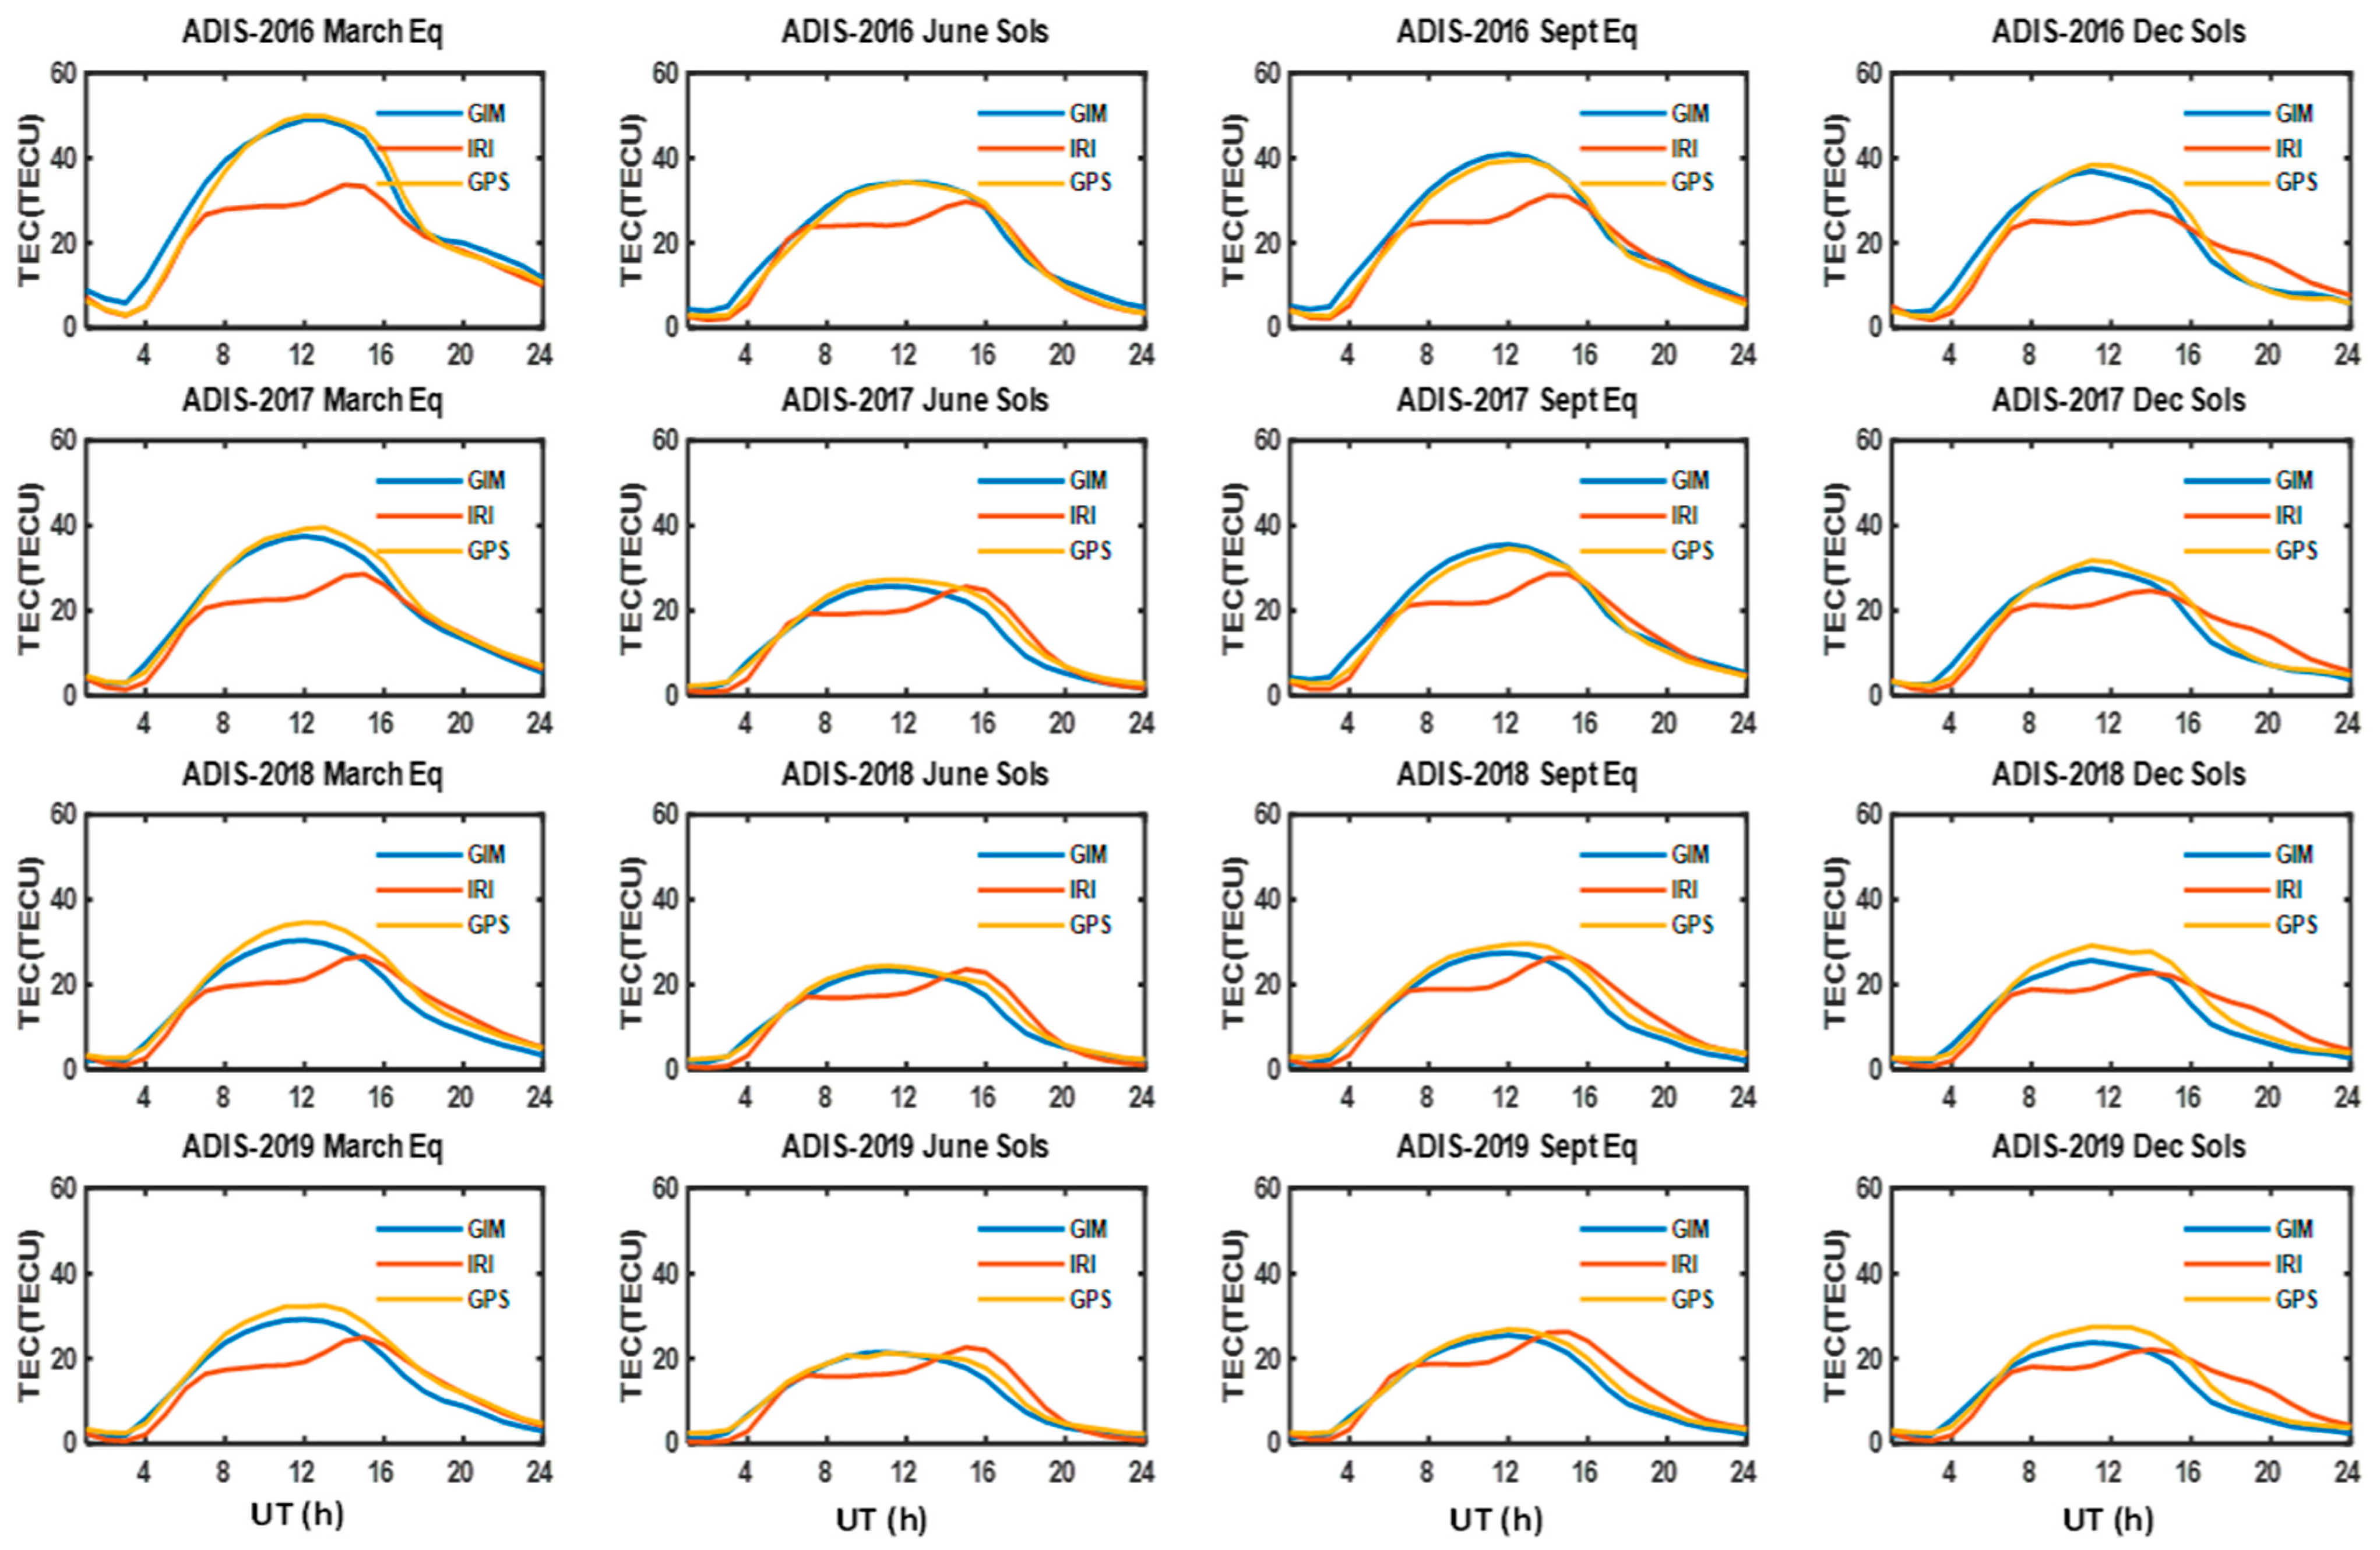
At ADIS (Figure 9), seasonal variations showed decreases in the GPS-TEC, GIM and IRI-2016 models during all seasons from the descending to the minimum phase of solar cycle 24. We observed semi-annual variations showing higher values of the GPS-TEC, GIM and IRI-2016 models during the equinoxes than the solstices, as expected. In the semi-annual variations in GPS-TEC and GIM, which were in about the same range, the maximum values (~52 TECU) occurred during the March equinox for the descending the phase year of 2016. The lowest values of GPS-TEC and GIM (~20 TECU) were observed in the June solstice during the minimum phase year of 2019. Semi-annual variations in ionospheric parameters, which comprise a peculiar feature in the equatorial and low-latitude ionospheres, have been widely reported in the past [51]. The shapes of GPS-TEC, GIM and IRI-2016 are further very important features. While the shapes of GPS-TEC and GIM showed a single peak during the daytime, especially during the equinoxes, the peaks of GPS-TEC and GIM were slightly wider (plateau-like) during the June solstice than the other three seasons. The difference in peak size during the June solstice, showing wider peaks, may be attributed to the dominant oxygen/nitrogen (O/N2) ratio during the June season [7]. On the other hand, the shape of IRI-2016 showed a typical noon bite-out profile, with a higher post-noon than pre-noon peak during the four seasons with respect to the UT scale. Another observation is that at CPVG, the GPS-TEC, GIM and IRI-2016 models showed a single peak that was shifted to LT post-noon periods (14:00–17:00 LT) during both phases of the solar cycle. These results are in contrast with the shape of the peak of IRI-2016 at ADIS, which showed a noon bite-out curve. Lastly, the seasonal variations at both stations in the African longitude showed the absence of the nighttime enhancement of TEC, except at the station along the GE (ADIS). These results were in contrast to the results of Olwendo et al. [43], who reported nighttime enhancement at stations away from the dip equator. In their investigation of TEC variations over the magnetic equator, Oryema et al. [41] also reported the nighttime enhancement of TEC during the equinoxes at ADIS. In this study, nighttime enhancement could only be observed during the post-sunset hour (18:00–22:00 UT), corresponding to 21:00–01:00 LT of the March equinox and the December solstice for the descending phase year of 2016 (Figure 9) at ADIS. This feature has been widely reported at equatorial and low latitudes [51].
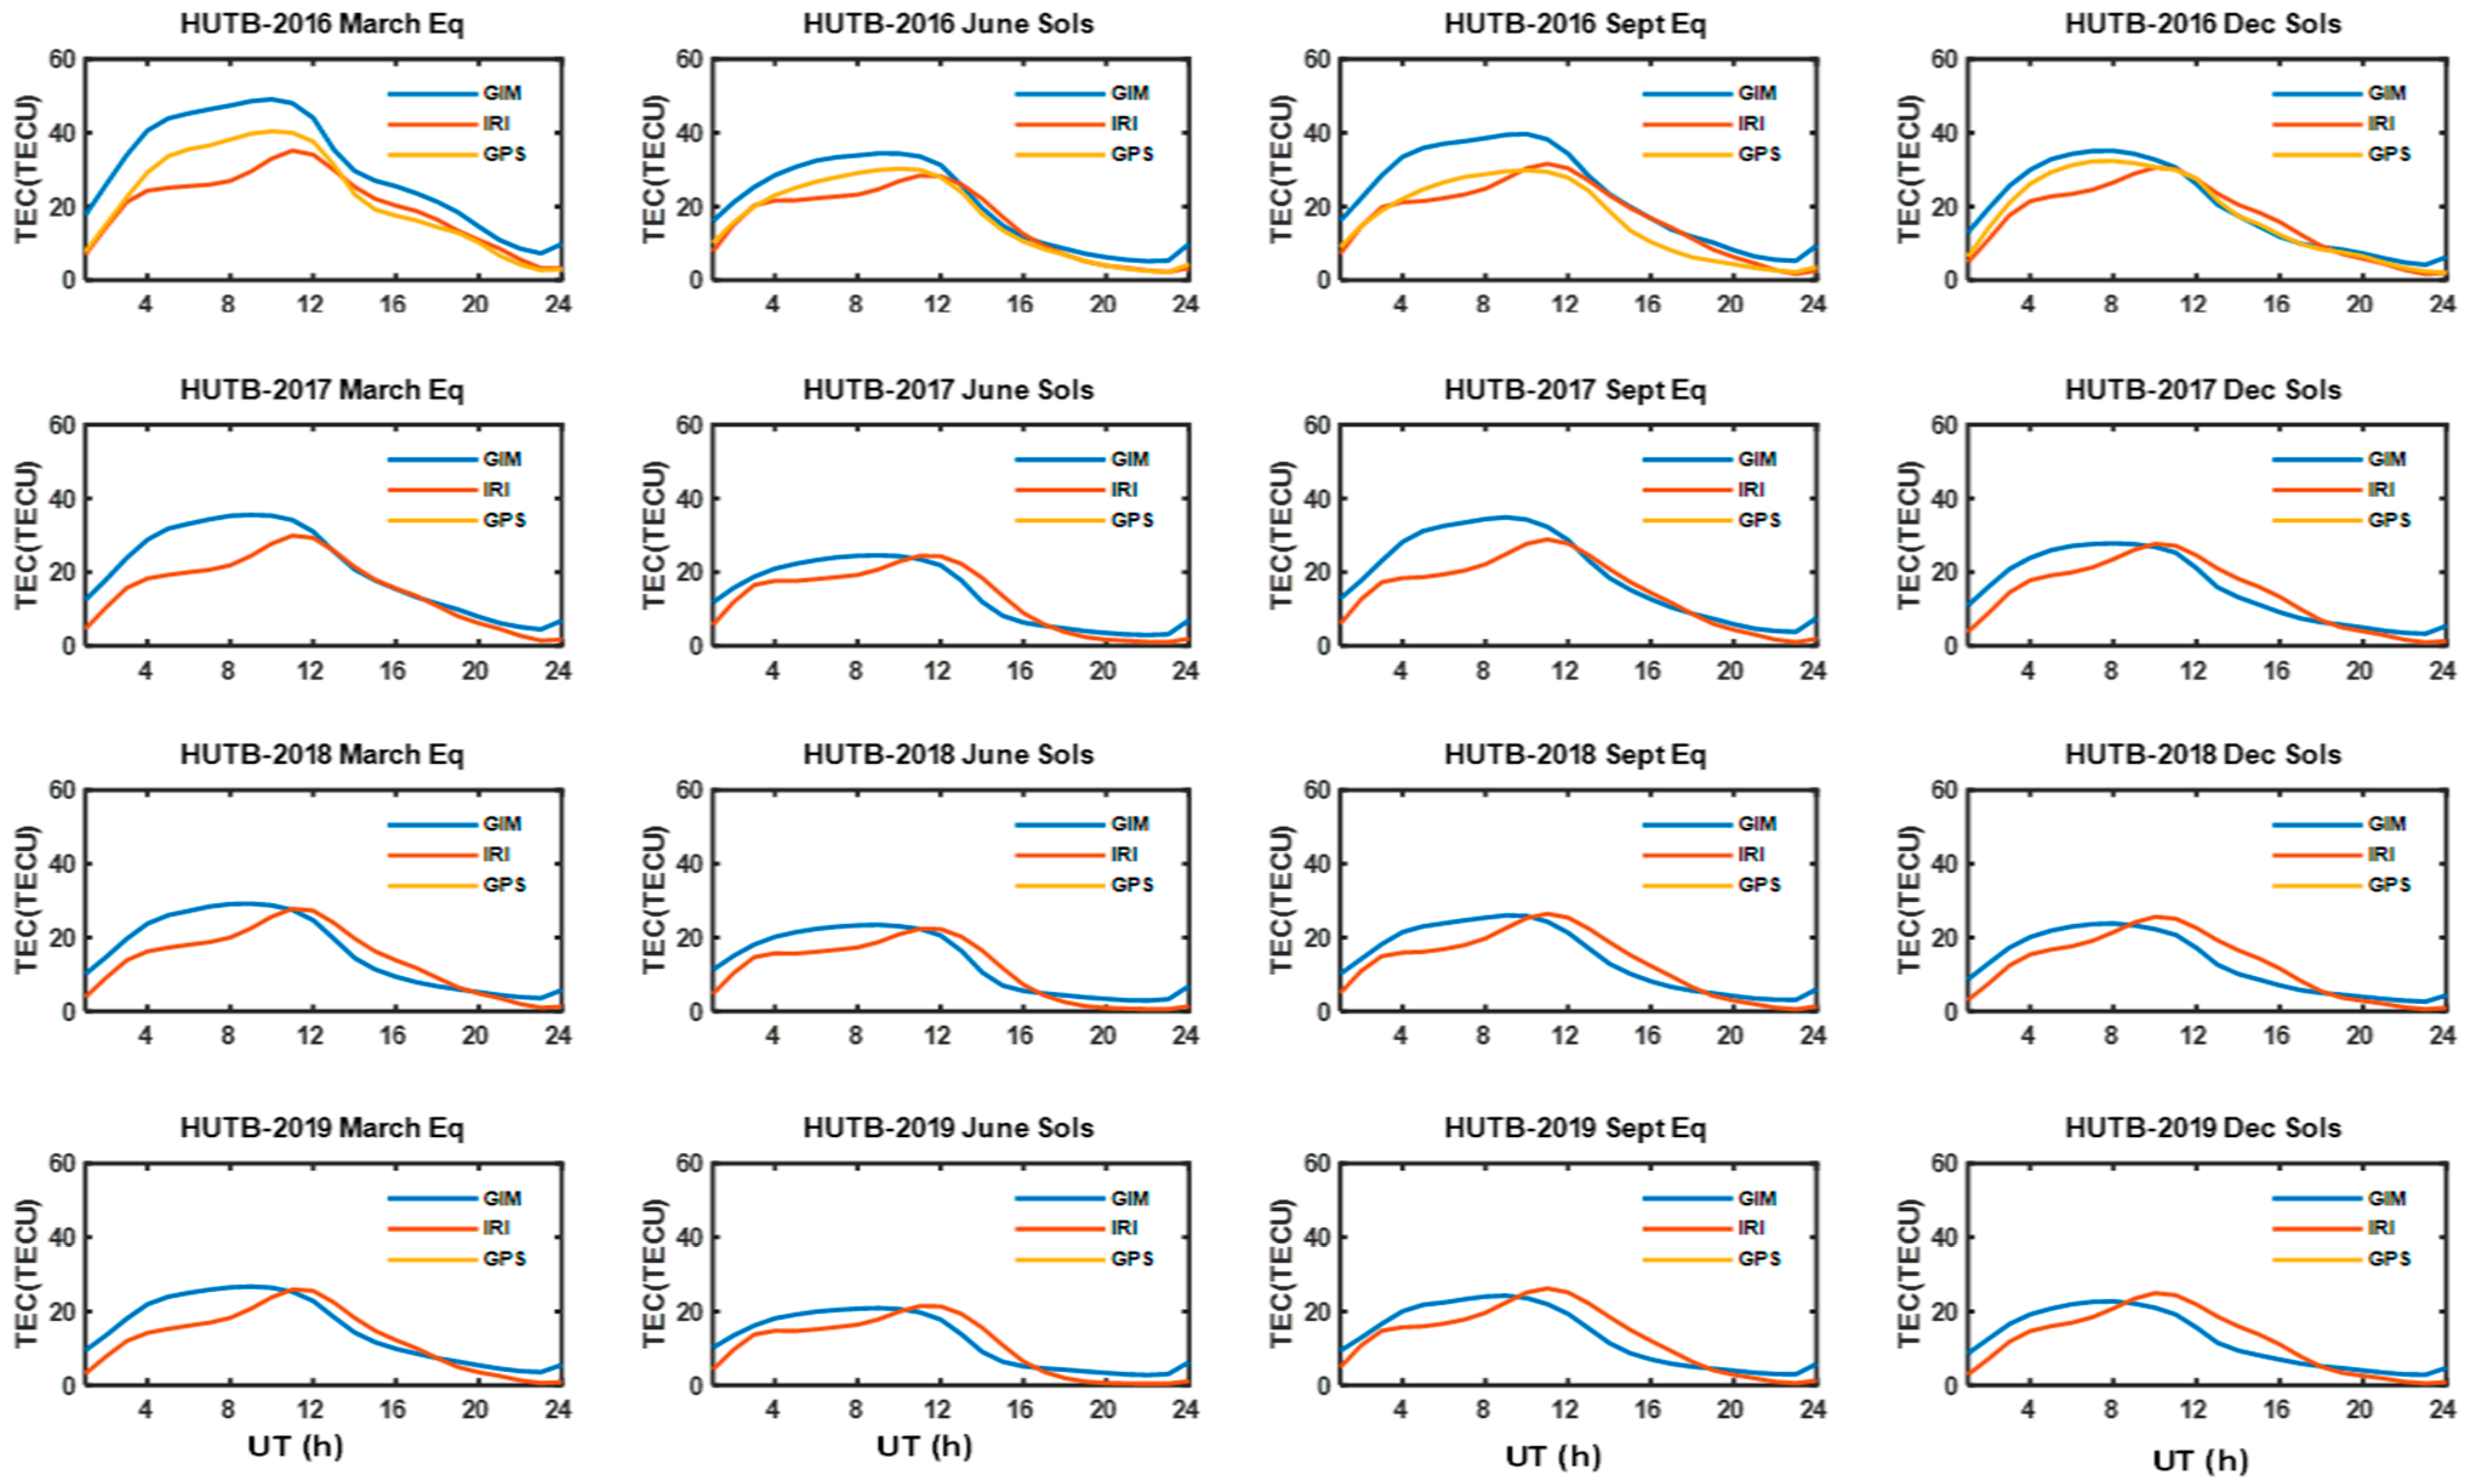
In the Asian longitude at HUTB (Figure 10), GPS-TEC values were only available during the descending phase year of 2016, making it difficult to follow the trend of GPS-TEC in comparison with GIM and IRI-2016. However, according to the available data, the seasonal profiles of the GPS-TEC, GIM and IRI-2016 models at HUTB were very similar to the seasonal profiles of the GPS-TEC, GIM and IRI-2016 models at PPPC for the descending phase year of 2016, though with slightly lower values. During the descending phase year of 2017 and the minimum phase (2018–2019), in which GPS-TEC values were not available, it was possible to estimate GPS-TEC values from the averages of GIM and IRI-2016 following the consistencies in the data used in this research. At PPPC (Figure 11), seasonal variations in the GPS-TEC, GIM and IRI-2016 models also showed semi-annual variations, with higher values during the equinoxes than the solstices for the descending and minimum phases, except for GPS-TEC values, in which the December solstice values were a little higher than the September equinox values. The shapes of GPS-TEC, GIM and IRI-2016 followed similar patterns, showing higher values during pre-sunrise to noon-time than the rest of the hours of the day with respect to UT during both phases. Additionally, the peaks of GPS-TEC, GIM and IRI-2016 occurred during the pre-noon hours with respect to UT during both phases. However, IRI-2016 was observed to show two pre-noon peaks with respect to UT. The GIM values were observed to be higher during most seasons for both phases. The maximum GIM values (37–52 TECU) during the equinoxes for the descending phase were higher than the maximum GIM values (24–32 TECU) during the equinoxes for the minimum phase. This was followed by the maximum range of the GPS-TEC values (22–43 TECU) during the equinoxes for the descending phase, which was also higher than their maximum values for the minimum phase (19–28 TECU). Lastly, the maximum values of IRI-2016 during the equinoxes for the descending phase (28–35 TECU) were higher than their maximum values for the minimum phase (25–27 TECU). At PPPC, the GIM assessment of GPS-TEC can be assumed to be weaker than IRI-2016 model predictions, since there were observed over-estimations at most hours for all seasons, especially for the descending phase of the solar cycle.

3.3. RMSE Estimation

Table 2 shows the RMSE values between GPS-TEC and GIM, while Table 3 shows the RMSE values between the GPS-TEC and IRI-2016 models for the descending and minimum phases in the American, African and Asian longitudes. The RMSE is a statistical tool used to ascertain the level of accuracy of different models compared with observed measurements. Hence, in the error analysis, GPS-TEC values were set as the reference for comparison with the GIM and IRI-2016 models. In the American longitude, RMSE values between GPS-TEC and GIM (Table 2) and between GPS-TEC and IRI-2016 (Table 3) were generally the highest during the March equinox of the descending phase year of 2016 and the lowest during the June solstice of the minimum phase year of 2019. In the African longitude, the same RMSE behavior was observed at ADIS. The RMSE at CPVG was generally higher during all seasons than the RMSE obtained at ADIS. At CPVG, the RMSE between GPS-TEC and GIM showed the highest value during the March equinox (7.39) of the descending phase year of 2016, while the lowest value was recorded during the December solstice (1.75) of the minimum phase year of 2018. The RMSE between GPS-TEC and IRI-2016 at CPVG showed the highest value during the December solstice (7.34) of the minimum phase year of 2019, while the lowest RMSE values were recorded during the September equinox (2.01) of the descending phase year of 2017. Lastly, in the Asian longitude (PPPC), the highest RMSE between GPS-TEC and GIM was record during the September equinox (13.42) of the descending phase year of 2016, while the lowest RMSE value was recorded during the June solstice (2.01) of the minimum phase year of 2019. The RMSE between GPS-TEC and IRI-2016 was also the highest during the September equinox (6.64) of the descending phase year of 2016, while the lowest RMSE was observed during the December solstice (1.69) of the descending phase year of 2017.

3.4. Longitudinal Variations

Figure 2, Figure 3, Figure 4 and Figure 5a–f also demonstrate the universal time (UT) effect and the influence of the geomagnetic field lines on the longitudinal variations in the GPS-TEC, GIM and IRI-2016 models during the descending and minimum phases in the American, African and Asian longitudes. In this study, longitudinal variations were observed to mostly show LT with respect to universal time, seasonal, and solar cycle effects. The proximity of a station to the magnetic equator was also found to play a major role in TEC variations. During the descending phase (2016–2017), GPS-TEC showed higher magnitudes in the African longitude, followed by the American longitude and, finally, the Asian longitude, for stations lying along the geomagnetic equator (GE) and slightly away from the GE. For stations located along the GE, GIM values were observed to be highest at the American longitude, followed by the Asian longitude and least in the African longitude, but for stations slightly away from the GE, GIM values were observed to be higher in the African longitude than both the American and Asian longitudes. Though IRI-2016 showed higher values at the African and Asian longitudes than the American longitude for stations located along the GE, for stations away from the GE, IRI-2016 model values were higher in the African longitude than both the American and Asian longitudes in nearly the same range. During the minimum phase years (2018–2019), GPS-TEC values were higher in the African longitude than the American and Asian longitudes for stations along the GE and stations away from the GE, although SALU in the American longitude and HUTB in the Asian longitude (stations away from the GE) did not present GPS-TEC data. The GIM values were at about the same range at the three longitudes for the stations along the GE and stations away from the GE, while IRI-2016 model values were highest at the station away from the GE in the African longitude and lowest at the station along the GE in the American longitude.
During the descending and minimum phases, we observed LT with respect to universal time effects of longitudinal variations in GPS-TEC, GIM and IRI-2016 within the equatorial ionosphere. It was necessary to harmonize the time frame of observation to the universal time (UT) scale in order to show TEC variations at the three longitudes. The result of the UT with respect to the LT effect was peak shifting in the African, American and Asian longitudes to LT hours between 10:00 and 18:00 LT. Longitudinal variations in plasmaspheric TEC were investigated by Zhong et al. [42], who reported significant longitudinal variations that may be similar to the longitudinal variations observed in GPS-TEC but different from the longitudinal variations in electron densities at the F2 peak. The universal time with respect to the LT effects of the longitudinal variations of ionospheric parameters such as TEC are strongly related to the solar zenith angle, which is linked to the rotation of the Earth around its axis. The seasonal effects of the longitudinal variations during the descending and minimum phases are better observed in Figure 6, Figure 7, Figure 8, Figure 9, Figure 10 and Figure 11. On a general note, GPS-TEC, GIM and IRI-2016 during the descending and minimum phases showed semi-annual variations, i.e., higher magnitudes during the equinoxes than the solstices at the three longitudes, although, in some cases, the September equinox and December solstice magnitudes were at about the same range at the three longitudes. Hence, the seasonal effects at the three longitudes for both stations along the GE and stations away from the GE were quite similar. However, the GPS-TEC, GIM and IRI-2016 values were generally highest during the March equinox and lowest during the June solstice at the three longitudes. In the American longitude (Figure 6 and Figure 7), the GPS-TEC (22–24 TECU) and GIM (25–27 TECU) values were at about the same range during the September equinox and the December solstice, apart from the fact that their peaks appeared to be slightly broader during the December solstice than the September equinox. Contrastingly, the IRI-2016 model values were higher during the December solstice (2–31 TECU) than the September equinox. We also noticed unequal magnitudes of GPS-TEC, GIM and IRI-2016 during the March and September equinoxes at the three longitudes, which is known as equinoctial asymmetry. This asymmetry is an unusual ionospheric phenomenon because the solar zenith angles in the March equinox and the September equinox are expected to be equal [52,53]. There were not many differences in the seasonal effects at the other two longitudinal regions (African and Asian), apart from the arrival time of their peak values and the nighttime enhancement in the GPS-TEC, GIM and IRI-2016 models observed in the station along the GE in the African longitude (ADIS) during the March equinox and the December solstice for the descending phase year of 2016. The nighttime enhancement of TEC is mainly controlled by the pre-reversal enhancement (PRE) of the zonal electric field above the magnetic equator near the local dusk terminator, which develops vertical ion drift and therefore impacts the generalized Rayleigh–Taylor instabilities (RTIs). An RTI is considered to be mechanism of the occurrence and development of equatorial plasma bubbles (EPBs) at equatorial anomaly regions [7,27,41,51].

4. Discussion

The F2 layer of the ionosphere is very useful for radio wave propagation, communication, and navigation, as well as other relevant purposes, and it also poses some degrees of danger to highly dynamic technological systems, as mentioned in Section 1. The region near the F2 peak height of the ionosphere is usually a subject of major concern because of the large number of electron densities it contains. However, above the F2 layer height, where the topside ionosphere–plasmasphere is positioned, the various physical processes dominating this region (which are quite complicated and difficult to understand) are sometimes different from the processes controlling the bottom-side ionospheric region [42,54]. Hence, there is an urgent need for additional studies on the topside ionosphere–plasmasphere for more understanding of the physical processes associated with this region.
The results from this research reveal a clear solar cycle effect on TEC, showing higher TEC values during the descending phase (2016–2017) than the minimum phase (2018–2019) at the three longitudes. Solar activity indicates the intensity of X-rays and extreme ultraviolet (EUV) radiations from the Sun. The variations of these solar electromagnetic radiations cause enormous variations in temperature, neutral wind, electric field, and ion and electron densities in the ionosphere [7,25,55,56,57]. The diurnal variations in GPS-TEC, GIM and IRI-2016 were observed to show similar features at each longitude, except in the African longitude, where GPS-TEC, GIM and IRI-2016 were observed to show unique features at the station away from the GE (CPVG). At CPVG, the peaks of the GPS-TEC, GIM and IRI-2016 models were observed to be delayed from post-noon in the December solstice to post-sunset in the equinoxes and June solstice hours with respect to UT for both phases of the solar cycle. The delayed peaks were more obvious in GPS-TEC values than in GIM and IRI-2016 values, which was in contrast to the behavior of the TEC in the African longitude, where maximum TEC values were observed around the noon to post-noon LT periods [7,27]. This observation at CPVG could have been due to its location with respect to the geographic and geomagnetic equator. The local time difference (4 h) between both stations in the African longitude may also have been a contributing factor to the unique behavior of TEC at CPVG. On a general note, GIM predictions looked more suitable as a proxy for GPS-TEC measurements in the sense that they were able to reveal the actual shape of GPS-TEC at the three longitudes, although there were some cases of underestimation and overestimation. However, the IRI-2016 model was not able to reveal the true shape of GPS-TEC at the three longitudes, except at CPVG in the African longitude, although the IRI-2016 model values were often slightly higher than the GPS-TEC values at CPVG. At the other stations in the three longitudes, we observed double peak-like structures (noon bite-out) in the IRI-2016 model. This is a major shortcoming for the IRI-2016 model; even though the noon bite-out is an equatorial ionospheric feature, the TEC usually does not conform to a noon bite-out profile because it is extended beyond the bottom-side ionosphere into the plasmasphere, where plasmaspheric electron density contributions are dominant. Furthermore, IRI-2016 is restricted to the whole bottom-side and partially topside ionosphere [20,27]. The disparity between the ionospheric models (GIM and IRI-2016 models) and GPS-TEC, showing either the underestimation or overestimation of GPS-TEC values, are evident in the RMSE values (Table 2 and Table 3). GIM assessment generally looked better than IRI assessment, especially in the African longitude compared with the other two longitudes. IRI-2016 predictions were sometimes better than GIM predictions in some seasons, especially during the March equinox of the descending phase year of 2016 at CPVG in the African longitude and the June solstice for the descending phase year of 2016 at PPPC in the Asian longitude. Most of the time, there were discrepancies between the ionospheric models and GPS-TEC. These discrepancies were likely due to the fact that most ionospheric models are designed based on limitations in the upper limit prediction [1,58]. On a general note, the seasonal values of GPS-TEC were observed to be higher in the African longitude than the American and Asian longitudes. This could be attributed to the fact that the Sun rays arrive at the African longitude at a more oblique angle, giving rise to higher electron densities at the African longitude than at the other two longitudes. Irrespective of the fact that the orientation of the geomagnetic field lines in the African and Asian longitudes are nearly horizontal, one would expect that GPS-TEC values in the Asian longitude would be higher than GPS-TEC values in the American sector, but this is not the case. GPS-TEC values in the Asian longitude were generally the smallest of the three longitude sectors. There could be possibilities of dominating physical processes such as diffusion, thereby reducing the height of the ionosphere over the Asian longitude that therefore reduced the electron densities and gave rise to the smallest GPS-TEC values in the Asian longitude compared with the American and African longitudes. Interestingly, GPS-TEC values were mostly higher at stations on the GE than stations away from the GE at the three longitudes, especially in the African longitude during both phases of the solar cycle as a result of the ionospheric morphology near the dip equator.
Semi-annual variations in TEC were evident during the descending and minimum phases of solar cycle 24, with some exceptions (semi-annual anomaly) showing equal peaks during the September equinox and the December solstice or with the December solstice peak being slightly higher than the peak of the September equinox. These results partly agree with those of Olwendo et al. [43], who reported semi-annual variations in their research. These observations were more evident during the minimum phase at stations along the GE in the American (POVE) and African (ADIS) longitudes. An important point to note is that the peak of TEC from the various sources was slightly wider during the June solstice than the other three seasons during the descending and minimum phases at the three longitudes. Furthermore, the peak of TEC was generally wider during the minimum phase than the descending phase for stations along the GE than stations away from the GE at the three longitudes. The phenomenon of the semi-annual variations of ionospheric parameters such as TEC has been widely reported [7,51,57,59,60]. Therefore, we intend not to dwell on the mechanism giving rise to the semi-annual variations of ionospheric parameters. However, it is worth mentioning that when there is a seasonal variation in the solar zenith, there could be possible deviations in the semi-annual pattern of ionospheric parameters such as TEC [7].
The equinoctial asymmetry reported during both phases at the three longitudes is not new; however, they did not show any significant longitudinal variations in this study. This is in contrast to the results reported by Chen et al. [61] at low latitudes. They reported the presence of longitudinal variations in the equinoctial asymmetry of TEC and NmF2 at low latitudes. However, the results on equinoctial asymmetry in this research agree with those of Bailey et al. [53], who reported that the behavior of equinoctial asymmetry has no significant longitudinal variations. Equinoctial asymmetry is an ionospheric phenomenon associated with differences in the electron density distribution as a result of differences in electric fields, temperatures, thermospheric neutral winds, and sometimes the extreme ultraviolet radiation from the Sun during both equinoxes [39,61,62]. However, we are quite surprised by the insignificant longitudinal variations of the equinoctial asymmetry because the electron density distribution and ionospheric morphology at the three longitudes were quite different [48,63,64,65]. Hence, we will investigate longitudinal variations in equinoctial asymmetry in future research.

5. Conclusions

In the present study, we performed a comparative analysis of the diurnal, seasonal, solar cycle, and LT trends with respect to universal time effects at the equatorial and low-latitude ionosphere over the American, African, and Asian longitude sectors. The observed GPS-TEC data were taken from two well-separated locations at each longitude sector. The corresponding TEC values extracted from CODE-GIMs and IRI-2016 were also analyzed to underpin the longitudinal discrepancies in the ionospheric parameter. The diurnal variations in TEC from GPS, GIM and IRI-2016 showed similar features across the longitudes, except for the African longitude, where the diurnal peaks of the GPS-TEC, GIM and IRI-2016 models were observed during the post-sunset hour at the station away from the dip equator (CPVG). The post-sunset peak during some seasons at CPVG was referred to as an anomaly in the African equatorial ionosphere, where the peak of ionospheric parameters such as TEC was found to occur at noon to post-noon periods. The values of the diurnal variations in the GPS-TEC, GIM and IRI-2016 models were observed to be higher in the African longitude than the other two longitudes and during the descending phase than in the minimum phase. Regarding the assessment of the GIM and IRI-2016 models on GPS-TEC, both models showed either overestimation or underestimation, though the GIM seemed relatively more suitable for the estimation of values, especially in terms of its similarity in shape to GPS-TEC. However, the IRI-2016 model mostly showed a noon bite-out curve at all stations at the three longitudes, except at CPVG in the African longitude, where it was able to reveal the true shape of GPS-TEC. At CPVG, IRI-2016 showed an overestimation of GPS-TEC, especially during the minimum phase of the solar cycle. The overestimation characteristic of the GIM was more pronounced during the March equinox of the descending phase year of 2016 at the three longitudes. The local time effect of the longitudinal variations in TEC was evident, showing peak shifting to different hours of the day in the universal time frame at the three longitudes. The seasonal and semi-annual variations observed in this study showed some anomalies that were different from previous results, especially during the solar minimum years at the three longitudes. Finally, our observations suggest that there is an insignificant effect of longitudinal variations on equinoctial asymmetry. The important outcomes from this study could augment the past efforts of scientists to understand the seasonal effects of the longitudinal variations in TEC, which may be useful for the statutory protection and baseline positioning accuracy of satellite positioning. Furthermore, the GIM and IRI-2016 model groups and research scientists may find results from this research useful to generate additional improvements of their respective models. As an extension of the present work, we intend to apply IRI-2020 in a future analysis and also for solar cycle 25 to verify the improvements in the embedded submodels of the latest edition and other planned updates. In particular, improvements of the diurnal, seasonal and geomagnetic disturbance time representations in the latest version will be emphasized, as there is still rooms for improvements of the same in the equatorial and low latitudes.

Author Contributions

Conceptualization, A.O. and S.K.P.; methodology, A.O., O.O. and S.K.P.; software, A.O., O.J.O. and S.K.P.; validation, A.O., S.K.P., A.O.A., M.A.A., P.J. and O.O.; formal analysis, A.O., O.O., M.A.A., P.J. and S.K.P.; investigation, A.O., O.J.O., A.O.A. and S.K.P.; resources, A.O., O.O. and S.K.P.; data curation, A.O., O.O. and S.K.P.; writing—original draft preparation, A.O. and O.O.; writing—review and editing, A.O., O.J.O., A.O.A., M.A.A., P.J. and S.K.P.; visualization, A.O., O.J.O., A.O.A., M.A.A., P.J. and S.K.P. All authors have read and agreed to the published version of the manuscript.

Funding

This research work was carried out under the financial support to Aghogho Ogwala through Visiting Research Scholar of KMITL Research funding (Grant No. KREF176401) for conducting the study.

Institutional Review Board Statement

Not applicable.

Informed Consent Statement

Not applicable.

Data Availability Statement

The daily GPS observation data from the three longitudinal sectors were downloaded from the UNAVCO GNSS data archive (https://data.unavco.org/archive/gnss/rinex/obs/; accessed on 25 October 2021). The global ionospheric maps (GIMs) were obtained from the Crustal Dynamics Data Information System (CDDIS) archive (https://cddis.nasa.gov/archive/gnss/products/ionex/; accessed on 16 December 2021). The International Reference Ionosphere (IRI-2016) was accessed from the CCMC-NASA instant model run server (https://ccmc.gsfc.nasa.gov/modelweb/models/iri2016_vitmo.php; accessed on 19 November 2021).

Acknowledgments

The authors acknowledge Gopi Krishna Seemala for providing the GPS-TEC analysis application program to conduct this research.

Conflicts of Interest

The authors declare no conflict of interest.

References

  1. Reddybattula, K.D.; Panda, S.K. Performance analysis of quiet and disturbed time ionospheric TEC responses from GPS-based observations, IGS-GIM, IRI-2016 and SPIM/IRI-Plas 2017 models over the low latitude Indian region. Adv. Space Res. 2019, 64, 2026–2045. [Google Scholar] [CrossRef]
  2. Mallika, I.L.; Venkata Ratnam, D.; Raman, S.; Sivavaraprasad, G. Machine learning algorithm to forecast ionospheric time delays using Global Navigation satellite system observations. Acta Astronaut. 2020, 173, 221–231. [Google Scholar] [CrossRef]
  3. Koons, H.C.; Mazur, J.E.; Selesnick, R.S.; Blake, J.B.; Fennell, J.F.; Roeder, J.L.; Anderson, P.C. The impact of the space environment on space system. In Proceedings of the 6th Spacecraft Charging Technology Conference, AFRL Science Center, Hanscom AFB, MA, USA, 2–6 November 1998; AFRL-VS-TR-200015782000. pp. 7–11. [Google Scholar]
  4. Jee, G.; Schunk, R.W.; Scherliess, L. Analysis of TEC data from the TOPEX/Poseidon mission. J. Geophys. Res. 2004, 109, A01301. [Google Scholar] [CrossRef]
  5. Maruyama, T.; Ma, G.; Nakamura, M. Signature of TEC storm on 6 November 2001 derived from dense GPS receiver network and ionosonde chain over Japan. J. Geophys. Res. 2004, 109, A10302. [Google Scholar] [CrossRef]
  6. Codrescu, M.V.; Palo, S.E.; Zhang, X.; Fuller-Rowell, T.J.; Poppe, C. TEC climatology derived from TOPEX/POSEIDON measurements. J. Atmos. Sol. 1999, 61, 281–298. [Google Scholar] [CrossRef]
  7. Ogwala, A.; Somoye, E.O.; Ogunmodimu, O.; Adeniji-Adele, R.A.; Onori, E.O.; Oyedokun, O. Diurnal, seasonal and solar cycle variation in total electron content and comparison with IRI-2016 model at Birnin Kebbi. Ann. Geophys. 2019, 37, 775–789. [Google Scholar] [CrossRef] [Green Version]
  8. Bagiya, M.S.; Joshi, H.P.; Iyer, K.N.; Aggarwal, M.; Ravin-Dran, S.; Pathan, B.M. TEC variations during low solar activity period (2005–2007) near the Equatorial Ionization Anomaly Crest region in India. Ann. Geophys. 2009, 27, 1047–1057. [Google Scholar] [CrossRef] [Green Version]
  9. Tariku, Y.A. Pattern of GPS-TEC variability over low-latitude regions (African sector) during the deep solar minimum (2008 to 2009) and solar maximum (2012 to 2013) phases. Earth Planets Space 2015, 67, 35. [Google Scholar] [CrossRef] [Green Version]
  10. Torr, M.R.; Torr, D.G. The seasonal behavior of the F2 layer of the ionosphere. J. Atmos. Terr. Phys. 1973, 35, 2237. [Google Scholar] [CrossRef]
  11. Wanninger, L. Effects of the equatorial ionosphere on GPS. GPS World 1993, 2, 48. [Google Scholar]
  12. Fedrizzi, M.; de Paula, E.R.; Kantor, I.J.; Langley, R.B.; Santos, M.C.; Komjathy, A. Mapping the Low-Latitude Ionosphere with GPS. GPS WORLD 2002, 13, 41–47. [Google Scholar]
  13. Rama Rao, P.V.S.; Krishna, S.G.; Niranjan, K.; Prasad, D.S.V.V.D. Study of temporal and spatial characteristics of L-band scintillation over the Indian low-latitude region and their possible effects on GPS navigation. Ann. Geophys. 2006, 24, 1567–1580. [Google Scholar] [CrossRef]
  14. Wu, C.C.; Liou, K.; Shan, S.J.; Tseng, C.L. Variation of ionospheric total electron content in Taiwan region of the equatorial anomaly from 1994–2003. Adv. Space Res. 2008, 41, 611–616. [Google Scholar] [CrossRef]
  15. Ayorinde, T.T.; Rabiu, A.B.; Amory-Mazaudier, C. Inter-hourly variability of Total Electron Content during the quiet condition over Nigeria within the Equatorial Ionization Anomaly region. J. Atmos. Solar Terr. Phys. 2016, 145, 21–33. [Google Scholar] [CrossRef] [Green Version]
  16. Klobuchar, J.A. Ionospheric Time-Delay Algorithm for Single-Frequency GPS Users. IEEE Trans. Aerosp. Electron. Syst. 1987, AES-23, 325–331. [Google Scholar] [CrossRef]
  17. Komjathy, A.; Langley, R.; Bilitza, D. Ingesting GPS-derived data into the IRI for single frequency radar altimeter ionospheric delay corrections. Adv. Space Res. 1998, 22, 793–802. [Google Scholar] [CrossRef] [Green Version]
  18. Bolaji, O.S.; Adeniyi, J.O.; Radicella, S.M.; Doherty, P.H. Variability of total electron content over an equatorial West African station during low solar activity. Radio Sci. 2012, 47, RS1001. [Google Scholar] [CrossRef]
  19. Alizadeh, M.M.; Wijaya, D.D.; Hobiger, T.; Weber, R.; Schuh, H. Ionospheric effects on microwave signals. In Atmospheric Effect in Space Geodesy; Springer Atmospheric, Sciences; Bohm, J., Schuh, H., Eds.; Springer: Berlin/Heidelberg, Germany, 2013. [Google Scholar]
  20. Bilitza, D.; Altadill, D.; Truhlik, V.; Shubin, V.; Galkin, I.; Reinisch, B.; Huang, X. International reference ionosphere 2016: From ionospheric climate to real-time weather predictions. Space Weather 2017, 15, 418–429. [Google Scholar] [CrossRef]
  21. Hernandez-Pajares, M.; Juan, J.M.; Sanz, J.; Orus, R.; Garcia-Rigo, A.; Feltens, J.; Komjathy, A.; Schaer, S.C.; Krankowski, A. The IGS VTEC maps: A reliable source of ionospheric information since 1998. J. Geod. 2009, 83, 263–275. [Google Scholar] [CrossRef]
  22. Schaer, S. Mapping and Predicting the Earth’s Ionosphere Using the Global Positioning System. Ph.D. Thesis, Bern University of Bern, Bern, Switzerland, 1999. [Google Scholar]
  23. Bilitza, D.; Pezzopane, M.; Truhlik, V.; Altadill, D.; Reinisch, B.W.; Pignalberi, A. The International Reference Ionosphere model: A review and description of an ionospheric benchmark. Rev. Geophys. 2022, 60, e2022RG000792. [Google Scholar] [CrossRef]
  24. Rama Rao, P.V.S.; Krishna, S.G.; Prasad, J.V.; Prasad, S.N.V.S.; Prasad, D.S.V.V.D.; Niranjan, K. Geomagnetic storm effects on GPS based navigation. Ann. Geophys. 2009, 27, 2101–2110. [Google Scholar] [CrossRef] [Green Version]
  25. D’ujanga, F.M.; Opio, P.; Twinomugisha, F. Variation of total electron content with solar activity during the ascending phase of solar cycle 24 observed at Makerere University, Kampala. Ionos. Space Weather. Longit. Depend. Low. Atmos. 2016, 220, 263. [Google Scholar]
  26. Balan, N.; Liu, L.; Le, H. A brief review of the equatorial ionization anomaly and ionospheric irregularities. Earth Planet. Phys. 2018, 2, 257–275. [Google Scholar] [CrossRef]
  27. Ogwala, A.; Somoye, E.O.; Panda, S.K.; Ogunmodimu, O.; Onori, E.O.; Sharma, S.K.; Okoh, D.; Oyedokun, O.J. Total electron content at equatorial and low-, middle and high-latitudes in the African longitude sector and its comparison with IRI-2016 and IRI-Plas 2017 models. Adv. Space Res. 2021, 68, 2160–2176. [Google Scholar] [CrossRef]
  28. Kumar, S.; Tan, E.L.; Murti, D.S. Impacts of solar activity on performance of the IRI-2012 model predictions from low to mid latitudes. Earth Planets Space 2015, 67, 42. [Google Scholar] [CrossRef] [Green Version]
  29. Bhuyan, P.K.; Borah, R.R. TEC derived from GPS network in India and comparison with the IRI. Adv. Space Res. 2007, 39, 830–840. [Google Scholar] [CrossRef]
  30. Alcay, S.; Oztan, G.; Selvi, H.Z. Comparison of IRI_PLAS and IRI_2012 Model Predictions with GPS-TEC Measurements in Different Latitude Regions. Ann. Geophys. 2017, 60, G0549. [Google Scholar] [CrossRef] [Green Version]
  31. Atıcı, R. Comparison of GPS TEC with modelled values from IRI 2016 and IRI-PLAS over Istanbul, Turkey. Astrophys. Space Sci. 2018, 363, 231. [Google Scholar] [CrossRef]
  32. Sharma, S.K.; Ansari, K.; Panda, S.K. Analysis of Ionospheric TEC Variation over Manama, Bahrain, and Comparison with IRI- 2012 and IRI-2016 Models. Arab. J. Sci. Eng. 2018, 43, 3823–3830. [Google Scholar] [CrossRef]
  33. Ansari, K.; Park, K.-D.; Panda, S.K. Empirical Orthogonal Function analysis and modeling of ionospheric TEC over South Korean region. Acta Astronaut. 2019, 161, 313–324. [Google Scholar] [CrossRef]
  34. Reddybattula, K.D.; Panda, S.K.; Ansari, K.; Peddi, V.S.R. Analysis of ionospheric TEC from GPS, GIM and global ionosphere models during moderate, strong, and extreme geomagnetic storms over Indian region. Acta Astronaut. 2019, 161, 283–292. [Google Scholar] [CrossRef]
  35. Tariku, Y.A. Performance evaluation of the IRI 2016 and IRI-Plas 2017 models over central Asian mid-latitude regions in the descending phase of solar cycle 24. Adv. Space Res. 2019, 64, 1065–1077. [Google Scholar] [CrossRef]
  36. Tariku, Y.A. Testing the improvement of performance of the IRI model in the estimation of TEC over the mid-latitude American regions. Adv. Space Res. 2019, 63, 2066–2074. [Google Scholar] [CrossRef]
  37. Dabbakuti, J.R.K.K.; Peesapati, R.; Panda, S.K.; Thummala, S. Modeling and analysis of ionospheric TEC variability from GPS–TEC measurements using SSA model during 24th solar cycle. Acta Astronaut. 2021, 178, 24–35. [Google Scholar] [CrossRef]
  38. Bolaji, O.; Oyeyemi, E.; Adewale, A.O.; Wu, Q.; Okoh, D.; Doherty, P.H.; Kaka, R.O.; Abbas, M.; Owolabi, C.; Jidele, P.A. Assessment of IRI-2012, NeQuick-2 and IRI-Plas 2015 models with observed equatorial ionization anomaly in Africa during 2009 sudden stratospheric warming event. J. Atmos. Sol.-Terr. Phys. 2017, 164, 203–214. [Google Scholar] [CrossRef]
  39. Nogueira, P.A.B.; Abdu, M.A.; Souza, J.R.; Bailey, G.J.; Batista, I.S.; Shume, E.B.; Denardini, C.M. Longitudinal variation in Global Navigation Satellite Systems TEC and topside ion density over South American sector associated with the four-peaked wave structures. J. Geophys. Res. Space Phys. 2013, 118, 7940–7953. [Google Scholar] [CrossRef]
  40. Akala, A.O.; Seemala, G.K.; Doherty, P.H.; Valladares, C.E.; Carrano, C.S.; Espinoza, J.; Oluyo, K.S. Comparison of equatorial GPS-TEC observations over an African station and an American station during the minimum and ascending phases of solar cycle 24. Ann. Geophys. 2013, 31, 2085. [Google Scholar] [CrossRef] [Green Version]
  41. Oryema, B.; Jurua, E.; D’ujanga, F.M.; Ssebiyonga, N. Investigation of TEC variations over the magnetic equatorial and equatorial anomaly regions of the African sector. Adv. Space Res. 2015, 56, 1939–1950. [Google Scholar] [CrossRef]
  42. Zhong, J.; Lei, J.; Wang, W.; Burns, A.G.; Yue, X.; Dou, X. Longitudinal variations of topside ionospheric and plasmaspheric TEC. J. Geophys. Res. Space Phys. 2017, 122, 6737–6760. [Google Scholar] [CrossRef]
  43. Olwendo, O.J.; Yamazaki, Y.; Cilliers, P.J.; Baki, P.; Doherty, P. A study on the variability of ionospheric total electron content over east African low latitude region and storm time ionspheric variations. Radio Sci. 2016, 51, 1503–1518. [Google Scholar] [CrossRef] [Green Version]
  44. Seemala, G.; Valladares, C. Statistics of total electron content depletions observed over the South American continent for the year 2008. Radio Sci. 2011, 46, 1–14. [Google Scholar] [CrossRef]
  45. Valladares, C.E.; Villalobos, J.; Hei, M.A.; Sheehan, R.; Basu, S.; Mackenzie, E.; Doherty, P.H.; Rios, V.H. Simultaneous observation of travelling ionospheric disturbances in the northern and southern hermisphere. Ann. Geophys. 2009, 27, 1501–1508. [Google Scholar] [CrossRef]
  46. Sardon, E.; Zarraoa, N. Estimation of total electron using GPS data: How stable are the differential satellite and receiver instrumental biases? Radio Sci. 1997, 32, 1899–1910. [Google Scholar] [CrossRef]
  47. Arikan, F.; Nayir, H.; Sezen, U.; Arikan, O. Estimation of single station interfrequency receiver biase using GPS-TEC. Radio Sci. 2008, 43, RS4004. [Google Scholar] [CrossRef]
  48. Galkin, I.; Fron, A.; Reinisch, B.; Hernandez-Pajere, M.; Krankwoski, A.; Nava, B.; Bilitza, D.; Kotulak, K.; Flisek, P.; Li, Z. Global Monitoring of the ionospheric weather by GIRO and GNSS Data Fusion. Atmosphere 2022, 13, 371. [Google Scholar] [CrossRef]
  49. Oyedokun, O.J.; Akala, A.O.; Oyeyemi, E.O. Characterization of African equatorial ionization anomaly (EIA) during maximum phase of solar cycle 24. J. Geophys. Res. Space Phys. 2020, 125, e2019JA027066. [Google Scholar] [CrossRef]
  50. Somoye, E.; Akala, A. Comparison of diurnal, seasonal and latitudinal effect of MUF VR and NmF2 VR during some solar cycle epochs. Adv. Space Res. 2011, 47, 2182–2187. [Google Scholar] [CrossRef]
  51. Aggarwal, M.; Bardhan, A.; Sharma, D.K. Equinoctial asymmetry in ionosphere over Indian region during 2006–2013 using COSMIC measurements. Adv. Space Res. 2017, 60, 999–1014. [Google Scholar] [CrossRef]
  52. Balan, N.; Otsuka, Y.; Bailey, G.; Fukao, S. Equinoctial asymmetries in the ionosphere and thermosphere observed by the MU radar. J. Geophys. Res. 1998, 103, 9481–9495. [Google Scholar] [CrossRef]
  53. Bailey, G.J.; Su, Y.Z.; Oryama, K.-I. Yearly variations in the low-latitude topside ionosphere. Ann. Geophys. 2000, 18, 789–798. [Google Scholar] [CrossRef]
  54. Pezzopane, M.; Del Corpo, A.; Piersanti, M.; Cesaroni, C.; Pignalberi, A.; Matteo, S.D.; Spogli, L.; Vellante, M.; Heilig, B. On some features characterizing the plasmasphere–magnetosphere–ionosphere system during the geomagnetic storm of 27 May 2017. Earth Planets Space 2019, 71, 77. [Google Scholar] [CrossRef] [PubMed] [Green Version]
  55. Liu, L.; Wang, W.; Ning, B.; Pirog, O.M.; Kurkin, V.I. Solar activity variations of the ionospheric peak electron density. J. Geophys. Res. 2006, 111, A08304. [Google Scholar] [CrossRef]
  56. Forbes, J.M.; Bruinsma, S.; Lemoine, F.G. Solar rotation effects on the thermospheres of Mars and Earth. Science 2006, 312, 1366–1368. [Google Scholar] [CrossRef] [PubMed]
  57. Liu, L.; Wang, W.; Chen, Y.; Le, H. Solar activity effects on the ionosphere: A brief review, Space Physics and Space Weather Geophysics. Chin. Sci. Bull. 2011, 56, 1202–1211. [Google Scholar] [CrossRef] [Green Version]
  58. Panda, S.K.; Haralambous, H.; Mefe, M.; Dabbakuti, J.R.K.K.; Tariku, Y.A. Ionospheric ans plasmaspheric electron contents from space-time collated digisonde, COSMIC, GPS observations and model assessments. Acta Astronaut. 2021, 179, 619–635. [Google Scholar] [CrossRef]
  59. Tsai, H.-F.; Liu, J.-Y.; Tsai, W.-H.; Liu, C.-H.; Tseng, C.-L.; Wu, C.-C. Seasonal variations of the ionospheric TEC in Asian equatorial anomaly regions. J. Geophys. Res. 2001, 106, 30363–30369. [Google Scholar]
  60. Ma, R.; Xu, J.; Liao, H. The features and a possible mechanism of semiannual variation in the peak electron density of the low latitude F2 Layer. J. Atmos. Sol. Terr. Phys. 2003, 65, 47–57. [Google Scholar] [CrossRef]
  61. Chen, Y.; Liu, L.; Wan, W.; Ren, Z. Equinoctial asymmetry in solar activity variations of NmF2 and TEC. Ann. Geophys. 2012, 30, 613–622. [Google Scholar] [CrossRef] [Green Version]
  62. Kawamura, S.; Balan, N.; Otsuka, Y.; Fukao, S. Annual and semiannual variations of themidlatitude ionosphere under low solar activity. J. Geophys. Res. 2002, 107, 1166. [Google Scholar]
  63. Yizengaw, E.; Zesta, E.; Moldwin, M.B.; Damtie, B.; Mebrahtu, A.; Valladares, C.E.; Pfaff, R.F. Longitudinal differences of ionospheric vertical density distribution and equatorial electrodynamics. J. Geophys. Res. 2012, 117, A07312. [Google Scholar] [CrossRef] [Green Version]
  64. Potula, B.S.; Chu, Y.-H.; Uma, G.; Hsia, H.-P.; Wu, K.-H. A global comparative study on the ionospheric measurements between COSMIC radio occultation technique and IRI model. J. Geophys. Res. 2011, 116, A02310. [Google Scholar] [CrossRef] [Green Version]
  65. Klimenko, M.V.; Klimenko, V.V.; Bessarab, F.S.; Zakharenkova, I.E.; Vesnin, A.M.; Ratovsky, K.G.; Galkin, I.A.; Chernyak, I.V.; Yasyukevich, Y.V.; Koren’kova, N.A. Diurnal and longitudinal variations in the earth’s ionosphere in the period of solstice in conditions of a deep minimum of solar activity. Cosm. Res. 2016, 54, 8–19. [Google Scholar] [CrossRef]
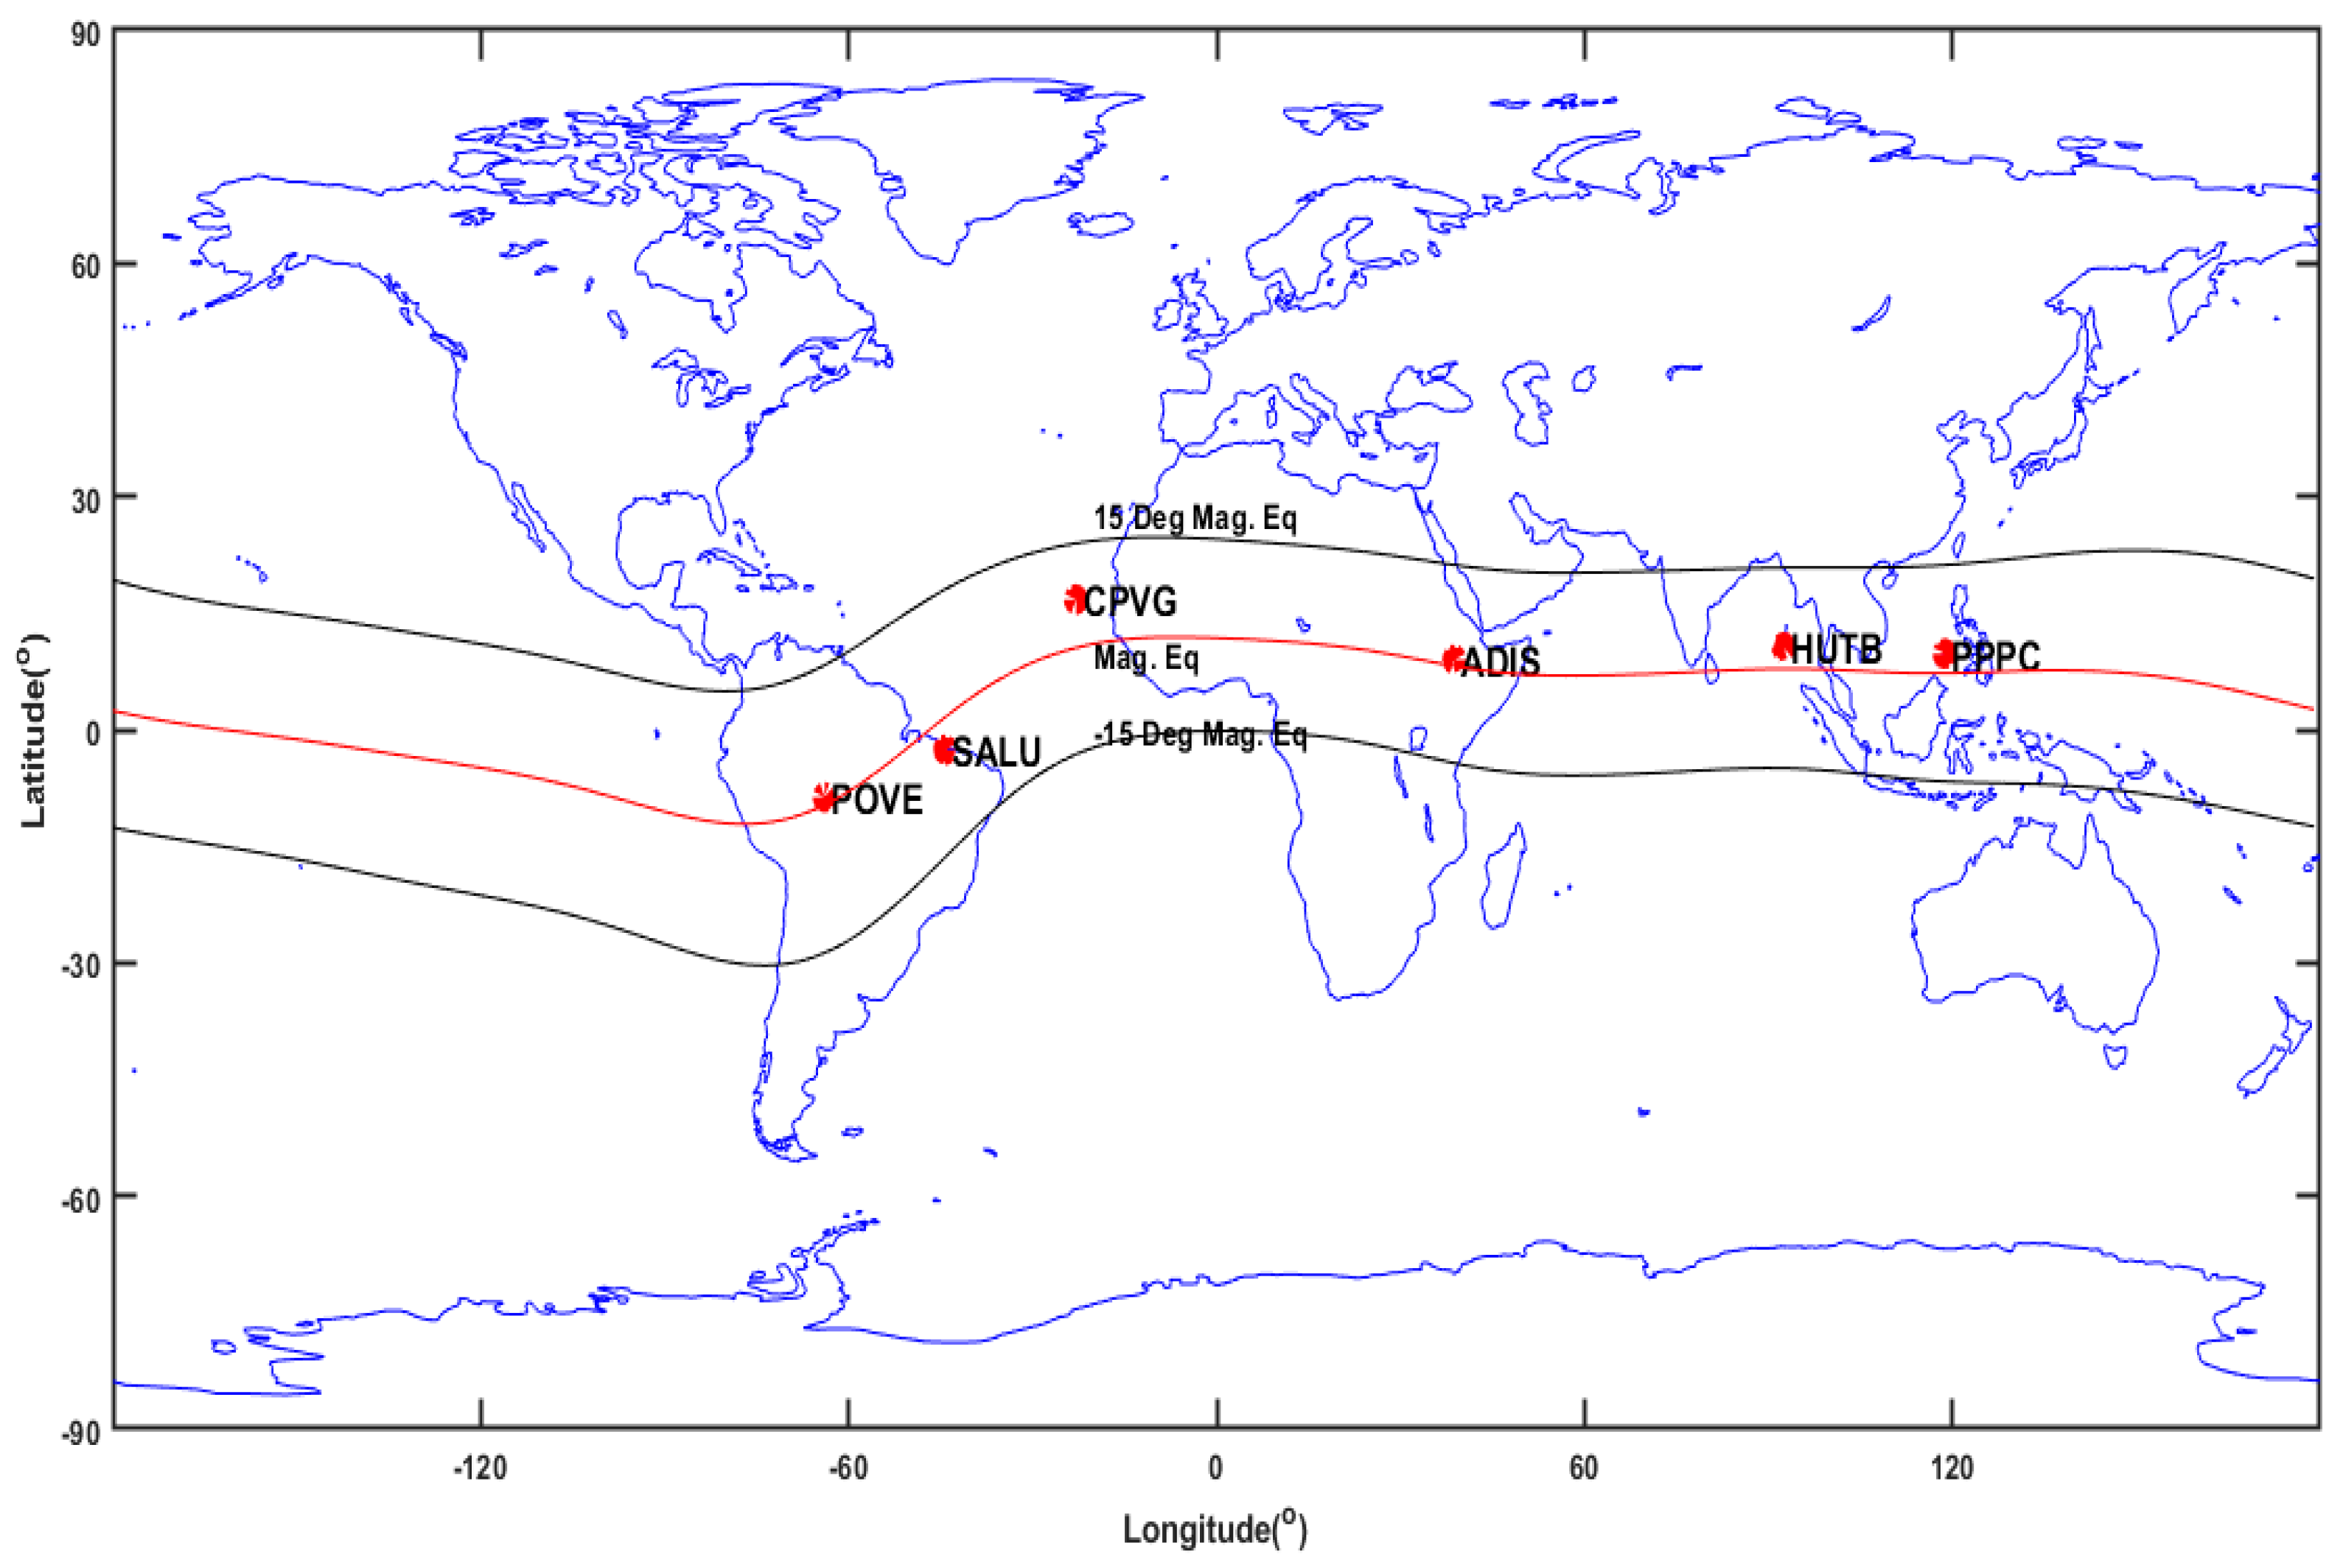
Figure 1. Location of GPS stations at different longitude sectors considered in this study, a red contour line in the center of the map indicates the magnetic equator, whereas the black counters in either hemisphere represent the approximate position of the EIA crest during the period. The red colour stars indicate the locations of GPS stations as listed in Table 1.
Universe 08 00575 g001
Figure 2. Diurnal variations in GPS-TEC and assessment of GIM and IRI-2016 models at the American (GPS stations: (a) SALU and (b) POVE), African (GPS stations: (c) CPVG and (d) ADIS), and Asian (GPS stations: (e) HUTB and (f) PPPC) longitudes for the year 2016. The details of the GPS stations are mentioned in Table 1.
Universe 08 00575 g002
Figure 3. Diurnal variations in GPS-TEC and assessment of GIM and IRI-2016 models at the American (GPS stations: (a) SALU and (b) POVE), African (GPS stations: (c) CPVG and (d) ADIS), and Asian (GPS stations: (e) HUTB and (f) PPPC) longitudes for the year 2017. The details of the GPS stations are mentioned in Table 1.
Universe 08 00575 g003
Figure 4. Diurnal variations in GPS-TEC and assessment of GIM and IRI-2016 models at the American (GPS stations: (a) SALU and (b) POVE), African (GPS stations: (c) CPVG and (d) ADIS), and Asian (GPS stations: (e) HUTB and (f) PPPC) longitudes for the year 2018. The details of the GPS stations are mentioned in Table 1.
Universe 08 00575 g004
Figure 5. Diurnal variations in GPS-TEC and assessment of GIM and IRI-2016 models at the American (GPS stations: (a) SALU and (b) POVE), African (GPS stations: (c) CPVG and (d) ADIS), and Asian (GPS stations: (e) HUTB and (f) PPPC) longitudes for the year 2019. The details of the GPS stations are mentioned in Table 1.
Universe 08 00575 g005
Figure 6. Seasonal variations in GPS-TEC, IRI-2016 and GIM models for descending (2016–2017) and minimum (2018–2019) phases of solar cycle 24 at SALU.
Universe 08 00575 g006
Figure 7. Seasonal variations in GPS-TEC, IRI-2016 and GIM models for descending (2016–2017) and minimum (2018–2019) phases of solar cycle 24 at POVE.
Universe 08 00575 g007
Figure 8. Seasonal variations in GPS-TEC, IRI-2016 and GIM models for descending (2016–2017) and minimum (2018–2019) phases of solar cycle 24 at CPVG.
Universe 08 00575 g008
Figure 9. Seasonal variations in GPS-TEC, IRI-2016 and GIM models for descending (2016–2017) and minimum (2018–2019) phases of solar cycle 24 at ADIS.
Universe 08 00575 g009
Figure 10. Seasonal variations in GPS-TEC, IRI-2016 and GIM models for descending (2016–2017) and minimum (2018–2019) phases of solar cycle 24 at HUTB.
Universe 08 00575 g010
Figure 11. Seasonal variations in GPS-TEC, IRI-2016 and GIM models for descending (2016–2017) and minimum (2018–2019) phases of solar cycle 24 at PPPC.
Universe 08 00575 g011
Table 1. The geographic coordinates and magnetic latitude of the GPS stations in American, African, and Asian longitude sectors.
Longitude SectorStation CodeLocationGeographic Lat.Geographic Long.Magnetic Lat.
AmericanSALUSao Luis, Brazil−2.59°−44.21°−0.25°
POVEPorto Velho, Brazil−8.7°−63.9°2.87°
AfricanCPVGCape Verde16.73°−22.94°4.94°
ADISAddis Ababa University, Ethiopia9.02°38.81°0.16°
AsianHUTBHutbay, Nicobar Islands10.62°92.51°2.28°
PPPCPuerto Princesa, Phillipines9.77°118.74°1.93°
Table 2. RMSE between GPS-TEC and GIM.
Station IDYearsMarch EquinoxJune SolsticeSeptember EquinoxDecember Solstice
SALU20168.504.706.645.70
20175.422.304.884.23
20183.851.96-3.36
2019----
POVE20166.553.505.465.44
20173.791.794.184.07
20182.631.792.292.65
20194.031.582.332.82
CPVG20167.393.863.913.56
20173.92-3.161.78
20183.092.962.501.75
20192.752.46-2.90
ADIS20162.901.561.852.15
20171.772.001.631.81
20182.961.392.142.70
20192.821.221.362.71
HUTB20168.053.967.512.78
2017----
2018----
2019----
PPPC20167.705.2113.422.50
20176.023.843.242.21
20183.152.814.403.38
20192.822.014.503.48
Table 3. RMSE between GPS-TEC and IRI-2016.
Station IDYearMarch EquinoxJune SolsticeSeptember EquinoxDecember Solstice
SALU20164.943.144.192.83
20173.452.903.053.48
20183.292.76-3.86
2019----
POVE20166.443.264.543.50
20174.762.824.173.85
20183.892.373.584.36
20194.021.924.024.92
CPVG20165.013.313.165.23
20174.16-2.014.88
20186.103.865.435.91
20193.943.88-7.34
ADIS20169.874.175.816.33
20177.343.504.744.79
20185.953.324.214.67
20196.272.953.464.63
HUTB20165.312.763.373.52
2017----
2018----
2019----
PPPC20165.572.016.643.59
20172.963.443.861.69
20182.562.073.443.18
20192.782.344.493.79
Publisher’s Note: MDPI stays neutral with regard to jurisdictional claims in published maps and institutional affiliations.