Abstract
The blazar PKS 0208-512 was in the lowest -ray brightness state during the initial 10 years of observations with the Fermi Gamma-ray Space Telescope (Fermi), which was an order of magnitude lower than its flux state during the EGRET era (1991–2000). The weekly averaged maximum -ray flux of this source during the first 10 years of Fermi observation is nearly a factor of 3 lower than the highest flux observed by EGRET in a single epoch. During the period 2018–2020, the source showed a large -ray flare, with the average brightness similar to the period 1991–2000. We observed the source with AstroSat, during its low and high activity states, respectively. We carried out broad-band spectral energy distribution (SED) modeling of the source using a one-zone leptonic emission model during its various brightness states. From the SED modeling, we found that there was an inefficient conversion from the bulk energy to the particle energy during the long-term low-activity states as compared to the high flux state during the EGRET era and the later part of Fermi observation.
1. Introduction
Blazars are a class of active galaxies whose multi-band emission is dominated by the non-thermal radiation originating from their relativistic jet pointing toward the Earth [1]. They emit radiation across the electromagnetic spectrum and are exceptionally bright in the -ray band. Since the line-of-sight angle to the relativistic jet is small, the observed emission from them is highly Doppler boosted. The emission from blazars shows variations of different time scales at different time intervals. The time scale of such variations ranges from minutes to days to months to years [2,3,4,5,6,7,8]. From the observational perspective, blazars are sub-classified as “Flat-spectrum radio quasars (FSRQs)” and “BL Lac objects (BL Lacs)”. FSRQs have the emission line “equivalent line width (EW)” >5 Å, whereas BL Lacs have EW <5 Å [9,10]. According to the classification proposed by Ghisellini et al. [11], which is based on the broad-line region (BLR) luminosity, FSRQs have greater BLR luminosity () than BL Lacs.
The broad-band spectral energy distribution (SED) of blazars shows a double hump structure. Near the optical/UV band, the peak of the first hump falls, originating from synchrotron emission from the relativistic jet. The second hump peaks at the hard X-ray/-ray band, and is because of the inverse Compton (IC) emission process produced due to the up-scattering of low-energy photons by the energetic jet electrons. If the low-energy photons are produced by the synchrotron emission from the jet electrons, the process is called synchrotron self-Compton (SSC; Marscher and Gear [12]). The seed photons for IC processes can also come from outside the jet [13]. -ray emissions from FSRQs are dominated by up scattering of low-energy photons from the accretion disk [14], BLR [15], a dusty torus [16], etc. Such a process is called the external Compton (EC) process [17,18].
Blazar variability in -rays occurs as flares of different time scales ranging from minutes to days or months, e.g., [7,8,19,20,21]. A variability with the time scale ranging from minutes to hours to days to weeks is termed short-term variability. However, a variability with a much longer time scale (months to years) is defined as long-term variability. In the -ray band, flares with extreme short-time variability with a time scale of ∼few minutes have been observed [20,21,22,23,24,25]. Furthermore, earlier studies reported flaring and quiescent activities with a time scale of years to a decade [26,27,28]. Besides the flaring activity, the baseline flux above which the flares occur may also exhibit variations. Bhattacharya et al. [29] carried out a study on the FSRQs detected by “Energetic Gamma-Ray Experiment Telescope” (EGRET; [30]) on-board “Compton Gamma Ray Observatory” (CGRO) [31]. They used five years of observations (1991–1995) with EGRET and the first two years of observations with the “Large Area Telescope” (LAT) on-board “Fermi -ray space telescope” (hereafter Fermi; [32]) and noticed more than a factor of ten decrease in the average -ray flux of few blazars from EGRET to the Fermi era. Furthermore, Bhattacharya et al. [33] noticed “despite the enhanced sensitivity and wider and more frequent sky coverage of ” Fermi-LAT, some of the EGRET-detected blazars were still not detected by Fermi-LAT even after its first seven years of observations. In addition to this, using the long-term Fermi-LAT observations, there are reports on the change in the -ray baseline flux in blazars 1ES 1215+303 and 3C 66A, and a misaligned active galaxy NGC 1275 [34,35,36].
The observed variability in blazars could arise from different emission scenarios (e.g., Böttcher [8], and the references therein). Stochastic variations due to sudden injection of particles, perhaps due to internal shock formation or due to magnetic reconnection triggered by the turbulence developed in the jet could be the cause for flares. The site of -ray emission from the blazars is believed to be nearer to the jet’s base, though the origin and the exact location of the -ray emission are not well understood [8,37,38]. Many blazar studies aim at understanding the short-term behavior of blazars, because investigation of possible physical scenario during long-term low -ray activity state is limited. Hence, the characterization of such long-term low-activity behavior is essential. One of the blazars, PKS 0208-512, exhibits decade long low -ray activity state during the Fermi era. In this work, we examine the long-term behavior of the blazar PKS 0208-512 through broad-band SED modeling.
PKS 0208-512 is an FSRQ [39] at a redshift of [40]. It was first discovered during the Parkes Survey of Radio Sources [41]. Bertsch et al. [42] reported the first -ray emission from the source 3EG J0210-5055/PKS 0208-512 above 30 MeV, which was detected with the EGRET detector [31]. EGRET has observed the source during its different pointed observations. Before the launch of Fermi, several studies were carried out to understand the -ray, X-ray, and UV/optical emission and spectral nature of PKS 0208-512 using the EGRET and other broad-band observations [43,44,45,46,47,48,49,50,51,52,53,54,55]. Using the EGRET and initial two years of Fermi-LAT observations, Bhattacharya et al. [29] reported that PKS 0208-512 showed more than a factor of ten decrease in the average -ray flux from EGRET to Fermi era. Using the initial few years of Fermi-LAT observations and other multi-band data, some studies were reported with the aim of understanding the cause for short-term and long-term (of ∼ few months) variations in this source [29,39,56,57,58,59]. The work by Khatoon et al. [60], reported the temporal and spectral nature of PKS 0208-512 during its enhanced -ray emission from November 2019 to March 2020. However, no broad-band spectral study to understand the long-term behavior (more than a year time scale) of PKS 0208-512 has been reported. In this work, we carried out a systematic study of the long-term behavior of PKS 0208-512 using ∼12 years of Fermi-LAT observations along with ∼9 years of EGRET observations. We also observed the source using India’s multi-wavelength observatory AstroSat during the long-term low -ray activity state and very high flux state. The analysis of multi-band data used in this work are provided in Section 2. In Section 3, we discuss our results, followed by the conclusion in Section 4.
2. Observations and Data Analysis
In this work, our aim is to characterize the broad-band SED properties of PKS 0208-512 during the Fermi and EGRET periods. We used the archival multi-band data that covers -rays to infrared bands. We also observed PKS 0208-512 with AstroSat on 29–30 October 2016 (AS1 epoch) and 24–25 December 2019 (AS2 epoch). AstroSat is India’s first multi-wavelength astronomical observatory [61,62,63]. The instrument-specific data analysis from the different observatories is discussed in the following sections.
2.1. GeV Data
We used the data from Fermi-LAT [64] covering the period from 4 August 2008 to 30 September 2020 (∼12 years) in the energy range of 100 MeV to 100 GeV. We analyzed a region of interest (ROI) centerd on the source position, and source radius was used. The Fermitools version 1.2.23 software was used to carry out analysis of ‘pass 8 P8R3’ data1 (‘diffuse class events; evclass = 128, evtype = 3’). The analysis was carried out using the Fermipy version 0.19 software 2 [65] with instrument response function (IRF) ‘P8R3_SOURCE_V2’. Good time intervals were obtained with the filter expression ‘DATA_QUAL && LAT_CONFIG ’. To remove the contribution from the earth limb, a cut on the zenith angle was applied. Furthermore, a spatial binning of pixel and eight logarithmically spaced energy bins per decade were chosen. The initial input model file was generated using ‘make4fglxml.py’3, including all 4FGL-DR2 catalog sources [66] within of the ROI center. Following the standard methodology, the “Galactic diffuse emission model (gll_iem_v07.fits) and extra-galactic isotropic diffuse emission (iso_P8R3_SOURCE_V2_v1.txt) were included in the model file”.
The steps followed to calculate the ∼12 years average -ray flux of the source are discussed below. All sources’ normalizations and spectral parameters within , and only normalizations of sources up to away from the ROI center were left to vary after the initial optimization using the ‘optimize’ method of Fermipy. Furthermore, the Galactic and isotropic diffuse backgrounds’ normalizations and the spectral index of the Galactic diffuse background were left free. Furthermore, we froze all spectral parameters, including normalization for sources with TS and value less than counts. We generated a TS map and found additional sources in the ROI using the task find_sources. Three new sources (PS J0136.3-4707 (RA: deg, Dec: deg), PS J0158.6-5007 (RA: deg, Dec: deg) and PS J0230.2-5234 (RA: deg, Dec: deg)) with were detected within the ROI and were added to the model. The target source was modeled using simple power law (PL: Equation (1)) and log-parabola (LP: Equation (2)) models:
Here, is the differential flux in photon cm s MeV, N is normalization factor in photon cm s MeV, E is the energy, and are the scale and break value, respectively, in the unit of MeV, and are the spectral parameters. Similar to the 10 years averaged -ray spectrum [66], a significant curvature was noticed in the ∼12 years averaged -ray spectrum with the two times the difference in log-likelihood value, for log-parabola and power law () greater than 9.
The weekly averaged -ray lightcurve was created in 100 MeV to 100 GeV, with the best fit model obtained for the ∼12 years data set considering a power law spectrum for PKS 0208-512. We used the publicly available code ‘like_lc.pl’ script4 for the lightcurve creation. In each lightcurve bin, the spectral parameters and normalization of PKS 0208-512, the normalization of all sources within of the ROI center, and Galactic and isotropic emission’s normalization were left to vary. The target source is considered to be detected if the (detection significance of ∼3). The average -ray source flux for different activity states were derived following the similar methodology used for the entire data set’s spectral analysis. The spectral parameters and normalizations of the sources within , the normalizations of all sources within of the ROI center, and the normalizations of Galactic and isotropic emission models were left to vary. Furthermore, the Galactic diffuse background template’s spectral index was kept frozen to the ∼12 years averaged value. For different activity states, the -ray SEDs in 100 MeV–100 GeV were constructed in seven energy bands using the sed tool of Fermipy.
2.2. X-ray Data
We used data from the “Swift X-ray Telescope” (Swift-XRT; Burrows et al. [67]), which covers the energy range of 0.3–10 keV. The data from two payloads on AstroSat, namely, the “Soft X-ray Telescope” (SXT; [68]) and the “Large Area X-ray Proportional Counter” (LAXPC; [69,70]) were also used in this work. AstroSat SXT and LAXPC cover the energy range from 0.3 to 8 keV and 3–80 keV, respectively.
2.2.1. Swift-XRT
The online ‘Swift-XRT data products generator’ was used to create the lightcurve with one bin per observation [71] and spectral data products [72] for different activity states in the energy range of 0.3–10 keV. This facility downloads data and chooses a suitable source and background regions depending upon the source count. To identify intervals affected by pile up, the tool first search for times where the count rate within a 30 pixel radius circular region centerd on the source is above 0.6 counts s in photon counting (PC) mode or 150 counts s in window timing (WT) mode. After that, it accordingly chooses the source and background region of the annular shape in PC mode or a box annulus for WT mode [72]. In our study, we used photon counting (PC) mode data. The source had only two WT mode observations. Furthermore, we used spectral data products, and the source spectra were binned to have 20 counts per bin using grppha. A simple power law model with photoelectric absorption (phabs) was used to fit the extracted spectrum using XSpec version: 12.10.1 [73]. The photoelectric absorption cross-sections and abundance were set using ‘xsect bcmc’ and ‘abund wilm’ command, respectively. For the fitting, a Galactic absorption value of cm−2 [74] was used. We used the ‘cflux’ routine of XSpec to estimate the 0.3–10 keV source flux and photon index.
2.2.2. AstroSat SXT and LAXPC
The source was observed by SXT for ksec and by LAXPC for ksec on 29–30 October 2016. Furthermore, observations were carried out by SXT for ksec and by LAXPC for ksec on 24–25 December 2019. Similar to Bhattacharya et al. [28] the “Level 1 SXT data were analysed using sxtpipeline, which is a part of the latest SXT software as1sxtlevel2-1.4b. The clean events were merged using the sxtpyjuliamerger_v01. A circular region of 14 arcmin radius was used as a source region, and for the background, the user-provided SkyBkg_comb_EL3p5_Cl_Rd16p0_v01.pha file was used. The ancillary response file was created by using sxteefmodule_v02.” Spectrum for the source was created in the energy range of 0.6–7.0 and 0.4–7.0 keV during AS1 and AS2, respectively. The source spectrum was binned to have 35 counts per bin using grppha. A power law with photoelectric absorption was used to model the source spectra. An instrument systematic value of 0.03 was considered during modeling.
LAXPC data were analysed using the analysis software laxpc_soft (Format A) package (release version: 4 August 2020, available at the AstroSat Science Support Cell (ASSC)5). Standard procedures were used to reduce the Level 1 data [70,75]. The source was found to be faint, and hence we followed the faint source analysis procedure as recommended by the instrument team. For this, following the methodology as explained in the readme file (README_BACKLCF_L20) provided in the software package, the lightcurve and spectra for the source and the background were created. We used the layer 1 data of PCU unit 20 with an energy grouping factor of . The source was modeled using a power law with photoelectric absorption. An instrument systematic value of 0.03 was considered during modeling. We also modeled the X-ray spectra of the source as log-parabola with photoelectric absorption for the Swift-XRT, AstroSat-SXT and LAXPC data. However, the power law with photoelectric absorption was found to better represent the source spectra for all the activity states.
2.3. UV/Optical/IR Data
For data in the UV/optical bands, we used both Swift-UVOT [76] and the “Ultra-Violet Imaging Telescope” (UVIT; [77,78]) on-board AstroSat. We carried out the Swift-UVOT data analysis using the HEASoft package (v), and 20201215 version of caldb. Following Bhattacharya et al. [28], “uvotimsum task was used to merge the various observations during the particular epoch. For photometry, a circular source region with 5 arcsec radius centerd at the source position and a background annular region with inner and outer radii of 15 and 25 arcsec were used. uvotmaghist task was used to create the light curve, and the uvotsource task was used to obtain the source magnitude.” The magnitudes were converted to AB flux (erg cm s) using the AB zero points taken from Breeveld et al. [79]. The Galactic extinction was calculated using [80,81].
PKS 0208-512 was observed by AstroSat-UVIT during AS1 and AS2 epochs. During AS1, we have observations in FUV filters CaF2-1 (F1; Å) and Sapphire (F3; Å), and in NUV filters NUVN2 (F6; Å) and NUVB15 (F2; Å). However, during the second observing period, we have observations only in FUV filters. Following Bhattacharya et al. [28], the “science ready level-2 (L2) images provided to the user by the Indian Space Science Data Center (ISSDC) were used to carry out standard photometry using IRAF6.” For photometry, a circular aperture of 3 arcsec radius centerd at the source position was used, and the background was estimated from the source-free region. We calculated the fluxes from the derived source counts using the conversion factors provided in [78]. The estimated fluxes were corrected for Galactic extinction and for the chosen aperture size using Table 11 of Tandon et al. [82]. During AS2, the source was not detected in the UVIT observations. In this work, we also used data (in V, B, R, J, K filters) from SMARTS [83], from the Catalina Real-Time Transient Survey (CRTS; Drake et al. [84]; in the V-band) and from the Wide-field Infrared Survey Explorer (WISE; [85]) in , , 12, and 22 microns, respectively.
2.4. Archival Data during EGRET Observing Period
In this work, we used the EGRET observations of PKS 0208-512 taken from Stacy et al. [50], spanning the entire nine years of the CGRO mission (1991–2000). The average duration of the pointed viewing period of CGRO was 2 to 3 weeks. There are 15 observations, with 13 detections and two upper limits. We derived an average -ray flux ph cm s from the detected flux values of the source. The average power law photon index is . Using this information, we created the butterfly diagram in the -ray band (100 MeV to 30 GeV), which is used for the broad-band spectral study. The quasi-simultaneous X-ray data during EGRET time used in this work is presented in Table 1. Furthermore, we used the UV observations from the International Ultraviolet Explorer (IUE) included in Stacy et al. [45].

Table 1.
Quasi-simultaneous multi-band flux during EGRET time.
3. Results and Discussion
Using the Fermi-LAT data, we estimated the ∼12 years average -ray flux of the source (Table 2) as described in Section 2.1. Considering this average -ray flux, we noticed an enhancement in the -ray emission of the source after 2018 April 22 (MJD 58230) in the weekly averaged -ray lightcurve (Figure 1). After MJD 58230, the weekly averaged flux was greater than the ∼12 years average flux value, only at a very few occasions equal to ∼12 years average -ray flux. During the period prior MJD 58230, the weekly averaged -ray flux was found to be most of the time equal/below the ∼12 years average -ray flux. Furthermore, we carried out -ray analysis and estimated the average -ray flux (Table 2) considering initial ∼10 years of observations (MJD 54682–MJD 58230). During this period, with more than a decade of observations by Fermi-LAT, it was found that PKS 0208-512 showed at least an order of magnitude lower -ray flux during the initial ∼10 years of Fermi operation (State 1 (S1: MJD 54682–MJD 58230)) compared to its average flux as observed by its predecessor EGRET. The source was observed by AstroSat on 29–30 October 2016 (AS1), which falls under the S1 epoch. Furthermore, it was observed through AstroSat after MJD 58230 during 24–25 December 2019 (AS2) during the high-activity phase of the source. The average -ray flux and corresponding spectra for the epochs AS1 and AS2 were also estimated (Table 2). The EGRET time epoch was chosen by considering the total time period of observation (1991–2000) of PKS 0208-512 by EGRET detector. The spectral parameters ( and ), detection significance () and spectral curvature () for all activity states are given in Table 2. It is to be noted that the study carried out by Khatoon et al. [60] using only Fermi-LAT observations, qualitatively reports that the source exhibits a low -ray flux state for a decade during Fermi era.
Table 2.
Fermi-LAT analysis for different activity states.
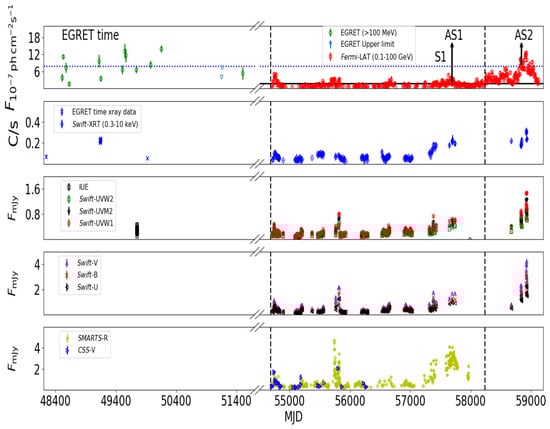
Figure 1.
Multi-band lightcurve of PKS 0208-512. The -ray data before the broken axis is from Stacy et al. [50]. The references of the X-ray data during the EGRET time are given in Table 1. The UV data during the EGRET time is taken from Stacy et al. [45]. The other multi-band data descriptions are as follows: variation of 0.1–100 GeV -ray flux from Fermi-LAT in weekly bins, X-ray flux: Swift-XRT data products generator, UV/optical data: Swift-UVOT, SMARTS and CRTS. The dotted blue and solid black horizontal lines represents the EGRET and Fermi-LAT average -ray flux, respectively. The black dashed vertical lines separate the activity states of the source in -ray band.
The minimum and the maximum -ray flux of the source during EGRET era were ph cm sec and ph cm sec, respectively. The two upper limits during the EGRET observation period were during the narrow field of view of the detector [50]. The maximum flux of the source during Fermi S1 state is ph cm sec. The minimum flux of the source during Fermi S1 state is ph cm sec.
We noticed that even though there are short-term variations during the initial ∼10 years of Fermi-LAT observation, the baseline activity of the source in the -ray band has significantly decreased from EGRET time, which indicates the presence of long-term variability in this source (Figure 1). Furthermore, an enhancement in the -ray emission was noticed after April 2018, wherein the source was in a high-activity state from around October 2019 to September 2020. During this period, the weekly average -ray flux of the source crossed the EGRET average flux. After this high flaring activity, the source flux decreased and reached the ∼12 years averaged -ray flux. Using the ∼12 years of Fermi-LAT observations, we created -ray spectra of the source for the three different activity states during Fermi era (S1, AS1 and AS2) following the procedures as described in Section 2.1. The source spectra were found to be significantly curved for 12 years average state and S1 (Table 2). It is to be noted that the source was not detected (upper limit = ph cm s) in the -ray band during the two days of the first AstroSat observation period. Hence, the -ray analysis during the first AstroSat observation was carried for ∼20 days to detect the source significantly. The X-ray observations with Swift-XRT during S1 were used to create the 0.3–10.0 keV spectra of the source. The estimated unabsorbed flux was found to be erg cm−2s−1 with photon index and = . The results of the multi-band analysis of the source carried out during various epochs are given in Table 2, Table 3, Table 4 and Table 5, respectively.
Table 3.
AstroSat-SXT and LAXPC analysis results.
Table 4.
Swift-UVOT results for different activity states.
Table 5.
AstroSat-UVIT analysis results.
3.1. Broad-Band SED Modeling
The study carried out by Stacy et al. [50] showed a clear indication of spectral hardening of the source with an increase in the intensity. The -ray emission from PKS 0208-512 as observed by EGRET was well-explained by the inverse Compton scattering of the external soft photons by the relativistic jet electrons [47,48]. However, we could not find from the literature any earlier study on the broad-band SED of the source during the EGRET time. Though there were efforts to study the broad-band SED during the Fermi era, most of the studies were focused on the flaring properties of the source (e.g., [56,57,58,90]). The other studies were limited to the initial ∼1 year of Fermi-LAT observations [39,91,92]. The study carried out by Khatoon et al. [60] used Fermi-LAT data from 4 September 2017 to 20 July 2020; however, they aimed to study the temporal and spectral behavior of the source during the 2019–2020 flaring states. The broad-band SED modeling of PKS 0208-512 carried out by Khatoon et al. [60] suggests that the -ray emission during quiescent state (∼2 weeks) is well represented by EC scattering of IR photons from the dusty torus. Whereas for the two flaring periods (∼1 and ∼1.5 month), the -ray emission demands additional target photons from BLR in addition to the IR. Their study finds that the emission region is nearer to the edge of BLR during flares, and for the quiescent state, it is away from the BLR. Their study states that this observed inference strongly depends on a few assumptions (e.g., equipartition) employed in their SED model. It should be noted that the broad-band SED modeling on the long-term low -ray activity states during the Fermi era was not carried out in earlier studies.
In this work, we constructed quasi-simultaneous broad-band SEDs during the EGRET time, S1, AS1, and AS2 epochs. It should be noted that the available IR observations of PKS 0208-512 from WISE from 20 June 2010 to 19 December 2010 were used. This IR observation period falls under the S1 state. There was no IR observation (WISE data) present during EGRET time, AS1 and AS2. However, we used this observation during the other epochs with the underlying assumptions that the IR emission primarily originated in the torus of this source and the torus emission did not change appreciably during the EGRET to Fermi observing period. The radio data used are archival non-simultaneous observations taken from ASDC SED Builder [93]. It is to be noted that the non-simultaneous radio data were not used during SED modeling. The radio data were overplotted with the model SED curves in Figure 2 and Figure 3. Apart from IR and radio, observations at other energy bands used for SED modeling during various states are near-simultaneous. The SED modeling was performed using the one-zone leptonic model described in Bhattacharya et al. [28]. We considered a broken power law energy distribution of jet electrons given by
where, , , and are the minimum, maximum, and break Lorentz factors, respectively. and represent the particle spectral indices before and after the break Lorentz factor. While modeling the SEDs, the emission region was considered to be outside the BLR region for all the epochs following earlier findings (e.g., [37,56,57]). The torus temperature was held fixed at 1000 K. This torus temperature was consistent with the position of the IR-optical bump in the observed SED. The jet viewing angle adopted in this study is in accordant with earlier studies [56,91,92]. Figure 2 represents the broad-band SEDs of the source during EGRET time and State 1. The broad-band SEDs during two AstroSat observations are given in Figure 3. The values of all SED parameters for different epochs are provided in Table 6.
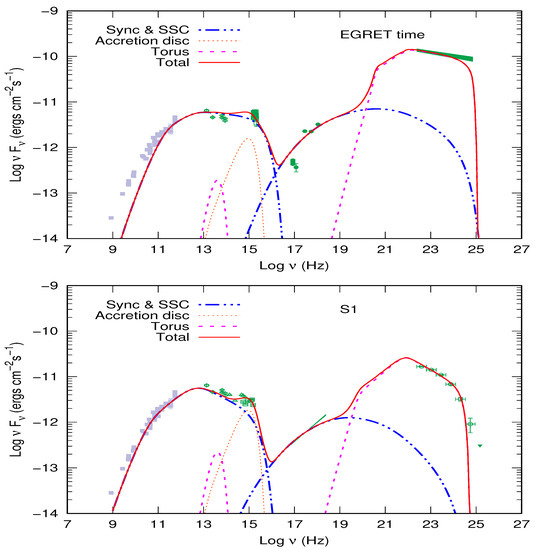
Figure 2.
Broad-band SED of PKS 0208-512 during EGRET time and State 1. In the first figure, the filled butterfly diagram: EGRET time, filled circle: X-ray data during EGRET time (see Table 1 for references) and open square: IUE data. For the rest of figures, the data descriptions are as follows: Open circle: Fermi-LAT, filled butterfly diagram: Swift-XRT, open square: Swift-UVOT, filled circle: AstroSat UVIT, unfilled upper-triangle: SMARTS, open diamond: WISE, filled square: archival radio data taken from ASDC SED Builder [93] and downward triangle: upper limit value. The different lines represent the contribution of individual emission component. The solid line represents the total (Sync+SSC+accretion disk + BLR and dusty torus) SED model contribution.
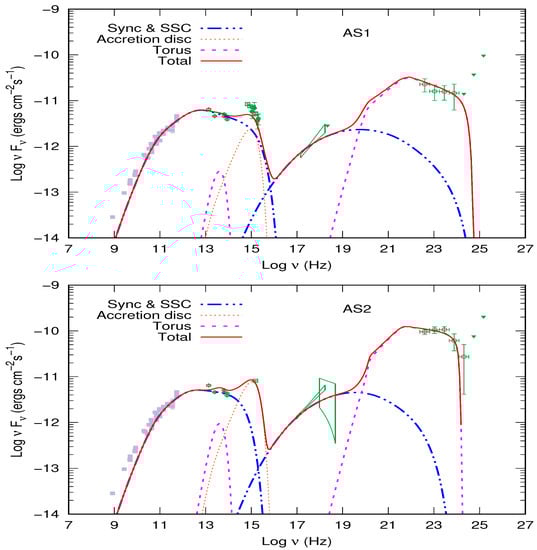
Figure 3.
Broad-band SED of PKS during AS1 and AS2. Open circle: Fermi-LAT, unfilled butterfly: AstroSat SXT and LAXPC, open square: Swift-UVOT, unfilled upper-triangle: SMARTS, open diamond: WISE, filled square: archival radio data taken from ASDC SED Builder [93] and downward triangle: upper limit value. The different lines represent the contribution of individual emission component. The solid line represents the total (Sync+SSC+accretion disk + BLR and dusty torus) SED model contribution.
Table 6.
Model parameters for the SED.
From SED modeling, we noticed that the X-ray emission is well-explained by the SSC emission, while the -ray emission is well-explained by the inverse comptonization of the photons from the dusty torus by the relativistic jet electrons. In consistent with earlier studies [39,56,57,60], we also found the presence of accretion disk component to be necessary to explain the observed emission during different epochs.
Derived SED Parameters during Various Epochs
The SED modeling during four epochs suggests that the location of the emitting blob in the jet was nearer to the black hole during high activity states (EGRET and AS2) than in the low-activity states (S1 and AS1) of the source. In all four epochs, the jet particle spectrum is well-explained by a broken power law. The particle spectrum before break energy is found to be softer during EGRET time than in other epochs, while during AS2, the spectrum is much flatter than in other epochs (Table 6). The particle spectrum after break energy is found to be flatter during high activity states (EGRET and AS2) than the low-activity states (S1 and AS1). The minimum and maximum jet electron Lorentz factors are found to be higher during EGRET time than in other epochs (Table 6). A significantly higher (∼ factor of five) equi-partition parameter (particle energy/magnetic energy) value is observed during high activity states (EGRET and AS2) than in the low activity states (S1 and AS1) (Table 6). This result indicates more energy content to the jet particles than the magnetic field during high activity states.
4. Conclusions
Using the archival data of the blazar PKS 0208-512 from EGRET and Fermi-LAT we established that the source was in relatively higher flux states during the EGRET time as compared to the Fermi era. The source was also observed with the AstroSat and Swift in X-rays and in the UV/optical bands. To understand the possible origin of the different flux states of the source we constructed the SEDs and modeled them using one-zone leptonic blazar emission model. It was clearly found that the jet was particle dominated, i.e, the energy content of particles was more than the energy content of the magnetic field. During the EGRET time and the AS2 state, the energy content in the particle was much higher than that in the magnetic field as compared to the S1 and AS1 flux states. Thus, over the long term we noticed that the jet of PKS 0208-512 passes through different evolutionary phases where the transfer of energy to the particles from the bulk energy of the jet vary from high (EGRET) to low (S1 and AS1) and high (AS2) again. This could be due to the passing of shock through the jet giving more energetic particles through shock acceleration process. However, as the shock is generally a transient phenomenon, it is difficult to explain the prolonged high flux state for years during EGRET time. The AS2 state where a flare in -ray is clearly seen could be due to the passing of shock. However, a high activity state over around a year was observed during the later phase of Fermi-LAT observation. Therefore, the long-term behavior of the source needs further investigation with better coverage in multi-band, which will be useful to better understand the dynamics of the relativistic jet over the longer time scale.
Author Contributions
Conceptualization, K.M.A., D.B. and S.B.; Data curation, K.M.A.; Formal analysis, K.M.A. and S.B.; Funding acquisition, D.B.; Investigation, K.M.A., D.B., S.B., N.B. and C.S.S.; Methodology, K.M.A., D.B., S.B. and N.B.; Project administration, D.B.; Supervision, D.B.; Writing—original draft, K.M.A. and D.B.; Writing—review & editing, D.B., S.B. and C.S.S. All authors have read and agreed to the published version of the manuscript.
Funding
The first author (KM) acknowledges TMA Pai Ph. D scholarship program, MAHE. The author(s) acknowledge the financial support of ISRO under AstroSat archival Data utilization program.
Institutional Review Board Statement
Not applicable.
Informed Consent Statement
Not applicable.
Data Availability Statement
This work has made use of public Fermi-LAT data available at https://fermi.gsfc.nasa.gov/cgi-bin/ssc/LAT/LATDataQuery.cgi (accessed on 29 January 2021), Swift- XRT lightcurve available at https://www.swift.psu.edu/monitoring/ (accessed on 29 January 2021) data and software provided by the High Energy Astrophysics Science Archive Research Center (HEASARC) available at https://heasarc.gsfc.nasa.gov/docs/software/lheasoft/ (accessed on 3 January 2020), Swift-UVOT data available at https://heasarc.gsfc.nasa.gov/cgi-bin/W3Browse/w3browse.pl (accessed on 20 October 2020), public data from the CSS survey available at http://nesssi.cacr.caltech.edu/DataRelease/ (accessed on 20 October 2020), SMARTS data at http://www.astro.yale.edu/smarts/glast/home.php (accessed on 20 October 2020) and the NASA/IPAC Extragalactic Database (NED). This work has also made use of data from the AstroSat mission of the ISRO, archived at the ISSDC (https://astrobrowse.issdc.gov.in/astroarchive/archive/Home.jsp (accessed on 20 October 2020)). AstroSat data will be shared on request to the corresponding author with the permission of ISRO.
Acknowledgments
This publication uses the data from the AstroSat mission of the Indian Space Research Organisation (ISRO), archived at the Indian Space Science Data Centre (ISSDC). This work has been performed utilizing the calibration data-bases and auxiliary analysis tools developed, maintained and distributed by AstroSat-SXT team with members from various institutions in India and abroad. This work has made use of public Fermi-LAT data obtained from the Fermi Science Support Center (FSSC), provided by NASA Goddard Space Flight Center. This work has made use of public data from CSS survey. The CSS survey is funded by the National Aeronautics and Space Administration under Grant No. NNG05GF22G issued through the Science Mission Directorate Near-Earth Objects Observations Program. The CRTS survey is supported by the U.S. National Science Foundation under grants AST-0909182 and AST-1313422. This research has made use of the NASA/IPAC Extra-galactic Database (NED), which is operated by the Jet Propulsion Laboratory, California Institute of Technology, under contract with the National Aeronautics and Space Administration. This research has made use of data and/or software provided by the High Energy Astrophysics Science Archive Research Center (HEASARC), which is a service of the Astrophysics Science Division at NASA/GSFC and the High Energy Astrophysics Division of the Smithsonian Astrophysical Observatory. Manipal Centre for Natural Sciences-Centre of Excellence, Manipal Academy of Higher Education (MAHE) is acknowledged for facilities and support.
Conflicts of Interest
The authors declare no conflict of interest.
Notes
| 1 | https://fermi.gsfc.nasa.gov/cgi-bin/ssc/LAT/LATDataQuery.cgi (accessed on 29 January 2021). |
| 2 | https://fermipy.readthedocs.io/en/latest/ (accessed on 10 April 2020). |
| 3 | https://fermi.gsfc.nasa.gov/ssc/data/analysis/user/ (accessed on 10 April 2020). |
| 4 | https://fermi.gsfc.nasa.gov/ssc/data/analysis/user/ (accessed on 10 April 2020). |
| 5 | http://astrosat-ssc.iucaa.in/?q=data_and_analysis (accessed on 20 October 2020). |
| 6 | IRAF is distributed by the National Optical Astronomy Observatory, which is operated by the Association of Universities for Research in Astronomy (AURA) under a cooperative agreement with the National Science Foundation. |
References
- Urry, C.M.; Padovani, P. Unified Schemes for Radio-Loud Active Galactic Nuclei. PASP 1995, 107, 803. [Google Scholar] [CrossRef]
- Mattox, J.R.; Wagner, S.J.; Malkan, M.; McGlynn, T.A.; Schachter, J.F.; Grove, J.E.; Johnson, W.N.; Kurfess, J.D. An Intense Gamma-Ray Flare of PKS 1622-297. ApJ 1997, 476, 692. [Google Scholar] [CrossRef]
- Hartman, R.C.; Villata, M.; Balonek, T.J.; Bertsch, D.L.; Bock, H.; Böttcher, M.; Carini, M.T.; Collmar, W.; De Francesco, G.; Ferrara, E.C.; et al. Day-Scale Variability of 3C 279 and Searches for Correlations in Gamma-Ray, X-ray, and Optical Bands. ApJ 2001, 558, 583–589. [Google Scholar] [CrossRef]
- Boettcher, M. Coordinated Multiwavelength Observations and Spectral Variability Modeling of Gamma-Ray Blazars. In Proceedings of the 5th INTEGRAL Workshop on the INTEGRAL Universe, Munich, Germany, 16–20 February 2004; Schoenfelder, V., Lichti, G., Winkler, C., Eds.; ESA Special Publication: Paris, France, 2004; Volume 552, p. 543. [Google Scholar]
- Foschini, L.; Bonnoli, G.; Ghisellini, G.; Tagliaferri, G.; Tavecchio, F.; Stamerra, A. Fermi/LAT detection of extraordinary variability in the gamma-ray emission of the blazar PKS 1510-089. A&A 2013, 555, A138. [Google Scholar] [CrossRef]
- Orienti, M.; D’Ammando, F.; Giroletti, M.; Finke, J.; Ajello, M.; Dallacasa, D.; Venturi, T. Exploring the multiband emission of TXS 0536+145: The most distant γ-ray flaring blazar. MNRAS 2014, 444, 3040–3051. [Google Scholar] [CrossRef]
- Abdo, A.A.; Ackermann, M.; Ajello, M.; Allafort, A.; Amin, M.A.; Baldini, L.; Barbiellini, G.; Bastieri, D.; Bechtol, K.; Bellazzini, R.; et al. Gamma-Ray Flaring Activity from the Gravitationally Lensed Blazar PKS 1830-211 Observed by Fermi LAT. ApJ 2015, 799, 143. [Google Scholar] [CrossRef]
- Böttcher, M. Progress in Multi-wavelength and Multi-Messenger Observations of Blazars and Theoretical Challenges. Galaxies 2019, 7, 20. [Google Scholar] [CrossRef]
- Stocke, J.T.; Morris, S.L.; Gioia, I.M.; Maccacaro, T.; Schild, R.; Wolter, A.; Fleming, T.A.; Henry, J.P. The Einstein Observatory Extended Medium-Sensitivity Survey. II - The optical identifications. ApJs 1991, 76, 813–874. [Google Scholar] [CrossRef]
- Stickel, M.; Padovani, P.; Urry, C.M.; Fried, J.W.; Kuehr, H. The complete sample of 1 Jansky BL Lacertae objects. I - Summary properties. ApJ 1991, 374, 431–439. [Google Scholar] [CrossRef]
- Ghisellini, G.; Maraschi, L.; Tavecchio, F. The Fermi blazars’ divide. MNRAS 2009, 396, L105–L109. [Google Scholar] [CrossRef]
- Marscher, A.P.; Gear, W.K. Models for high-frequency radio outbursts in extragalactic sources, with application to the early 1983 millimeter-to-infrared flare of 3C 273. ApJ 1985, 298, 114–127. [Google Scholar] [CrossRef]
- Begelman, M.C.; Sikora, M.; Giommi, P.; Barr, P.; Garilli, B.; Gioia, I.M.; Maccacaro, T.; Maccagni, D.; Schild, R.E. Inverse Compton scattering of ambient radiation by a cold relativistic jet—A source of beamed, polarized continuum in blazars? ApJ 1987, 322, 650–661. [Google Scholar] [CrossRef]
- Dermer, C.D.; Schlickeiser, R. Model for the High-Energy Emission from Blazars. ApJ 1993, 416, 458. [Google Scholar] [CrossRef]
- Sikora, M.; Begelman, M.C.; Rees, M.J. Comptonization of diffuse ambient radiation by a relativistic jet: The source of gamma rays from blazars? ApJ 1994, 421, 153–162. [Google Scholar] [CrossRef]
- Błażejowski, M.; Sikora, M.; Moderski, R.; Madejski, G.M. Comptonization of Infrared Radiation from Hot Dust by Relativistic Jets in Quasars. ApJ 2000, 545, 107–116. [Google Scholar] [CrossRef]
- Dermer, C.D.; Schlickeiser, R.; Mastichiadis, A. High-energy gamma radiation from extragalactic radio sources. A&A 1992, 256, L27–L30. [Google Scholar]
- Ghisellini, G.; Tavecchio, F. Canonical high-power blazars. MNRAS 2009, 397, 985–1002. [Google Scholar] [CrossRef]
- Liao, N.H.; Bai, J.M. Rapid high-amplitude γ-ray variability in blazar PKS 0507+17. New A 2015, 34, 134–138. [Google Scholar] [CrossRef]
- Ackermann, M.; Anantua, R.; Asano, K.; Baldini, L.; Barbiellini, G.; Bastieri, D.; Becerra Gonzalez, J.; Bellazzini, R.; Bissaldi, E.; Blandford, R.D.; et al. Minute-timescale >100 MeV γ-Ray Variability during the Giant Outburst of Quasar 3C 279 Observed by Fermi-LAT in 2015 June. ApJ 2016, 824, L20. [Google Scholar] [CrossRef]
- Meyer, M.; Scargle, J.D.; Blandford, R.D. Characterizing the Gamma-Ray Variability of the Brightest Flat Spectrum Radio Quasars Observed with the Fermi LAT. ApJ 2019, 877, 39. [Google Scholar] [CrossRef]
- Aharonian, F.; Akhperjanian, A.G.; Bazer-Bachi, A.R.; Behera, B.; Beilicke, M.; Benbow, W.; Berge, D.; Bernlöhr, K.; Boisson, C.; Bolz, O.; et al. An Exceptional Very High Energy Gamma-Ray Flare of PKS 2155-304. ApJ 2007, 664, L71–L74. [Google Scholar] [CrossRef]
- Albert, J.; Aliu, E.; Anderhub, H.; Antoranz, P.; Armada, A.; Baixeras, C.; Barrio, J.A.; Bartko, H.; Bastieri, D.; Becker, J.K.; et al. Variable Very High Energy γ-Ray Emission from Markarian 501. ApJ 2007, 669, 862–883. [Google Scholar] [CrossRef]
- Aleksić, J.; Antonelli, L.A.; Antoranz, P.; Backes, M.; Barrio, J.A.; Bastieri, D.; Becerra González, J.; Bednarek, W.; Berdyugin, A.; Berger, K.; et al. MAGIC Discovery of Very High Energy Emission from the FSRQ PKS 1222+21. ApJ 2011, 730, L8. [Google Scholar] [CrossRef]
- Arlen, T.; Aune, T.; Beilicke, M.; Benbow, W.; Bouvier, A.; Buckley, J.H.; Bugaev, V.; Cesarini, A.; Ciupik, L.; Connolly, M.P.; et al. Rapid TeV Gamma-Ray Flaring of BL Lacertae. ApJ 2013, 762, 92. [Google Scholar] [CrossRef]
- Tanaka, Y.T.; Stawarz, Ł.; Thompson, D.J.; D’Ammando, F.; Fegan, S.J.; Lott, B.; Wood, D.L.; Cheung, C.C.; Finke, J.; Buson, S.; et al. Fermi Large Area Telescope Detection of Bright γ-Ray Outbursts from the Peculiar Quasar 4C +21.35. ApJ 2011, 733, 19. [Google Scholar] [CrossRef]
- Troitskiy, I.; Morozova, D.; Jorstad, S.; Larionov, V.; Marscher, A.; Agudo, I.; Blinov, D.; Smith, P.; Troitskaya, Y. Multi-Frequency Monitoring of the Flat Spectrum Radio Quasar PKS 1222+216 in 2008-2015. Galaxies 2016, 4, 72. [Google Scholar] [CrossRef]
- Bhattacharya, D.; Mohana A, K.; Bhattacharyya, S.; Bhatt, N.; Stalin, C.S. Multiwavelength study of different flaring and low-activity states of blazar 4C+21.35. MNRAS 2021, 500, 1127–1138. [Google Scholar] [CrossRef]
- Bhattacharya, D.; Misra, R.; Rao, A.R.; Sreekumar, P. The uncorrelated long-term γ-ray and X-ray variability of blazars and its implications on disc-jet coupling. MNRAS 2013, 431, 1618–1624. [Google Scholar] [CrossRef][Green Version]
- Hartman, R.C.; Bertsch, D.L.; Bloom, S.D.; Chen, A.W.; Deines-Jones, P.; Esposito, J.A.; Fichtel, C.E.; Friedlander, D.P.; Hunter, S.D.; McDonald, L.M.; et al. The Third EGRET Catalog of High-Energy Gamma-Ray Sources. ApJs 1999, 123, 79–202. [Google Scholar] [CrossRef]
- Thompson, D.J.; Bertsch, D.L.; Dingus, B.L.; Esposito, J.A.; Etienne, A.; Fichtel, C.E.; Friedlander, D.P.; Hartman, R.C.; Hunter, S.D.; Kendig, D.J.; et al. The Second EGRET Catalog of High-Energy Gamma-Ray Sources. ApJs 1995, 101, 259. [Google Scholar] [CrossRef]
- Ackermann, M.; Ajello, M.; Allafort, A.; Antolini, E.; Atwood, W.B.; Axelsson, M.; Baldini, L.; Ballet, J.; Barbiellini, G.; Bastieri, D.; et al. The Second Catalog of Active Galactic Nuclei Detected by the Fermi Large Area Telescope. ApJ 2011, 743, 171. [Google Scholar] [CrossRef]
- Bhattacharya, D.; Mohana A, K.; Gulati, S.; Bhattacharyya, S.; Bhatt, N.; Sreekumar, P.; Stalin, C.S. Unusual long-term low-activity states of EGRET blazars in the Fermi era. MNRAS 2017, 471, 5008–5017. [Google Scholar] [CrossRef]
- Valverde, J.; Horan, D.; Bernard, D.; Fegan, S.; Fermi-LAT Collaboration; Abeysekara, A.U.; Archer, A.; Benbow, W.; Bird, R.; Brill, A.; et al. A Decade of Multiwavelength Observations of the TeV Blazar 1ES 1215+303: Extreme Shift of the Synchrotron Peak Frequency and Long-term Optical-Gamma-Ray Flux Increase. ApJ 2020, 891, 170. [Google Scholar] [CrossRef]
- Gulati, S.; Bhattacharya, D.; Bhattacharyya, S.; Bhatt, N.; Stalin, C.S.; Agrawal, V.K. Multiwavelength monitoring of NGC 1275 over a decade: Evidence of a shift in synchrotron peak frequency and long-term multiband flux increase. MNRAS 2021, 503, 446–457. [Google Scholar] [CrossRef]
- Mohana, A.K.; Bhattacharya, D.; Misra, R.; Bhattacharyya, S.; Bhatt, N. Long-term multiband monitoring of blazar 3C 66A: Evidence of the two distinct states with different baseline flux. MNRAS 2021, 507, 3653–3659. [Google Scholar] [CrossRef]
- Costamante, L.; Cutini, S.; Tosti, G.; Antolini, E.; Tramacere, A. On the origin of gamma-rays in Fermi blazars: Beyondthe broad-line region. MNRAS 2018, 477, 4749–4767. [Google Scholar] [CrossRef]
- Blandford, R.; Meier, D.; Readhead, A. Relativistic Jets from Active Galactic Nuclei. ARA&A 2019, 57, 467–509. [Google Scholar] [CrossRef]
- Abdo, A.A.; Ackermann, M.; Ajello, M.; Antolini, E.; Baldini, L.; Ballet, J.; Barbiellini, G.; Baring, M.G.; Bastieri, D.; Bechtol, K.; et al. Suzaku Observations of Luminous Quasars: Revealing the Nature of High-energy Blazar Emission in Low-level Activity States. ApJ 2010, 716, 835–849. [Google Scholar] [CrossRef]
- Healey, S.E.; Romani, R.W.; Cotter, G.; Michelson, P.F.; Schlafly, E.F.; Readhead, A.C.S.; Giommi, P.; Chaty, S.; Grenier, I.A.; Weintraub, L.C. CGRaBS: An All-Sky Survey of Gamma-Ray Blazar Candidates. ApJ 2008, 175, 97–104. [Google Scholar] [CrossRef]
- Bolton, J.G.; Gardner, F.F.; Mackey, M.B. The Parkes catalogue of radio sources, declination zone −20 deg to −60 deg. ApJ 1964, 17, 340. [Google Scholar] [CrossRef]
- Bertsch, D.L.; Dingus, B.L.; Fichtel, C.E.; Hartman, R.C.; Hunter, S.D.; Kanbach, G.; Kniffen, D.A.; Lin, Y.C.; Mattox, J.R.; Mayer-Hasselwander, H.A.; et al. Detection of Gamma-Ray Emission from the Quasar PKS 0208-512. ApJl 1993, 405, L21. [Google Scholar] [CrossRef]
- Blom, J.J.; Bennett, K.; Bloemen, H.; Collmar, W.; Diehl, R.; Hermsen, W.; Iyudin, A.F.; Schoenfelder, V.; Stacy, J.G.; Steinle, H.; et al. PKS 0208-512 detected at MeV energies by COMPTEL: A new “MeV-blazar” candidate. A&A 1995, 298, L33. [Google Scholar]
- Blom, J.J.; Bennett, K.; Bloemen, H.; Collmar, W.; Diehl, R.; Hermsen, W.; Iyudin, A.F.; Lichti, G.G.; Morris, D.; Schoenfelder, V.; et al. CGRO observations of the MeV-bright blazars PKS 0208-512 and GRO J0516-609. A&AS 1996, 120, 507–510. [Google Scholar]
- Stacy, J.G.; Vestrand, W.T.; Sreekumar, P.; Bonnell, J.; Kubo, H.; Hartman, R.C. First Cycle 4 multiwavelength observations of the gamma-ray quasar PKS 0208-512. A&AS 1996, 120, 549–552. [Google Scholar]
- Stacy, J.G.; Vestrand, W.T.; Streekumar, P.; Blom, J.J.; Mukherjee, R. The Gamma-ray Blazar PKS 0208-512 from MeV to GeV Energies. Int. Cosm. Ray Conf. 1997, 3, 105. [Google Scholar] [CrossRef]
- Bednarek, W. Inverse Compton scattering model for gamma-ray production in MeV blazars. MNRAS 1998, 294, 439–442. [Google Scholar] [CrossRef]
- Böttcher, M.; Pohl, M.; Schlickeiser, R. Transrelativistic pair plasmas in AGN jets. Astropart. Phys. 1999, 10, 47–68. [Google Scholar] [CrossRef][Green Version]
- Moskalenko, I.V.; Collmar, W. A pair plasma model for PKS 0208-512. Astrophys. Lett. Commun. 1999, 39, 113–116. [Google Scholar]
- Stacy, J.G.; Vestrand, W.T.; Sreekumar, P. The Gamma-Ray Blazar PKS 0208-512 from MeV to GeV Energies. ApJ 2003, 598, 216–231. [Google Scholar] [CrossRef]
- Whiting, M.T.; Majewski, P.; Webster, R.L. The Optical Emission from Gamma-Ray Quasars. PASA 2003, 20, 196–202. [Google Scholar] [CrossRef][Green Version]
- Schwartz, D.A.; Marshall, H.L.; Miller, B.P.; Worrall, D.M.; Birkinshaw, M.; Lovell, J.E.J.; Jauncey, D.L.; Perlman, E.S.; Murphy, D.W.; Preston, R.A. Results from a Complete Chandra Survey of Radio Jets. In Proceedings of the Active Galactic Nuclei: From Central Engine to Host Galaxy; Collin, S., Combes, F., Shlosman, I., Eds.; Astronomical Society of the Pacific Conference Series; Astronomical Society of the Pacific: San Francisco, CA, USA, 2003; Volume 290, p. 359. [Google Scholar]
- Nandikotkur, G.; Jahoda, K.M.; Hartman, R.C.; Mukherjee, R.; Sreekumar, P.; Böttcher, M.; Sambruna, R.M.; Swank, J.H. Does the Blazar Gamma-Ray Spectrum Harden with Increasing Flux? Analysis of 9 Years of EGRET Data. ApJ 2007, 657, 706–724. [Google Scholar] [CrossRef]
- Zhang, S.; Collmar, W.; Torres, D.F.; Wang, J.M.; Lang, M.; Zhang, S.N. INTEGRAL and Swift/XRT observations of the source PKS 0208-512. A&A 2010, 514, A69. [Google Scholar] [CrossRef]
- Perlman, E.S.; Georganopoulos, M.; Marshall, H.L.; Schwartz, D.A.; Padgett, C.A.; Gelbord, J.; Lovell, J.E.J.; Worrall, D.M.; Birkinshaw, M.; Murphy, D.W.; et al. Deep Multiwaveband Observations of the Jets of 0208-512 and 1202-262. ApJ 2011, 739, 65. [Google Scholar] [CrossRef]
- Chatterjee, R.; Nalewajko, K.; Myers, A.D. Implications of the Anomalous Outburst in the Blazar PKS 0208-512. ApJ 2013, 771, L25. [Google Scholar] [CrossRef]
- Nalewajko, K.; Begelman, M.C.; Sikora, M. Constraining the Location of Gamma-Ray Flares in Luminous Blazars. ApJ 2014, 789, 161. [Google Scholar] [CrossRef]
- Chen, X.; Chatterjee, R.; Zhang, H.; Pohl, M.; Fossati, G.; Böttcher, M.; Bailyn, C.D.; Bonning, E.W.; Buxton, M.; Coppi, P.; et al. Magnetic field amplification and flat spectrum radio quasars. MNRAS 2014, 441, 2188–2199. [Google Scholar] [CrossRef]
- Roy, N.; Chatterjee, R.; Joshi, M.; Ghosh, A. Probing the jets of blazars using the temporal symmetry of their multiwavelength outbursts. MNRAS 2019, 482, 743–757. [Google Scholar] [CrossRef]
- Khatoon, R.; Prince, R.; Shah, Z.; Sahayanathan, S.; Gogoi, R. Temporal and spectral study of PKS 0208-512 during the 2019-2020 flare. MNRAS 2022, 513, 611–623. [Google Scholar] [CrossRef]
- Agrawal, P.C. A broad spectral band Indian Astronomy satellite Astrosat. Adv. Space Res. 2006, 38, 2989–2994. [Google Scholar] [CrossRef]
- Rao, A.R.; Singh, K.P.; Bhattacharya, D. AstroSat—A multi-wavelength astronomy satellite. arXiv 2016, arXiv:1608.06051. [Google Scholar]
- Singh, K.P.; Tandon, S.N.; Agrawal, P.C.; Antia, H.M.; Manchanda, R.K.; Yadav, J.S.; Seetha, S.; Ramadevi, M.C.; Rao, A.R.; Bhattacharya, D.; et al. ASTROSAT mission. In Proceedings of the Space Telescopes and Instrumentation 2014: Ultraviolet to Gamma Ray, Montréal, QC, Canada, 29 July 2014; Takahashi, T., den Herder, J.W.A., Bautz, M., Eds.; Society of Photo-Optical Instrumentation Engineers (SPIE) Conference Series. SPIE: Bellingham, WA, USA, 2014; Volume 9144, p. 91441S. [Google Scholar]
- Atwood, W.B.; Abdo, A.A.; Ackermann, M.; Althouse, W.; Anderson, B.; Axelsson, M.; Baldini, L.; Ballet, J.; Band, D.L.; Barbiellini, G.; et al. The Large Area Telescope on the Fermi Gamma-Ray Space Telescope Mission. ApJ 2009, 697, 1071–1102. [Google Scholar] [CrossRef]
- Wood, M.; Caputo, R.; Charles, E.; Di Mauro, M.; Magill, J.; Perkins, J.S.; Fermi-LAT Collaboration. Fermipy: An open-source Python package for analysis of Fermi-LAT Data. In Proceedings of the 35th International Cosmic Ray Conference (ICRC2017), Busan, Korea, 10–20 July 2017; Volume 301, p. 824. [Google Scholar]
- Ajello, M.; Angioni, R.; Axelsson, M.; Ballet, J.; Barbiellini, G.; Bastieri, D.; Becerra Gonzalez, J.; Bellazzini, R.; Bissaldi, E.; Bloom, E.D.; et al. The Fourth Catalog of Active Galactic Nuclei Detected by the Fermi Large Area Telescope. ApJ 2020, 892, 105. [Google Scholar] [CrossRef]
- Burrows, D.N.; Hill, J.E.; Nousek, J.A.; Kennea, J.A.; Wells, A.; Osborne, J.P.; Abbey, A.F.; Beardmore, A.; Mukerjee, K.; Short, A.D.T.; et al. The Swift X-Ray Telescope. Space Sci. Rev. 2005, 120, 165–195. [Google Scholar] [CrossRef]
- Singh, K.P.; Stewart, G.C.; Westergaard, N.J.; Bhattacharayya, S.; Chandra, S.; Chitnis, V.R.; Dewangan, G.C.; Kothare, A.T.; Mirza, I.M.; Mukerjee, K.; et al. Soft X-ray Focusing Telescope Aboard AstroSat: Design, Characteristics and Performance. J. Astrophys. Astron. 2017, 38, 29. [Google Scholar] [CrossRef]
- Yadav, J.S.; Agrawal, P.C.; Antia, H.M.; Chauhan, J.V.; Dedhia, D.; Katoch, T.; Madhwani, P.; Manchanda, R.K.; Misra, R.; Pahari, M.; et al. Large Area X-ray Proportional Counter (LAXPC) instrument onboard ASTROSAT. In Proceedings of the Space Telescopes and Instrumentation 2016: Ultraviolet to Gamma Ray, Edinburgh, UK, 18 July 2016; den Herder, J.W.A., Takahashi, T., Bautz, M., Eds.; Society of Photo-Optical Instrumentation Engineers (SPIE) Conference Series. Volume 9905, p. 99051D. [Google Scholar] [CrossRef]
- Antia, H.M.; Yadav, J.S.; Agrawal, P.C.; Verdhan Chauhan, J.; Manchanda, R.K.; Chitnis, V.; Paul, B.; Dedhia, D.; Shah, P.; Gujar, V.M.; et al. Calibration of the Large Area X-ray Proportional Counter (LAXPC) Instrument on board AstroSat. ApJs 2017, 231, 10. [Google Scholar] [CrossRef]
- Evans, P.A.; Beardmore, A.P.; Page, K.L.; Tyler, L.G.; Osborne, J.P.; Goad, M.R.; O’Brien, P.T.; Vetere, L.; Racusin, J.; Morris, D.; et al. An online repository of Swift/XRT light curves of γ-ray bursts. A&A 2007, 469, 379–385. [Google Scholar] [CrossRef]
- Evans, P.A.; Beardmore, A.P.; Page, K.L.; Osborne, J.P.; O’Brien, P.T.; Willingale, R.; Starling, R.L.C.; Burrows, D.N.; Godet, O.; Vetere, L.; et al. Methods and results of an automatic analysis of a complete sample of Swift-XRT observations of GRBs. Mon. Not. R. Astron. Soc. 2009, 397, 1177–1201. [Google Scholar] [CrossRef]
- Arnaud, K.A. XSPEC: The First Ten Years. In Proceedings of the Astronomical Data Analysis Software and Systems V; Jacoby, G.H., Barnes, J., Eds.; Astronomical Society of the Pacific Conference Series; Astronomical Society of the Pacific: San Francisco, CA, USA, 1996; Volume 101, p. 17. [Google Scholar]
- HI4PI Collaboration; Ben Bekhti, N.; Flöer, L.; Keller, R.; Kerp, J.; Lenz, D.; Winkel, B.; Bailin, J.; Calabretta, M.R.; Dedes, L.; et al. HI4PI: A full-sky H I survey based on EBHIS and GASS. A&A 2016, 594, A116. [Google Scholar] [CrossRef]
- Yadav, J.S.; Misra, R.; Verdhan Chauhan, J.; Agrawal, P.C.; Antia, H.M.; Pahari, M.; Dedhia, D.; Katoch, T.; Madhwani, P.; Manchanda, R.K.; et al. Astrosat/LAXPC Reveals the High-energy Variability of GRS 1915+105 in the X Class. ApJ 2016, 833, 27. [Google Scholar] [CrossRef]
- Roming, P.W.A.; Kennedy, T.E.; Mason, K.O.; Nousek, J.A.; Ahr, L.; Bingham, R.E.; Broos, P.S.; Carter, M.J.; Hancock, B.K.; Huckle, H.E.; et al. The Swift Ultra-Violet/Optical Telescope. Space Sci. Rev. 2005, 120, 95–142. [Google Scholar] [CrossRef]
- Kumar, A.; Ghosh, S.K.; Hutchings, J.; Kamath, P.U.; Kathiravan, S.; Mahesh, P.K.; Murthy, J.; Nagbhushana, S.; Pati, A.K.; Rao, M.N.; et al. Ultra Violet Imaging Telescope (UVIT) on ASTROSAT. In Proceedings of the Space Telescopes and Instrumentation 2012: Ultraviolet to Gamma Ray, Amsterdam, The Netherlands, 17 September 2012; Takahashi, T., Murray, S.S., den Herder, J.W.A., Eds.; Society of Photo-Optical Instrumentation Engineers (SPIE) Conference Series. Volume 8443, p. 84431N. [Google Scholar] [CrossRef]
- Tandon, S.N.; Subramaniam, A.; Girish, V.; Postma, J.; Sankarasubramanian, K.; Sriram, S.; Stalin, C.S.; Mondal, C.; Sahu, S.; Joseph, P. In-orbit Calibrations of the Ultraviolet Imaging Telescope. AJ 2017, 154, 128. [Google Scholar] [CrossRef]
- Breeveld, A.A.; Landsman, W.; Holland, S.T.; Roming, P.; Kuin, N.P.M.; Page, M.J. An Updated Ultraviolet Calibration for the Swift/UVOT. In Proceedings of the Gamma Ray Bursts 2010. In Proceedings of the Gamma Ray Bursts 2010, Annapolis, MD, USA, 1–4 November 2020. [Google Scholar]
- Cardelli, J.A.; Clayton, G.C.; Mathis, J.S. The relationship between infrared, optical, and ultraviolet extinction. ApJ 1989, 345, 245–256. [Google Scholar] [CrossRef]
- Schlafly, E.F.; Finkbeiner, D.P. Measuring Reddening with Sloan Digital Sky Survey Stellar Spectra and Recalibrating SFD. ApJ 2011, 737, 103. [Google Scholar] [CrossRef]
- Tandon, S.N.; Postma, J.; Joseph, P.; Devaraj, A.; Subramaniam, A.; Barve, I.V.; George, K.; Ghosh, S.K.; Girish, V.; Hutchings, J.B.; et al. Additional Calibration of the Ultraviolet Imaging Telescope on Board AstroSat. AJ 2020, 159, 158. [Google Scholar] [CrossRef]
- Bonning, E.; Urry, C.M.; Bailyn, C.; Buxton, M.; Chatterjee, R.; Coppi, P.; Fossati, G.; Isler, J.; Maraschi, L. SMARTS Optical and Infrared Monitoring of 12 Gamma-Ray Bright Blazars. ApJ 2012, 756, 13. [Google Scholar] [CrossRef]
- Drake, A.J.; Djorgovski, S.G.; Mahabal, A.; Beshore, E.; Larson, S.; Graham, M.J.; Williams, R.; Christensen, E.; Catelan, M.; Boattini, A.; et al. First Results from the Catalina Real-Time Transient Survey. ApJ 2009, 696, 870–884. [Google Scholar] [CrossRef]
- Wright, E.L.; Eisenhardt, P.R.M.; Mainzer, A.K.; Ressler, M.E.; Cutri, R.M.; Jarrett, T.; Kirkpatrick, J.D.; Padgett, D.; McMillan, R.S.; Skrutskie, M.; et al. The Wide-field Infrared Survey Explorer (WISE): Mission Description and Initial On-orbit Performance. AJ 2010, 140, 1868–1881. [Google Scholar] [CrossRef]
- Brinkmann, W.; Siebert, J.; Boller, T. The X-ray AGN content of the Molonglo 408 MHz survey: Bulk properties of previously optically identified sources. A&A 1994, 281, 355–374. [Google Scholar]
- White, N.E.; Giommi, P.; Angelini, L. VizieR Online Data Catalog: The WGACAT Version of ROSAT Sources (White+ 2000); VizieR Online Data Catalog; Laboratory for High Energy Astrophysics (LHEA/NASA): Greenbelt, MD, USA, 2000; p. IX/31. [Google Scholar]
- Ueda, Y.; Ishisaki, Y.; Takahashi, T.; Makishima, K.; Ohashi, T. The ASCA Medium Sensitivity Survey (the GIS Catalog Project): Source Catalog. APJS 2001, 133, 1–52. [Google Scholar] [CrossRef][Green Version]
- Reeves, J.N.; Turner, M.J.L. X-ray spectra of a large sample of quasars with ASCA. MNRAS 2000, 316, 234–248. [Google Scholar] [CrossRef]
- Chatterjee, R.; Fossati, G.; Urry, C.M.; Bailyn, C.D.; Maraschi, L.; Buxton, M.; Bonning, E.W.; Isler, J.; Coppi, P. An Optical-Near-infrared Outburst with no Accompanying γ-Rays in the Blazar PKS 0208-512. ApJ 2013, 763, L11. [Google Scholar] [CrossRef]
- Ghisellini, G.; Tavecchio, F.; Foschini, L.; Ghirlanda, G.; Maraschi, L.; Celotti, A. General physical properties of bright Fermi blazars. MNRAS 2010, 402, 497–518. [Google Scholar] [CrossRef]
- Ghisellini, G.; Tavecchio, F.; Foschini, L.; Ghirlanda, G. The transition between BL Lac objects and flat spectrum radio quasars. MNRAS 2011, 414, 2674–2689. [Google Scholar] [CrossRef]
- Stratta, G.; Capalbi, M.; Giommi, P.; Primavera, R.; Cutini, S.; Gasparrini, D. The ASDC SED Builder Tool description and Tutorial. arXiv 2011, arXiv:1103.0749. [Google Scholar]


Publisher’s Note: MDPI stays neutral with regard to jurisdictional claims in published maps and institutional affiliations. |
© 2022 by the authors. Licensee MDPI, Basel, Switzerland. This article is an open access article distributed under the terms and conditions of the Creative Commons Attribution (CC BY) license (https://creativecommons.org/licenses/by/4.0/).