Article

A New Index to Describe the Response of Geomagnetic Disturbance to the Energy Injection from the Solar Wind

1
Key Laboratory of Space Weather, National Satellite Meteorological Center (National Center for Space Weather), China Meteorological Administration, Beijing 100081, China
2
Innovation Center for FengYun Meteorological Satellite (FYSIC), Beijing 100081, China
3
School of Earth and Space Sciences, Peking University, Beijing 100871, China
*
Author to whom correspondence should be addressed.
Universe 2022, 8(10), 506; https://doi.org/10.3390/universe8100506
Submission received: 1 September 2022 / Revised: 21 September 2022 / Accepted: 22 September 2022 / Published: 26 September 2022
(This article belongs to the Special Issue Space Weather in the Sun–Earth System)

Abstract

:
In this paper, we establish a new non-dimensional global geomagnetic disturbance index J p G by applying the spectral whitening method to the horizontal components of geomagnetic fields observed at eight ground-based stations distributed at low and middle latitudes during years 1998 to 2014. This index can describe the development of geomagnetic storms and its relationship with the Dst index has been verified, which gives a correlation coefficient (CC) of about 0.72. We also check the response of J p G to the arrival of upstream solar wind energy based on a proxy that the ring current injection term Q. The variation of J p G in course of geomagnetic storms is similar to the variation of Q, and the recorded minimum values of Q ( Q m i n ) and J p G ( J p G m i n ) for 30 great storms yields a relatively better CC of about 0.82. These results illustrate that J p G can effectively depict the storm evolution and is well related to the associated Q in amplitude, which provides an alternative means of geomagnetic storm forecasting. In addition, we note that the time difference between Q m i n and J p G m i n , as well as the time difference when J p G recovers from J p G m i n to half and/or one-third of its value, are shorter than those of the corresponding Dst index. And especially, for multiple storms that occurred continuously on a short time scale, the recovery of the Dst index to a quiet period level can be affected by the following solar wind energy input, while the J p G index does not and exhibits independently.

1. Introduction

A geomagnetic storm is a global disturbance of the geomagnetic field, which is generated by the interaction between the interplanetary solar wind and the Earth’s magnetosphere. The interplanetary source of the geomagnetic storm could be the sheath region between the interplanetary shock and interplanetary coronal mass ejection (ICME), the ICME, or the corotating interaction region (CIR) formed by the interaction between the high-speed flow solar wind from the coronal hole and the low-speed solar wind [1,2,3,4]. The majority of strong magnetic storms are related to the ICME sweeping the Earth space [5]. Turbulence has been shown to affect solar wind and other plasmas, it has an impact on the heating of solar wind plasma [6] and magnetospheric dynamics [7]. The nonlinear interaction of the solar wind with the Earth’s magnetic field results in the formation of currents in the ionosphere, which can ultimately lead to a strong disturbance of the magnetic field, and bring damage to the power distribution networks, and other long-distance pipelines too. Since electricity is the cornerstone of modern life, the ability to predict geomagnetic activity is of great importance in the context of space weather [8]. Besides, the storms also have an impact on the thermosphere and ionosphere (TI) system. For thermospheric response, it is mainly the formation of composition disturbance such as the depletion of column density ratio of O to N 2 in the high latitude and enhancement of O / N 2 in the low latitude [9,10,11]. The ionospheric response is always following the thermosphere, with positive (enhancement of electron density) and negative (decrease of ionosphere electron density) ionosphere response [12,13].
Dungey [14] proposed a magnetic reconnection mechanism to describe the transfer process of energy from the solar wind to the magnetosphere. When the interplanetary magnetic field (IMF) is southward, magnetic field reconnection occurs in the dayside subsolar magnetopause region, thereby dragging the open field line to the nightside magnetotail. The extent and strength of the magnetic reconnection that occurs on the magnetopause fundamentally control the solar wind-magnetosphere interaction [8,15]. Since the solar wind is supersonic, a bow shock will be formed in front of the magnetosphere. Between the bow shock and the magnetopause is a sheath region. What actually interacts with the magnetosphere is the plasma in the sheath region rather than the interplanetary solar wind plasma [8]. The driving of the magnetosphere by the solar wind can be better described using observations of the magnetosheath plasma outside the magnetopause [16]. Nevertheless, thanks to the continuous and stable observations at the Sun-Earth Lagrangian L1 point, people are still accustomed to using the solar wind observation data at the L1 point to approximate the conditions of the solar wind in front of the bow shock and based on it to study energy transfer problems in the solar wind and magnetosphere coupling.
It is generally believed that geomagnetic storms can be triggered when the southward component of IMF ( B z ) is strong enough and lasts for a long time (several hours) [17,18,19], if B z < 10 nT or the dawn-dusk electric field E y > 5 mV / m , and the duration exceeds 3 h, a large magnetic storm will occur [20]. The stronger the B z and the higher the solar wind speed (V), the stronger the coupling process between the solar wind and the magnetosphere, and therefore the stronger the geomagnetic disturbance. Many geomagnetic indices can be used to describe the variation of geomagnetic disturbances, such as Ap, Kp, Dst, AE, SYM-H/D, etc. The Dst index is calculated from the horizontal geomagnetic fields component (H) of 4 ground stations that are uniformly distributed along the longitude near the Earth’s magnetic equator, and describes the equatorial ring current intensity during the magnetic storm, the storm intensity from Dst is based on storm impact on the equatorial region. Kp is based on 8 stations results in mid-latitude. AE is from at least 12 stations in the polar region, which can more effectively reflect the storm starting and ending time. The Dst index is often used to classify the intensity of the geomagnetic storm. Generally, people divide the geomagnetic storm into 5 grades according to the minimum Dst index value during the magnetic storm [2,21], 30 nT > Dst > 50 nT is a weak magnetic storm, 50 nT > Dst > 100 nT is a moderate magnetic storm, 100 nT > Dst > 200 nT is a strong magnetic storm, 200 nT > Dst > 350 nT is a severe magnetic storm, and Dst < 350 nT is a great magnetic storm. Some researchers define Dst < 200 nT as great magnetic storm [22,23]. Although the Dst index is incomplete in describing storm evolution, it is often used to determine whether or not a storm occurred, to define the duration of a storm, and to distinguish between quiet and disturbed geomagnetic conditions [24]. In this article, we mainly focus on the Dst index.
The solar wind-magnetosphere coupling involves many aspects of the physical process in the magnetosphere and is also the core physical problem of space weather [25]. An effective method to study the coupling process is to compare the relationship between the interplanetary disturbances and the responses in the magnetosphere-ionosphere-atmosphere system [26]. For decades, people have been looking for the relationship between interplanetary drivers and geomagnetic disturbances. Although the results are remarkable (e.g., [27,28,29,30]), there is still a lot of controversy over the choice of interplanetary parameters as the controlling factors of the solar wind magnetosphere coupling [23,25,31]. Among the geomagnetic indices, some are dedicated to describing geomagnetic disturbances in a certain area, while others mainly describe global geomagnetic disturbances. Some indices vary linearly with the magnitude of geomagnetic disturbances, while others change at an exponential rate. Although there are many kinds of geomagnetic indices, the existing geomagnetic indices cannot perfectly describe the coupling process between the solar wind and the magnetosphere [25].
The spectral whitening method (SWM) can effectively remove background disturbance from time series data and extract aperiodic disturbance information [32]. This paper uses SWM to process the observation data of the geomagnetic station, extract the global geomagnetic disturbance information, and study the relationship between it and the energy injection into the magnetosphere from the solar wind. The second part of this paper introduces the data and methods, the third part gives the case study and statistical analysis of magnetic storm events, and the fourth part is the conclusion.

2. Data and Methods

Wang et al. [32] proposed a spectral whitening method that can extract aperiodic perturbations of the variations in the ionospheric F2 layer’s critical frequency (foF2). For a given time series data g ( t ) , the spectral whitening processing algorithm is as follows:
g d * ( t ) = + + g ( t ) · e 2 π i t ξ d t · P 0 P e n v ( ξ ) · e 2 π i t ξ d ξ
g s ( t m ) = 1 3 j = 0 2 g d * ( t m + j 1 )
where g s ( t m ) is the aperiodic disturbance calculated from SWM process, P e n v ( ξ ) is the upper envelope line of the power spectrum curve of the time series data g ( t ) , P 0 is mode of P e n v ( ξ ) . Chen et al. [33] normalize the extracted aperiodic perturbations using the standard deviation of g s :
J 0 ( t ) = g s ( t ) σ g
Considering the variation characteristics of ionospheric foF2, Chen et al. designed a new ionospheric single-station disturbance index J s and ionospheric global disturbance index J p :
J s ( t ) = | J 0 ( t ) |
J p ( t ) = 1 m i = 1 m J s i ( t )
Zhao et al. [34] constructed the ionospheric weather disturbance indices using the SWM based on the global gridded ionospheric total electron content (TEC) data, which has a good indication of the ionospheric disturbance during geomagnetic storms.
We use the global geomagnetic station observation data provided by Intermagnet (https://www.intermagnet.org/, accessed on 27 April 2022), and use SWM to process the geomagnetic data, extract the non-periodic variation of geomagnetic disturbance, and analyze the relationship between geomagnetic disturbance and solar wind parameters.
The CD-ROM format geomagnetic data provided by Intermagnet started from 1991 to 2014, but the geomagnetic stations with valid data in the early years were limited. On the other hand, the Advanced Composition Explorer (ACE) and Wind satellites have continuously monitored the solar wind around the L1 Lagrange point since later 1997 and early 2004 respectively, which make a significant contribution to the OMNI dataset in terms of solar wind data. We focus on the years from 1998 to 2014 to ensure sufficient observations of geomagnetic data and solar wind data. Firstly, we use the method of Chen et al. [33] to spectral whitening the hourly-resolution geomagnetic horizontal component H of a single geomagnetic station to obtain the standardized single-station geomagnetic disturbance information, denoted as J 0 G , in which G stand for Geomagnetic. Since in the geomagnetic disturbance, the positive disturbance and the negative disturbance represent different physical processes, we need to distinguish these two disturbances. Then, different from Chen et al., we define a single station geomagnetic disturbance index:
J s G ( t ) = J 0 G ( t )
Finally, we define J p G as the global geomagnetic disturbance index:
J p G ( t ) = 1 m i = 1 m J s i G ( t )

3. Results and Discussion

When calculating the global ionospheric disturbance index J p , Chen et al. [33] found that when the number of stations included in the calculation exceeds eight, J p tends to be stable, which indicates that the construction of the J p index from J s of multiple stations is reasonable and convenient. Firstly, we should determine the number of stations required to extract the global geomagnetic disturbance based on the SWM, and then analyze the characteristics of the newly constructed geomagnetic disturbance index.

3.1. The Ability of Geomagnetic Disturbance Extraction

There are four low-mid latitude magnetometer stations used in the calculation of the Dst index, which names are Hermanus (HER), Kakioka (KAK), Honolulu (HON), and San Juan (SJG), respectively. In order to evaluate the ability of geomagnetic disturbance extraction of the SWM, we select these same four stations to calculate the single-station geomagnetic disturbance J s G and the global disturbance J p G . Figure 1 shows the Dst index during the magnetic storm from 27 February to 1 March 2014, as well as the single-station geomagnetic disturbance J s G and the global geomagnetic disturbance J p G extracted by our new method. At 23:00 on 27 February, Dst reached a minimum value of 97 nT . As shown in Equation (3), the single station index J s G calculated for each of the four stations is normalized standard deviation and is a dimensionless parameter that characterizes the disturbance intensity. It’s shown in Figure 1 that, during the same magnetic storm event, the J s G of different geomagnetic stations have a significant difference from each other, but the global disturbance index J p G has a similar change pattern compared with the Dst index, especially during the main phase of the magnetic storm. The minimum value of J s G is 2.96 at 22:00 on 27 February, which is very close to the minimum value of the Dst index in time.
The day-to-day variability of midlatitude ionospheric current is partly due to lower atmospheric forcing, as a result, the lower atmospheric forcing has a significant impact on solar quiet (Sq) variation of the geomagnetic field [35,36]. It can be seen that the use of the SWM to process the geomagnetic H component data can effectively extract the geomagnetic disturbance information during the magnetic storm, and our newly constructed global geomagnetic disturbance index, J p G , based on multiple stations, can describe the development of geomagnetic storms.

3.2. Influence of the Number of Stations

In the process of calculating global geomagnetic indices, the selection of different stations and different numbers of stations may affect the results. Although four stations are used for the Dst index calculation, is there a better station selection scheme for calculating J p G ? We take the similar evaluating method used by Chen et al. [33] to explore the influence of the number of stations. We first select the stations within the mid- to low-latitude (latitude less than ∼ 40 ), a total of 18 stations, and then extract different numbers of stations from the 18 stations to construct the J p G index. When the number of stations used is N, there are C 18 N schemes for selecting N stations from 18 stations. J p G indices are constructed for each scheme, the correlation analysis with the Dst index is carried out, and the scheme with the best correlation coefficient (CC) is taken as the scheme for N stations. Thus, when the number of stations varies from 1 to 18, the variation of the CC between the newly constructed global geomagnetic disturbance J p G index and Dst index is shown in Figure 2.
It can be seen from Figure 2 that when the number of stations is greater than 4, the CC between the J p G index and the Dst index tends to be stable. When the number of stations is equal to 8, the CC is the largest, which is equal to 0.72. We use p-value [37] to measure the significance level of the corresponding CC, and the correlation is considered significant when p-value is smaller than 0.05. The p-value of CC = 0.72 is 0.00, indicating this correlation is with a high statistical significance. Chen et al. believes that the inclusion of stations with missing data for some time periods in the calculation will lead to distortion in the calculation of the global disturbance index, which may be the reason why the CC decreases slightly when the number of stations is close to 18.
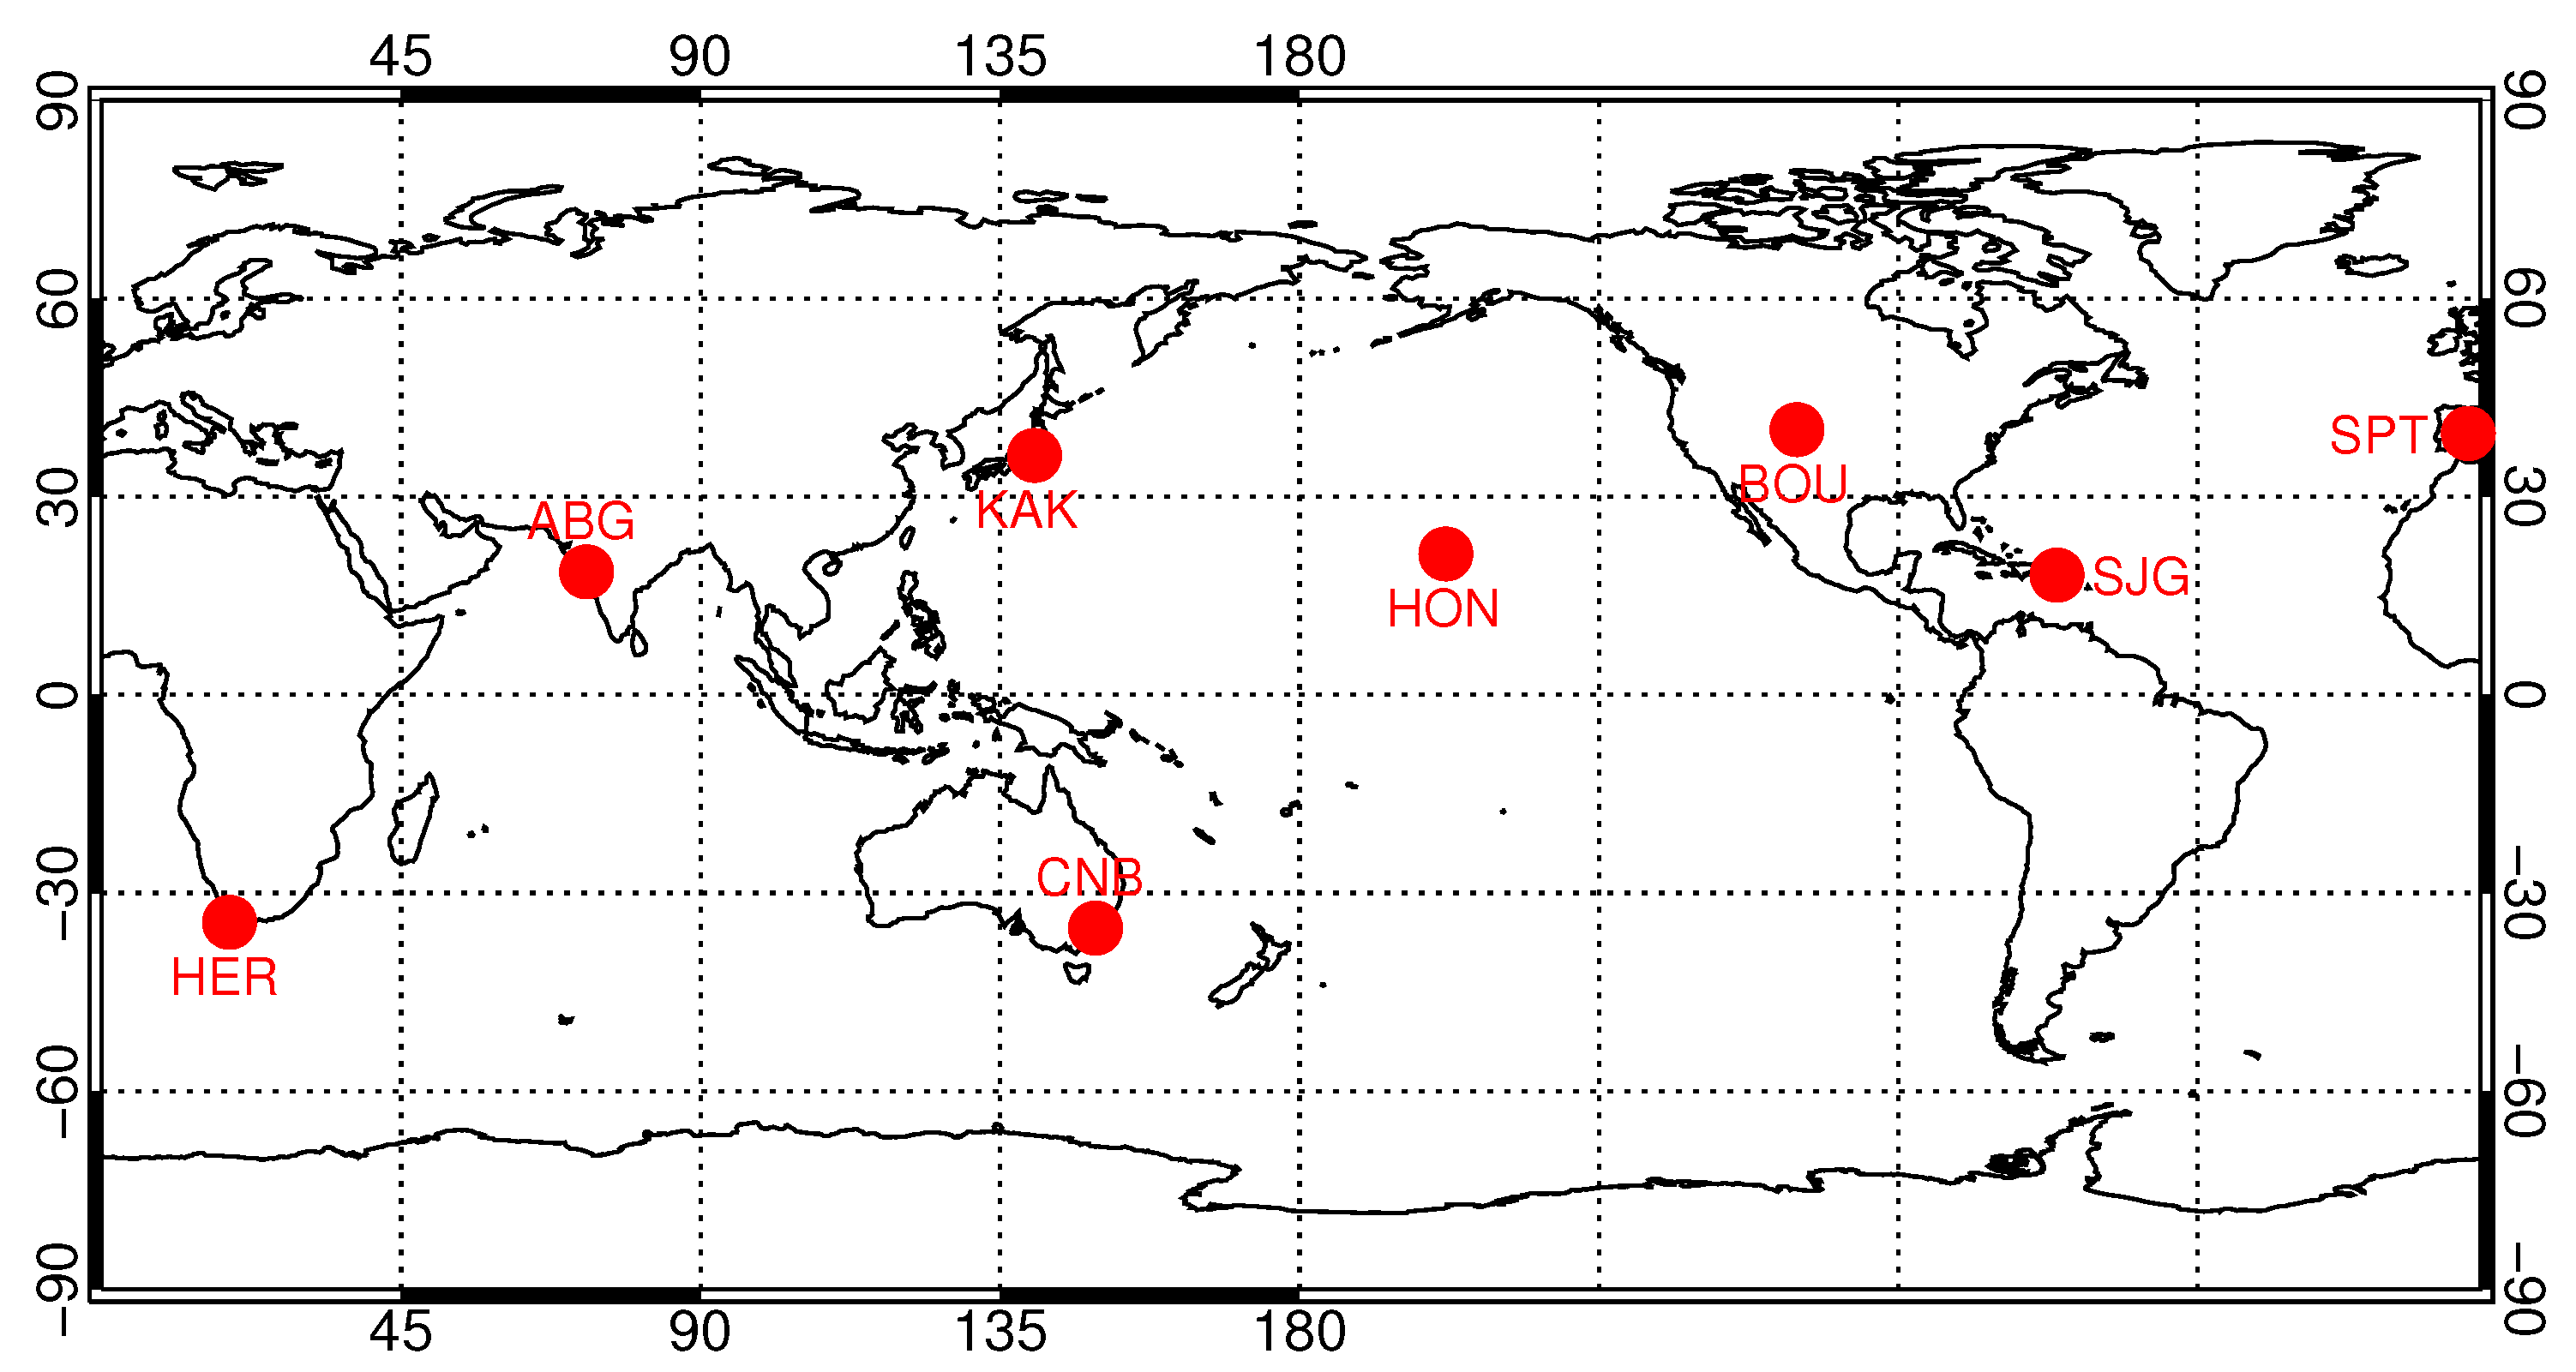
For the following calculations in this paper, the scheme with the number of stations equal to 8 is used to calculate the global geomagnetic disturbance index J p G . These eight stations are Honolulu (HON), Boulder (BOU), San Juan (SJG), San Pablo-Toledo (SPT), Hermanus (HER), ALIBAG (ABG), Kakioka (KAK), and Canberra (CNB), respectively. The global map with these eight stations’ locations marked is shown in Figure 3.

3.3. Case Study of Magnetic Storm Events

We first carry out a case study of magnetic storm events, compare the J p G index with the Dst index and interplanetary parameters, and discuss the variation trend of the J p G index during the magnetic storm process, as well as its response characteristics to the storm’s interplanetary driving source. We selected three typical magnetic storm events, the first one is a magnetic storm without a sudden commencement (SC), the second one is a magnetic storm with an SC process, and the third one is an event process in which three magnetic storms occur consecutively at relatively close times.
The OMNI dataset (https://omniweb.gsfc.nasa.gov/ow.html, accessed on 27 April 2022) gives hourly resolution data on the solar wind magnetic field and plasma, energetic particles, and geomagnetic indices in the near-Earth region. We use this dataset to study the relationship between the J p G index calculated by the SWM and the interplanetary parameters.
Burton et al. [27] proposed a classical injection-decay model to describe the relationship between the interplanetary solar wind parameters and the variation of the Dst index during magnetic storms. O’Brien and McPherron [28] developed this model, and gave the relationship between Dst and interplanetary driver more accurately. However, these two models only express the injection term Q as a function of the southward magnetic field or the westward electric field, without considering the influence of solar wind dynamic pressure. Wang et al. [29] introduced the solar wind dynamic pressure in the Q calculation. Zhao et al. [30] pointed out that the influence of the solar wind dynamic pressure on the magnetic storm is complex and its contribution may vary from one storm to another, so the γ parameter needs to be adjusted to accurately calculate the Q. In this paper, we use the calculation parameters listed in Zhao et al. [30].
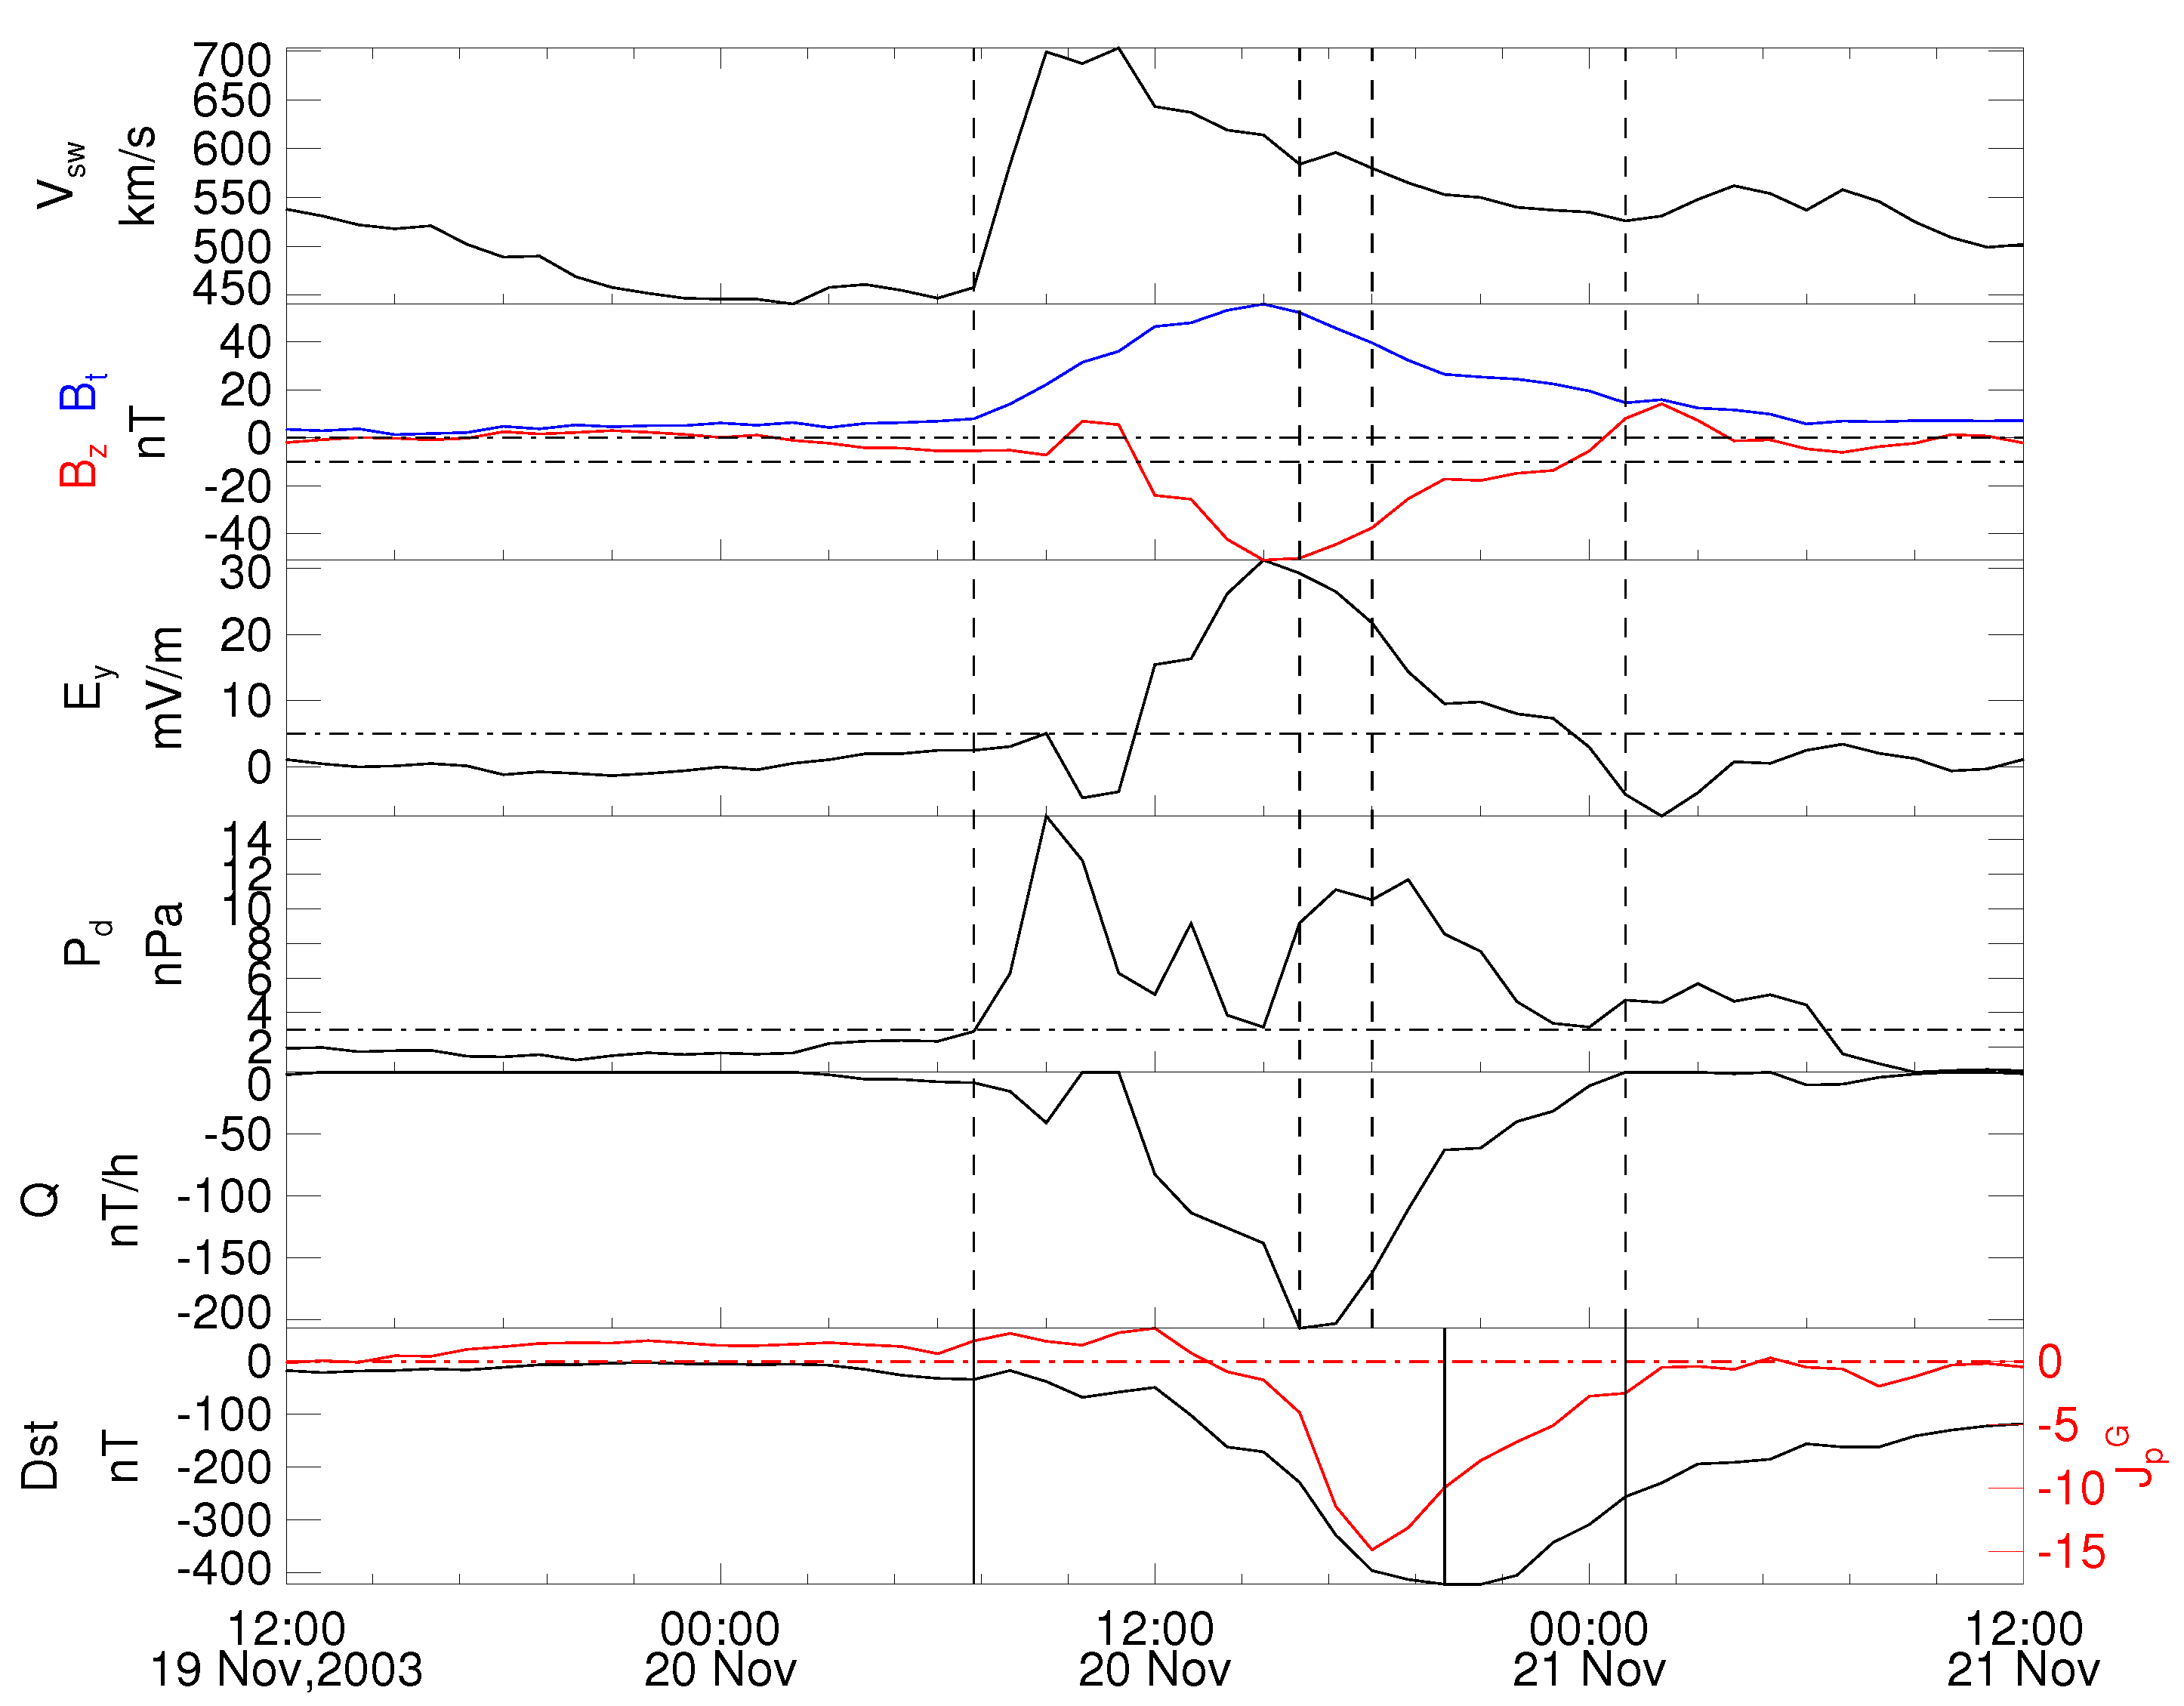
As shown in Figure 4, it is a great magnetic storm that occurred around 20 November 2003. The minimum Dst index reached 422 nT at 20:00 on 20 November (Dst was both 422 nT at 20:00 and 21:00). The interplanetary sources are the sheath (SH) and the magnetic cloud (MC) [30]. From top to bottom in the figure are the solar wind velocity, the total strength of the IMF, the north-south magnetic component, the east-west electric field, the solar wind dynamic pressure, and the ring current injection term in which γ = 0.44 [29,30], the global geomagnetic disturbance index J p G calculated by the SWM based on 8 stations (red line), and the Dst index (black line). The first vertical dashed line and the first vertical solid line are at 07:00 on 20 November, which is the time when SH reaches the Earth. The second vertical dashed line is at 16:00 on 20 November, which is the time when the Q is the strongest. The third vertical dashed line is at 18:00 on 20 November, which is the time of the minimum value of J p G . The second vertical solid line is at 20:00 on 20 November, which is the minimum time of the Dst index. The fourth vertical dashed line and the third vertical solid line are at 01:00 on 21 November, corresponding to the end time of Q injection, which is also about the end time of the MC structure.
It can be seen from Figure 4 that after the sheath region reaches the earth, due to the enhancement of solar wind dynamic pressure, the compression effect on the dayside magnetopause makes the Dst index slightly increase, and J p G also has a positive disturbance. The change of dynamic pressure is relatively smooth, so there is no obvious SC in the Dst index. Two hours after the ring current injection Q reached the strongest, J p G reached the minimum value, indicating that the geomagnetic disturbance was strongest at this time, and the minimum value of the Dst index appeared 4 h after the time of strongest Q. At the end of the magnetic cloud, the ring current injection also ends. At this time, J p G returns to the vicinity of 0, indicating that the injection process in the magnetosphere is over. However, we notice that the Dst index is still in the recovery phase at this time, and the Dst index at this time is 256 nT , still at the level of a great magnetic storm. It can be seen that J p G based on the SWM can effectively extract the geomagnetic field disturbance information and characterize the global-scale geomagnetic changes. Different from the Dst index to describe the ring current intensity, the variation of J p G in course of a geomagnetic storm is similar to the variation of Q, to say, J p G can better match the energy injections from interplanetary sources into the magnetosphere.
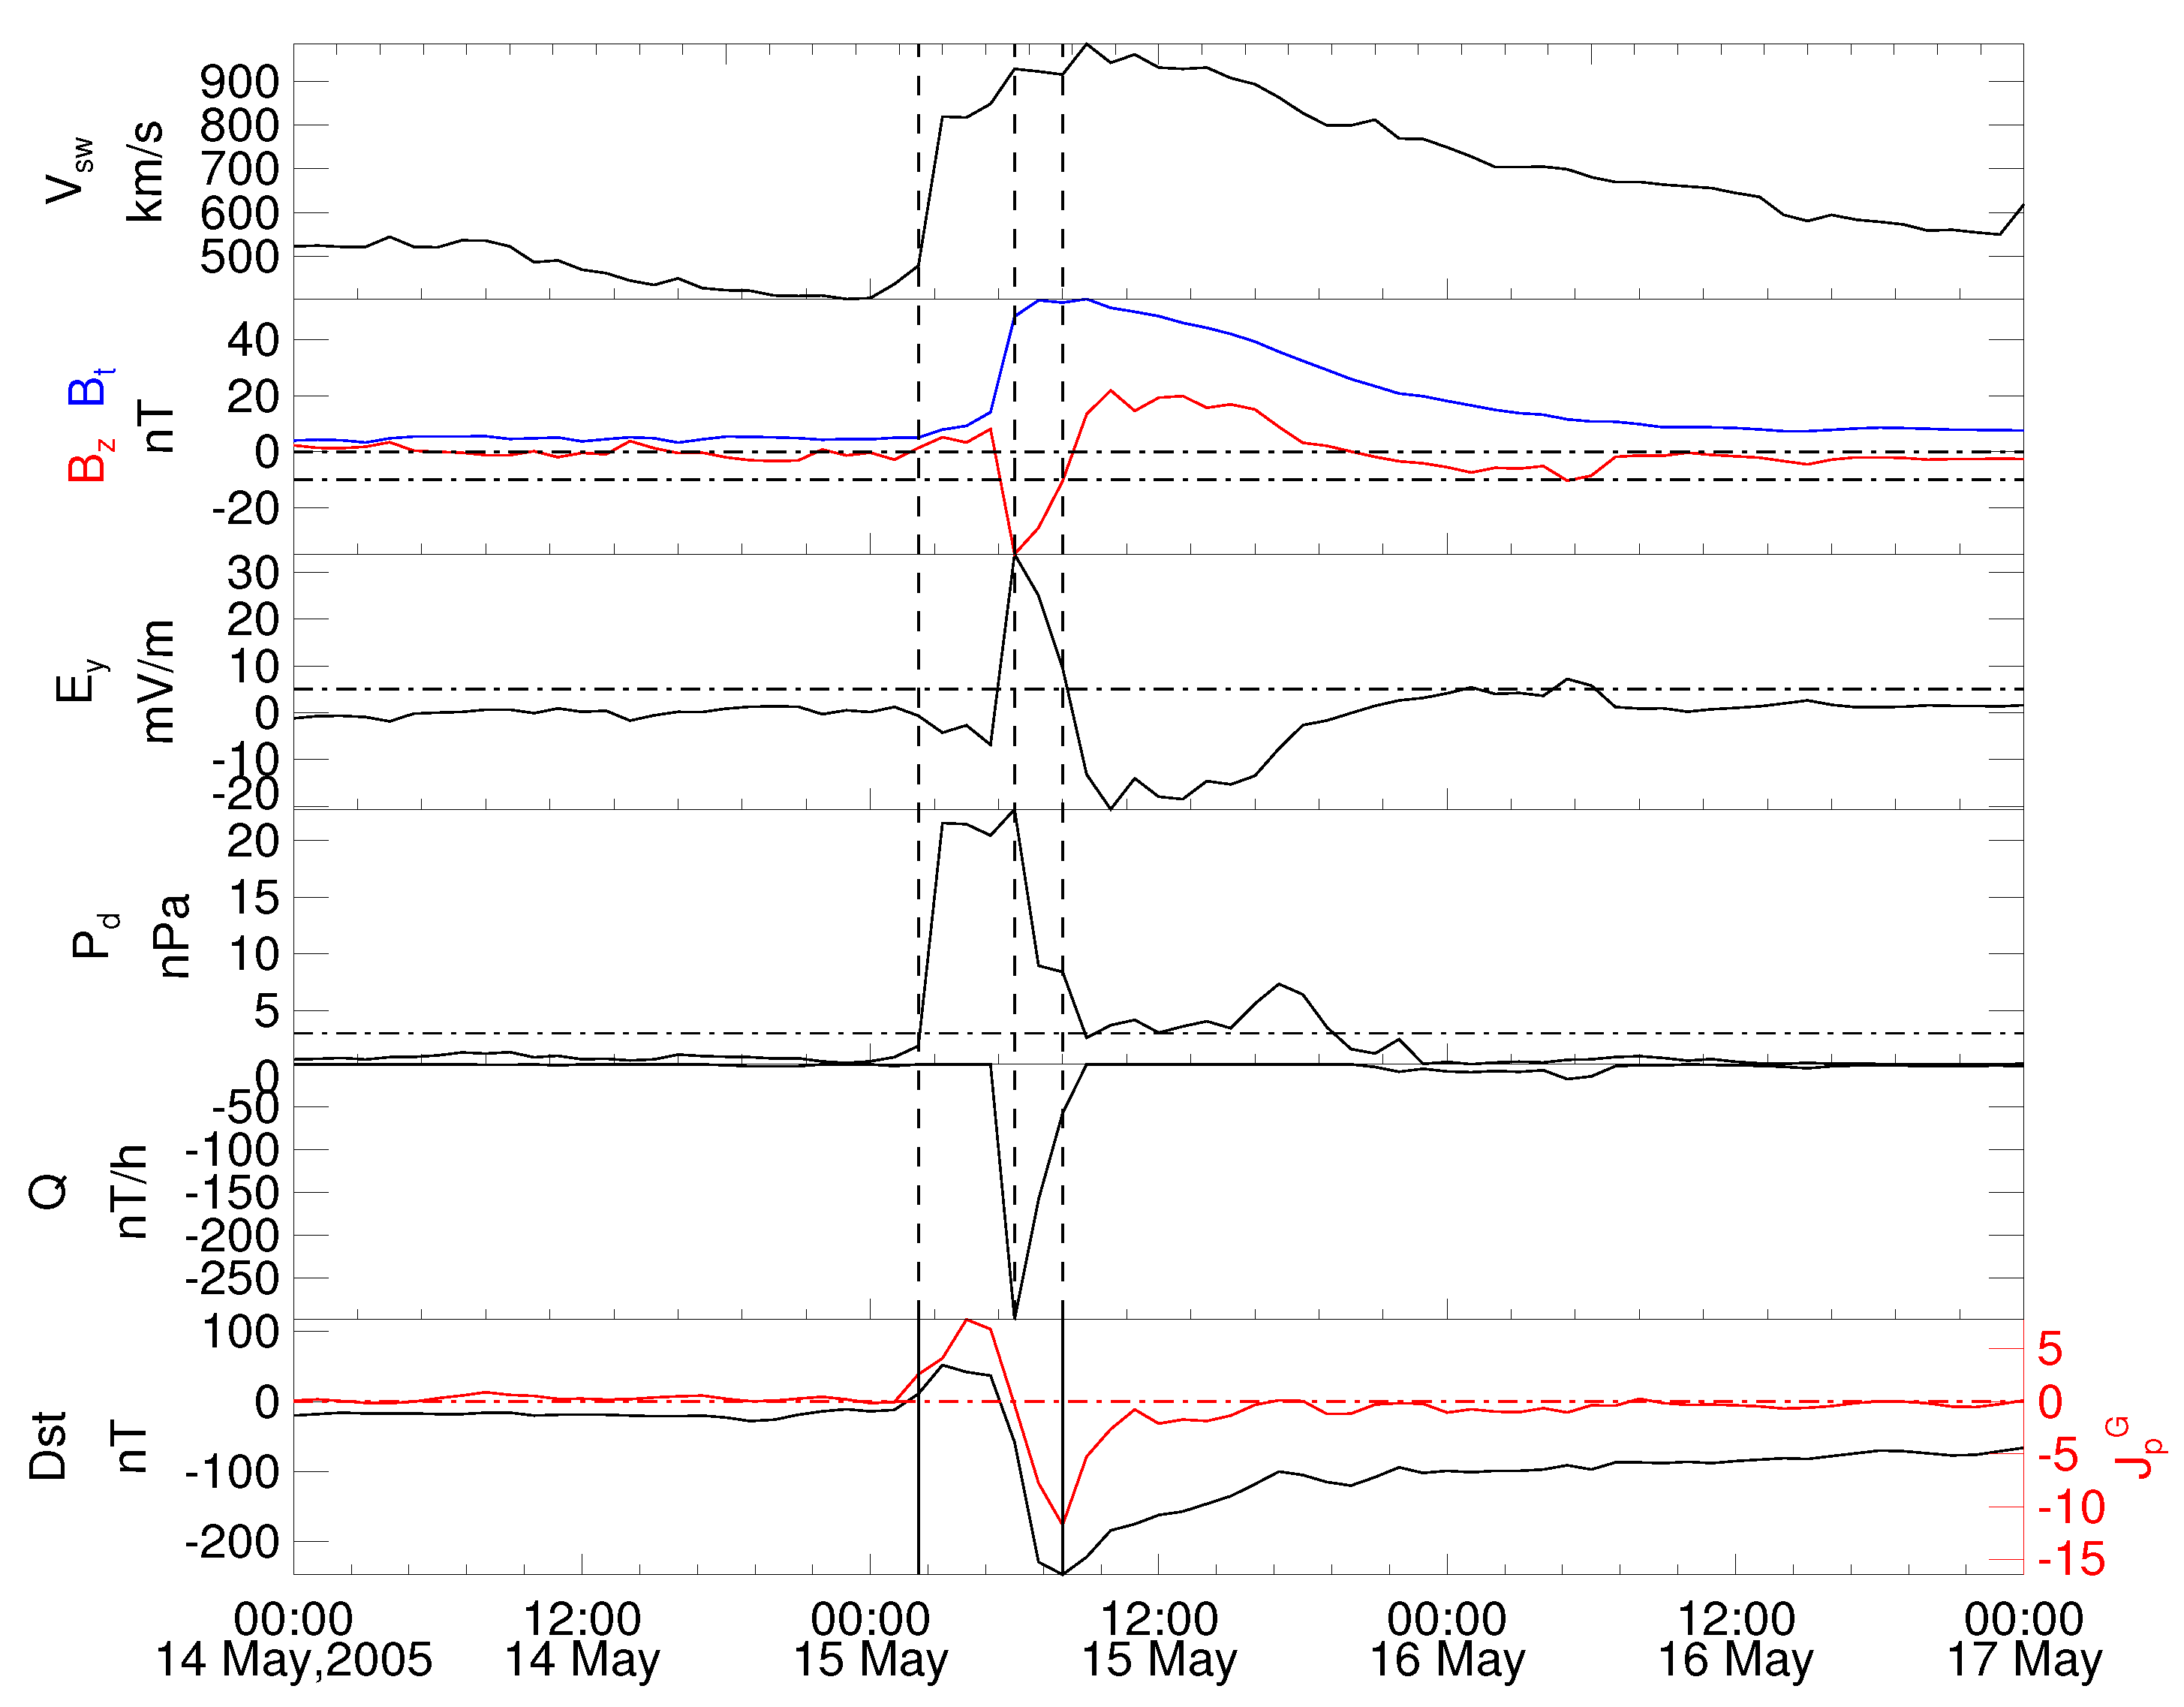
Figure 5 shows the great magnetic storm event on 15 May 2005, the minimum Dst index reached 247 nT at 08:00 on 15 May. This storm’s interplanetary source was SH+MC, and γ was set to 0.35 [30]. There exists a strong SC in the beginning, and the maximum Dst index rose to 52 nT at 03:00 on 15 May. The first vertical dashed line and the first vertical solid line in the figure are at 02:00 on 15 May, corresponding to the start time of the SC. The second vertical dashed line is at 06:00 on 15 May, corresponding to the strongest time of the ring current injection Q. The third vertical dashed line and the second vertical solid line are at 08:00 on 15 May, when J p G and Dst reach the minimum value at the same time. It can be seen that the time delay between the minimum value of J p G and the minimum value of Q is 2 h. Since the duration time of southward B z is short, the delay of the minimum value of Dst is also 2 h. After the short energy injection process, J p G quickly recovered to the vicinity of the quiet state, while the Dst index needed a long recovery phase. In addition, we notice that the Dst index generally varies upwards within tens of nT during the SC, which is much smaller than the absolute value of the minimum Dst value during the main phase of the magnetic storm. However, the SWM whitens the power spectrum, so that the positive and negative disturbances have similar amplitudes, which results in amplitude differences in the positive disturbances between J p G and Dst.
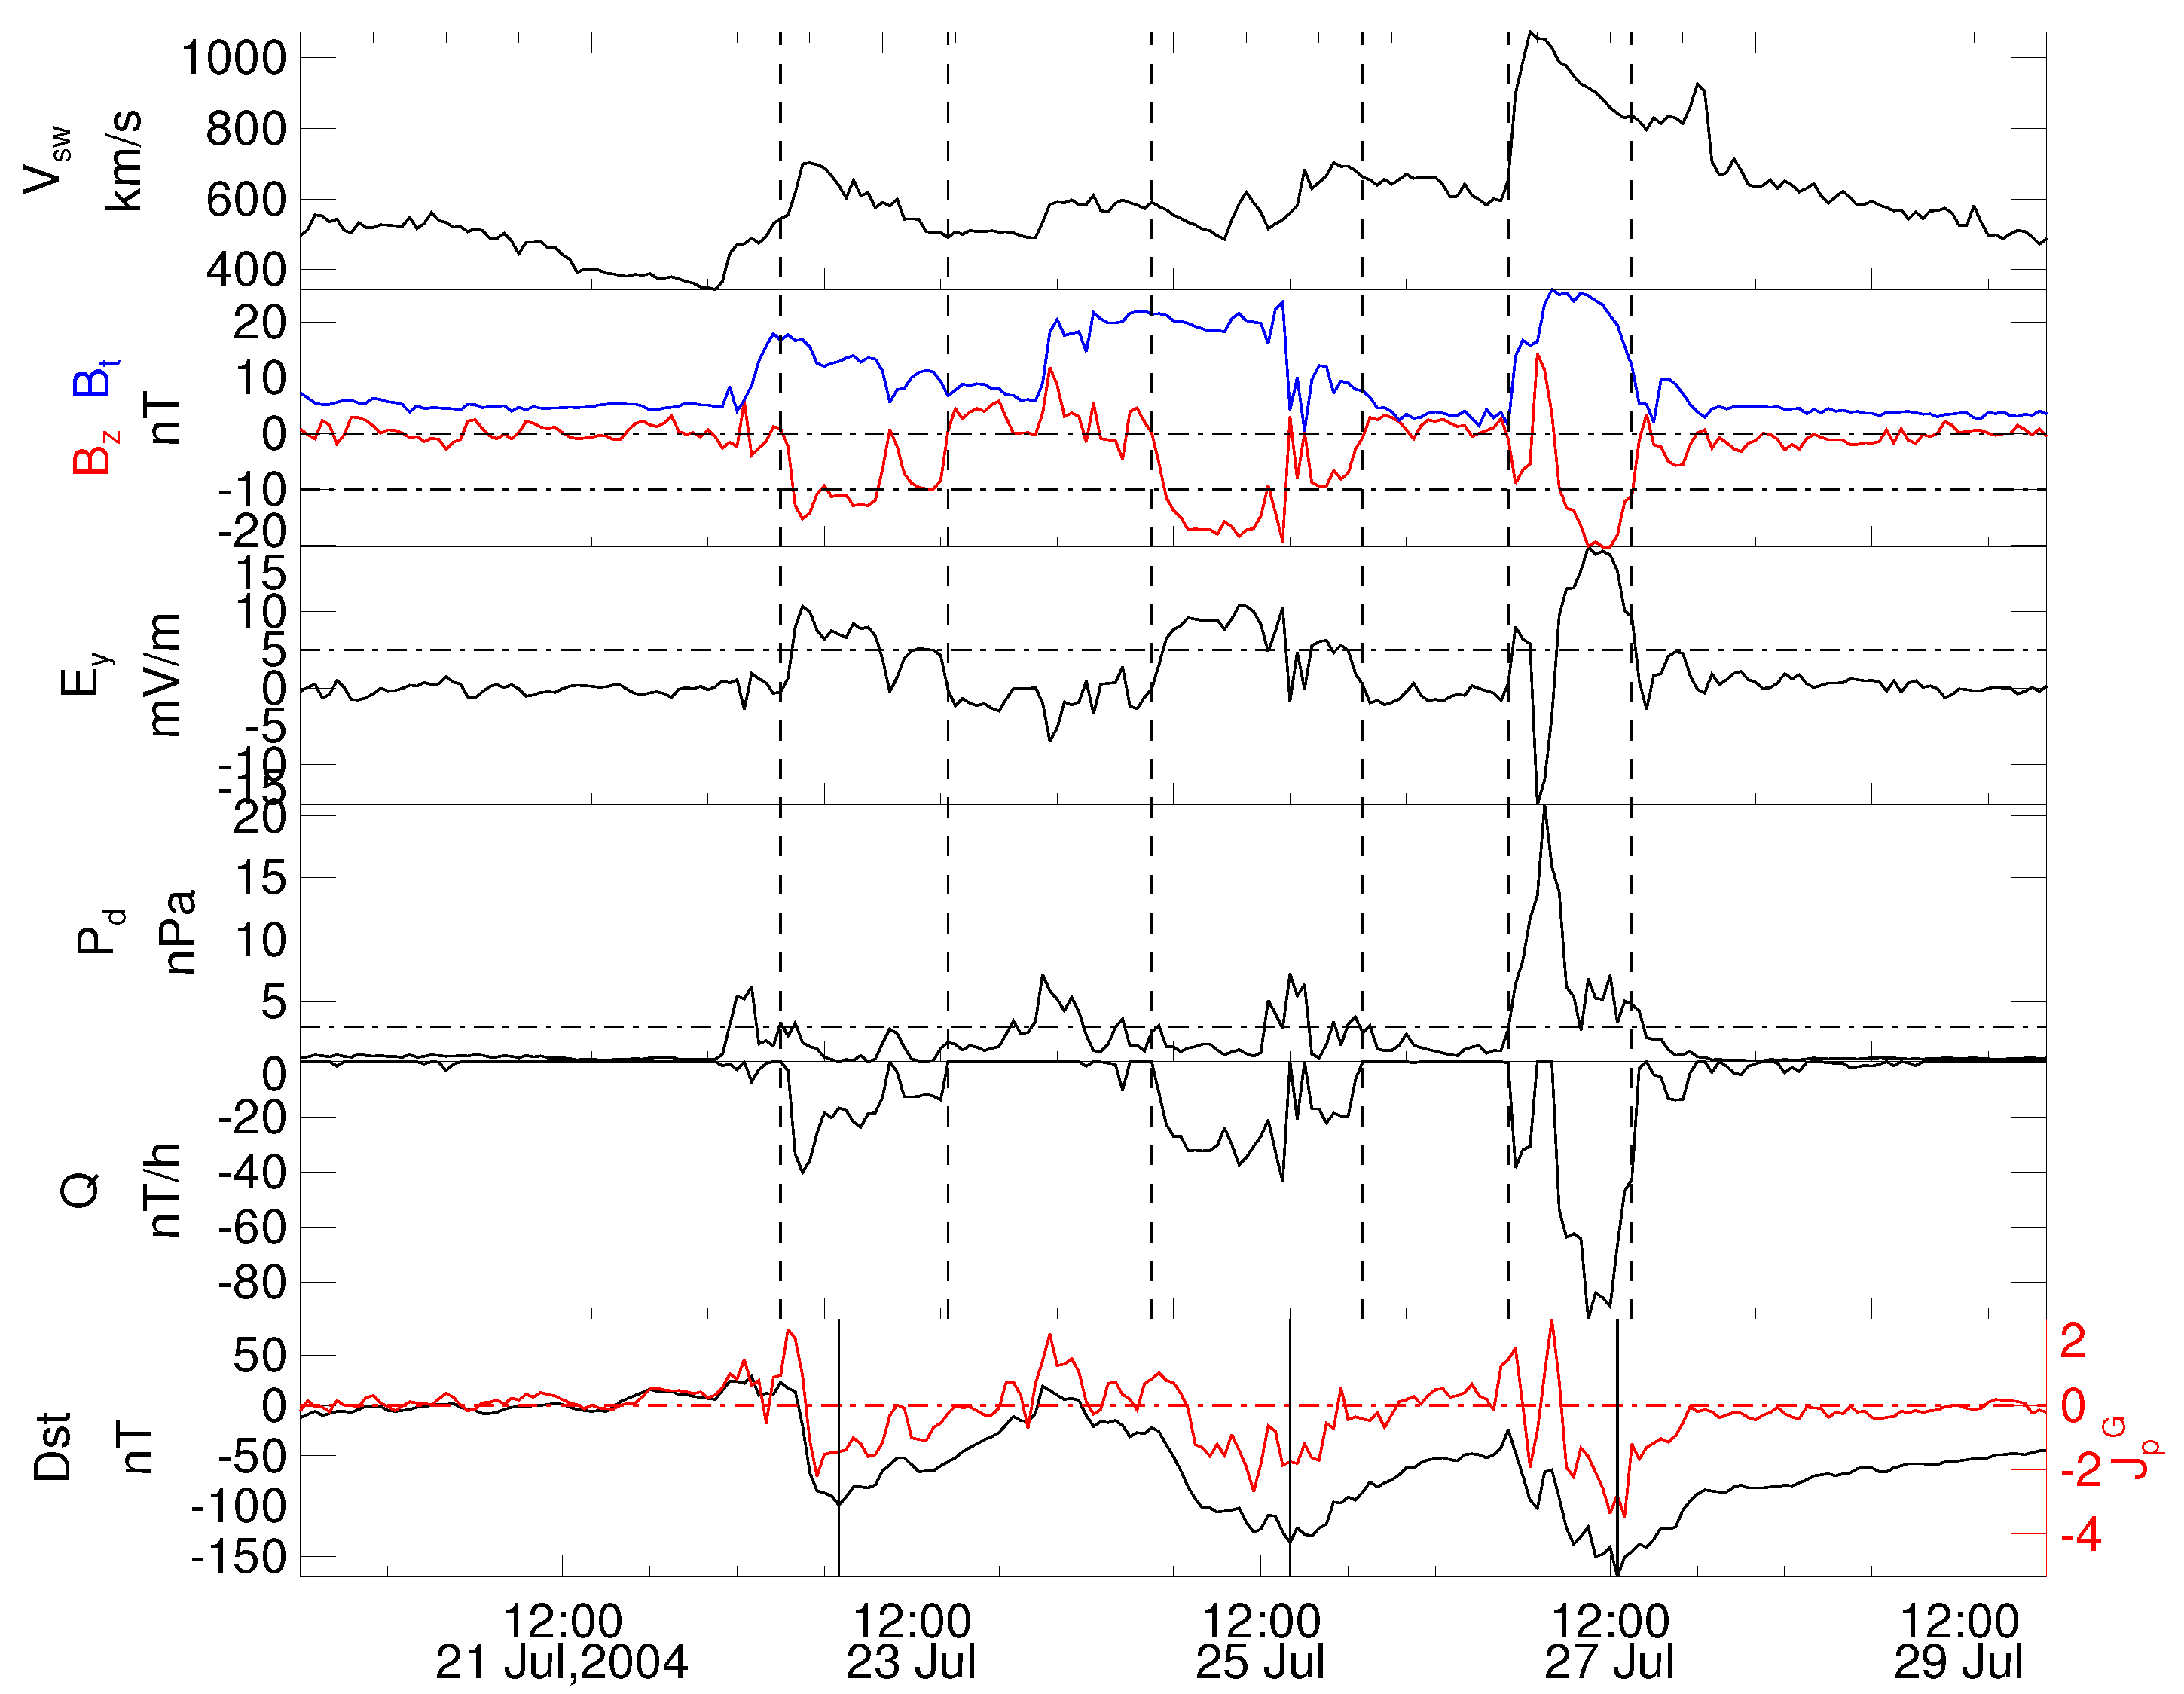
From 23 to 27 July 2004, three magnetic storms caused by ICME occurred [38]. As shown in Figure 6, three ICMEs caused three ring current energy injection processes, which are marked with vertical dashed lines in the figure. The first injection process was from 18:00 on 22 July to 17:00 on 23 July, the second injection process was from 21:00 on 24 July to 02:00 on 26 July, and the third injection process was from 22:00 on 26 July to 15:00 on 27 July. The three vertical solid lines mark the minimum values of the Dst index among each of the three magnetic storms. The first magnetic storm was at 02:00 on 23 July, and the minimum Dst is 99 nT ; the second magnetic storm was at 16:00 on 25 July, and the minimum Dst is 136 nT ; and the third storm at 13:00 on 27 July, the minimum Dst was 170 nT . For the ring current injection term Q, we can see in panel 5 that the three energy injection processes are independent of each other, but the recovery phase of the Dst index takes a long time, so there exist influences between former and later magnetic storms. The second magnetic storm has not fully recovered and then following the beginning of the third magnetic storm. However, J p G has a shorter recovery duration and shows three more independent processes than Q does. In summary, J p G can better respond to the multiple energy injection processes independently.

3.4. Statistical Analysis of Magnetic Storm Events

Zhao et al. [23] studied 32 great magnetic storms in the 23 and 24 solar cycles, which showed that the ring current injection parameter Q, expressed by the interplanetary electric field and the dynamic pressure of the solar wind, is the main driving factor of the great magnetic storm. We also choose these 32 geomagnetic storms (Zhao et al. [23]), and remove two storms that are outside the time range of the geomagnetic data in this paper. We, therefore, obtain a total of 30 great magnetic storm events and then investigate the dependence of minimum J p G on interplanetary energy injection parameter Q. It is shown in Figure 7 that the CC between Q minimum and J p G minimum is 0.82 with p-value of 0.00, indicating that our new J p G index correlates well with the interplanetary source in the amplitude aspect.
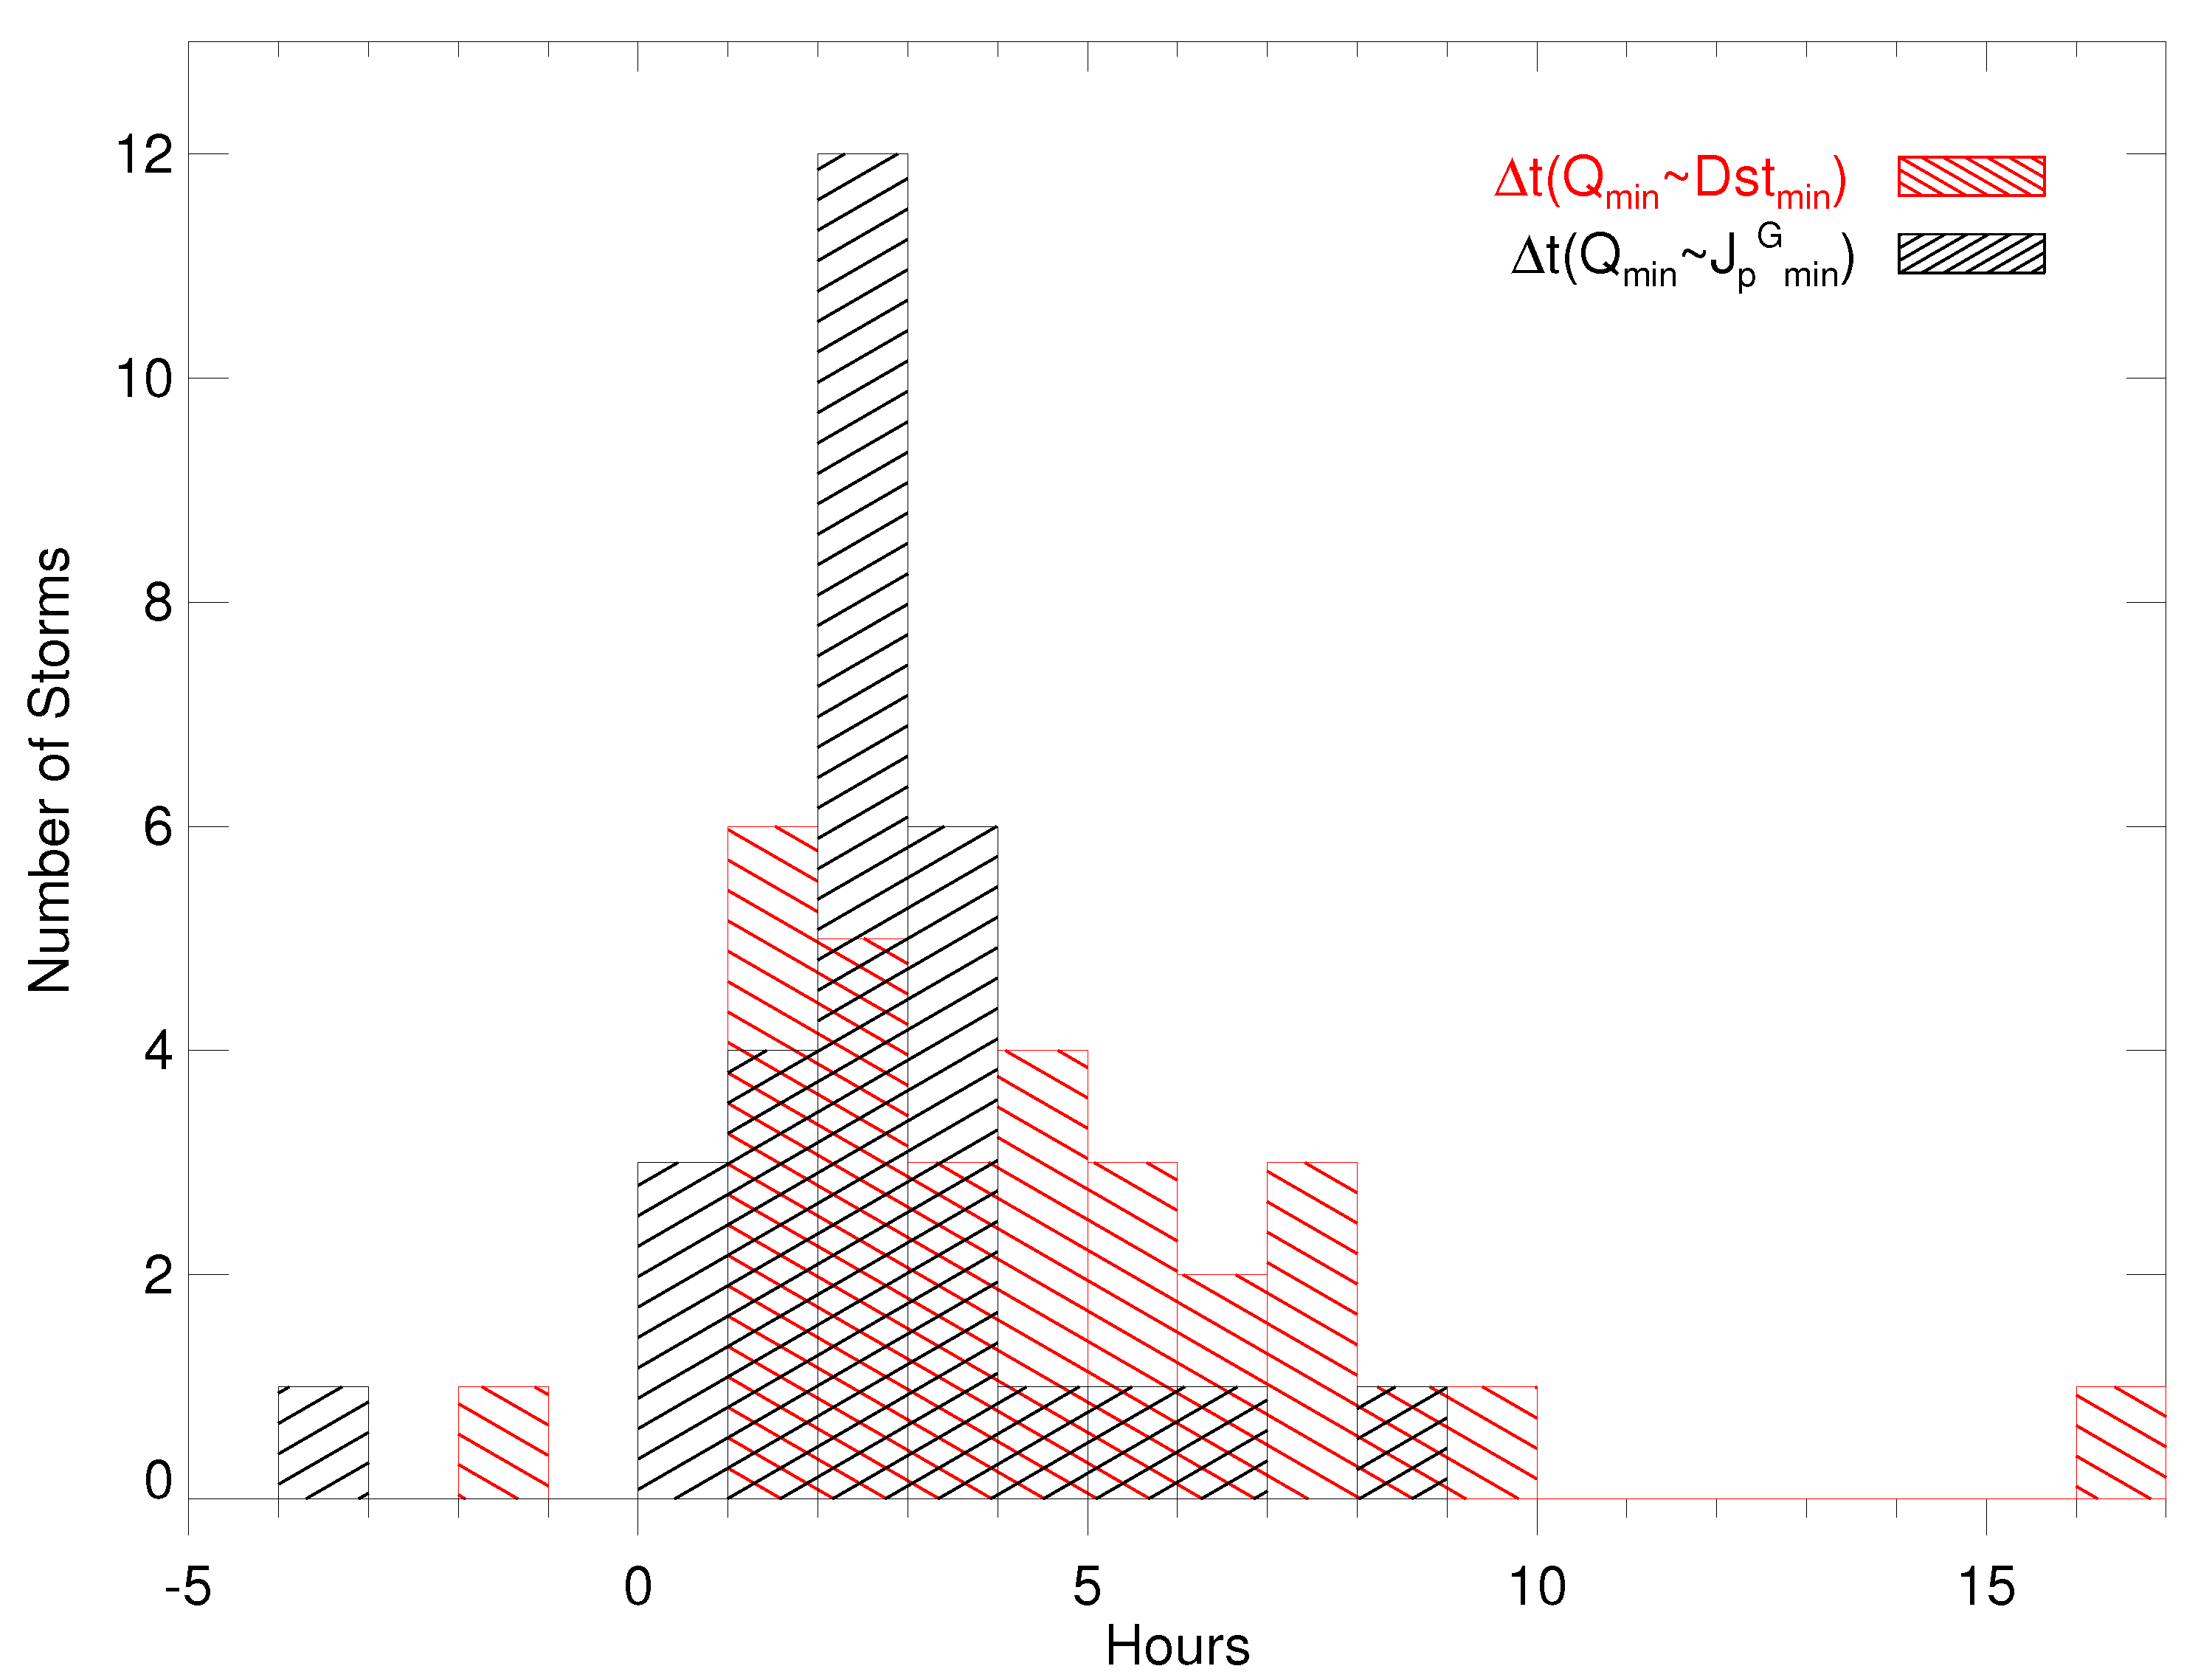
We then make statistics on the moment when Q reaches the minimum value and the moment when Dst and J p G are the minimum value, results are shown in Figure 8. The red histogram represents the number of storms distribution of the time delay between the minimum value of Q and the minimum value of Dst, denoted as Δ t ( Q m i n D s t m i n ) . The black histogram represents the number of storms distribution of the time delay between the minimum value of Q and the minimum value of J p G , denoting it as Δ t ( Q m i n J p G m i n ) . It is shown in the figure that Δ t ( Q m i n D s t m i n ) is mainly distributed between 1∼7 h, and its average is 4 h, while Δ t ( Q m i n J p G m i n ) is mainly distributed between 0∼3 h, and its average is 2.17 h.
There are many physical mechanisms by which energy and particles in the solar wind enter the magnetosphere, such as magnetic reconnection, polar cap injection, impulsive penetration of plasma on magnetopause, plasma diffusion, K-H instability, etc. It is generally believed that magnetic storms are mainly caused by magnetic field reconnection [14]. When the IMF is southward, the magnetic reconnection makes the solar wind energy enter the magnetotail region, and when the energy accumulates to a certain extent, the explosive release of particles and energy into the near-Earth space will eventually produce global geomagnetic disturbances. For different physical processes, the time between changes in interplanetary parameters and the response of the magnetosphere will vary, ranging from minutes to days (e.g., [39,40,41,42]). For example, ULF waves in the magnetosphere can be observed at ground-based geomagnetic stations rather quickly after a sudden increase in solar wind dynamic pressure [39], it takes about 30∼60 min for the solar wind energy to be injected into the magnetosphere and accumulated in the magnetotail [43], the formation of global geomagnetic storms will take longer delay time [44].
Gonzalez and Echer [45] statistically studied the time delay between the ACE satellite solar wind observation data and the geomagnetic storm Dst index, after deducting the 1-h delay from L1 point to the magnetosphere and the 1-h delay of the solar wind energy injected into the magnetospheric ring current to generate the response, the time difference between the peak value of the southward component of the IMF (Bs) and the peak value of Dst is 2 h on average. The solar wind data of OMNI is equivalent to the observed value of the shock nose position. Referring to the results of Gonzalez and Echer [45], the response time of Dst peak value to the OMNI solar wind parameters peak value should be slightly longer than 3 h, which is consistent with our result that the delay time Δ t ( Q m i n D s t m i n ) is 4 h in average, which is shown in Figure 8. The average response time of Δ t ( Q m i n J p G m i n ) is 2.17 h, indicating that J p G can reflect the injection process of solar wind energy into the magnetosphere in a more timely manner.
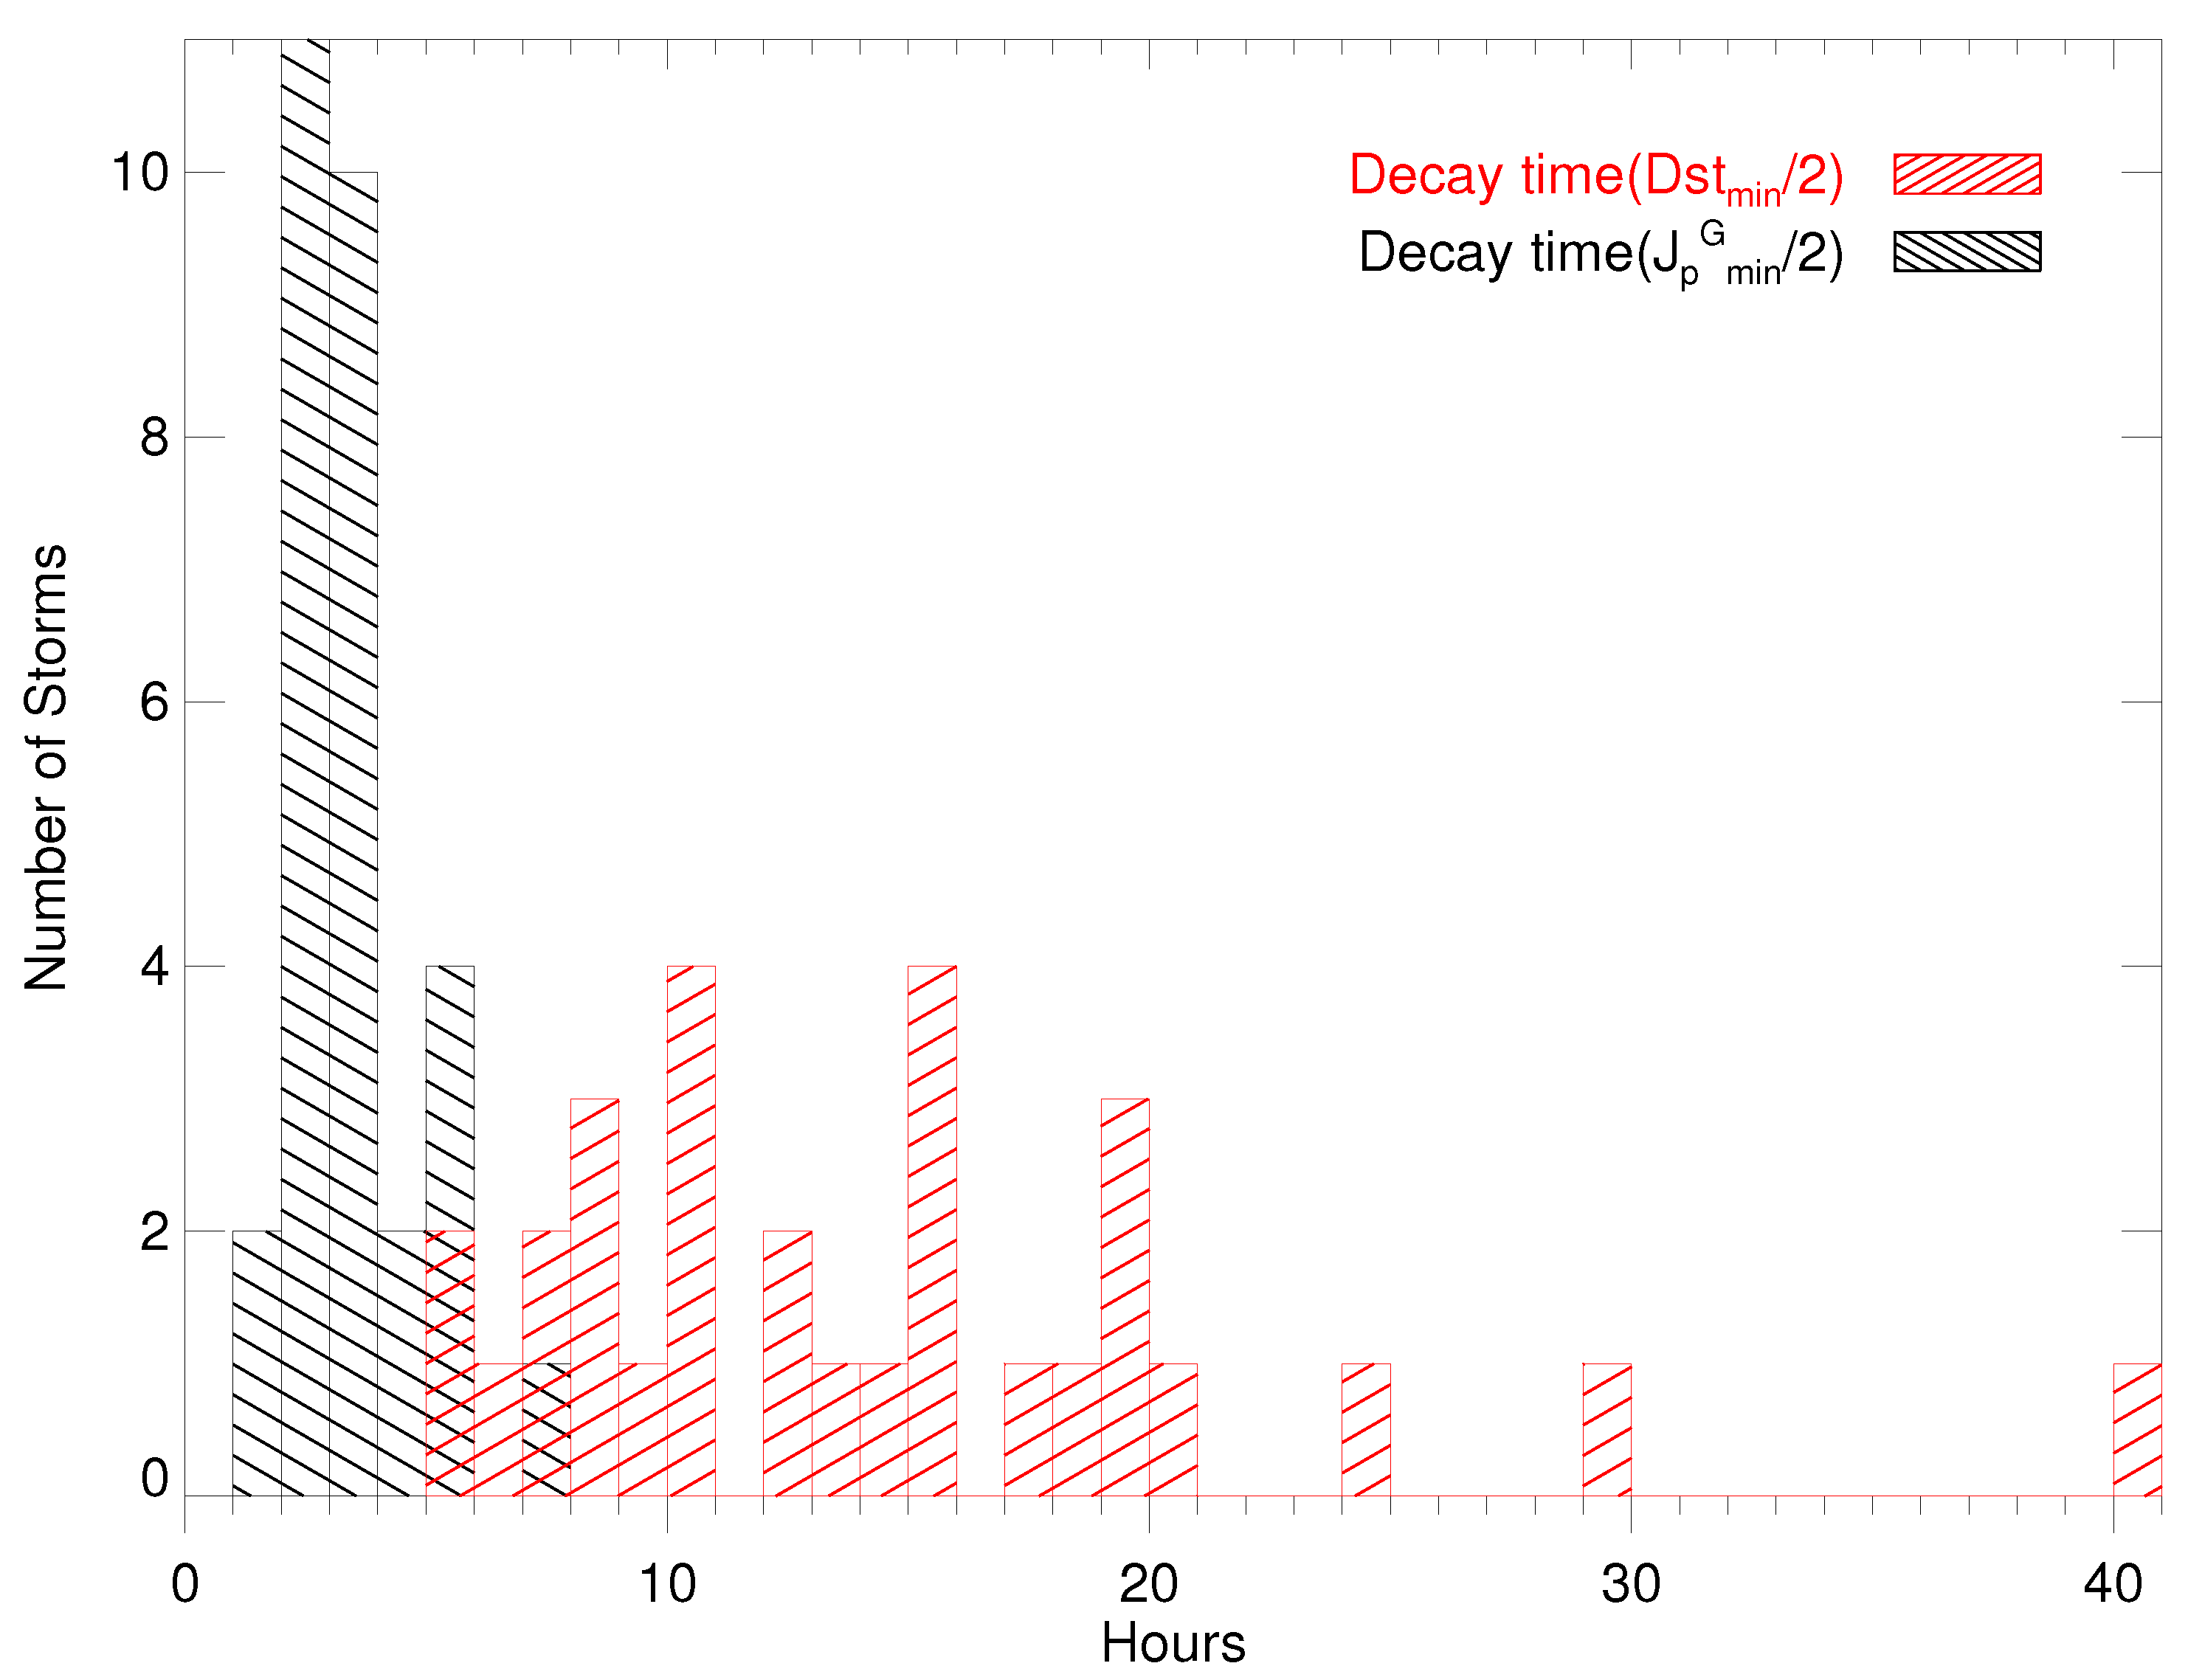
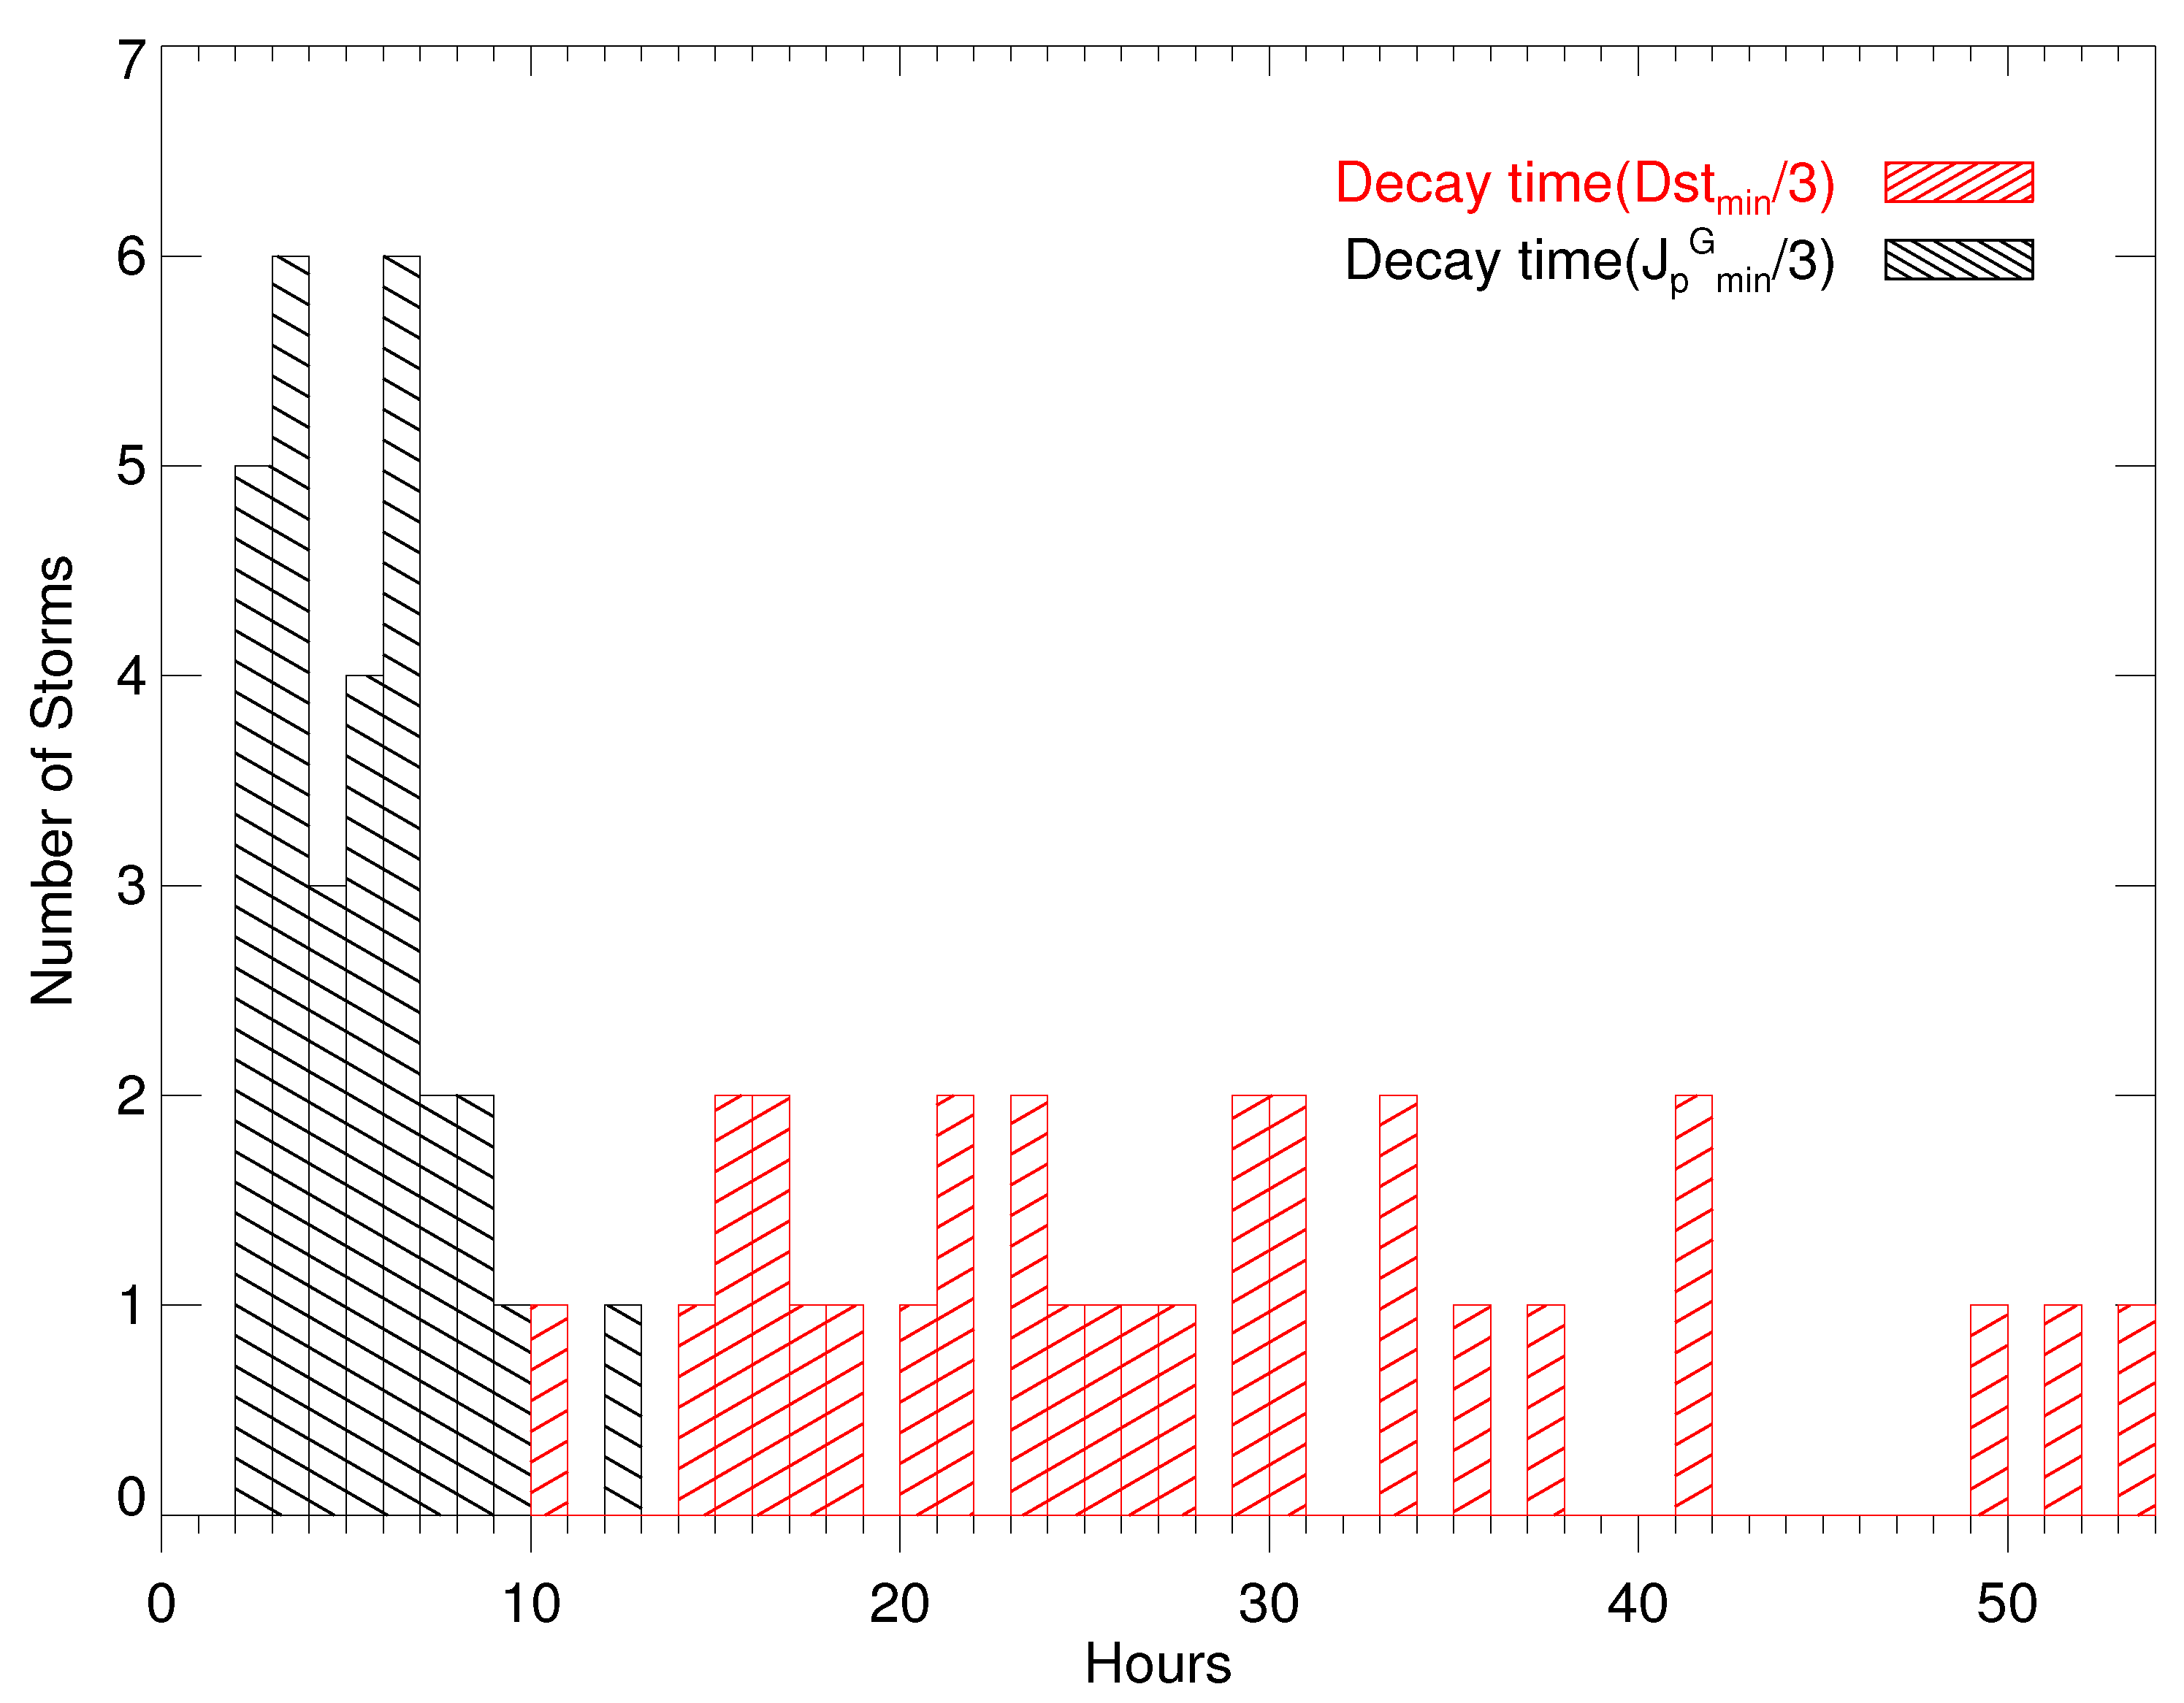
It is shown in previous case studies that the decay time of the Dst index is usually longer than the decay time of J p G . The decay of the magnetospheric ring current is believed to be mostly and exclusively dependent on the processes inside the magnetosphere, such as drift loss, charge exchange, Coulomb collision, and wave-particle interaction [44,46]. Because Dst varies during the recovery phase, with an amplitude variation up to 20% [46], the end time of the magnetic storm recovery phase is not possible to determine unambiguously [47], and also it is not easy to define the duration time of the recovery phase. Yokoyama and Kamide [47] defined the recovery phase duration as the time interval from the time of Dst minimum( D s t m i n ) to the time when Dst recovered to one-tenth of D s t m i n . Yermolaev et al. [46] used the time durations from D s t m i n to D s t m i n / 2 and D s t m i n / 3 as criteria of recovery time intervals. We use the same method as Yermolaev et al. did to evaluate the recovery phase durations of Dst, denoted as Δ t ( D s t m i n / 2 ) and Δ t ( D s t m i n / 3 ) respectively, and the recovery phase durations of J p G , denoted as Δ t ( J p G m i n / 2 ) and Δ t ( J p G m i n / 3 ) respectively.
The duration of the recovery phase increases as the storm magnitude increases [47]. The recovery phase of extreme storms can be divided into initial fast and later slow phase [48], in which the initial fast phase can be explained by exponential or hyperbolic function, and the later slow phase has a constant recovery rate [49]. D s t m i n / 2 can be treated as the separation between the fast and slow phase, so analysis of the two durations Δ t ( D s t m i n / 2 ) and Δ t ( D s t m i n / 3 ) can be used to compare the durations of the fast and slow parts of the recovery phase [50].
Firstly, we consider times when Dst or J p G decay to the levels of 1/2 of its minimum value as the end time of the recovery phase. Figure 9 shows the distribution of Δ t ( D s t m i n / 2 ) and Δ t ( J p G m i n / 2 ) . Δ t ( D s t m i n / 2 ) range from 5 h to 40 h and has an average value of 13.97 h. However, Δ t ( J p G m i n / 2 ) range from 1 h to 7 h, and has an average value of 2.97 h, which is only ∼21% of averaged Δ t ( D s t m i n / 2 ) . If we also treat J p G / 2 as the separation between the fast and slow phase during the decay of J p G , we can conclude that, in the fast recovery part, J p G has a shorter duration than Dst.
Secondly, we consider times when Dst or J p G decay to the levels of 1/3 of its minimum value as the end time of the recovery phase. Figure 10 shows the distribution of Δ t ( D s t m i n / 3 ) and Δ t ( J p G m i n / 3 ) . Δ t ( D s t m i n / 3 ) range from 10 h to 53 h and has an average value of 27.40 h. However, Δ t ( J p G m i n / 3 ) ranges from 2 h to 12 h and has an average value of 4.90 h. Δ t ( D s t m i n / 3 ) and Δ t ( J p G m i n / 3 ) both consist of a fast phase and slow phase, and their average duration shows that the whole recovery duration of J p G is considerably shorter than that of Dst. The average duration between D s t m i n / 2 to D s t m i n / 3 ( Δ t ( D s t s l o w ) ) is 13.43 h, which is 96.1% of Δ t ( D s t m i n / 2 ) , but the average duration between J p G m i n / 2 to J p G m i n / 3 ( Δ t ( J p G s l o w ) ) is 1.93 h, which is 65.0% of Δ t ( J p G m i n / 2 ) . Because Δ t ( J p G s l o w ) is undisputedly shorter than Δ t ( D s t s l o w ) , we furtherly compared the difference between the ratio of Δ t ( J p G s l o w ) to Δ t ( J p G m i n / 2 ) and the ratio of Δ t ( D s t s l o w ) to Δ t ( D s t m i n / 2 ) . As shown above, the duration of the slow phase in proportion to the fast phase for J p G is also smaller than that for Dst.

4. Summary and Conclusions

In this paper, we establish a new non-dimensional global geomagnetic disturbance index J p G by applying the spectral whitening method to the horizontal components of geomagnetic fields observed at eight ground-based stations distributed at low and middle latitudes from the years 1998 to 2014. We analyze the response process of J p G to solar wind energy injection through the case and statistical studies. The results are summarized below:
(1)
The J p G index can describe the development of geomagnetic storms and its relationship with the Dst index has been verified, which gives a CC of about 0.72.
(2)
We check the response of J p G to the arrival of upstream solar wind energy based on a proxy that the ring current injection term Q. The variation of J p G in course of geomagnetic storms is similar to the variation of Q, and the recorded Q m i n and J p G m i n for 30 great storms yields a relatively good CC of about 0.82. These results illustrate that J p G can effectively depict the storm evolution and is well related to the associated Q in amplitude, which provides an alternative means of geomagnetic storm forecasting.
(3)
The time difference between Q m i n and J p G m i n , as well as the decay time of J p G (time difference when J p G recovers from J p G m i n to half and/or one-third of its value), are shorter than those of the corresponding Dst index. And especially, for multiple storms occurred continuously on a short time scale, the recovery of the Dst index to a quiet period level can be affected by the following solar wind energy input, while the J p G index does not and exhibits independently.

Author Contributions

M.-X.Z. prepared the solar wind and geomagnetic data and wrote the original draft of the manuscript, wrote the IDL program to show the variation in the solar wind and the geomagnetic data over time, and made the calculations needed for the study; J.-S.W. provided the idea and checked and revised the manuscript; X.-W.Z. checked the manuscript. All authors took part in, discussed, and agreed upon the results of the calculations. All authors have read and agreed to the published version of the manuscript.

Funding

This research was funded by the National Natural Science Foundation of China (grant numbers 42274217 and 41774195).

Institutional Review Board Statement

Not applicable.

Informed Consent Statement

Not applicable.

Data Availability Statement

We acknowledge the use of NASA and GSFC’s Space Physics Data Facility’s OMNI data and web service (https://omniweb.gsfc.nasa.gov/html/ow_data.html, accessed on 27 April 2022). We also thank the Center for Geomagnetism and Space Magnetism at Kyoto University for providing the Dst index.

Conflicts of Interest

The authors declare no conflict of interest.

References

  1. Tsurutani, B.T.; Gonzalez, W.D. The Interplanetary Causes of Magnetic Storms: A Review. In Magnetic Storms; American Geophysical Union (AGU): Washington, DC, USA, 1997; pp. 77–89. [Google Scholar] [CrossRef]
  2. Gonzalez, W.D.; Tsurutani, B.T.; Clúa de Gonzalez, A.L. Interplanetary origin of geomagnetic storms. Space Sci. Rev. 1999, 88, 529–562. [Google Scholar] [CrossRef]
  3. Yermolaev, Y.; Yermolaev, M.; Zastenker, G.; Zelenyi, L.; Petrukovich, A.; Sauvaud, J.A. Statistical studies of geomagnetic storm dependencies on solar and interplanetary events: A review. Planet. Space Sci. 2005, 53, 189–196. [Google Scholar] [CrossRef]
  4. Dal Lago, A.; Gonzalez, W.D.; Balmaceda, L.A.; Vieira, L.E.A.; Echer, E.; Guarnieri, F.L.; Santos, J.; da Silva, M.R.; de Lucas, A.; Clua de Gonzalez, A.L.; et al. The 17–22 October (1999) solar-interplanetary-geomagnetic event: Very intense geomagnetic storm associated with a pressure balance between interplanetary coronal mass ejection and a high-speed stream. J. Geophys. Res. Space Phys. 2006, 111, A07S14. [Google Scholar] [CrossRef]
  5. Nitta, N.V.; Mulligan, T.; Kilpua, E.K.J.; Lynch, B.J.; Mierla, M.; O’Kane, J.; Pagano, P.; Palmerio, E.; Pomoell, J.; Richardson, I.G.; et al. Understanding the Origins of Problem Geomagnetic Storms Associated with “Stealth” Coronal Mass Ejections. Space Sci. Rev. 2021, 217, 82. [Google Scholar] [CrossRef] [PubMed]
  6. Qudsi, R.A.; Maruca, B.A.; Matthaeus, W.H.; Parashar, T.N.; Bandyopadhyay, R.; Chhiber, R.; Chasapis, A.; Goldstein, M.L.; Bale, S.D.; Bonnell, J.W.; et al. Observations of Heating along Intermittent Structures in the Inner Heliosphere from PSP Data. Astrophys. J. Suppl. Ser. 2020, 246, 46. [Google Scholar] [CrossRef]
  7. Matthaeus, W.H.; Velli, M. Who Needs Turbulence? Space Sci. Rev. 2011, 160, 145. [Google Scholar] [CrossRef]
  8. Eastwood, J.P.; Nakamura, R.; Turc, L.; Mejnertsen, L.; Hesse, M. The Scientific Foundations of Forecasting Magnetospheric Space Weather. Space Sci. Rev. 2017, 212, 1221–1252. [Google Scholar] [CrossRef]
  9. Prölss, G.W. Density Perturbations in the Upper Atmosphere Caused by the Dissipation of Solar Wind Energy. Surv. Geophys. 2011, 32, 101–195. [Google Scholar] [CrossRef]
  10. Cai, X.; Burns, A.G.; Wang, W.; Qian, L.; Solomon, S.C.; Eastes, R.W.; McClintock, W.E.; Laskar, F.I. Investigation of a Neutral “Tongue” Observed by GOLD During the Geomagnetic Storm on May 11, 2019. J. Geophys. Res. Space Phys. 2021, 126, e2020JA028817. [Google Scholar] [CrossRef]
  11. Yu, T.; Wang, W.; Ren, Z.; Yue, J.; Yue, X.; He, M. Middle-Low Latitude Neutral Composition and Temperature Responses to the 20 and 21 November 2003 Superstorm From GUVI Dayside Limb Measurements. J. Geophys. Res. Space Phys. 2021, 126, e2020JA028427. [Google Scholar] [CrossRef]
  12. Rajesh, P.K.; Lin, C.H.; Lin, C.Y.; Chen, C.H.; Liu, J.Y.; Matsuo, T.; Chen, S.P.; Yeh, W.H.; Huang, C.Y. Extreme Positive Ionosphere Storm Triggered by a Minor Magnetic Storm in Deep Solar Minimum Revealed by FORMOSAT-7/COSMIC-2 and GNSS Observations. J. Geophys. Res. Space Phys. 2021, 126, e2020JA028261. [Google Scholar] [CrossRef]
  13. Horvath, I.; Lovell, B.C. Investigating the Coupled Magnetosphere-Ionosphere-Thermosphere (M-I-T) System’s Responses to the 20 November 2003 Superstorm. J. Geophys. Res. Space Phys. 2021, 126, e2021JA029215. [Google Scholar] [CrossRef]
  14. Dungey, J.W. Interplanetary Magnetic Field and the Auroral Zones. Phys. Rev. Lett. 1961, 6, 47–48. [Google Scholar] [CrossRef]
  15. Cowley, S.; Owen, C. A simple illustrative model of open flux tube motion over the dayside magnetopause. Planet. Space Sci. 1989, 37, 1461–1475. [Google Scholar] [CrossRef]
  16. Pulkkinen, T.I.; Dimmock, A.P.; Lakka, A.; Osmane, A.; Kilpua, E.; Myllys, M.; Tanskanen, E.I.; Viljanen, A. Magnetosheath control of solar wind-magnetosphere coupling efficiency. J. Geophys. Res. Space Phys. 2016, 121, 8728–8739. [Google Scholar] [CrossRef]
  17. Gonzalez, W.D.; Joselyn, J.A.; Kamide, Y.; Kroehl, H.W.; Rostoker, G.; Tsurutani, B.T.; Vasyliunas, V.M. What is a geomagnetic storm? J. Geophys. Res. Space Phys. 1994, 99, 5771–5792. [Google Scholar] [CrossRef]
  18. Russell, C.T.; Lu, G.; Luhmann, J.G. Lessons from the ring current injection during the September 24, 25, 1998 storm. Geophys. Res. Lett. 2000, 27, 1371–1374. [Google Scholar] [CrossRef]
  19. Tsurutani, B.T.; Lakhina, G.S.; Hajra, R. The physics of space weather/solar-terrestrial physics (STP): What we know now and what the current and future challenges are. Nonlinear Process. Geophys. 2020, 27, 75–119. [Google Scholar] [CrossRef]
  20. Gonzalez, W.D.; Tsurutani, B.T. Criteria of interplanetary parameters causing intense magnetic storms (Dst <-100 nT). Planet. Space Sci. 1987, 35, 1101–1109. [Google Scholar] [CrossRef]
  21. Loewe, C.A.; Prölss, G.W. Classification and mean behavior of magnetic storms. J. Geophys. Res. Space Phys. 1997, 102, 14209–14213. [Google Scholar] [CrossRef]
  22. Xue, X.; Wang, Y.; Ye, P.; Wang, S.; Xiong, M. Analysis on the interplanetary causes of the great magnetic storms in solar maximum (2000–2001). Planet. Space Sci. 2005, 53, 443–457. [Google Scholar] [CrossRef]
  23. Zhao, M.X.; Le, G.M.; Li, Q.; Liu, G.A.; Mao, T. Dependence of Great Geomagnetic Storm (Δ SYM-H≤-200nT) on Associated Solar Wind Parameters. Sol. Phys. 2021, 296, 66. [Google Scholar] [CrossRef]
  24. Borovsky, J.E.; Shprits, Y.Y. Is the Dst Index Sufficient to Define All Geospace Storms? J. Geophys. Res. Space Phys. 2017, 122, 11543–11547. [Google Scholar] [CrossRef]
  25. Borovsky, J.E. Is Our Understanding of Solar-Wind/Magnetosphere Coupling Satisfactory? Front. Astron. Space Sci. 2021, 8, 634073. [Google Scholar] [CrossRef]
  26. Yermolaev, Y.I.; Lodkina, I.G.; Dremukhina, L.A.; Yermolaev, M.Y.; Khokhlachev, A.A. What Solar–Terrestrial Link Researchers Should Know about Interplanetary Drivers. Universe 2021, 7, 138. [Google Scholar] [CrossRef]
  27. Burton, R.K.; McPherron, R.L.; Russell, C.T. An empirical relationship between interplanetary conditions and Dst. J. Geophys. Res. 1975, 80, 4204–4214. [Google Scholar] [CrossRef]
  28. O’Brien, T.P.; McPherron, R.L. An empirical phase space analysis of ring current dynamics: Solar wind control of injection and decay. J. Geophys. Res. Space Phys. 2000, 105, 7707–7719. [Google Scholar] [CrossRef]
  29. Wang, C.B.; Chao, J.K.; Lin, C.H. Influence of the solar wind dynamic pressure on the decay and injection of the ring current. J. Geophys. Res. Space Phys. 2003, 108. [Google Scholar] [CrossRef]
  30. Zhao, M.X.; Le, G.M.; Lu, J. Can We Estimate the Intensities of Great Geomagnetic Storms (Δ SYM-H ≤ −200 nT) with the Burton Equation or the O’Brien and McPherron Equation? Astrophys. J. 2022, 928, 18. [Google Scholar] [CrossRef]
  31. Liu, G.A.; Zhao, M.X.; Le, G.M.; Mao, T. What Can We Learn from the Geoeffectiveness of the Magnetic Cloud on 2012 July 15–17? Res. Astron. Astrophys. 2022, 22, 015002. [Google Scholar] [CrossRef]
  32. Wang, J.S.; Chen, Z.; Huang, C.M. A method to identify aperiodic disturbances in the ionosphere. Ann. Geophys. 2014, 32, 563–569. [Google Scholar] [CrossRef]
  33. Chen, Z.; Wang, J.S.; Huang, C.M.; Huang, L.F. A new pair of indices to describe the relationship between ionospheric disturbances and geomagnetic activity. J. Geophys. Res. Space Phys. 2014, 119, 10156–10163. [Google Scholar] [CrossRef]
  34. Zhao, Y.; Mao, T.; Chen, Z.; Wang, J. Ionospheric Weather Disturbance Indices Based on Spectral Whitening. J. Space Sci. 2017, 37, 270–276. [Google Scholar] [CrossRef]
  35. Yamazaki, Y.; Häusler, K.; Wild, J.A. Day-to-day variability of midlatitude ionospheric currents due to magnetospheric and lower atmospheric forcing. J. Geophys. Res. Space Phys. 2016, 121, 7067–7086. [Google Scholar] [CrossRef]
  36. Liu, H.L. Variability and predictability of the space environment as related to lower atmosphere forcing. Space Weather 2016, 14, 634–658. [Google Scholar] [CrossRef]
  37. Bewick, V.; Cheek, L.; Ball, J. Statistics review 7: Correlation and regression. Crit. Care 2003, 7, 451–459. [Google Scholar] [CrossRef]
  38. Zhang, J.; Richardson, I.G.; Webb, D.F.; Gopalswamy, N.; Huttunen, E.; Kasper, J.C.; Nitta, N.V.; Poomvises, W.; Thompson, B.J.; Wu, C.C.; et al. Solar and interplanetary sources of major geomagnetic storms (Dst ≤ −100 nT) during 1996–2005. J. Geophys. Res. Space Phys. 2007, 112. [Google Scholar] [CrossRef]
  39. Keiling, A.; Takahashi, K. Review of Pi2 Models. Space Sci. Rev. 2011, 161, 63–148. [Google Scholar] [CrossRef]
  40. Yu, Y.; Ridley, A.J. Response of the magnetosphere-ionosphere system to a sudden southward turning of interplanetary magnetic field. J. Geophys. Res. Space Phys. 2009, 114. [Google Scholar] [CrossRef] [Green Version]
  41. Li, Q.; Zhao, M.X.; Le, G.M. Properties of the Geomagnetic Storm Main Phase and the Corresponding Solar Wind Parameters on 21–22 October 1999. Universe 2022, 8, 346. [Google Scholar] [CrossRef]
  42. Milan, S.E.; Clausen, L.B.N.; Coxon, J.C.; Carter, J.A.; Walach, M.T.; Laundal, K.; Østgaard, N.; Tenfjord, P.; Reistad, J.; Snekvik, K.; et al. Overview of Solar Wind–Magnetosphere–Ionosphere–Atmosphere Coupling and the Generation of Magnetospheric Currents. Space Sci. Rev. 2017, 206, 547–573. [Google Scholar] [CrossRef]
  43. Bargatze, L.F.; Ogino, T.; McPherron, R.L.; Walker, R.J. Solar wind magnetic field control of magnetospheric response delay and expansion phase onset timing. J. Geophys. Res. Space Phys. 1999, 104, 14583–14599. [Google Scholar] [CrossRef]
  44. Daglis, I.A.; Thorne, R.M.; Baumjohann, W.; Orsini, S. The terrestrial ring current: Origin, formation, and decay. Rev. Geophys. 1999, 37, 407–438. [Google Scholar] [CrossRef]
  45. Gonzalez, W.D.; Echer, E. A study on the peak Dst and peak negative Bz relationship during intense geomagnetic storms. Geophys. Res. Lett. 2005, 32. [Google Scholar] [CrossRef]
  46. Yermolaev, Y.I.; Lodkina, I.G.; Nikolaeva, N.S.; Yermolaev, M.Y. Recovery phase of magnetic storms induced by different interplanetary drivers. J. Geophys. Res. Space Phys. 2012, 117. [Google Scholar] [CrossRef]
  47. Yokoyama, N.; Kamide, Y. Statistical nature of geomagnetic storms. J. Geophys. Res. Space Phys. 1997, 102, 14215–14222. [Google Scholar] [CrossRef]
  48. Akasofu, S.I.; Chapman, S.; Venkatesan, D. The main phase of great magnetic storms. J. Geophys. Res. 1963, 68, 3345–3350. [Google Scholar] [CrossRef]
  49. Choraghe, K.; Raghav, A.; Chakrabarty, D.; Kasthurirangan, S.; Bijewar, N. Properties of the Recovery Phase of Extreme Storms. J. Geophys. Res. Space Phys. 2021, 126, e2020JA028685. [Google Scholar] [CrossRef]
  50. Yermolaev, Y.I.; Lodkina, I.G.; Nikolaeva, N.S.; Yermolaev, M.Y. Influence of the interplanetary driver type on the durations of the main and recovery phases of magnetic storms. J. Geophys. Res. Space Phys. 2014, 119, 8126–8136. [Google Scholar] [CrossRef] [Green Version]
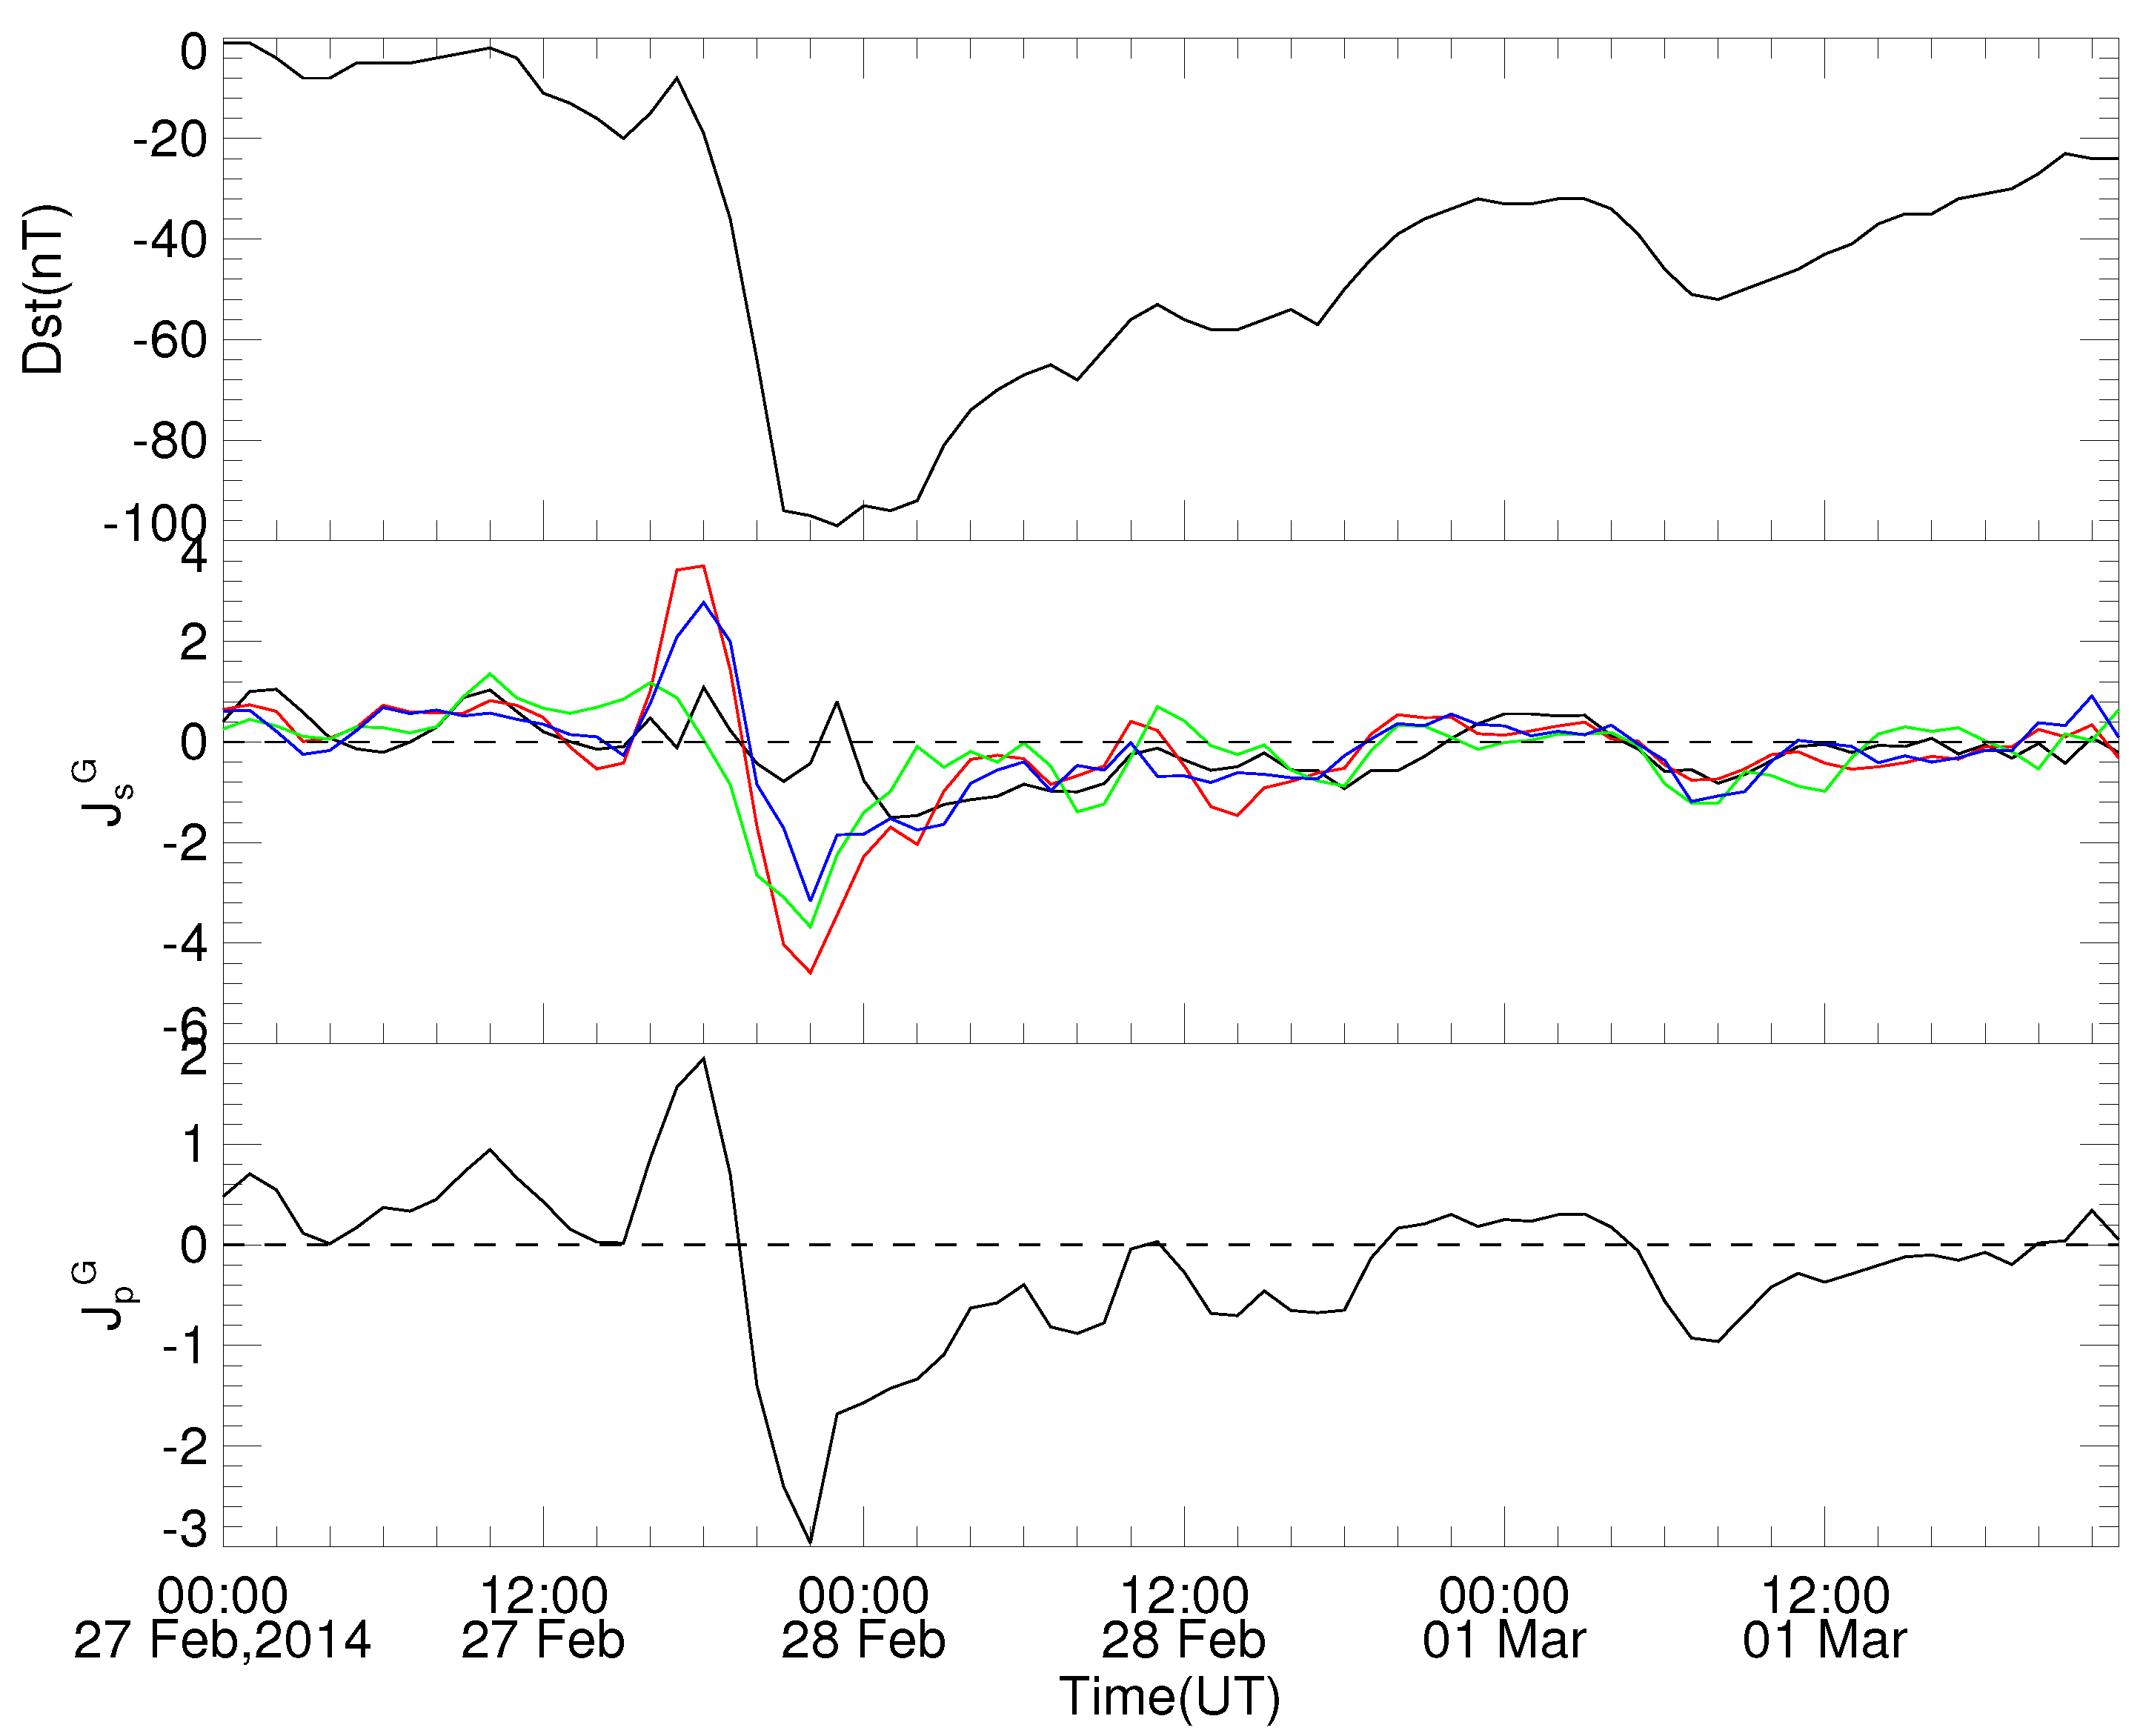
Figure 1. Comparation of the Dst index and our new index during the magnetic storm from 27 February to 1 March 2014. The top panel shows the Dst index. The middle panel shows the single–station geomagnetic disturbance index J s G for HER (green), KAK (black), HON (blue), and SJG (red) stations. The bottom panel shows the global geomagnetic disturbance index J p G .
Universe 08 00506 g001
Figure 2. The variation of the CC between the Dst index and the J p G index when the number of stations used in the construction of J p G varies from 1 to 18.
Universe 08 00506 g002
Figure 3. The global map with these eight stations locations marked as red circle.
Universe 08 00506 g003
Figure 4. The great magnetic storm event on 20 November 2003. From top panel to bottom panel, there is the solar wind speed ( V s w ), the total strength of the IMF ( B t ) (blue line), and the north–south component B z (red line), the east–west electric field ( E y ), and the solar wind dynamic pressure ( P d ), the ring current injection term (Q in which γ = 0.44 ), the global geomagnetic disturbance index J p G calculated by the SWM based on 8 stations (red line), and the Dst index (black line). The two horizontal line in panel 2 are B z = 0 nT and B z = 10 nT , the horizontal line in panel 3 is E y = 5 mV / m , the horizontal line in panel 4 is P d = 3 nPa , and the horizontal line in the last panel is Dst = 0 nT and J p G = 0 . The vertical lines in the top 5 panels are 07:00 20 Nov, 16:00 20 Nov, 18:00 20 Nov, and 01:00 21 Nov, respectively. The vertical lines in the bottom panel are 07:00 20 Nov, 20:00 20 Nov, and 01:00 21 Nov, respectively.
Universe 08 00506 g004
Figure 5. The great magnetic storm event on 15 May 2005. The panels are similar to Figure 4. The vertical lines in the top 5 panels are 02:00 15 May, 06:00 15 May, and 08:00 15 May, respectively. The vertical lines in the bottom panel are 02:00 15 May, and 08:00 15 May, respectively.
Universe 08 00506 g005
Figure 6. The great magnetic storm events on 23–27 July 2004. The panels are similar to Figure 4. The vertical lines in the top 5 panels are 02:00 15 May, 06:00 15 May, and 08:00 15 May, respectively. The vertical lines in the bottom panel are 02:00 15 May, and 08:00 15 May, respectively.
Universe 08 00506 g006
Figure 7. Correlation between Q minimum and J p G minimum for 30 great magnetic storm events from 1998 to 2014.
Universe 08 00506 g007
Figure 8. The distribution of delay times between Q minimum and Dst minimum (red), denoted as Δ t ( Q m i n D s t m i n ) , and delay times between Q minimum and J p G minimum (black), denoted as Δ t ( Q m i n J p G m i n ) .
Universe 08 00506 g008
Figure 9. Distributions of magnetic storm recovery durations, the start and end time of the recovery phase are the time when the geomagnetic index is at the minimum value and the time when the geomagnetic index is restored to 1/2 of the minimum value, the red is the Dst index, and the black is the J p G index.
Universe 08 00506 g009
Figure 10. Distributions of magnetic storm recovery durations, the start and end time of the recovery phase are the time when the geomagnetic index is at the minimum value and the time when the geomagnetic index is restored to 1/3 of the minimum value, the red is the Dst index, and the black is the J p G index.
Universe 08 00506 g010
Publisher’s Note: MDPI stays neutral with regard to jurisdictional claims in published maps and institutional affiliations.