
A Long-Term Study of Ultraluminous X-ray Sources in NGC 891


Abstract
1. Introduction
2. Data Reduction and Analysis
2.1. XMM-Newton Observations
2.2. Chandra Observations
3. Results
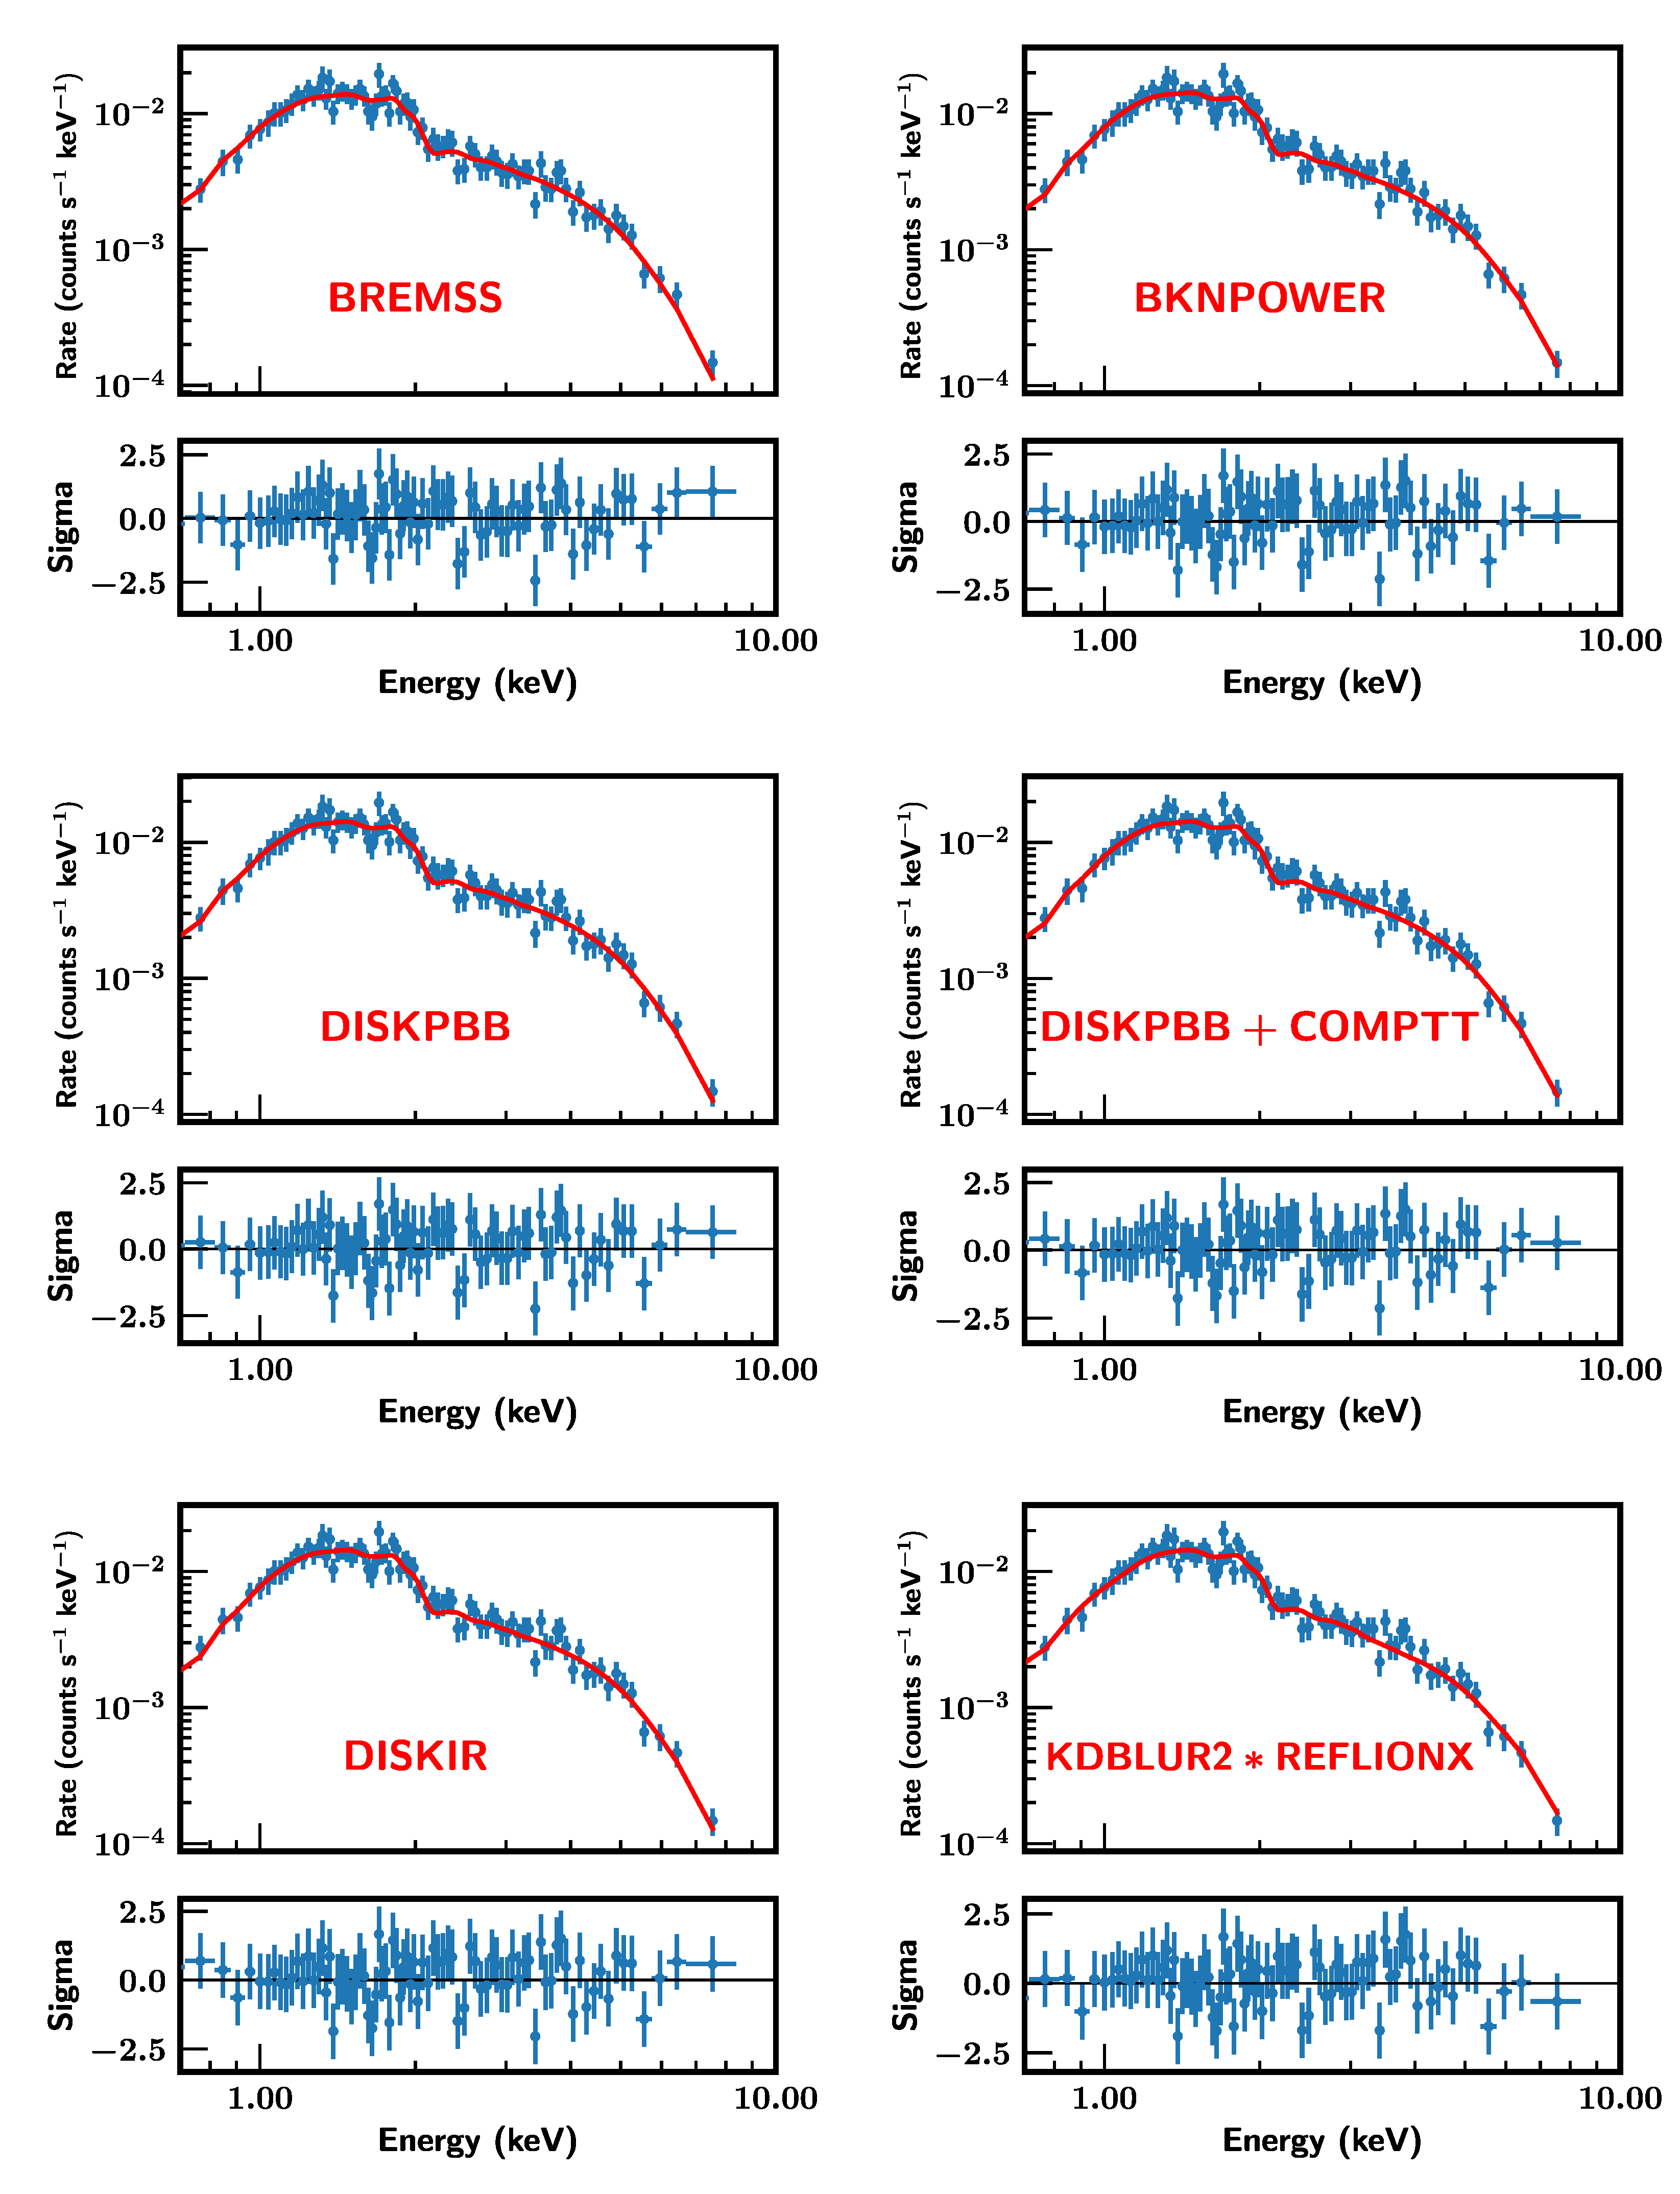
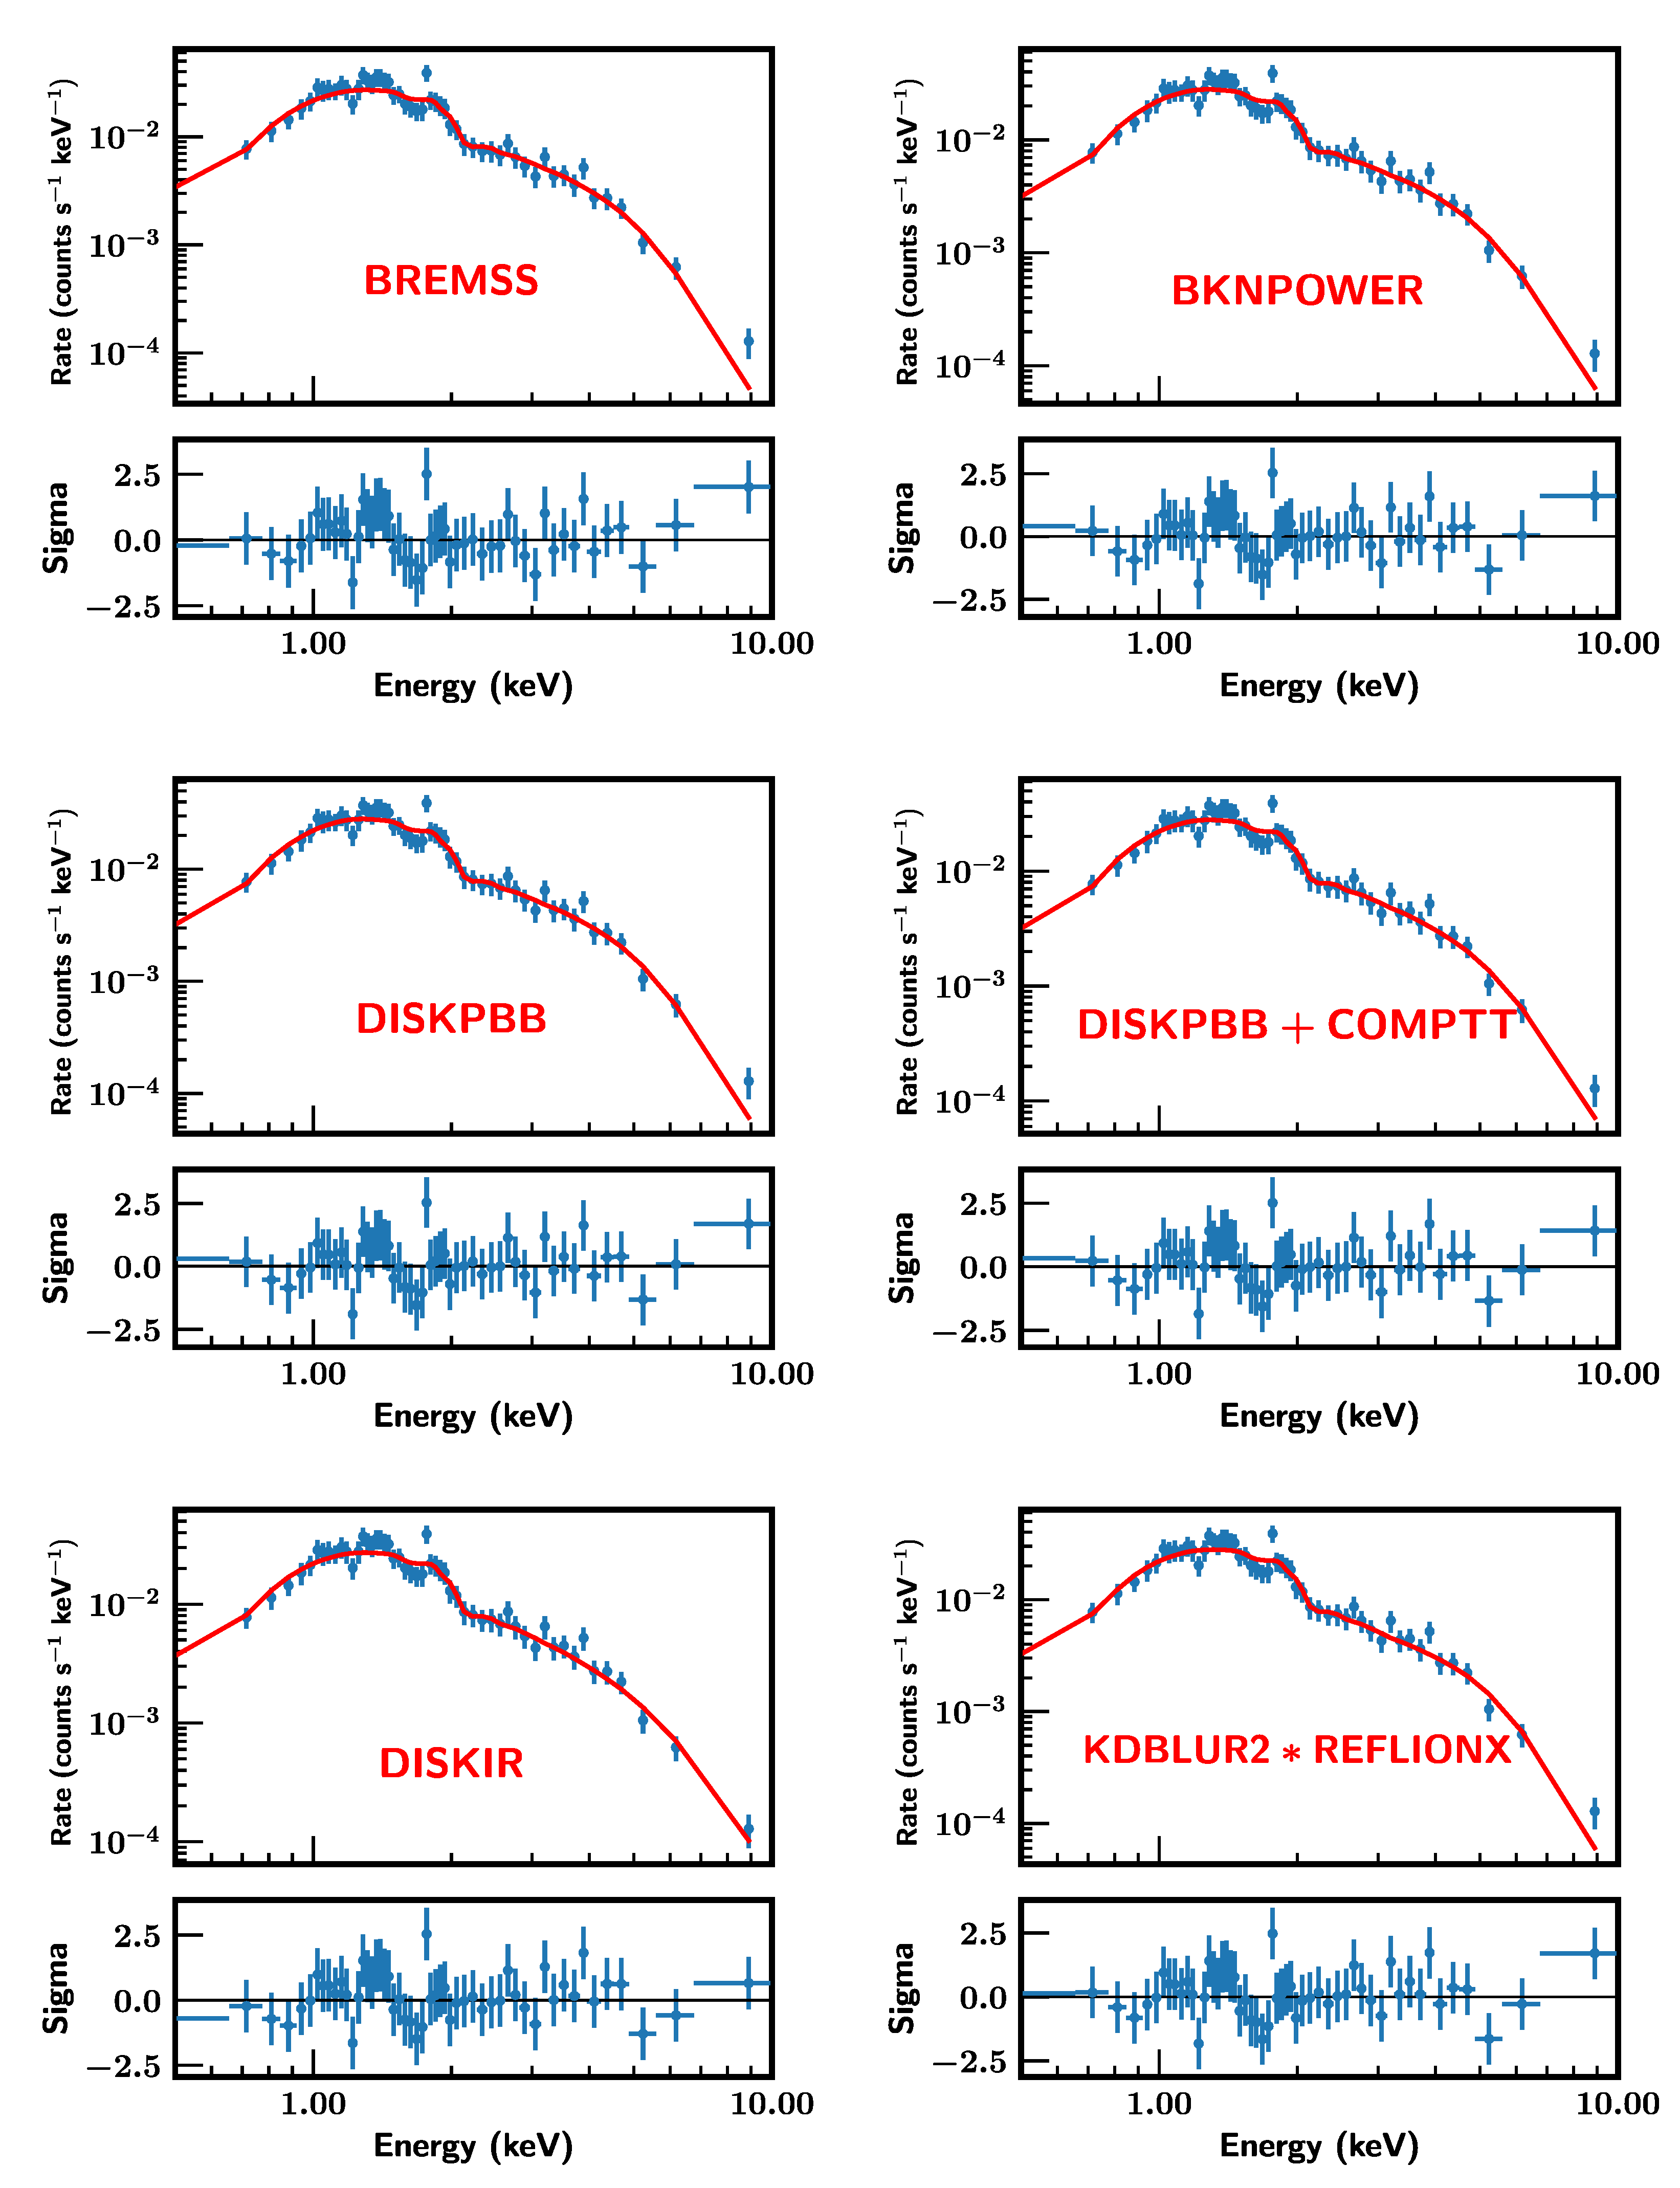
- The diskpbb model. This is referred to as a “p-free” multicolor disk blackbody (MCD) model in which the accretion disk temperature . In the standard MCD model, each point of the disk is assumed to radiate like a blackbody with a temperature that scales as [49]. In this model p is allowed to vary, allowing for the possibility of advection-dominated disks () in which photons cannot radiate away from the disk but are swept along with the accreting material [50]. In the case of super-Eddington accretion, this disk may become so optically thick that this advective process dominates.
- The diskir model. This is a model in which the inner regions of the disk are irradiated by Comptonized photons originating from the disk itself. Part of the resulting spectrum is due to the reflection of the Comptonized photons and the rest from the absorption and subsequent re-emission of such photons. This re-emission ultimately modifies the original disk emission had there not been any irradiation [53].
- The kdblur2*reflionX model. This model describes emission arising from the reflection of radiated photons by an optically thick, constant density atmosphere [54,55]. The reflected spectrum is smoothed by the relativistic effects from the accretion disk surrounding a rotating black hole. The blurred reflection model is a table model that can be read into Sherpa using user-contributed scripts.
4. Discussion
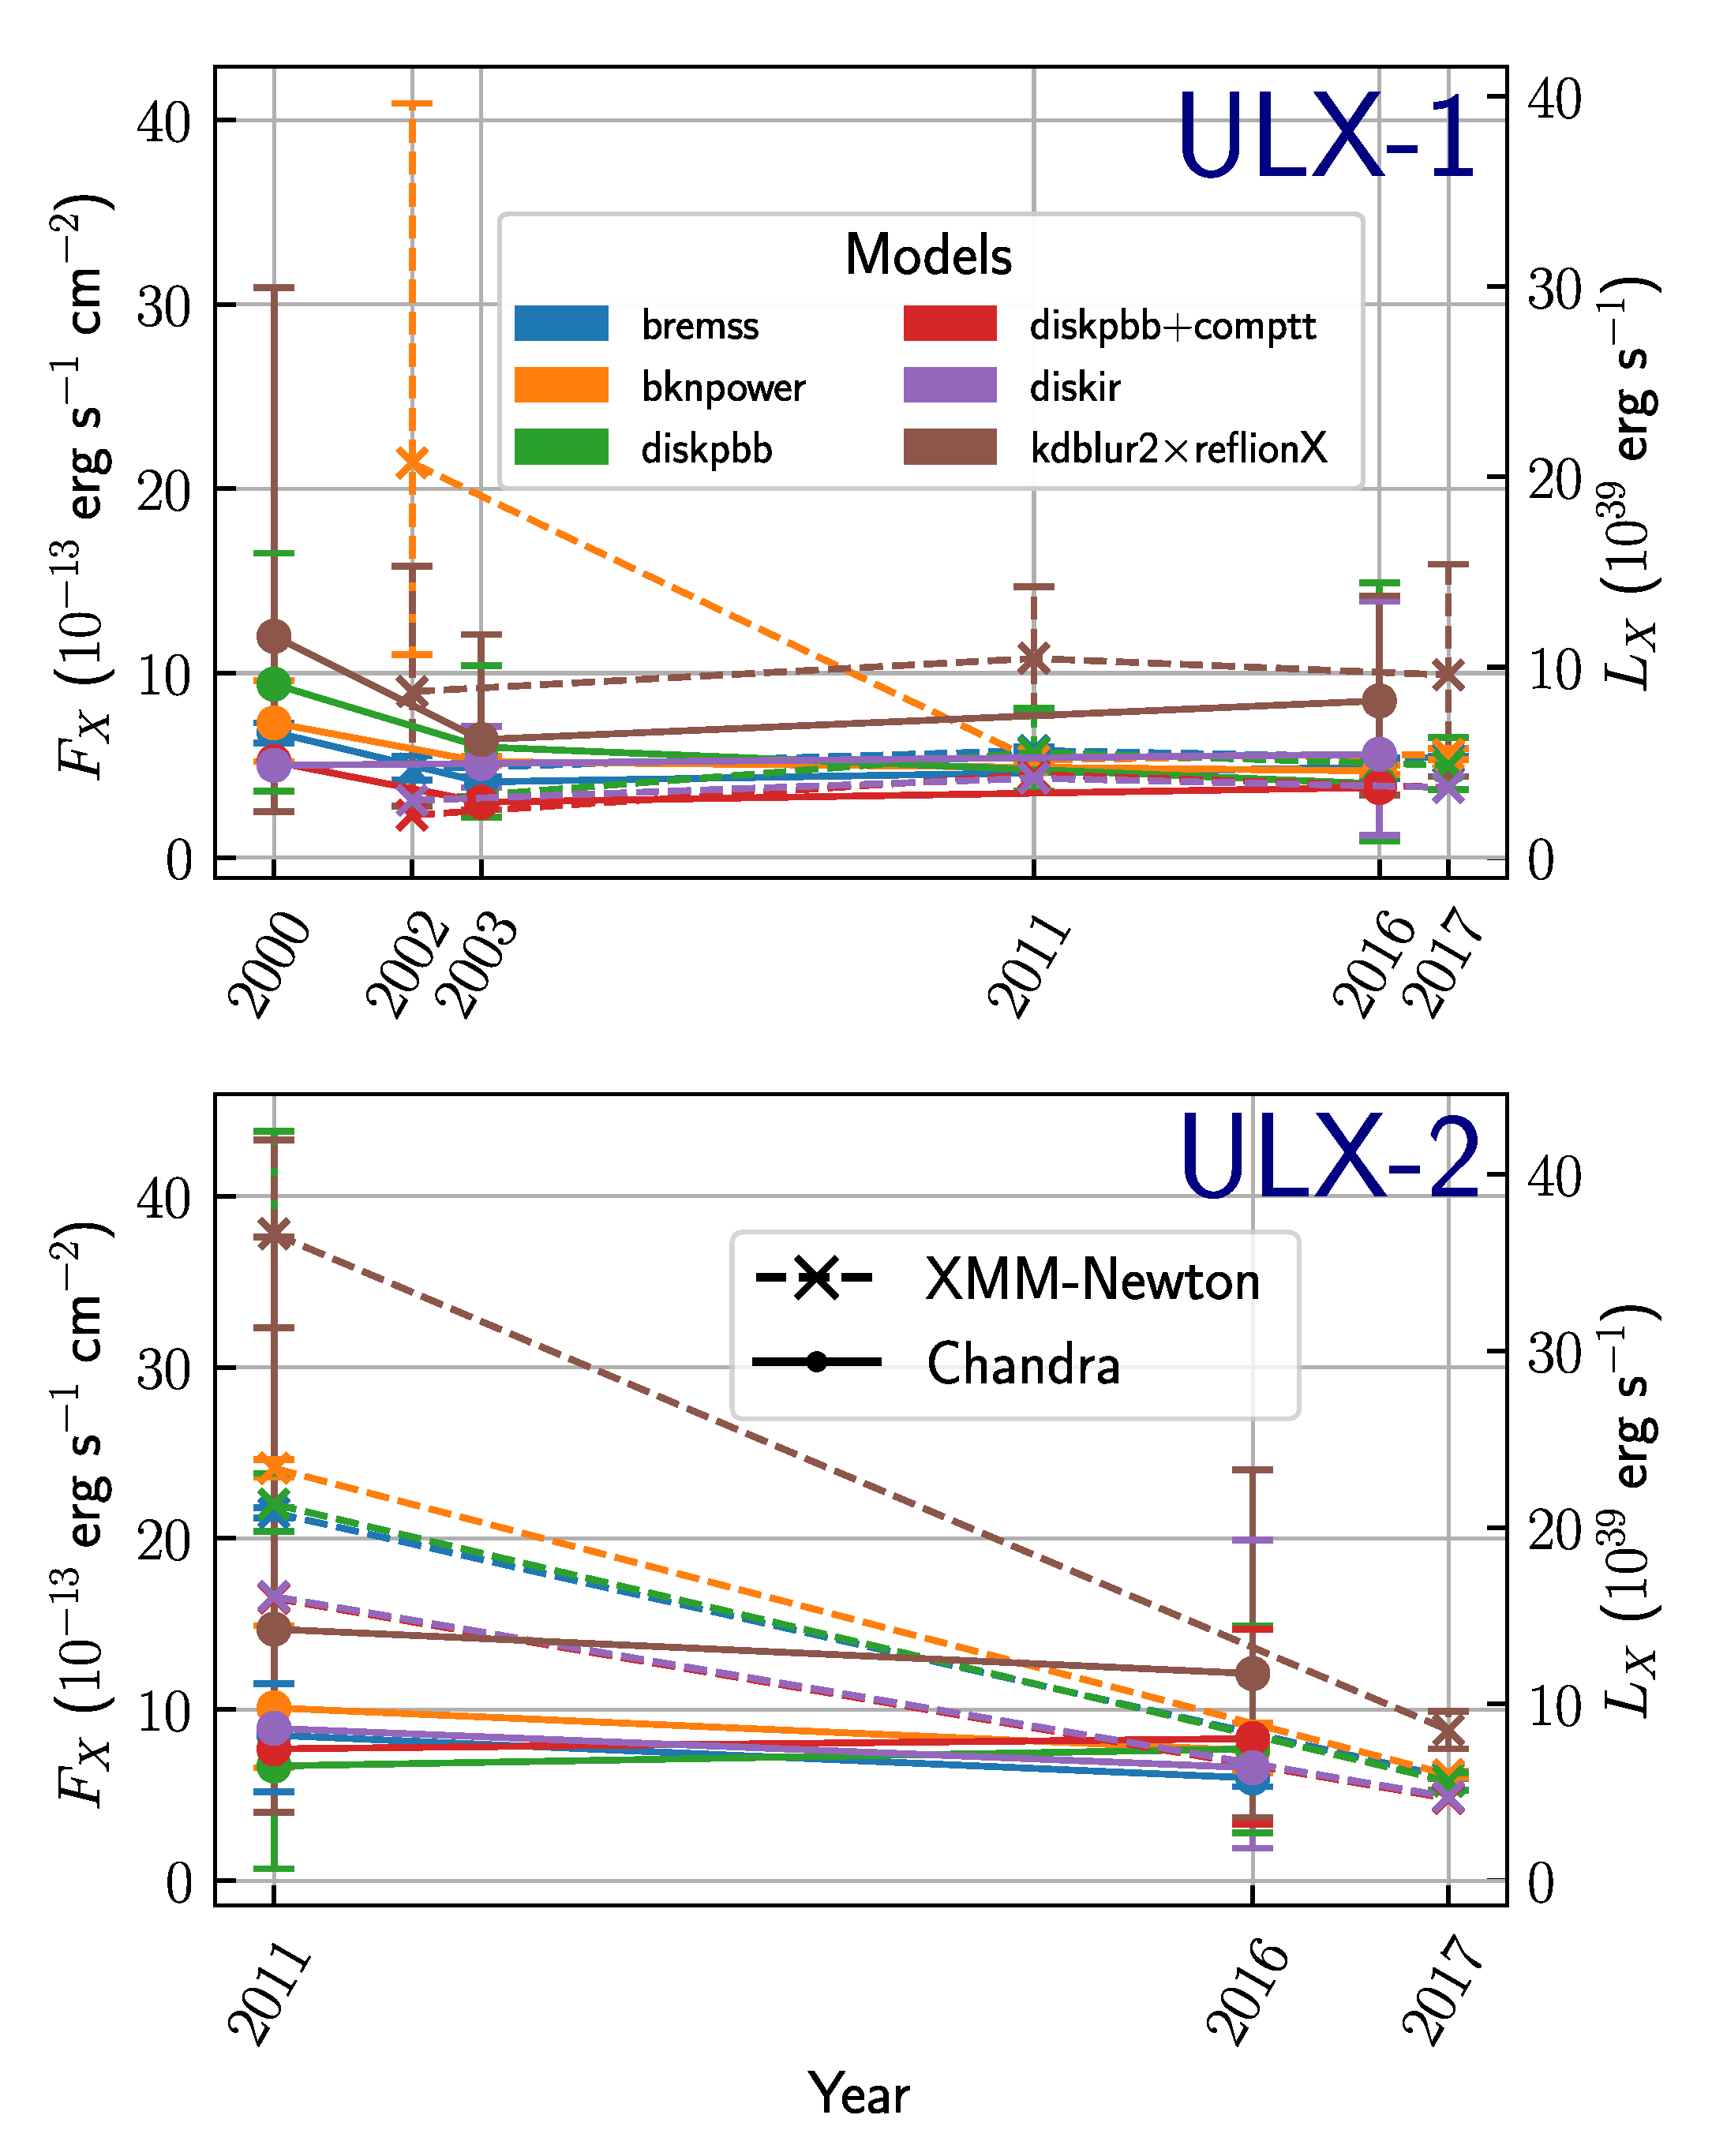
4.1. ULX-1
4.2. ULX-2
4.3. ULX-3
4.3.1. Supernova
4.3.2. Super-Eddington Accreting Source
4.3.3. Transient Outbursts
4.3.4. Microtidal Disruption Events
5. Conclusions
Author Contributions
Funding
Institutional Review Board Statement
Informed Consent Statement
Data Availability Statement
Acknowledgments
Conflicts of Interest
References
- Kaaret, P.; Feng, H.; Roberts, T.P. Ultraluminous X-ray Sources. Annu. Rev. Astron. Astrophys. 2017, 55, 303–341. [Google Scholar] [CrossRef]
- Long, K.S.; Dodorico, S.; Charles, P.A.; Dopita, M.A. Observations of the X-ray sources in the nearby SC galaxy M 33. Astrophys. J. Lett. 1981, 246, L61–L64. [Google Scholar] [CrossRef]
- Fabbiano, G. X-rays from normal galaxies. Ann. Rev. Astron. Astrophys 1989, 27, 87–138. [Google Scholar] [CrossRef]
- Feng, H.; Soria, R. Ultraluminous X-ray sources in the Chandra and XMM-Newton era. New Astron. Rev. 2011, 55, 166–183. [Google Scholar] [CrossRef]
- Colbert, E.J.M.; Mushotzky, R.F. The Nature of Accreting Black Holes in Nearby Galaxy Nuclei. Astrophys. J. 1999, 519, 89–107. [Google Scholar] [CrossRef]
- Kaaret, P.; Prestwich, A.H.; Zezas, A.; Murray, S.S.; Kim, D.W.; Kilgard, R.E.; Schlegel, E.M.; Ward, M.J. Chandra High-Resolution Camera observations of the luminous X-ray source in the starburst galaxy M82. Mon. Not. R. Astron. Soc. 2001, 321, L29–L32. [Google Scholar] [CrossRef]
- Gao, Y.; Wang, Q.D.; Appleton, P.N.; Lucas, R.A. Nonnuclear Hyper/Ultraluminous X-ray Sources in the Starbursting Cartwheel Ring Galaxy. Astrophys. J. Lett. 2003, 596, L171–L174. [Google Scholar] [CrossRef][Green Version]
- Shakura, N.I.; Sunyaev, R.A. Reprint of 1973A&A....24..337S. Black holes in binary systems. Observational appearance. Astron. Astrophys. 1973, 500, 33–51. [Google Scholar]
- Poutanen, J.; Lipunova, G.; Fabrika, S.; Butkevich, A.G.; Abolmasov, P. Supercritically accreting stellar mass black holes as ultraluminous X-ray sources. Mon. Not. R. Astron. Soc. 2007, 377, 1187–1194. [Google Scholar] [CrossRef]
- Fabrika, S.N.; Atapin, K.E.; Vinokurov, A.S.; Sholukhova, O.N. Ultraluminous X-ray Sources. Astrophys. Bull. 2021, 76, 6–38. [Google Scholar] [CrossRef]
- Mushtukov, A.A.; Suleimanov, V.F.; Tsygankov, S.S.; Poutanen, J. On the maximum accretion luminosity of magnetized neutron stars: Connecting X-ray pulsars and ultraluminous X-ray sources. Mon. Not. R. Astron. Soc. 2015, 454, 2539–2548. [Google Scholar] [CrossRef]
- Kuranov, A.G.; Postnov, K.A.; Yungelson, L.R. Population Synthesis of Ultraluminous X-ray Sources with Magnetized Neutron Stars. Astron. Lett. 2020, 46, 658–676. [Google Scholar] [CrossRef]
- Mushtukov, A.A.; Portegies Zwart, S.; Tsygankov, S.S.; Nagirner, D.I.; Poutanen, J. Pulsating ULXs: Large pulsed fraction excludes strong beaming. Mon. Not. R. Astron. Soc. 2021, 501, 2424–2429. [Google Scholar] [CrossRef]
- King, A.; Lasota, J.P.; Kluźniak, W. Pulsing ULXs: Tip of the iceberg? Mon. Not. R. Astron. Soc. 2017, 468, L59–L62. [Google Scholar] [CrossRef]
- Bachetti, M.; Harrison, F.A.; Walton, D.J.; Grefenstette, B.W.; Chakrabarty, D.; Fürst, F.; Barret, D.; Beloborodov, A.; Boggs, S.E.; Christensen, F.E.; et al. An ultraluminous X-ray source powered by an accreting neutron star. Nature 2014, 514, 202–204. [Google Scholar] [CrossRef] [PubMed]
- Walton, D.J.; Harrison, F.A.; Grefenstette, B.W.; Miller, J.M.; Bachetti, M.; Barret, D.; Boggs, S.E.; Christensen, F.E.; Craig, W.W.; Fabian, A.C.; et al. Broadband X-ray Spectra of the Ultraluminous X-ray Source Holmberg IX X-1 Observed with NuSTAR, XMM-Newton, and Suzaku. Astrophys. J. 2014, 793, 21. [Google Scholar] [CrossRef]
- Middleton, M.J.; Roberts, T.P.; Done, C.; Jackson, F.E. Challenging times: A re-analysis of NGC 5408 X-1. Mon. Not. R. Astron. Soc. 2011, 411, 644–652. [Google Scholar] [CrossRef]
- Mukherjee, E.S.; Walton, D.J.; Bachetti, M.; Harrison, F.A.; Barret, D.; Bellm, E.; Boggs, S.E.; Christensen, F.E.; Craig, W.W.; Fabian, A.C.; et al. A Hard X-ray Study of the Ultraluminous X-ray Source NGC 5204 X-1 with NuSTAR and XMM-Newton. Astrophys. J. 2015, 808, 64. [Google Scholar] [CrossRef]
- Pinto, C.; Soria, R.; Walton, D.; D’Ai, A.; Pintore, F.; Kosec, P.; Alston, W.N.; Fuerst, F.; Middleton, M.J.; Roberts, T.P.; et al. XMM-Newton campaign on the ultraluminous X-ray source NGC 247 ULX-1: Outflows. arXiv 2021, arXiv:2104.11164. [Google Scholar] [CrossRef]
- Gladstone, J.C. The sub-classes of ultraluminous X-ray sources. Mem. Della Soc. Astron. Ital. 2013, 84, 629. [Google Scholar]
- Stobbart, A.M.; Roberts, T.P.; Wilms, J. XMM-Newton observations of the brightest ultraluminous X-ray sources. Mon. Not. R. Astron. Soc. 2006, 368, 397–413. [Google Scholar] [CrossRef]
- Gladstone, J.C.; Roberts, T.P.; Done, C. Unlocking the nature of ultraluminous X-ray sources using their X-ray spectra. Astron. Nachrichten 2011, 332, 345. [Google Scholar] [CrossRef]
- Mushtukov, A.A.; Suleimanov, V.F.; Tsygankov, S.S.; Ingram, A. Optically thick envelopes around ULXs powered by accreating neutron stars. Mon. Not. R. Astron. Soc. 2017, 467, 1202–1208. [Google Scholar] [CrossRef]
- Koliopanos, F.; Vasilopoulos, G.; Godet, O.; Bachetti, M.; Webb, N.A.; Barret, D. ULX spectra revisited: Accreting, highly magnetized neutron stars as the engines of ultraluminous X-ray sources. Astron. Astrophys. 2017, 608, A47. [Google Scholar] [CrossRef]
- Kaaret, P.; Feng, H. X-ray Monitoring of Ultraluminous X-ray Sources. Astrophys. J. 2009, 702, 1679–1682. [Google Scholar] [CrossRef]
- Grisé, F.; Kaaret, P.; Corbel, S.; Cseh, D.; Feng, H. A long-term X-ray monitoring of the ultraluminous X-ray source NGC 5408 X-1 with Swift reveals the presence of dips but no orbital period. Mon. Not. R. Astron. Soc. 2013, 433, 1023–1038. [Google Scholar] [CrossRef]
- Middleton, M.J.; Sutton, A.D.; Roberts, T.P.; Jackson, F.E.; Done, C. The missing link: A low-mass X-ray binary in M31 seen as an ultraluminous X-ray source. Mon. Not. R. Astron. Soc. 2012, 420, 2969–2977. [Google Scholar] [CrossRef][Green Version]
- Burke, M.J.; Kraft, R.P.; Soria, R.; Maccarone, T.J.; Raychaudhury, S.; Sivakoff, G.R.; Birkinshaw, M.; Brassington, N.J.; Forman, W.R.; Hardcastle, M.J.; et al. The Fading of Two Transient Ultraluminous X-ray Sources to below the Stellar Mass Eddington Limit. Astrophys. J. 2013, 775, 21. [Google Scholar] [CrossRef]
- Illarionov, A.F.; Sunyaev, R.A. Why the Number of Galactic X-ray Stars Is so Small? Astron. Astrophys. 1975, 39, 185. [Google Scholar]
- Stella, L.; White, N.E.; Rosner, R. Intermittent Stellar Wind Acceleration and the Long-Term Activity of Population I Binary Systems Containing an X-ray Pulsar. Astrophys. J. 1986, 308, 669. [Google Scholar] [CrossRef]
- Tsygankov, S.S.; Mushtukov, A.A.; Suleimanov, V.F.; Poutanen, J. Propeller effect in action in the ultraluminous accreting magnetar M82 X-2. Mon. Not. R. Astron. Soc. 2016, 457, 1101–1106. [Google Scholar] [CrossRef]
- Erkut, M.H.; Ekşi, K.Y.; Alpar, M.A. Ultra-luminous X-ray Sources as Super-critical Propellers. Astrophys. J. 2019, 873, 105. [Google Scholar] [CrossRef]
- Earnshaw, H.P.; Roberts, T.P.; Sathyaprakash, R. Searching for propeller-phase ULXs in the XMM-Newton Serendipitous Source Catalogue. Mon. Not. R. Astron. Soc. 2018, 476, 4272–4277. [Google Scholar] [CrossRef]
- de Vaucouleurs, G.; de Vaucouleurs, A.; Corwin, Herold G.J.; Buta, R.J.; Paturel, G.; Fouque, P. Third Reference Catalogue of Bright Galaxies; Springer: New York, NY, USA, 1991. [Google Scholar]
- van der Kruit, P.C.; Searle, L. Surface photometry of edge-on spiral galaxies. II—The distribution of light and colour in the disk and spheroid of NGC 891. Astron. Astrophys. 1981, 95, 116–126. [Google Scholar]
- Garcia-Burillo, S.; Guelin, M. The distorted kinematics of molecular gas in the center of NGC 891. Astron. Astrophys. 1995, 299, 657. [Google Scholar]
- Berghea, C.T.; Weaver, K.A.; Colbert, E.J.M.; Roberts, T.P. Testing the Paradigm that Ultraluminous X-ray Sources as a Class Represent Accreting Intermediate-Mass Black Holes. Astrophys. J. 2008, 687, 471–487. [Google Scholar] [CrossRef][Green Version]
- Houck, J.C.; Bregman, J.N.; Chevalier, R.A.; Tomisaka, K. Recent X-ray Observations of SN 1986J with ASCA and ROSAT. Astrophys. J. 1998, 493, 431–439. [Google Scholar] [CrossRef]
- Hodges-Kluck, E.J.; Bregman, J.N.; Miller, J.M.; Pellegrini, E. A New Ultraluminous X-ray Source in the nearby Edge-on Spiral NGC 891. Astrophys. J. Lett. 2012, 747, L39. [Google Scholar] [CrossRef][Green Version]
- Hodges-Kluck, E.J.; Bregman, J.N.; Li, J. The Hot, Accreted Halo of NGC 891. Astrophys. J. 2018, 866, 126. [Google Scholar] [CrossRef]
- Dage, K.C.; Vowell, N.; Thygesen, E.; Bahramian, A.; Haggard, D.; Kovlakas, K.; Kundu, A.; Maccarone, T.J.; Strader, J.; Urquhart, R.; et al. Ultraluminous X-ray sources in seven edge-on spiral galaxies. Mon. Not. R. Astron. Soc. 2021, 508, 4008–4016. [Google Scholar] [CrossRef]
- Swartz, D.A.; Soria, R.; Tennant, A.F.; Yukita, M. A Complete Sample of Ultraluminous X-ray Source Host Galaxies. Astrophys. J. 2011, 741, 49. [Google Scholar] [CrossRef]
- Trentham, N.; Tully, R.B. Dwarf galaxies in the NGC 1023 Group. Mon. Not. R. Astron. Soc. 2009, 398, 722–734. [Google Scholar] [CrossRef][Green Version]
- Temple, R.F.; Raychaudhury, S.; Stevens, I.R. X-ray observations of the edge-on star-forming galaxy NGC 891 and its supernova SN1986J. Mon. Not. R. Astron. Soc. 2005, 362, 581–591. [Google Scholar] [CrossRef][Green Version]
- Spergel, D.N.; Bean, R.; Doré, O.; Nolta, M.R.; Bennett, C.L.; Dunkley, J.; Hinshaw, G.; Jarosik, N.; Komatsu, E.; Page, L.; et al. Three-Year Wilkinson Microwave Anisotropy Probe (WMAP) Observations: Implications for Cosmology. Astrophys. J. Suppl. Ser. 2007, 170, 377–408. [Google Scholar] [CrossRef]
- Gabriel, C. XMM-Newton Science Analysis System (SAS): Medium and long-term strategy. In Proceedings of the X-ray Universe 2017 Symposium, Rome, Italy, 6–9 June 2017; Ness, J.U., Migliari, S., Eds.; p. 84. [Google Scholar]
- Fruscione, A.; McDowell, J.C.; Allen, G.E.; Brickhouse, N.S.; Burke, D.J.; Davis, J.E.; Durham, N.; Elvis, M.; Galle, E.C.; Harris, D.E.; et al. CIAO: Chandra’s data analysis system. In Proceedings of the Society of Photo-Optical Instrumentation Engineers (SPIE) Conference Series, Orlando, Florida, USA, 24–31 May 2006; Volume 6270, p. 62701V. [Google Scholar] [CrossRef]
- Wilms, J.; Allen, A.; McCray, R. On the Absorption of X-rays in the Interstellar Medium. Astrophys. J. 2000, 542, 914–924. [Google Scholar] [CrossRef]
- Mitsuda, K.; Inoue, H.; Koyama, K.; Makishima, K.; Matsuoka, M.; Ogawara, Y.; Shibazaki, N.; Suzuki, K.; Tanaka, Y.; Hirano, T. Energy spectra of low-mass binary X-ray sources observed from Tenma. Publ. Astron. Soc. Jpn. 1984, 36, 741–759. [Google Scholar]
- Abramowicz, M.A.; Czerny, B.; Lasota, J.P.; Szuszkiewicz, E. Slim Accretion Disks. Astrophys. J. 1988, 332, 646. [Google Scholar] [CrossRef]
- Gladstone, J.C.; Roberts, T.P.; Done, C. The ultraluminous state. Mon. Not. R. Astron. Soc. 2009, 397, 1836–1851. [Google Scholar] [CrossRef]
- Titarchuk, L. Generalized Comptonization Models and Application to the Recent High-Energy Observations. Astrophys. J. 1994, 434, 570. [Google Scholar] [CrossRef]
- Gierliński, M.; Done, C.; Page, K. Reprocessing of X-rays in the outer accretion disc of the black hole binary XTE J1817-330. Mon. Not. R. Astron. Soc. 2009, 392, 1106–1114. [Google Scholar] [CrossRef]
- Ross, R.R.; Fabian, A.C.; Young, A.J. X-ray reflection spectra from ionized slabs. Mon. Not. R. Astron. Soc. 1999, 306, 461–466. [Google Scholar] [CrossRef]
- Ross, R.R.; Fabian, A.C. A comprehensive range of X-ray ionized-reflection models. Mon. Not. R. Astron. Soc. 2005, 358, 211–216. [Google Scholar] [CrossRef]
- Dickey, J.M.; Lockman, F.J. H I in the galaxy. Ann. Rev. Astron. Astrophys 1990, 28, 215–261. [Google Scholar] [CrossRef]
- Kalberla, P.M.W.; Burton, W.B.; Hartmann, D.; Arnal, E.M.; Bajaja, E.; Morras, R.; Pöppel, W.G.L. The Leiden/Argentine/Bonn (LAB) Survey of Galactic HI. Final data release of the combined LDS and IAR surveys with improved stray-radiation corrections. Astron. Astrophys. 2005, 440, 775–782. [Google Scholar] [CrossRef]
- HI4PI Collaboration; Ben Bekhti, N.; Flöer, L.; Keller, R.; Kerp, J.; Lenz, D.; Winkel, B.; Bailin, J.; Calabretta, M.R.; Dedes, L.; et al. HI4PI: A full-sky H I survey based on EBHIS and GASS. Astron. Astrophys. 2016, 594, A116. [Google Scholar] [CrossRef]
- Das, S.; Sardone, A.; Leroy, A.K.; Mathur, S.; Gallagher, M.; Pingel, N.M.; Pisano, D.J.; Heald, G. Detection of the Diffuse H I Emission in the Circumgalactic Medium of NGC 891 and NGC 4565. Astrophys. J. 2020, 898, 15. [Google Scholar] [CrossRef]
- Aoki, T.E.; Hiromoto, N.; Takami, H.; Okamura, S. JHK Imaging of the Edge-on Spiral Galaxy NGC 891. Publ. Astron. Soc. Jpn. 1991, 43, 755–780. [Google Scholar]
- Kovlakas, K.; Zezas, A.; Andrews, J.J.; Basu-Zych, A.; Fragos, T.; Hornschemeier, A.; Lehmer, B.; Ptak, A. A census of ultraluminous X-ray sources in the local Universe. Mon. Not. R. Astron. Soc. 2020, 498, 4790–4810. [Google Scholar] [CrossRef]
- Fabbiano, G. Populations of X-ray Sources in Galaxies. Ann. Rev. Astron. Astrophys 2006, 44, 323–366. [Google Scholar] [CrossRef]
- Earnshaw, H.P.; Grefenstette, B.W.; Brightman, M.; Walton, D.J.; Barret, D.; Fürst, F.; Harrison, F.A.; Heida, M.; Pike, S.N.; Stern, D.; et al. A Broadband Look at the Old and New ULXs of NGC 6946. Astrophys. J. 2019, 881, 38. [Google Scholar] [CrossRef]
- Atapin, K.; Vinokurov, A.; Sarkisyan, A.; Solovyeva, Y.; Medvedev, A.; Fabrika, S.; Kostenkov, A. Transient Ultraluminous X-ray Source NGC5474 X-1. arXiv 2020, arXiv:2011.00795. [Google Scholar]
- Pintore, F.; Motta, S.; Pinto, C.; Bernardini, M.G.; Rodriguez-Castillo, G.; Salvaterra, R.; Israel, G.L.; Esposito, P.; Ambrosi, E.; Salvaggio, C.; et al. The rare X-ray flaring activity of the Ultraluminous X-ray source NGC 4559 X7. arXiv 2021, arXiv:2103.14541. [Google Scholar] [CrossRef]
- Dwarkadas, V.V.; Gruszko, J. What are published X-ray light curves telling us about young supernova expansion? Mon. Not. R. Astron. Soc. 2012, 419, 1515–1524. [Google Scholar] [CrossRef]
- Song, X.; Walton, D.J.; Lansbury, G.B.; Evans, P.A.; Fabian, A.C.; Earnshaw, H.; Roberts, T.P. The hunt for pulsating ultraluminous X-ray sources. Mon. Not. R. Astron. Soc. 2020, 491, 1260–1277. [Google Scholar] [CrossRef]
- Sutton, A.D.; Roberts, T.P.; Middleton, M.J. The ultraluminous state revisited: Fractional variability and spectral shape as diagnostics of super-Eddington accretion. Mon. Not. R. Astron. Soc. 2013, 435, 1758–1775. [Google Scholar] [CrossRef]
- Belloni, T.; Colombo, A.P.; Homan, J.; Campana, S.; van der Klis, M. A low/hard state outburst of XTE J1550-564. Astron. Astrophys. 2002, 390, 199–204. [Google Scholar] [CrossRef]
- Sidoli, L.; Paizis, A.; Mereghetti, S.; Götz, D.; Del Santo, M. XMM-Newton and INTEGRAL observations of the very faint X-ray transient IGR J17285-2922/XTE J1728-295 during the 2010 outburst. Mon. Not. R. Astron. Soc. 2011, 415, 2373–2378. [Google Scholar] [CrossRef]
- Tetarenko, B.E.; Sivakoff, G.R.; Heinke, C.O.; Gladstone, J.C. WATCHDOG: A Comprehensive All-sky Database of Galactic Black Hole X-ray Binaries. Astrophys. J. Suppl. Ser. 2016, 222, 15. [Google Scholar] [CrossRef]
- Mineshige, S.; Yamasaki, T.; Ishizaka, C. On the Exponential X-ray Decay in X-ray Novae. Publ. Astron. Soc. Jpn. 1993, 45, 707–713. [Google Scholar]
- Chen, W.; Shrader, C.R.; Livio, M. The Properties of X-ray and Optical Light Curves of X-ray Novae. Astrophys. J. 1997, 491, 312–338. [Google Scholar] [CrossRef]
- Woosley, S.E.; Heger, A. The Pair-Instability Mass Gap for Black Holes. arXiv 2021, arXiv:2103.07933. [Google Scholar] [CrossRef]
- Marchant, P.; Langer, N.; Podsiadlowski, P.; Tauris, T.M.; de Mink, S.; Mandel, I.; Moriya, T.J. Ultra-luminous X-ray sources and neutron-star-black-hole mergers from very massive close binaries at low metallicity. Astron. Astrophys. 2017, 604, A55. [Google Scholar] [CrossRef]


| Obs. ID | Mission | Date | Exposure (ks) | Data Count Rate ( Counts s) | ||
|---|---|---|---|---|---|---|
| ULX-1 | ULX-2 | ULX-3 | ||||
| 794 | Chandra | 1 November 2000 | 50.9 | 3.9 | ||
| 0112280101 | XMM-Newton | 22 August 2002 | 7.8/12.9/12.6 | 6.8/2.7/2.7 | ||
| 4613 | Chandra | 10 December 2003 | 118.9 | 2.6 | ||
| 14376 | Chandra | 20 December 2011 | 1.8 | 0.7 | 8.4 | |
| 0670950101 | XMM-Newton | 25 August 2011 | 94.8/112.6/113.8 | 7.9/2.7/2.8 | 39.9/13.2/11.9 | |
| 19297 | Chandra | 14 November 2016 | 39.5 | 2.0 | 4.7 | 0.7 |
| 0780760101 | XMM-Newton | 27 January 2017 | 28.3/40.5/41.2 | 6.8/2.3/1.7 | 13.9/4.5/4.5 | 1.2/0.4/0.4 |
| 0780760201 | XMM-Newton | 29 January 2017 | 32.1/49.2/49.4 | 7.0/2.4/1.8 | 13.2/4.2/4.1 | 1.0/0.3/0.4 |
| 0780760401 | XMM-Newton | 19 February 2017 | 32.6/46.6/46.7 | 6.9/2.4/2.1 | 10.3/3.2/3.2 | 1.0/0.3/0.3 |
| 0780760301 | XMM-Newton | 23 February 2017 | 31.3/41.1/41.4 | 6.9/2.4/2.1 | 12.5/3.9/4.1 | 1.2/0.3/0.3 |
| 0780760501 | XMM-Newton | 25 February 2017 | 42.2/63.6/64.0 | 6.6/2.3/2.0 | 12.2/3.8/3.7 | 0.9/0.2/0.2 |
| Component | Parameter | Units | ULX-1 | ULX-2 | ULX-3 | |||
|---|---|---|---|---|---|---|---|---|
| 2000 | 2003 | 2016 | 2011 * | 2016 | 2016 | |||
| cm | ||||||||
| BREMSS | keV | |||||||
| 0.57 | 0.71 | 0.66 | 0.75 | 0.80 | 0.67 | |||
| Absorbed Flux | erg s cm | |||||||
| Unabsorbed Flux | erg s cm | |||||||
| cm | ||||||||
| BKNPOWER | ||||||||
| BreakE | keV | |||||||
| 0.55 | 0.70 | 0.69 | 0.90 | 0.78 | 0.65 | |||
| Absorbed Flux | erg s cm | |||||||
| Unabsorbed Flux | erg s cm | |||||||
| cm | ||||||||
| DISKPBB | keV | |||||||
| p | ||||||||
| 0.57 | 0.69 | 0.63 | 0.82 | 0.76 | 0.65 | |||
| Absorbed Flux | erg s cm | |||||||
| Unabsorbed Flux | erg s cm | |||||||
| 2000 | 2003 | 2016 | 2011 * | 2016 | 2016 | |||
| cm | ||||||||
| DISKPBB | keV | |||||||
| p | (f) | (f) | (f) | (f) | (f) | 1 (f) | ||
| COMPTT | keV | |||||||
| keV | ||||||||
| 0.57 | 0.74 | 0.89 | 1.09 | 0.82 | 0.96 | |||
| Absorbed Flux | erg s cm | |||||||
| Unabsorbed Flux | erg s cm | |||||||
| cm | ||||||||
| DISKIR | keV | |||||||
| (f) | ||||||||
| keV | ||||||||
| (f) | (f) | (f) | (f) | (f) | (f) | |||
| (f) | (f) | |||||||
| (f) | 5 (f) | 5 (f) | 5 (f) | |||||
| 0.60 | 0.75 | 0.77 | 1.18 | 0.83 | 0.995 | |||
| Absorbed Flux | erg s cm | |||||||
| Unabsorbed Flux | erg s cm | |||||||
| 2000 | 2003 | 2016 | 2011 * | 2016 | 2016 | |||
| cm | ||||||||
| KDBLUR2 | ||||||||
| 400 (f) | 400 (f) | 400 (f) | 400 (f) | 400 (f) | 400 (f) | |||
| i | deg | |||||||
| (f) | (f) | (f) | (f) | (f) | (f) | |||
| (f) | (f) | (f) | (f) | (f) | (f) | |||
| REFLIONX | ||||||||
| erg cm s | 1573 | |||||||
| 0.60 | 0.76 | 0.75 | 1.31 | 0.87 | 0.99 | |||
| Absorbed Flux | erg s cm | |||||||
| Unabsorbed Flux | erg s cm | |||||||
| Component | Parameter | Units | ULX-1 | ULX-2 | |||
|---|---|---|---|---|---|---|---|
| 2002 | 2011 | 2017 | 2011 | 2017 | |||
| cm | |||||||
| BREMSS | keV | ||||||
| 0.61 | 0.89 | 0.94 | 1.37 | 1.08 | |||
| Absorbed Flux | erg s cm | ||||||
| Unabsorbed Flux | erg s cm | ||||||
| cm | |||||||
| BKNPOWER | |||||||
| BreakE | keV | ||||||
| 0.55 | 0.88 | 0.93 | 1.26 | 0.96 | |||
| Absorbed Flux | erg s cm | ||||||
| Unabsorbed Flux | erg s cm | ||||||
| 2002 | 2011 | 2017 | 2011 | 2017 | |||
| cm | |||||||
| DISKPBB | keV | ||||||
| p | |||||||
| 0.59 | 0.91 | 0.88 | 1.21 | 0.95 | |||
| Absorbed Flux | erg s cm | 3.1/3.7/ 3.6 | |||||
| Unabsorbed Flux | erg s cm | 3.1/3.7/ 3.6 | |||||
| cm | |||||||
| DISKPBB | keV | ||||||
| p | (f) | (f) | (f) | (f) | (f) | ||
| COMPTT | keV | ||||||
| keV | |||||||
| 0.61 | 0.91 | 0.90 | 1.41 | 0.92 | |||
| Absorbed Flux | erg s cm | 2.3/3.4/ 4.0 | 4.5/4.5/ 4.5 | 3.8/4.1/ 3.6 | 16.5/16.1/ 16.0 | 4.8/5.0/ 5.0 | |
| Unabsorbed Flux | erg s cm | 2.3/3.4/ 4.0 | 4.5/4.5/ 4.5 | 3.8/4.1/ 3.6 | 16.5/16.1/ 16.0 | 4.8/5.0/ 5.0 | |
| cm | |||||||
| DISKIR | keV | ||||||
| keV | 407 | ||||||
| (f) | (f) | (f) | (f) | (f) | |||
| 5 (f) | 5 (f) | 5 (f) | 5 (f) | 5 (f) | |||
| 0.57 | 0.86 | 0.92 | 1.50 | 0.97 | |||
| Absorbed Flux | erg s cm | 3.1/3.7/ 3.7 | 4.3/4.4/ 4.5 | 3.8/4.0/ 3.7 | 16.6/16.0/ 16.1 | 4.9/5.1/ 5.0 | |
| Unabsorbed Flux | erg s cm | 3.1/3.7/ 3.7 | 4.3/4.4/ 4.5 | 3.8/4.0/ 3.7 | 16.6/16.0/ 16.1 | 4.9/5.1/ 5.0 | |
| 2002 | 2011 | 2017 | 2011 | 2017 | |||
| cm | |||||||
| KDBLUR2 | |||||||
| 400 (f) | 400 (f) | 400 (f) | 400 (f) | 400 (f) | |||
| i | deg | ||||||
| (f) | (f) | (f) | (f) | (f) | |||
| (f) | (f) | (f) | (f) | (f) | |||
| REFLIONX | |||||||
| erg cm s | |||||||
| 0.66 | 0.80 | 1.27 | 1.62 | 1.21 | |||
| Absorbed Flux | erg s cm | ||||||
| Unabsorbed Flux | erg s cm | ||||||
| Component | Parameter | Units | 14 Nov 2016 | 27 Jan 2017 | 29 Jan 2017 | 19 Feb 2017 | 23 Feb 2017 | 25 Feb 2017 |
|---|---|---|---|---|---|---|---|---|
| cm | ||||||||
| BREMSS | keV | |||||||
| 0.67 | 0.89 | 0.54 | 0.67 | 0.49 | 0.92 | |||
| Absorbed Flux | erg s cm | |||||||
| Unabsorbed Flux | erg s cm | |||||||
| cm | ||||||||
| ZPOWERLW | ||||||||
| 0.68 | 0.90 | 0.59 | 0.68 | 0.53 | 0.97 | |||
| Absorbed Flux | erg s cm | |||||||
| Unabsorbed Flux | erg s cm | |||||||
| cm | ||||||||
| DISKPBB | keV | |||||||
| p | ||||||||
| 0.65 | 0.83 | 0.45 | 0.68 | 0.46 | 0.89 | |||
| Absorbed Flux | erg s cm | |||||||
| Unabsorbed Flux | erg s cm | |||||||
| cm | ||||||||
| DISKPBB | keV | |||||||
| p | 1 (f) | 1 (f) | (f) | (f) | 1 (f) | (f) | ||
| COMPTT | keV | |||||||
| keV | ||||||||
| 0.96 | 0.93 | 0.51 | 0.82 | 0.54 | 1.04 | |||
| Absorbed Flux | erg s cm | |||||||
| Unabsorbed Flux | erg s cm | |||||||
| cm | ||||||||
| DISKIR | keV | |||||||
| keV | ||||||||
| (f) | (f) | (f) | (f) | (f) | (f) | |||
| 5 (f) | 5 (f) | 5 (f) | 5 (f) | 5 (f) | 5 (f) | |||
| 0.995 | 1.32 | 0.50 | 0.80 | 0.54 | 1.02 | |||
| Absorbed Flux | erg s cm | |||||||
| Unabsorbed Flux | erg s cm | |||||||
| Component | Parameter | Units | Nov 14 2016 | Jan 27 2017 | Jan 29 2017 | Feb 19 2017 | Feb 25 2017 | |
| cm | ||||||||
| KDBLUR2 | ||||||||
| 400 (f) | 400 (f) | 400 (f) | 400 (f) | 400 (f) | ||||
| i | deg | |||||||
| (f) | (f) | (f) | (f) | (f) | ||||
| (f) | (f) | (f) | (f) | (f) | ||||
| REFLIONX | ||||||||
| erg cm s | 1573 | |||||||
| 0.99 | 1.05 | 0.40 | 0.78 | 0.93 | ||||
| Absorbed Flux | erg s cm | |||||||
| Unabsorbed Flux | erg s cm | |||||||
Publisher’s Note: MDPI stays neutral with regard to jurisdictional claims in published maps and institutional affiliations. |
© 2021 by the authors. Licensee MDPI, Basel, Switzerland. This article is an open access article distributed under the terms and conditions of the Creative Commons Attribution (CC BY) license (https://creativecommons.org/licenses/by/4.0/).
Share and Cite
Earley , N.M.; Dwarkadas , V.V.; Cirillo , V. A Long-Term Study of Ultraluminous X-ray Sources in NGC 891. Universe 2022, 8, 18. https://doi.org/10.3390/universe8010018
Earley NM, Dwarkadas VV, Cirillo V. A Long-Term Study of Ultraluminous X-ray Sources in NGC 891. Universe. 2022; 8(1):18. https://doi.org/10.3390/universe8010018
Chicago/Turabian StyleEarley , Nicholas M., Vikram V. Dwarkadas , and Victoria Cirillo . 2022. "A Long-Term Study of Ultraluminous X-ray Sources in NGC 891" Universe 8, no. 1: 18. https://doi.org/10.3390/universe8010018
APA StyleEarley , N. M., Dwarkadas , V. V., & Cirillo , V. (2022). A Long-Term Study of Ultraluminous X-ray Sources in NGC 891. Universe, 8(1), 18. https://doi.org/10.3390/universe8010018