Article

The Nuclear Matter Density Functional under the Nucleonic Hypothesis

Laboratoire de Physique Corpusculaire, CNRS, ENSICAEN, UMR6534, Université de Caen Normandie, CEDEX, 14050 Caen, France
*
Author to whom correspondence should be addressed.
Universe 2021, 7(10), 373; https://doi.org/10.3390/universe7100373
Submission received: 30 August 2021 / Revised: 24 September 2021 / Accepted: 29 September 2021 / Published: 6 October 2021
(This article belongs to the Special Issue Properties and Dynamics of Neutron Stars and Proto-Neutron Stars)

Abstract

:
A Bayesian analysis of the possible behaviors of the dense matter equation of state informed by recent LIGO-Virgo as well as NICER measurements reveals that all the present observations are compatible with a fully nucleonic hypothesis for the composition of dense matter, even in the core of the most massive pulsar PSR J0740+6620. Under the hypothesis of a nucleonic composition, we extract the most general behavior of the energy per particle of symmetric matter and density dependence of the symmetry energy, compatible with the astrophysical observations as well as our present knowledge of low-energy nuclear physics from effective field theory predictions and experimental nuclear mass data. These results can be used as a null hypothesis to be confronted with future constraints on dense matter to search for possible exotic degrees of freedom.

1. Introduction

The exceptional progress of multi-messenger astronomy on different astrophysical sources of dense matter has very recently led to quantitative measurements of various properties of neutron stars (NS), such as the correlation between mass and radius (M-R) from X-ray timing with NICER [1,2,3,4] and the tidal polarizability from gravitational wave (GW) LIGO/Virgo data [5,6,7,8,9]. These observations, together with the plethora of upcoming data [10], are expected to unveil in the near future exciting open questions such as the structure and degrees of freedom of baryonic matter in extreme conditions, particularly the presence of phase transitions and the existence of deconfined matter in the core of neutron stars [11].
This direct connection between astrophysical measurements and the microphysics of dense matter is due to the well-known fact that, under the realm of general relativity, there is a one-to-one correspondence between any static observable and the dense matter equation of state (EoS) [12]. However, this task is complicated by the fact that there is no ab initio calculation of ultra-dense matter in the hadronic or partonic sectors; therefore, effective models are used. Information about the composition of high-density matter is blurred by the uncertainty on the effective energy functional, and similar equations of state can be obtained under different hypotheses on the underlying microphysics [13,14].
Tension was reported between the GW observational data that tend to favor stiffer EoS, and ab initio nuclear physics calculations, which point towards a slightly softer density dependence [15]. This tension could, in principle, suggest the emergence of new degrees of freedom at high density. However, the statistical significance of the dispersion is not sufficient to lead to strong conclusions, and could even be reduced if the new measurement of the neutron-skin thickness of 208 P b by the PREX-II collaboration [16] will confirm a higher value for the skin than previously estimated [17,18]. In addition to this, the most recent M-R estimations from the two objects PSR J0740+6620 and PSR J0030+0451 do not report any significant reduction in the NS radius with increasing mass [3,4], in qualitative agreement with the expectations for purely hadronic models for the EoS [19].
For these reasons, the hypothesis of a purely nucleonic composition of the NS cores cannot be ruled out. To identify the observables pointing towards more exotic constituents, it is important to quantitatively evaluate the space of parameters and observables that are compatible with the nucleonic hypothesis. To this end, meta-modelling techniques were proposed [19,20,21,22,23,24,25], which allow for exploring the complete parameter space of hadronic equations of state, and predicting the astrophysical observables with uncertainties controlled by our present theoretical and experimental knowledge of nuclear physics. This approach can be viewed as a way of transforming experimental and observational constraints into empirical parameters of nuclear physics to guide the elaboration of phenomenological and microscopic nuclear models, and it can also be used as a null hypothesis to search for exotic degrees of freedom.
In this paper, we address this timely issue by performing a Bayesian statistical analysis of the semi-agnostic meta-modelling technique of Refs. [21,24], including both nuclear physics and astrophysical constraints. With respect to previous works by different groups [19,20,21,22,23,24,25], we include the most recent NICER results [4] which provide constraints in the density region where many-body perturbation theory (MBPT) cannot be applied, and use a fully unified EoS approach [26] allowing for the constraints from nuclear mass measurements [27] to be included in the posterior distributions. We have not included the recent skin measurement by PREX II [16] in the considered constraints because our model is not presently able to calculate nuclear radii. An extension in this direction would be of interest, and is left for future work. In the present work, the information from the PREX II experiment can only be incorporated as an interval of the empirical parameter L s y m in the prior distribution. The prior that we have chosen already overlaps with the lower end of the constraint given on L s y m by PREX-II. Increasing the range of L s y m to include the higher values compatible with the PREX experiment would not modify our results, as the corresponding equations of state are filtered out by the chiral EFT constraint.
The paper is organized as follows. In Section 2, we summarize the basic ideas of nucleonic metamodelling developed in References [19,21]. We explain the different filters from low-energy nuclear physics and astrophysical observations used for the Bayesian analysis in Section 3. The results obtained in the present work are described in Section 4. We make our concluding remarks in Section 5.

2. Meta-Modelling of the EoS

Within the assumption that the core of neutron stars is composed of neutrons, protons, electrons, and muons in weak equilibrium, a prior distribution of the viable unified EoS model is generated by Monte-Carlo sampling of a large parameter set of 10 independent, uniformly distributed empirical parameters corresponding to the successive density derivatives at saturation up to order 4 of the uniform matter binding energy in the isoscalar and isovector channels. These parameters characterize the density dependence of the energy in symmetric matter, as well as of the symmetry energy, and their prior distribution is consistent with the present empirical knowledge for a large set of nuclear data [21]. They are complemented by five additional surface and curvature parameters [28] that are optimized, for each set of uniform matter parameters, to the experimental Atomic Mass Evaluation 2016 (AME2016) nuclear mass table [27]. The expression of the surface and curvature energy we employ [29] was optimized on Thomas–Fermi calculations at extreme isospin asymmetries, and also subsequently employed in different works on neutron star crust and supernova modelling within the compressible liquid drop approximation [26,28,30,31,32,33]. Two additional parameters rule the density dependence of the effective mass and the effective mass splitting, and an extra parameter enforces the correct behavior at zero density; see Reference [21] for details. The use of the same functional to describe the inhomogeneous crust [26,28] guarantees a consistent estimation of the crust–core transition and is known to be important for a correct estimation of the NS radius [34].

3. Bayesian Analysis

The posterior distributions of the set X of EoS parameters are conditioned by likelihood models of the different observations and constraints c according to the standard definition:
P ( X | c ) = N P ( X ) k P ( c k | X ) ,
where P ( X ) is the prior, and N is a normalization factor. The different constraints c k used in the present study are as follows: (a) nuclear mass measurements in the AME2016 mass table [27]; (b) the bands of allowed region in symmetric and pure neutron matter produced by many-body perturbation theory (MBPT) calculations from Reference [35] based on two- and three-nucleon chiral effective field-theory (EFT) interactions at next-to-next-to-next-to leading order (N3LO), which are interpreted as a 90 % confidence interval; (c) mass measurement from radio-timing observations of pulsar PSR J0348+0432 [36], M J 03 = 2.01 ± 0.04 M , where M is the solar mass; (d) constraints on the tidal deformability of the binary NS system associated to the gravitational wave event GW170817, detected by the LIGO/Virgo Collaboration (LVC) [7]; (e) X-ray pulse-profile measurements of PSR J0030+0451’s mass, M J 00 = 1.44 0.14 + 0.15 M , and radius, R J 00 = 13.02 1.06 + 1.24 km from Reference [2]; (f) the radius measurement with NICER and XMM-Newton data [4] of the PSR J0740+6620 pulsar of mass M J 07 = 2.08 ± 0.07 M [37], R J 07 = 13.7 1.5 + 2.6 km [4].
Posterior distributions of different observables Y are calculated by marginalizing over the EoS parameters as:
P ( Y | c ) = k = 1 N X k m i n X k m a x d X k P ( X | c ) δ Y Y ( X ) ,
where N = 13 is the number of parameters in the metamodel. Y ( X ) is the value of any observable Y obtained with the X parameter set, with X k min ( max ) being the minimum (maximum) value in the prior distribution taken as in Reference [26]. To see the impact of different constraints on the nuclear physics informed prior, we consider four distributions, with each containing around ∼18,000 models. They are labeled as follows:
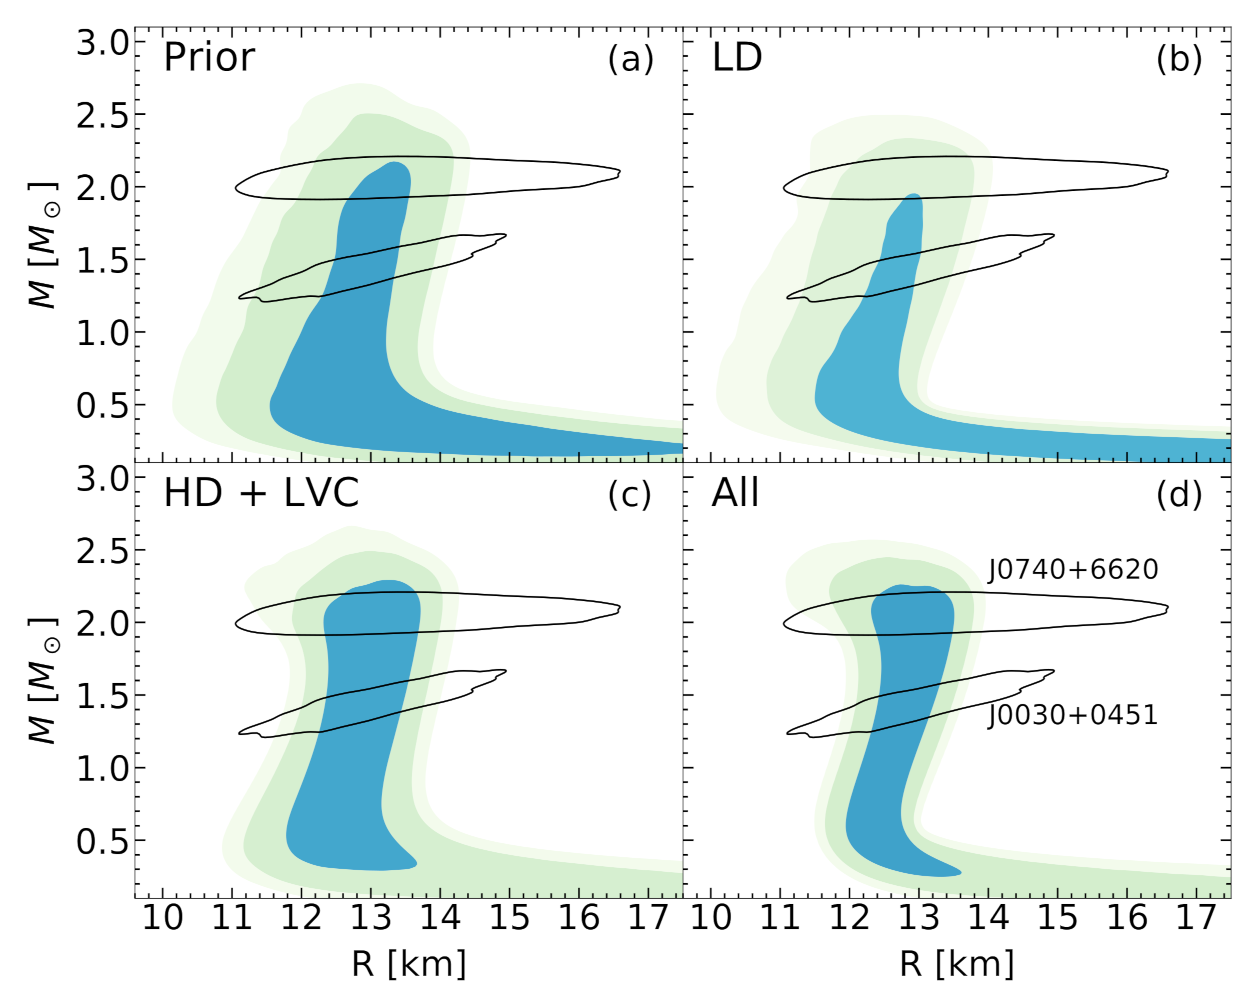
  • Prior: models in this set are required to result in meaningful solutions for the crust, that is, the minimization of the canonical thermodynamic potential at a given baryon density leads to positive gas and cluster densities. In addition, the fit of the surface and curvature parameters { σ 0 , b s , σ 0 c , β } to the nuclear masses in the AME2016 table must be convergent. These criteria are characterized by the pass-band filter ω 0 . Given that the mentioned conditions are satisfied, i.e., ω 0 = 1 , the probability of each model, associated to a parameter set X , is then quantified by the goodness of the optimal fit,
    P 1 ( X ) ω 0 e χ 2 ( X ) / 2 P ( X ) ,
    in which the original prior P ( X ) contains uniformly distributed EoS parameters, and the cost function χ 2 ( X ) has the following form:
    χ 2 ( X ) = 1 N d o f n M c l ( n ) ( X ) M A M E ( n ) 2 σ n 2 .
    The sum in Equation (4) runs over all the nuclei in the AME2016 [27] mass table, with M A M E and M c l ( X ) being the experimental and theoretical nuclear masses, respectively, in which the latter is calculated within a compressible liquid drop model (CLDM) approximation using the best-fit surface and curvature parameters for each EOS model; σ n represents the systematic theoretical error; N d o f ( = n 4 ) is the number of degrees of freedom. The distributions obtained with this prior represent the most general predictions, within a purely nucleonic composition hypothesis, which are compatible with low-energy nuclear physics experiments.
  • LD: in this sample, the models are selected by the strict filter from the chiral EFT calculation, where the energy per nucleon of symmetric nuclear matter (SNM) and pure neutron matter (PNM) of the model are compared with the corresponding energy bands of Reference [35], enlarged by 5%. This constraint is applied in the low-density region, from 0.02 fm 3 to 0.2 fm 3 . The posterior probability can be written as:
    P 2 ( X ) ω L D ( X ) P 1 ( X ) ,
    in which ω L D ( X ) = 1 if the model X is consistent with the EFT bands, and ω L D ( X ) = 0 otherwise. Implementing this low-density (LD) filter amounts to including in the nucleonic hypothesis the information from ab initio nuclear theory.
  • HD + LVC: the posterior probability of this distribution is written as:
    P 3 ( X ) ω H D P ( J 03 | X ) P ( L V C | X ) P 1 ( X ) .
    Here, ω H D is also a pass-band type filter similar to ω L D in Equation (5). It only accepts models satisfying all the following conditions: causality, thermodynamic stability, and non-negative symmetry energy at all densities. The second term in Equation (6), P ( J 03 | X ) , is the likelihood probability from the mass measurement of PSR J0348+0432 [36], which is M J 03 = 2.01 ± 0.04 M . This likelihood is defined as the cumulative Gaussian distribution function with a mean value of 2.01 and a standard deviation of 0.04:
    P ( J 03 | X ) = 1 0.04 2 π 0 M m a x ( X ) / M e ( x 2.01 ) 2 2 × 0.04 2 d x ,
    where M m a x ( X ) is the maximum NS mass at equilibrium, determined from the solution of the Tolmann–Oppenheimer–Volkoff (TOV) equations [38,39].
    We expect these different conditions not to be selective on the low-order EOS parameters, but to constitute stringent constraints on the high-density (HD) behavior of the EOS that is essentially governed, within the nucleonic hypothesis, by the third- and fourth-order effective parameters Q s a t , Z s a t , Q s y m and Z s y m [21].
    The constraint from the GW170817 event, measured by the LVC, evaluates the weight of a model based on its prediction for the tidal deformability Λ ˜ . The likelihood is written as:
    P ( L V C | X ) = i P L V C ( Λ ˜ ( q ( i ) ) , q ( i ) ) ,
    in which q is the ratio of the lighter component mass m 2 to the heavier component mass m 1 , q = m 2 / m 1 1 , and P L V C ( Λ ˜ ( q ) , q ) is the joint posterior distribution of Λ ˜ and q taken from References [7,40]. In References [7,40], the authors performed a Bayesian inference with four different waveform models. The distribution for Λ ˜ and q, which we are using for this work, is the one obtained with the PhenomPNRT waveform, which is mentioned as their “reference model”. The tidal deformability Λ ˜ is expressed in the form of the component masses, m 1 and m 2 , and the two corresponding dimensionless tidal deformabilities, Λ 1 and Λ 2 , as:
    Λ ˜ = 16 13 ( m 1 + 12 m 2 ) m 1 4 Λ 1 + ( m 2 + 12 m 1 ) m 2 4 Λ 2 ( m 1 + m 2 ) 5 .
    The dimensionless tidal deformability Λ is related to the mass M through the expression:
    Λ = 2 3 k 2 c 2 G R ( M ) M 5 ,
    where c, G, R ( M ) , and k 2 are the speed of light, gravitational constant, NS radius at mass M, and Love number, respectively [41,42,43]. In our analysis, q is chosen to be in the one-sided 90 % confidence interval obtained in Reference [7], q 0.73 , 1.00 . In Reference [7], it was shown that the chirp mass M c of the binary NS system associated to the GW170817 event was accurately determined, M c = 1.186 ± 0.001 M at the median value with 90 % confidence limits. The chirp mass M c can be expressed as a function of m 1 and q as:
    M c = ( m 1 m 2 ) 3 / 5 ( m 1 + m 2 ) 1 / 5 = q 3 / 5 m 1 ( 1 + q ) 1 / 5 .
    Since the uncertainty in the chirp mass M c is negligible, for each value of the mass ratio q, we calculate m 1 directly from the median value of M through Equation (11).
  • All: Including the three constraints mentioned above, together with the likelihood from the joint mass-radius distributions of the two NICER measurements from References [2,4], the posterior probability for the final distribution is written as:
    P 4 ( X ) ω L D ω H D P ( J 03 | X ) P ( L V C | X ) P ( N I C E R | X ) P 1 ( X ) .
    The NICER likelihood probability is given by:
    P ( N I C E R | X ) = i p N I C E R 1 ( M 1 ( i ) , R ( M 1 ( i ) ) ) j p N I C E R 2 ( M 2 ( j ) , R ( M 2 ( j ) ) ) ,
    where p N I C E R 1 ( M , R ) is the two-dimensional probability distribution of mass and radius for the pulsar PSR J0030+0451 obtained using the waveform model with three uniform oval spots by Miller et al. in [2]; and p N I C E R 2 ( M , R ) is the probability distribution for PSR J0740+6620 using NICER and XMM–Newton data by Miller et al. [4]. The intervals of M 1 and M 2 are chosen to be sufficiently large so that they cover most of the associated joint mass-radius distributions, M 1 1.21 , 1.70 M and M 2 1.90 , 2.25 M .
To ensure that the differences in the posterior distributions are induced by the impact of the different constraints, care is taken to obtain comparable statistics from the four distributions for each plot shown in this paper. Moreover, for all the shown observables, we have checked that an increase in statistics does not affect the results within the chosen precision for the numerical values given in this paper.

4. Results and Discussions

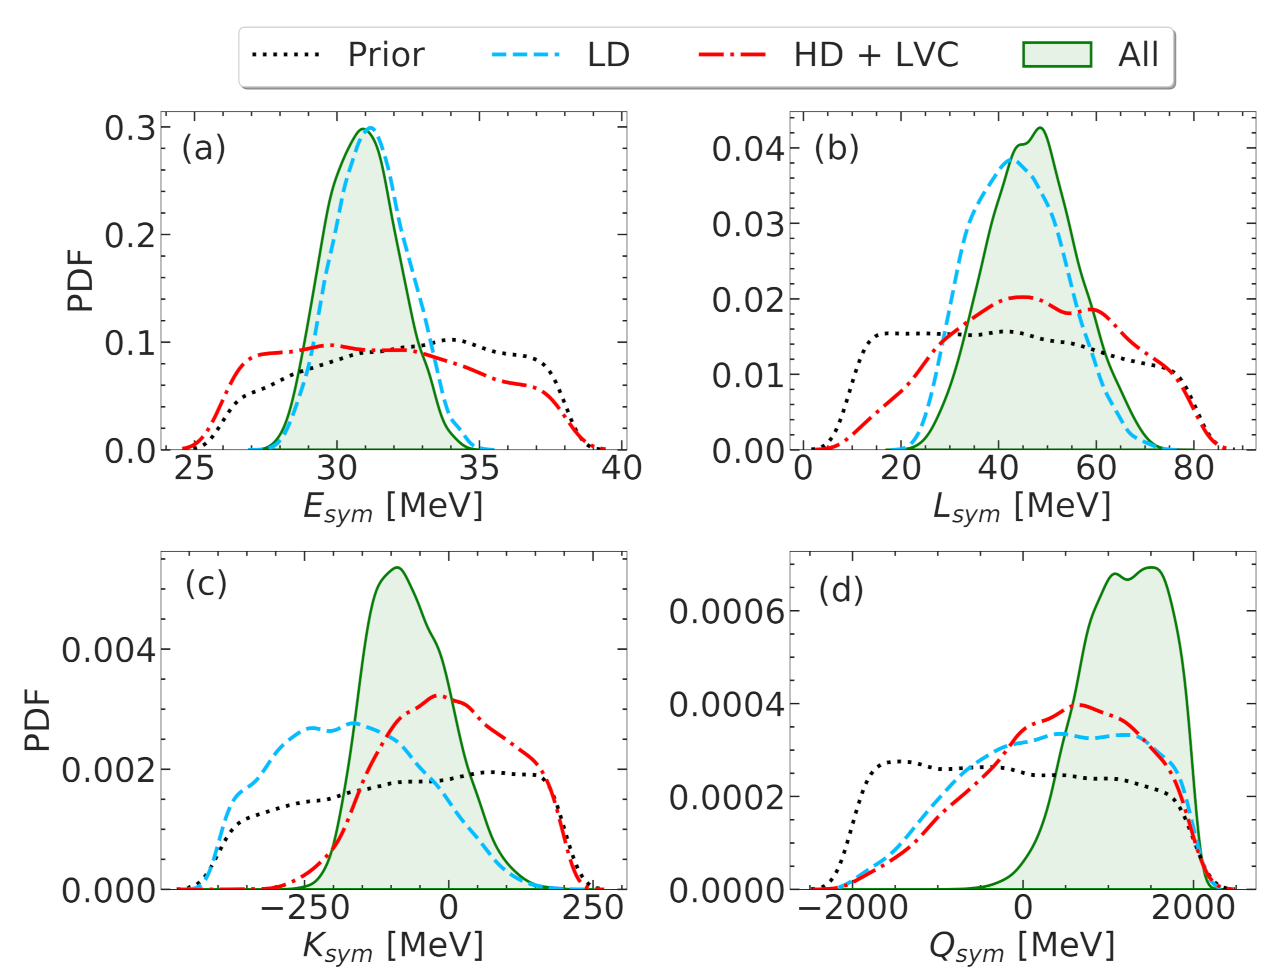
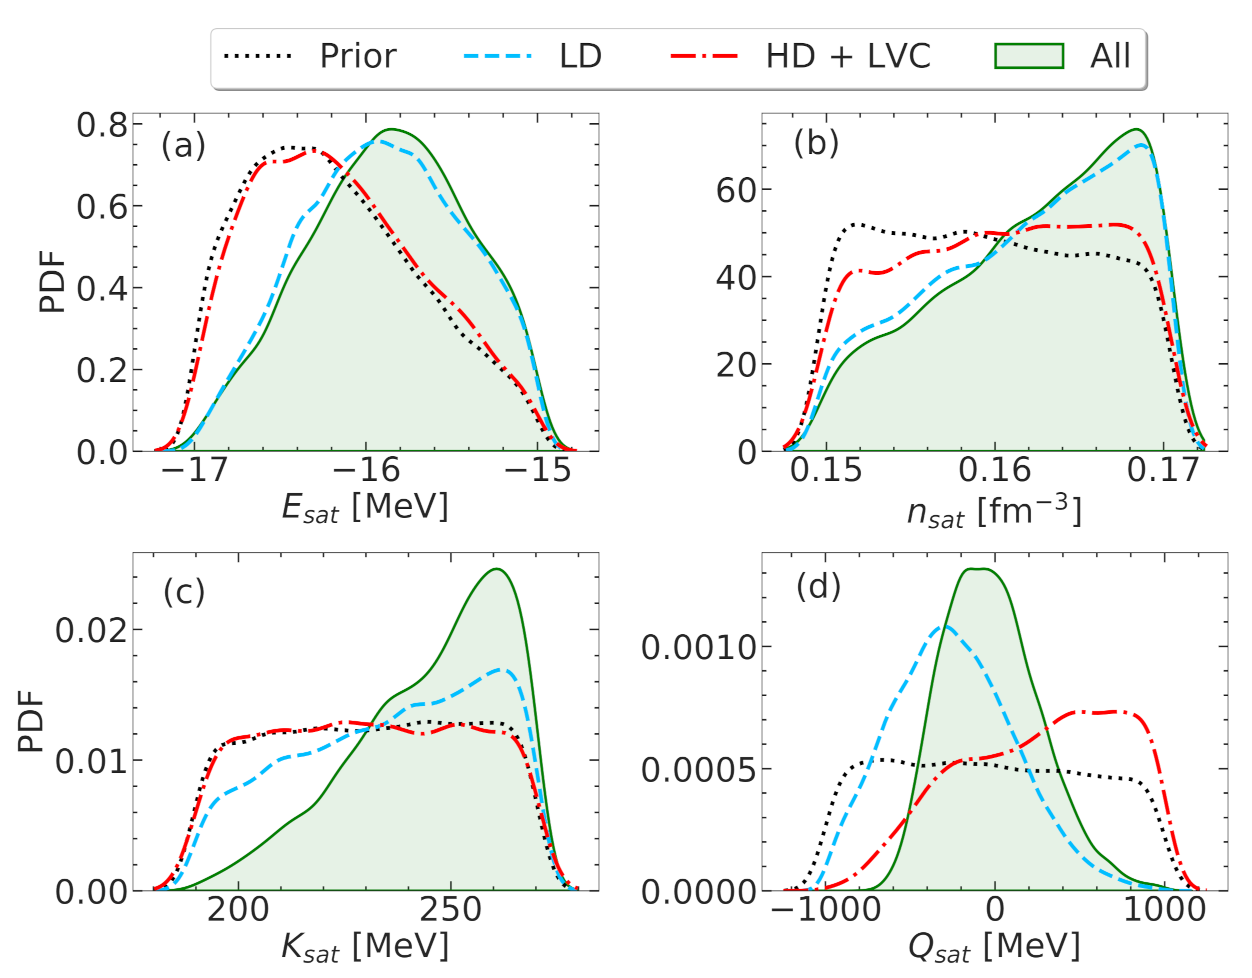
4.1. Empirical Parameters

In Figure 1 and Figure 2 we show the probability density distributions (PDFs) of isoscalar and isovector empirical parameters of order N < 4 , respectively. As we have described previously, the distributions labeled as “Prior” in these figures are not flat, but carry the information from the experimental nuclear mass measurement. For example, E s a t , the energy per particle in SNM at saturation, already has a peaked shape (see Figure 1a) because of this reason. From the HD+LVC distribution in these figures, we can see that the astrophysical constraints on NS mass and tidal deformability have almost no effect on low-order parameters. The impact of the chiral EFT filter on the isoscalar parameters of order N < 3 , i.e., E s a t , K s a t , along with n s a t is not prominent. This knowledge can be further reinforced by looking at Table 1, where the LD filter hardly improves the constraints on the aforementioned isoscalar parameters. This can be explained by the fact that the prior intervals of the empirical parameters are chosen based on the current knowledge provided by nuclear physics, in which the deviations of E s a t , n s a t , and K s a t are already relatively small.
Unlike the lower-order parameters in the isoscalar sector, the isovector counterparts are quite poorly determined by nuclear physics experiments. As a result, once the constraint from the chiral EFT calculation is included, E s y m , L s y m and K s y m are strongly affected (see Figure 2 and Table 1). Interestingly, the LD filter also has a non-negligible impact on the high-order parameters Q s a t and Q s y m . This is because the chiral EFT calculation gives very precise predictions at very low densities, far from nuclear saturation. In this region, the high-order parameters have a non-negligible contribution to the nuclear matter energy. It was shown by References [28,44] that constraining the EoS at very low densities n 0.02–0.1 fm 3 is crucial when studying the crust–core transition.
As one may expect, the constraints from NS observables (HD+LVC) play an important role in high-order parameters, such as Q s a t and Q s y m , as well as on the poorly constrained isovector compressibility K s y m . One can observe that, for these parameters, higher values of the chosen intervals are preferred in the nucleonic hypothesis, with a low preference for the softer EoSs. However, note that this is the net effect of both the radio mass and GW180817 measurements. We have checked that without the constraint on the tidal deformability, the resulting nuclear matter energies are even higher, which means that the constraint from GW170817 softens the EoS.
As discussed in detail in Reference [21], the density behavior of realistic functionals can be accurately reproduced up to the central density of massive neutron stars by a Taylor expansion truncated at the fourth order; however, because of the truncation, the parameters of order N 3 have to be considered as effective parameters that govern the high-density behavior of the EOS, and do not need to be equal to the corresponding density derivatives at saturation. On the other hand, in the sub-saturation regime, the deviations from the Taylor expansion are accounted for by the low-density corrective term that imposes the correct zero-density limit [21]. With these two effects being completely independent, the meaning of the third- and fourth-order parameters as explored by the EFT calculation and the astrophysical observations is not the same, and we can expect that low- and high-density constraints might point to different values for those parameters. Comparing the dashed and dashed-dotted lines in Figure 1, we can see that low-density constraints impose lower values of Q s a t with respect to high-density ones. This means that low-energy experiments aimed towards a better measurement of Q s a t will not improve our empirical knowledge of the high-density EOS. Interestingly, the same is not true for Q s y m , for which the dotted and dash–dotted distributions closely overlap. Even if the present constraints are quite loose, it appears that the skewness of the symmetry energy at saturation Q s y m gives a fair description of the behavior of the EOS at high density, while a deviation is observed at the level of compressibility K s y m . We do not include results for the fourth-order parameters Z s a t , Z s y m , because they have very large uncertainties and very little impact from the different constraints. Furthermore, we will see that they have almost no correlations to other parameters, as well as observables.
In Figure 3, we plot the bands for SNM energy per nucleon and symmetry energy at 50% and 90% confidence intervals for the four posterior distributions, as explained in the previous section. The impact of LD and HD+LVC filters can be observed by looking at panels (b) and (c) of Figure 3, respectively. Their effects are appreciated at different density regimes, as is also evident from the analysis carried out in Figure 1 and Figure 2 and Table 1.

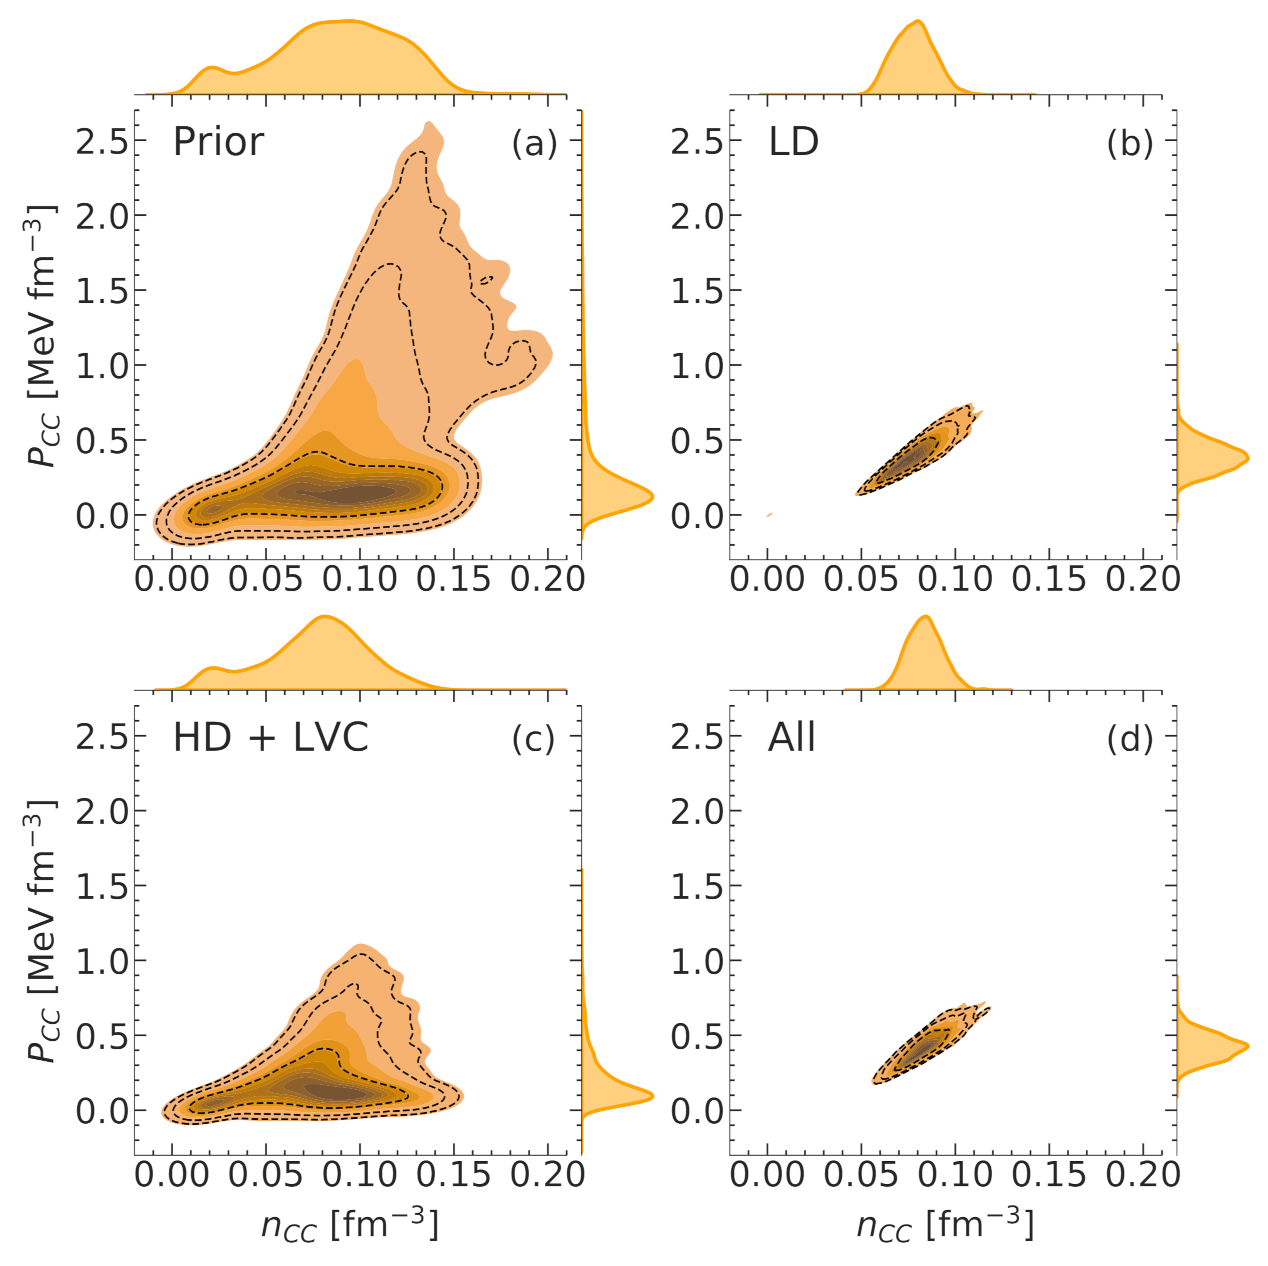
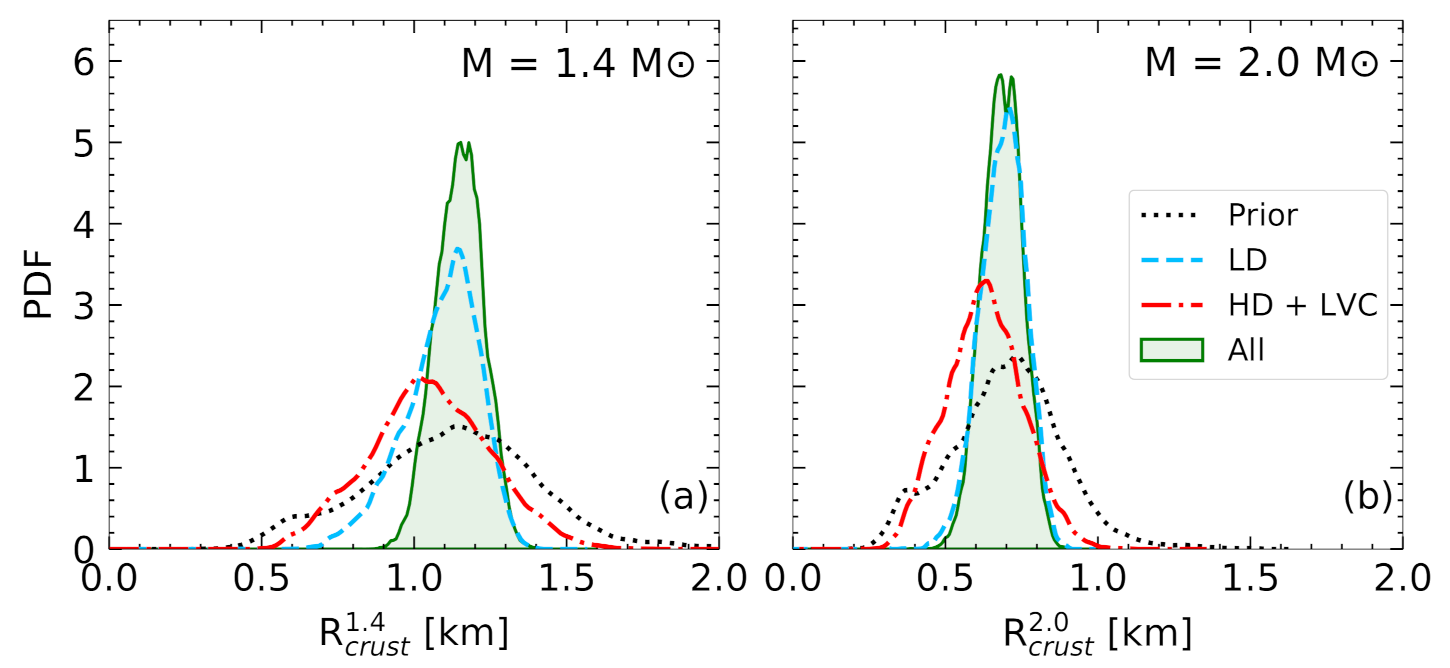
4.2. Properties of NS Crust

In our calculation, the transition from the solid crust to the liquid outer core is determined by comparing the corresponding energy density of clusterized matter to that of homogeneous matter at β -equilibrium with the metamodel. For the crust part, the metamodel is extended by introducing surface parameters within the compressible liquid drop model (CLDM) approach [26]. The precision in the prediction of the crust–core transition point is crucial in estimating crustal observables, such as crustal mass, thickness, and moment of inertia. These quantities are in particular thought to have an influence on the origin of the pulsar glitches [45]. In the literature, there are various works devoting to determining the crust–core transition density n C C with different many-body methods and nuclear functionals, spanning a large range of values, such as n C C = 0.0548 fm 3 in [46] obtained using Thomas–Fermi calculations for the NL3 functional, or n C C = 0.081 fm 3 in [47] within the full fourth-order extended Thomas–Fermi approach for the BSk24 functional. For this reason, an estimation for the uncertainties of the crustal properties with Bayesian tools using both the current nuclear physics and astrophysical data, provided by LVC and NICER, are of great importance.
In Figure 4, we display the joint distributions of the crust–core transition density n C C and pressure P C C . The chiral EFT calculation plays an important role in the determination of the crust–core transition point, which is evident from the LD distribution in Figure 4b. One can observe that the chiral EFT filter puts stringent limits on both the crust–core transition density n C C and pressure P C C ; very high and very low values of n C C and P C C get eliminated. In Figure 4c for the HD+LVC distribution, the most noticeable fact is the suppression of models with high transition pressures. However, the probability densities of these models are tiny, and they are outside of the 95 % contour in the prior distribution (see Figure 4a). Moreover, they are associated to models violating at least one of the following conditions required in the HD+LVC posterior: causality, thermodynamics stability, or non-negative symmetry energy. In other words, the astrophysical constraints on NS maximum mass and tidal deformability have very little effect on the crust–core transition. This is consistent with our observations for the nuclear matter energy in Figure 3c: the nuclear matter energy in the HD+LVC distribution is not notably constrained at densities around n n s a t / 2 .
The crust–core transition point determines astrophysical observables, such as crust thickness, or moment of inertia [24]. In this study, we have chosen the crust thickness to be the demonstrative quantity. Figure 5 presents the PDFs of NS crust thicknesses for 1.4 M and 2.0 M NSs. In both cases, the uncertainties in the LD distributions are narrowed down compared to the prior, while the effect in the HD+LVC distribution is only marginal. This agrees with our conclusions for the crust–core transition point, that is, the role of the chiral EFT filter is more dominant in the determination of crustal properties. When all constraints are taken into account, the crust thicknesses of both 1.4 M and 2.0 M NSs are known with relative uncertainties of up to 10 % . For a quantitative estimation of the effects of different filters, in Table 2 we present crust–core transition density n C C and pressure P C C , along with a crustal thickness of 1.4 M and 2.0 M NSs accompanied by errors on them at 68% confidence interval. One can quite conclusively comment that the primary effect comes from the LD chiral EFT filter, which also puts stringent constraints when all the filters are combined together, denoted as “All”.

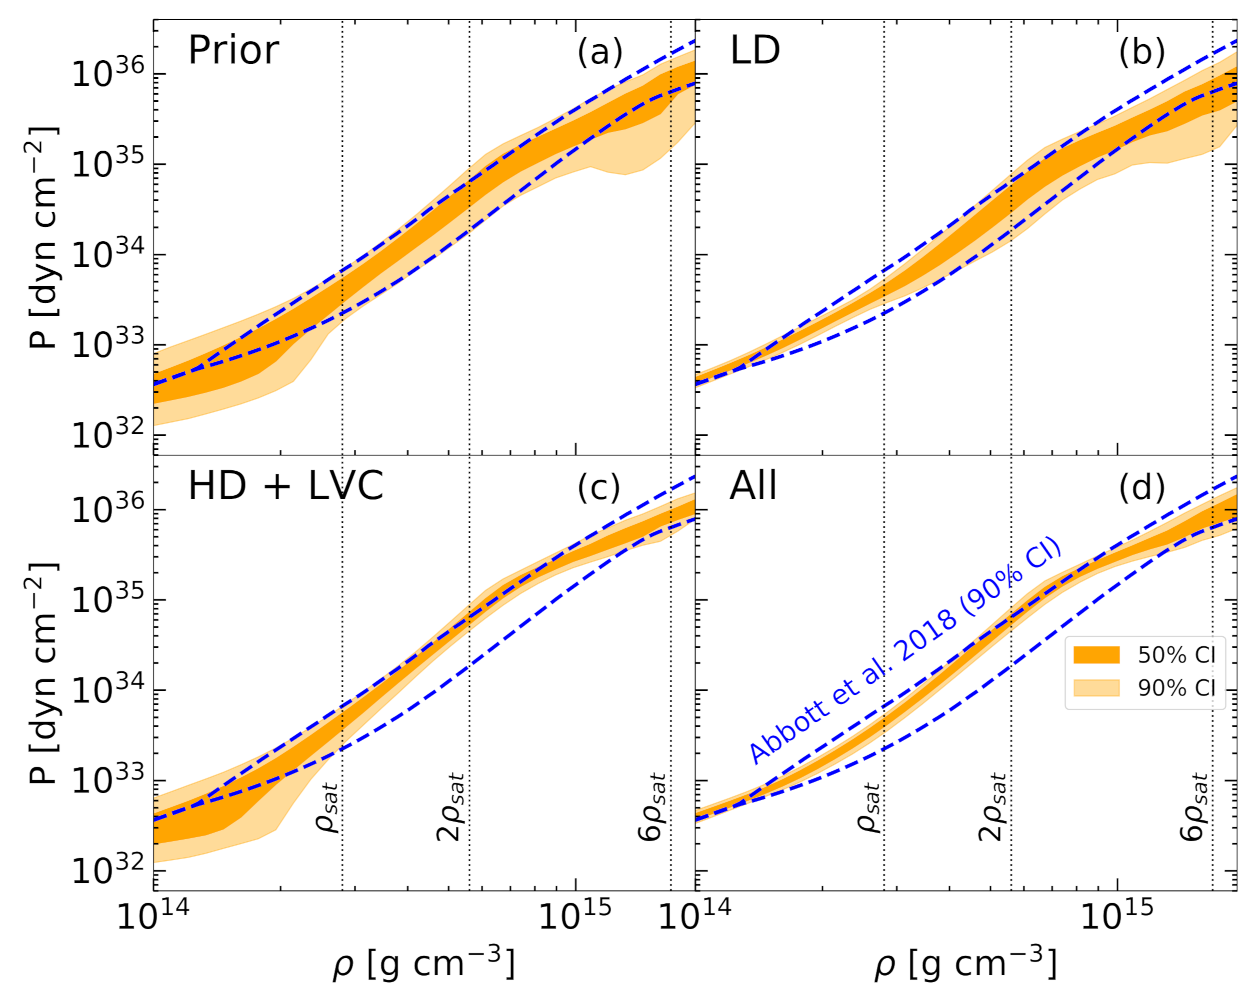
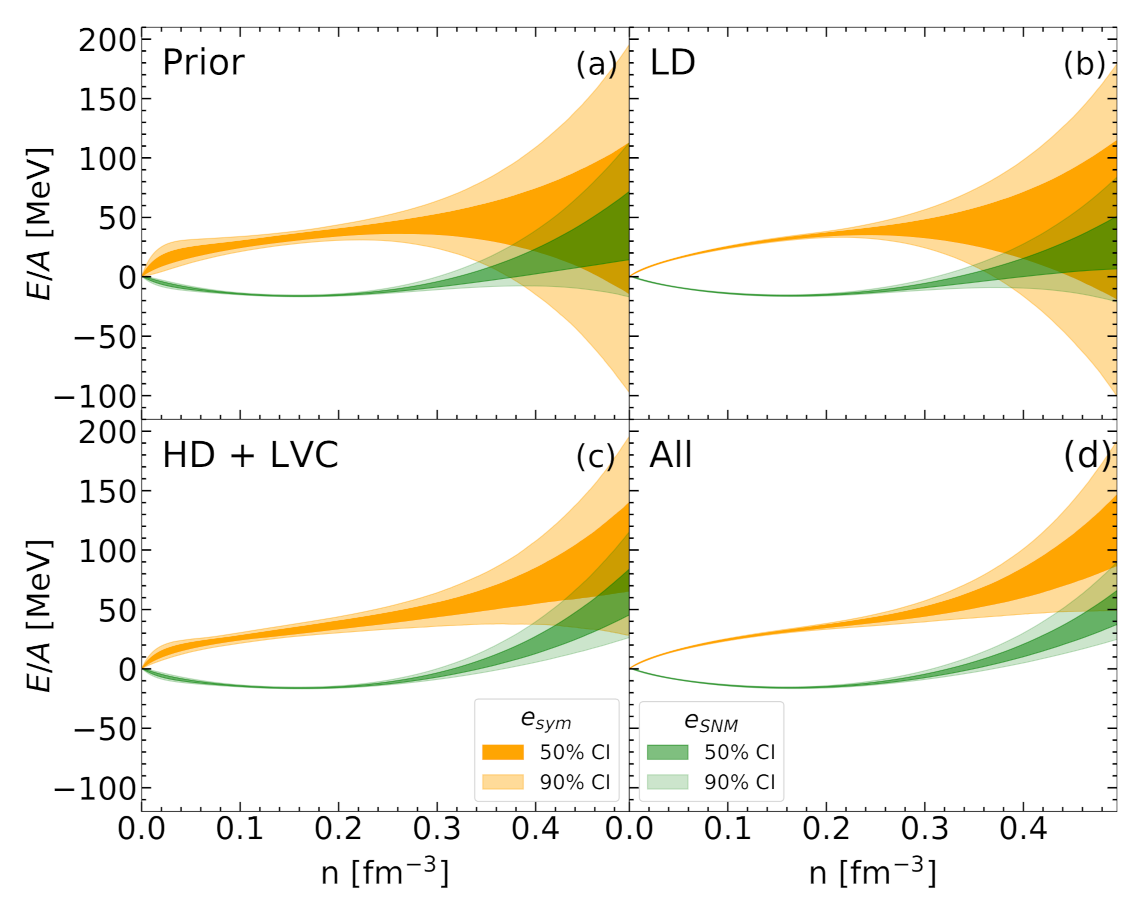
4.3. NS Equation of State

Unlike the crustal properties, HD+LVC filter is expected to put tighter bounds on global NS properties, which is governed chiefly by the high-density part of the EoS. The effects of different filters on the EoS are shown in Figure 6. The light (dark) orange band indicates 90% (50%) confidence interval. For comparison, we also display the result inferred from the gravitational wave data GW170817 by LVC at the 90 % level in dashed blue lines [6]. We have also used the same units for mass-density g cm 3 as in Reference [6] for the same reason. In this unit the saturation density n s a t is denoted as ρ s a t ( 2.8 × 10 14 g cm 3 ). In Reference [6], Abbott et al. have sampled their EoSs at high density using the spectral parametrization [48]. These EoSs are then matched with SLy EoS [49] at around ρ s a t / 2 . Incidentally, the authors also utilized some prior criteria similar to our analysis, which are causality, thermodynamic stability, and consistency of NS maximum mass with the observation. For the last condition, they put a sharp limit ( M m a x 1.97 M ) instead of using a likelihood probability as in our analysis (see Equation (7)). However, we have verified that the difference in the maximum NS treatment does not lead to sizable deviation in the final results. In Figure 6a, we can see that our prior distribution perfectly covers the whole posterior band given by GW170817 event [6] with good agreement. In our case, the prior distribution carries information from nuclear physics experiments and theoretical calculations via the chosen prior intervals of empirical parameters as well as the mass fit. This is why the EoS in our prior distribution at low densities is relatively narrow compared to other analyses. Note that the uncertainty below ρ s a t , appears to be large due to the visual effect of the logarithmic scale in the pressure. Once the chiral EFT filter is applied, this uncertainty is vastly reduced (see Figure 6b), resulting in a very well-constrained band and excellently compatible with the posterior constrained by GW170817 data [6]. Contrarily, the behavior of the EoS at supra-saturation densities is not constrained by the chiral EFT filter. As a result, a larger dispersion is observed at high densities. This dispersion is not as important as in fully agnostic studies [50] because of the nucleonic hypothesis that imposes an analytic behavior of the EoS at all densities. This strong hypothesis can be challenged by the astrophysical measurements, and any inconsistency with the observations will reveal the presence of exotic degrees of freedom.
By incorporating the pass-band filter ω H D as well as the condition on the NS maximum mass in Figure 6c, the deviation in the lower limit of the pressure at density ρ 10 15 g cm 3 observed in the prior, is eliminated. In particular, the constraint on the NS maximum mass sets a stringent limit on the lower bound of the pressure, and posterior EoS is shifted significantly towards higher values of pressure. Conversely, the constraint from LVC prefers softer EoS, hence setting the limit on the upper bound of the pressure band. In Figure 6d, when all constraints are combined, as expected, we obtain a narrower band for the EoS than the one obtained exclusively from GW170817 data [6]. In addition, we observe that our EoS is lightly stiffer than the one of Reference [6] at around 2 3 ρ s a t . The small width of the EoS and its stiffness are assigned to the semi-agnostic hadronic prior, which represents current nuclear physics knowledge. Nevertheless, the overall agreement is excellent. Thus, it indicates the compatibility of the nucleonic EoS with the gravitational wave GW170817 data.
Comparing the “HD+LVC” and “All” distributions in Figure 6c,d, it can be observed that the inclusion of the new NICER measurement does not show any significant impact on the EoS. Similar conclusions have been drawn in other studies in the literature. Pang et al. [51] carried out a Bayesian analysis using the data from Riley et al. [3] and Miller et al. [4]. In both cases, they found that the effect of the constraint from the radius measurement of PSR J0740+6620 only marginally impact the EoS. In Reference [52], Raaijmakers et al. performed the Bayesian inference with two EoS parametrizations: a piece-wise polytropic (PP) model and a speed-of-sound (CS) model drawing similar conclusions. For the constraint on PSR J0740+6620, they employed the data from Riley et al. [3], in which the error bar of the radius is smaller than that obtained in Miller et al. [4]. They concluded that, for the PP models, the impact on the EoS mainly comes from the high mass value of PSR J0740+6620 because their prior distribution in that mass range is within the 68% level of the radius measurement (see Figure 4 in [52]).

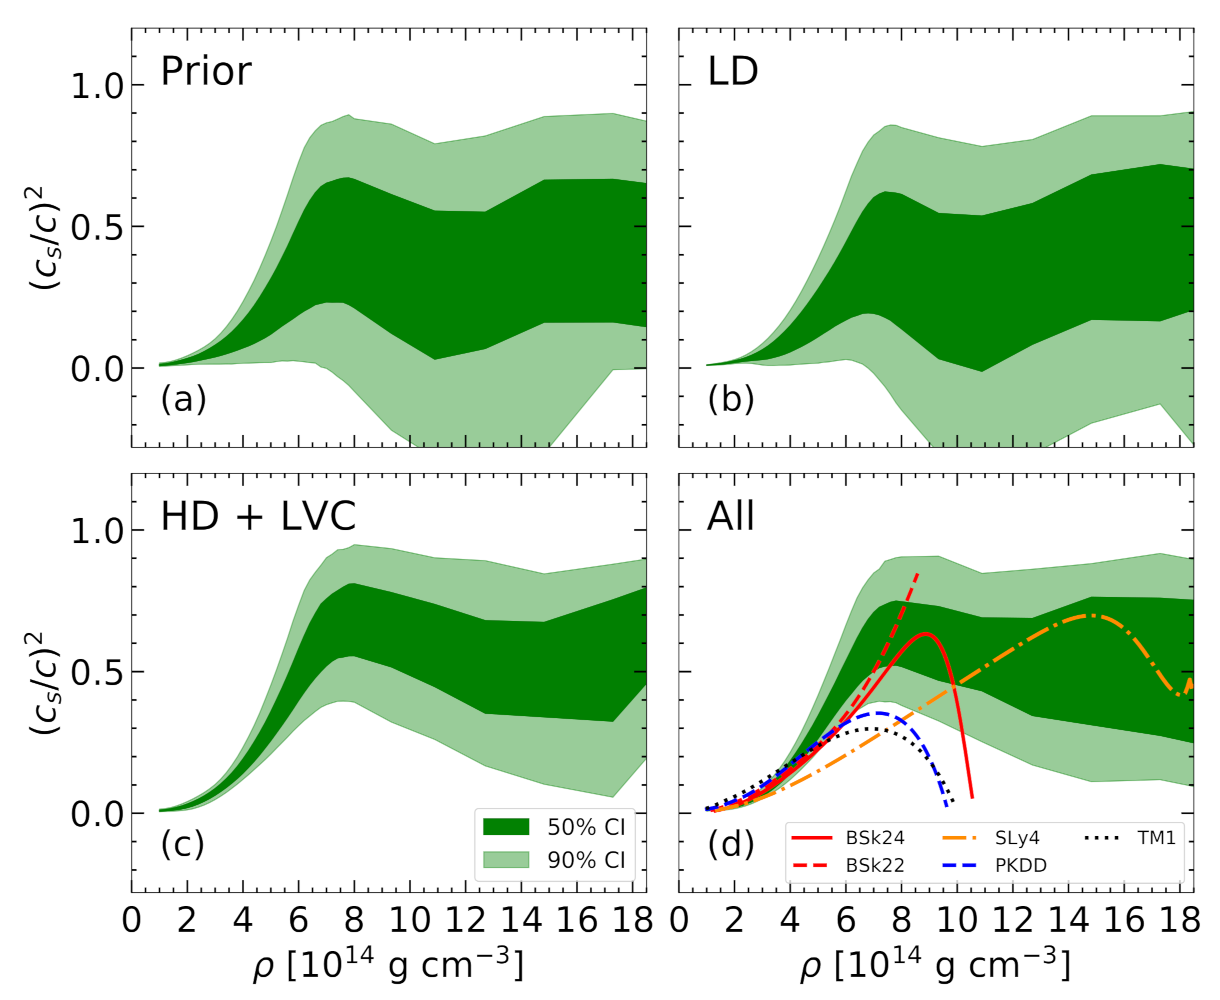
4.4. Speed of Sound in Medium

In Figure 7, we plot the velocity of sound in medium as a function of mass density ρ obtained with four different filters at the 50% and 90% confidence intervals, together with the behavior of some selected models [53,54,55,56]. One can observe that, for all the filters, the most probable equations of state remain causal up to very high densities (∼6 ρ s a t ), even though we do not explicitly put this requirement in our “Prior” and the “LD” filters in Figure 7a,b, respectively. As expected, the behavior of the sound speed is globally structureless. However, we can surprisingly see a trend for a peaked structure, which is typically presented in the literature as a signature of a transition to exotic matter. This peak may arise from the shoulder observed in Figure 6 above, which is due to the combined constraints of a relatively soft EoS at low density, and the necessity of reaching the maximal mass. These conditions lead to a peak in the global distribution; note, however, that this is not true for all models individually (see lines in Figure 7d). A very small fraction of non-causal models are present due to the fact that we plot the EoS only up to densities where the nucleon sound velocity is in the interval between 0 and 1. Residual non-causalities (not visible within 90% confidence interval of Figure 7) originate from the additional lepton contribution in beta-equilibrated matter.

4.5. NS Observables

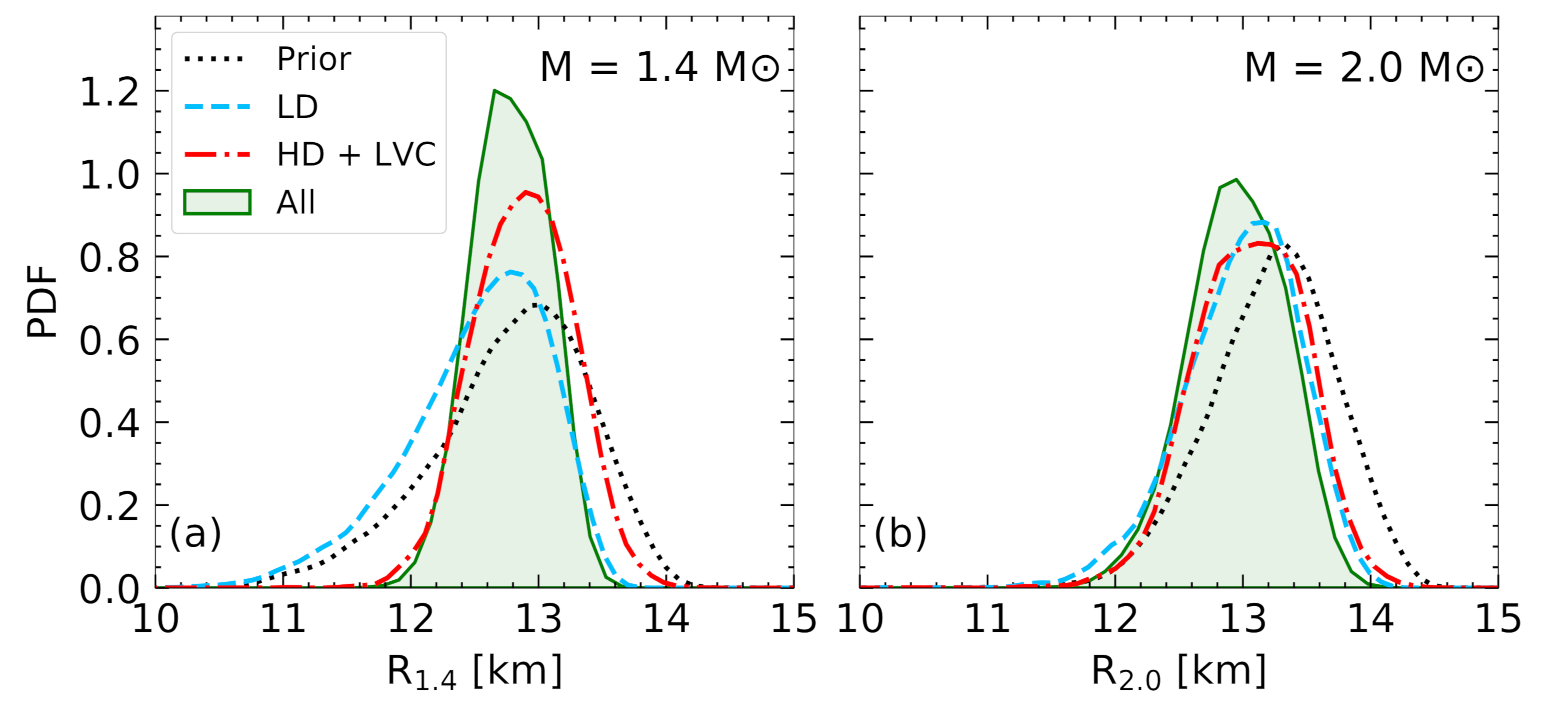
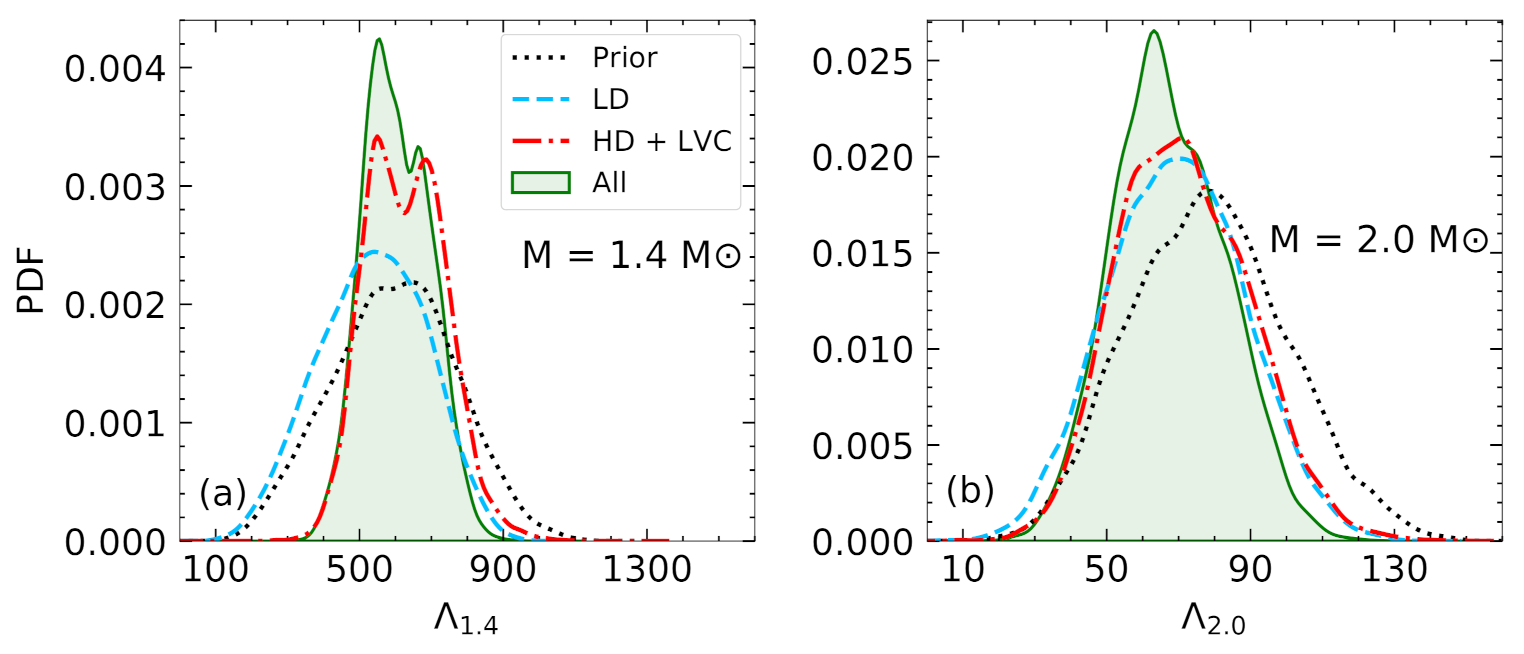
4.5.1. Masses and Radii
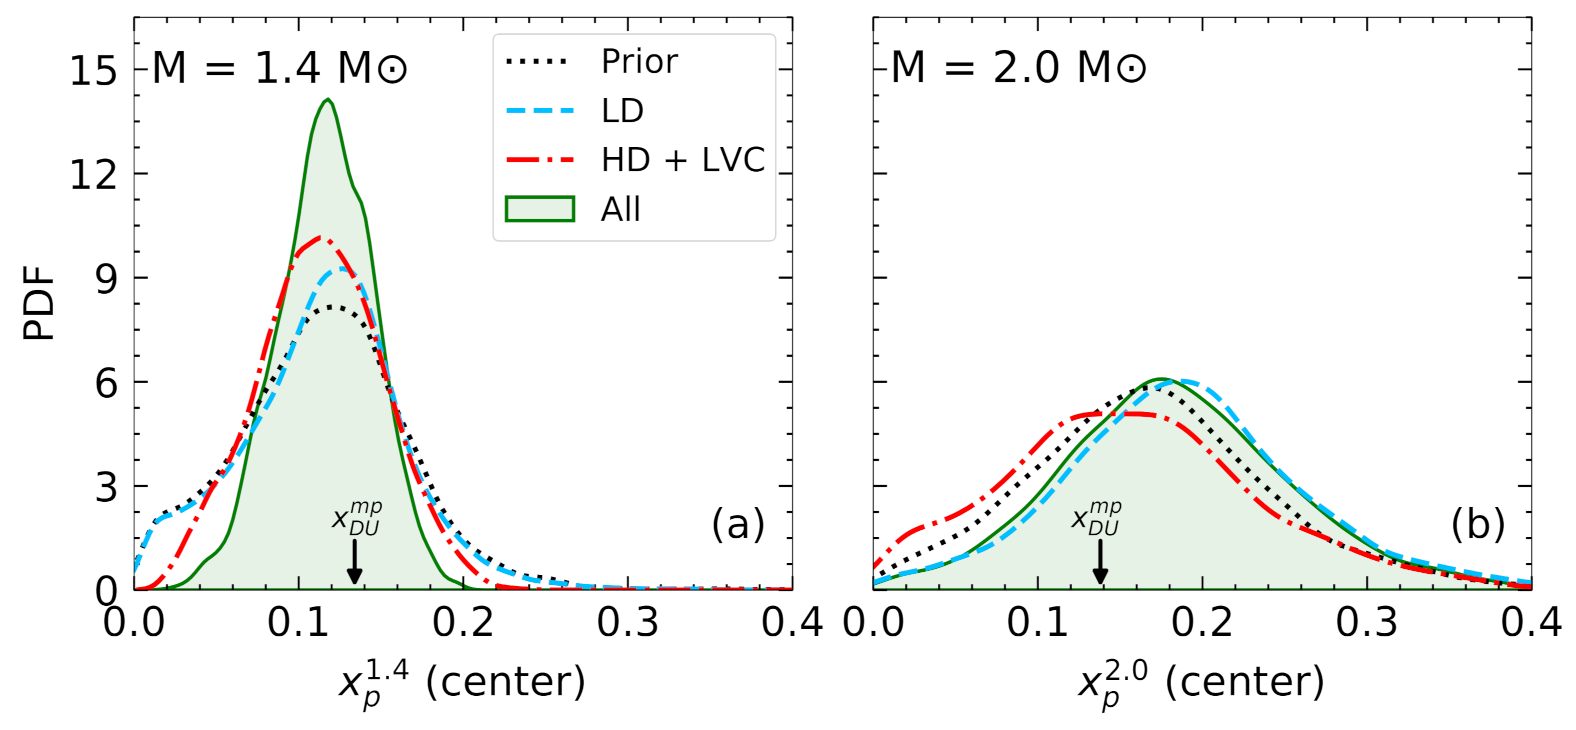
In Figure 8 we plot, for different filters, three shaded regions (from light to dark) sequentially containing 99 % , 95 % , and 68 % confidence intervals for two-dimensional distribution for the mass and radius of NSs. The two black contour lines, at low mass and high mass, respectively, indicate 68 % of the mass-radius distributions for PSR J0030+0451 [2] and PSR J0740+6620 [4]. One can observe in Figure 8a that our prior is already quite compatible with both the recent NICER observations [2,4]. This explains why the effect of the constraints from NICER is globally small in all our distributions. Moreover, since in Figure 8c we already included the constraint from the radio mass measurement of the high-mass pulsar PSR J0348+0432, the impact from the mass of PSR J0740+6620 is obscured in Figure 8d. Additionally, the large uncertainty in the new radius measurement does not help to further constrain the EoS. The compatibility of NICER measurement and our distributions implies that a nucleonic EoS is flexible enough to reproduce those dense-matter observations. In Reference [51], Pang et al. computed the Bayes factor to study the possibility of a strong first-order phase transition from nuclear to quark matter in NS. If the data from Miller et al. [4] is used, the Bayes factor changes from 0.265 to 0.205. Even though the effect from PSR J0740+6620 is not significant, a decrease in the Bayes factor points to the fact that a first-order phase transition to quark matter is disfavored. Similarly, Legred et al. [57] found that the Bayes factor for EoSs with one stable branch against those with at least one disconnected hybrid star branch is 0.156 (0.220) with (without) the PSR J0740+6620 measurement. Both these studies censure the possibility of a strong phase transition and support the suitability of the hadronic EoS with respect to NS observables, which is in line with our present analysis.
Figure 9 displays the marginalized distributions of NS radii, R 1.4 and R 2.0 , of the canonical mass 1.4 M (panel (a)) and the typical high mass 2.0 M (panel (b)), respectively. The dashed blue lines represent the PDFs obtained when a chiral EFT (LD) filter is applied. We can see from the figure that this filter puts a constraint on the upper bound of the distributions. It rejects models with R 1.4 13.6 km and R 2.0 14.0 km. In the HD+LVC distribution for 1.4 M NS, the constraint from GW170817 softens the EoS, hence constraining the upper bound of R 1.4 , while the requirement on the NS maximum mass filters out very soft EoSs, which places a limit on the the lower bound of R 1.4 . As a result, these two competing effects provide us with a relatively narrow range on the radius. In particular, R 1.4 11.8 , 14.0 km (see red dashed-dotted line in panel (a)). In the case of R 2.0 , the constraint from radio mass measurement of PSR J0348+0432 becomes redundant because all distributions must support 2.0 M NS, resulting in no effect being shown in the lower value of R 2.0 . Therefore, in the HD+LVC distribution of R 2.0 , the constraint only comes from the LVC measurement. Furthermore, this figure also tells us that the impacts on R 2.0 from the gravitational signal GW170817 and chiral EFT calculation are very similar, even though they affect two different regions of the EoS. Specifically, the former controls the EoS in the NS core, hence the core radius, while the latter dominates the crust EoS, hence the crust thickness. The prediction in the form of median and 68 % credible limits for R 1.4 ( R 2.0 ) when all constraints are applied together is 12.78 0.29 + 0.30 (12.96 0.37 + 0.38 ) km. In Miller et al. [4], the authors employed three EoS models, namely Gaussian, spectral, and PP. The values of R 1.4 for these three models are, respectively, 12.63 0.46 + 0.48 km, 12.30 0.51 + 0.54 km, and 12.56 0.40 + 0.45 km at 68% confidence limit. Despite the difference in EoS sampling methods, these results are in excellent agreement with the results obtained in the present work. Using also the likelihood from PREX-II measurement of R s k i n 208 [16], Reference [58] obtains R 1.4 = 12.61 0.41 + 0.36 km, which is also consistent with our prediction.
The dimensionless tidal deformability Λ in Equation (10) suggests a relation between Λ and R for a NS of given mass M. However, this relationship is not straightforward due to the complex radius dependence of the tidal Love number k 2 [41,42,43]. The relation between R and Λ , particularly for the mass M = 1.4 M has been investigated in several works [59,60,61,62]. Interestingly, Figure 10 shows that the distributions of Λ 1.4 and Λ 2.0 behave in accordance with the corresponding radius distributions in Figure 9. This may indicate a strong positive correlation between these two quantities, which will be discussed later. In addition, we estimate the 90 % confidence boundaries of Λ 1.4 ( Λ 2.0 ) to be Λ 1.4 [ 463 , 757 ] ( Λ 2.0 [ 43 , 94 ] ). This prediction of Λ 1.4 agrees excellently with the upper bound extracted from GW170817 signal in Reference [5] using TaylorF2 model, that is, Λ 1.4 800 . The limit in Λ 1.4 has been improved in Reference [6], in which the more realistic waveform PhenomPNRT was employed, and they obtained Λ 1.4 [ 70 , 580 ] at 90 % confidence level for the EoS-insensitive analysis [5,6]. Our distribution is still compatible with this result, but it suggests a slightly too stiff EoS in the nucleonic hypothesis.

4.5.2. Composition

The determination of the proton fraction is crucial for studying NS cooling. The most efficient cooling mechanism of NS is through the direct Urca (dUrca) neutrino emission process. This process is described by the following successive reactions:
n p + l + ν ¯ l
p + l n + ν l ,
where l = { e , μ } . From the momentum and charge conservations, one can derive the expression for the threshold, below which the dUrca process is forbidden:
x D U = 1 1 + ( 1 + x e p 1 / 3 ) 3 ,
where x e p ( = x e / x p ) is the ratio between electron and proton fraction. Values of x D U can vary in the range from x D U 1 / 9 in the case of no muons ( x e p = 1 ) to x D U 0.148 at the limit of massless muons ( x e p = 0.5 ) [30,63].
Figure 11 shows the PDFs of proton fractions calculated at the center of NS with M = 1.4 M and M = 2.0 M . The black arrow in each panel indicates the most probable value of x D U , calculated for the central density, denoted as x D U m p . We find that this quantity is independent of the constraint used. Furthermore, x D U m p only depends weakly on NS mass, x D U m p 0.134 (0.138) for M = 1.4 (2.0) M . For both masses, the distributions of x p extend to higher values than the corresponding threshold x D U m p . Therefore, it is possible for the dUrca process to operate even in NS of mass 1.4 M . Nevertheless, this fast cooling channel is more likely to occur in heavier NSs due to the higher median and deviation of the x p distribution. By integrating the PDF to find the area under the curve for x p x D U m p , we estimate the possibility for the dUrca process in NS of mass 1.4 M ( 2.0 M ) to be approximately 26 % (72%). For a more definitive evaluation, the predictions of NS central proton fractions, along with the radius and tidal deformability for NSs of mass 1.4 M and 2.0 M at 68% confidence limit, are listed in Table 3.

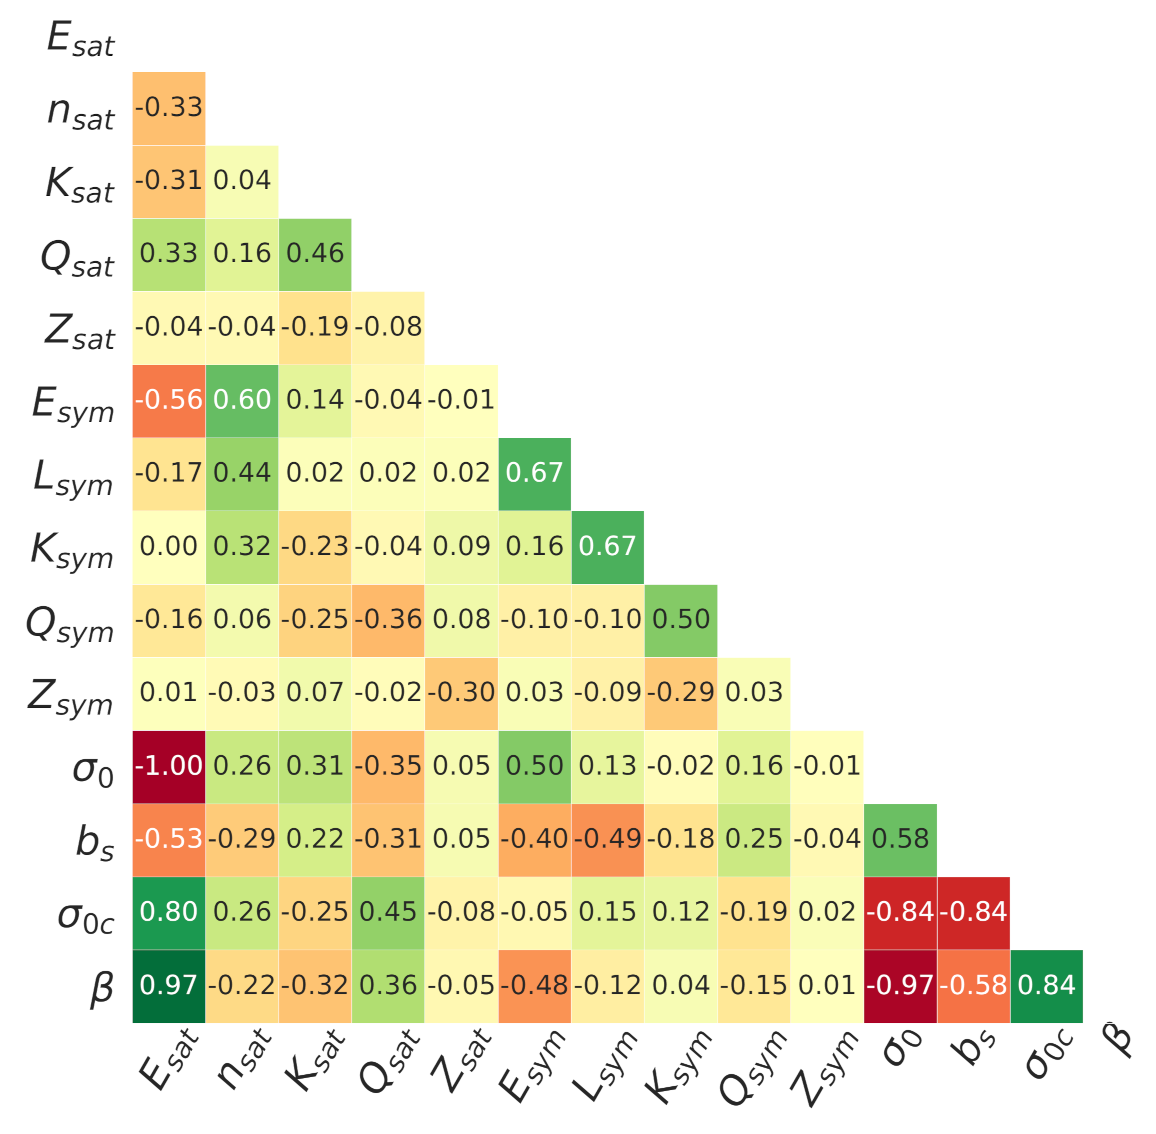
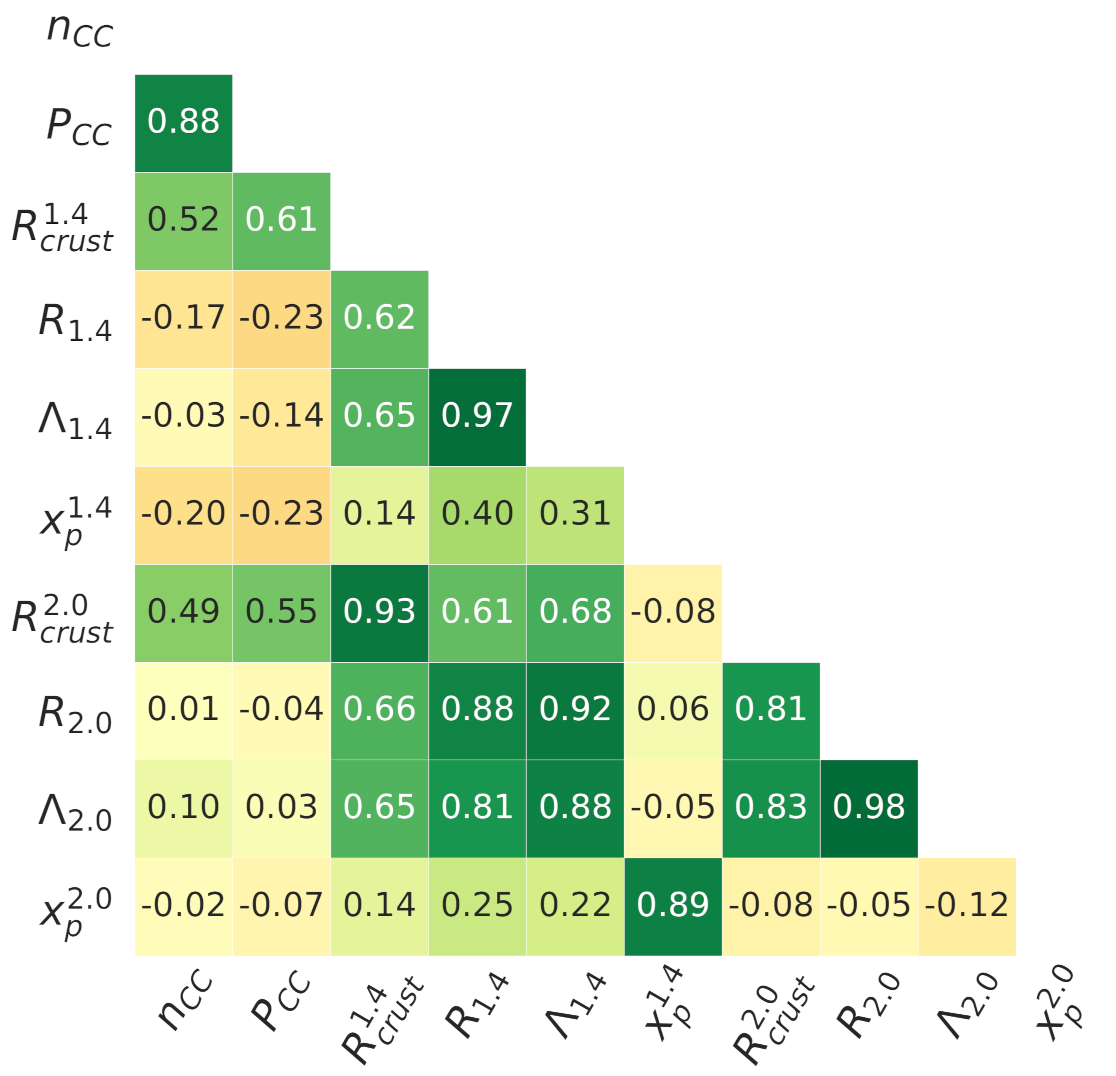
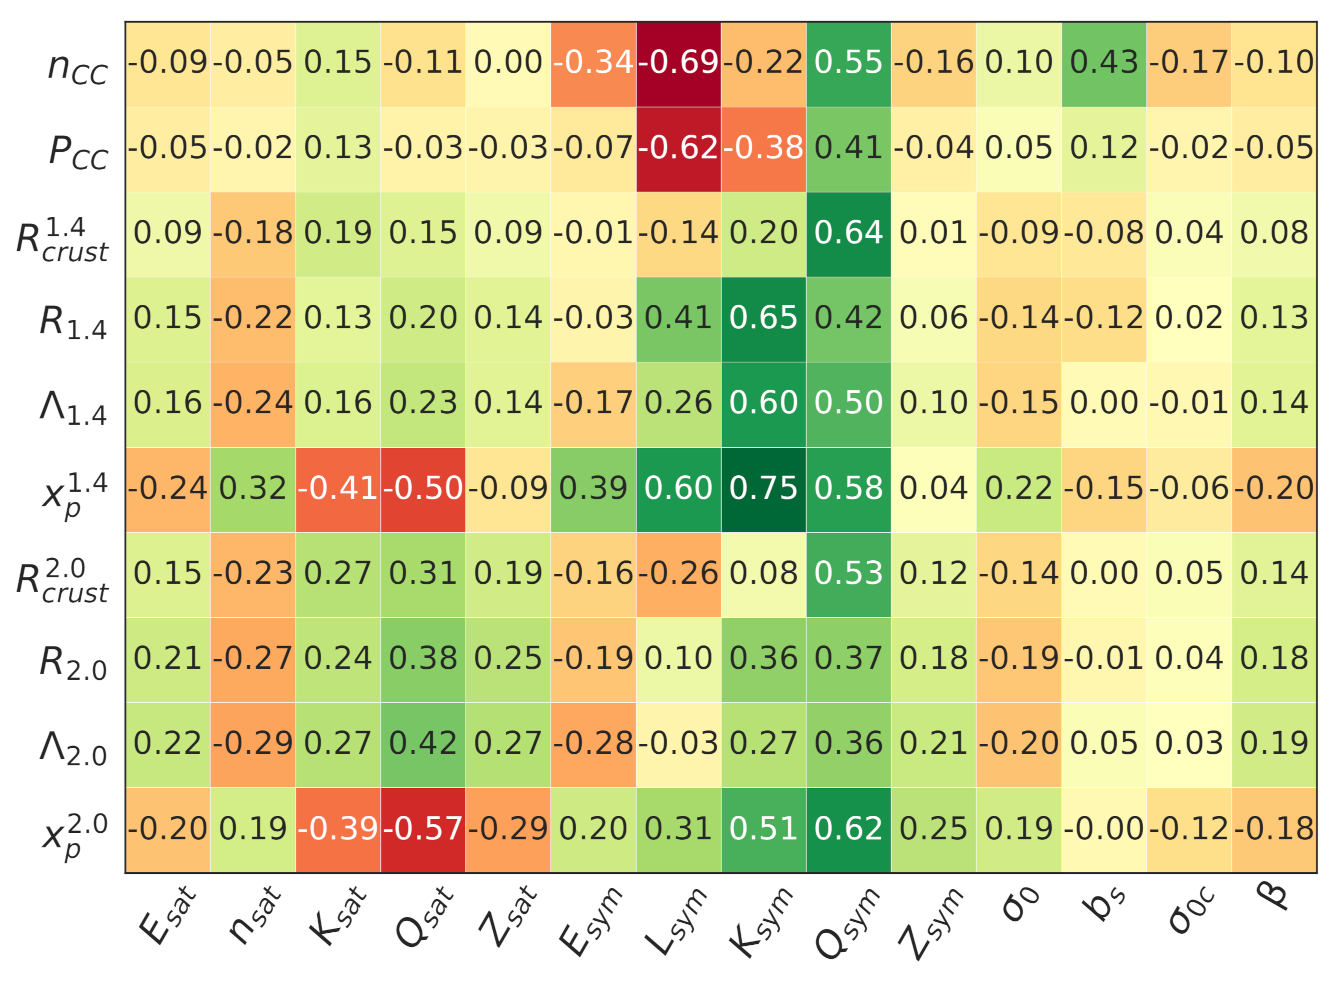
4.6. Pearson Correlations

Studying correlations among parameters and observables reveals a great deal about the many facets of multi-parametric model calculations [64]. The most frequently employed tool for this purpose is the linear Pearson correlation, which is defined for two quantities, x and y ( x , y can be parameters of the model or any observable calculated from it) as,
c o r r ( x , y ) = c o v ( x , y ) σ x σ y ,
where c o v ( x , y ) is the covariance between x and y, and σ x ( σ y ) is the standard deviation on x (y).
Figure 12 displays the Pearson correlation coefficients among all bulk, surface, and curvature parameters in the case where all constraints are applied. Since the bulk parameters are initially by construction uncorrelated in the flat prior distribution, we can easily assign the induced correlations to the different filters employed. It is shown in the figure that there is a perfect negative correlation between the surface tension of symmetric matter σ 0 and the saturation energy E s a t , with c o r r ( σ 0 , E s a t ) = 1 . A similar result was found in Reference [26]. The parameters associated to the curvature ( σ 0 c and β ), on the other hand, exhibit strong positive correlations with E s a t . These correlations appear due to the fit of the surface and curvature parameters to the experimental nuclear mass table. In addition, if the prior is only constrained by the experimental masses of nuclei, we also find a strong correlation between b s and E s y m , which are the two main parameters governing the energy of asymmetric nuclear matter. However, once the filter from chiral EFT calculation is applied, E s y m is tightly constrained, and hence the correlation becomes blurred. Similar to References [19,26], no significant correlations are found to be induced by the astrophysical constraints. The correlations among the bulk parameters shown in Figure 12 are resulted from the chiral EFT constraint. In particular, the symmetry energy E s y m has a moderate (anti)correlation with ( E s a t ) n s a t . Stronger correlations are found among the isovector parameters, which are c o r r ( E s y m , L s y m ) = 0.67 and c o r r ( L s y m , K s y m ) = 0.67 . The former is found in several works (see References [23,26,65] and references therein for a review), and the latter is also studied in References [66,67,68,69,70,71,72]. Slight correlations between high-order parameters, K s a t Q s a t and K s y m Q s y m , are also induced due to the narrow EFT energy bands at very low densities.
Correlations among different observables found in our study are plotted in Figure 13. The strongest correlations in this matrix are the well-known ones between radius and dimensionless tidal deformability, c o r r ( R 1.4 , Λ 1.4 ) = 0.97 and c o r r ( R 2.0 , Λ 2.0 ) = 0.98 . This explains the similarity in the distributions of R and Λ seen in Figure 9 and Figure 10. There is also a strong positive correlation between n C C and P C C . This correlation is also visible in the joint distribution plot in Figure 4. We have mentioned before that the determination of the transition point from crust to core is important in predicting crustal observables; this is again confirmed by the correlation coefficients between the crust thickness with the transition density and pressure. Finally, the correlations between the observables and parameters are also computed. The correlation matrix is shown in Figure 14. For most of the cases, the most influential parameters are from the isovector channel, which are L s y m , K s y m , and Q s y m . The only exception is for the proton fraction, where high-order isoscalar parameters have negative correlations. This correlation study clearly demonstrates that astrophysical observables have a marginal influence on the higher order nuclear matter properties, which points towards two conclusions: (a) the low-density nuclear physics data have a large influence on constraining the lower-order parameters; (b) we need more precise astrophysical data to tighten the constraints on higher order parameters. Conversely, to obtain a more accurate prediction of astrophysical properties, we need to reduce the uncertainties in these higher-order parameters from other sources, e.g., heavy ion collisions [73].

5. Conclusions

To conclude, we have jointly analyzed different constraints on the nuclear matter EoS coming from nuclear experiments, ab initio nuclear theory, and several new astrophysical observational data, including the very recent simultaneous observation of mass-radius of PSR J0348+0432 and PSR J0740+6620 from NICER collaboration as well as LIGO-Virgo observations of tidal deformability in GW170817 event. Imposing all these different constraints in a Bayesian framework, we have challenged the hypothesis of a fully analytical (continuous and derivable at all orders) EoS, as obtained in the case where dense baryonic matter is purely constituted of neutrons and protons without any phase transition or exotic degrees of freedom.
Notably, we have observed that if we have a nuclear physics informed prior including the binding energy data of the whole nuclear chart and chiral EFT constraints on low-density SNM and PNM, the posterior for mass-radius of NSs are already in line with NICER observations. Contrarily, bounds on high-density matter from a radio astronomy observation of NS of 2 solar mass and GW170817 data on tidal deformability are reasonably appreciated. With the present knowledge of astrophysical observations, we predict that the direct Urca cooling is possible with non-negligible probability (27%), even in an NS with a mass as low as 1.4 M , which increases much further 72 % for a NS of 2.0 M . This might also be very crucial when (in)validating the nucleonic hypothesis of high-density matter. As all current data on astrophysical observations comply with the nucleonic hypothesis within our metamodel approach, we need much more stringent constraints from the observations to conclusively establish (reject) the presence of exotic degrees of freedom in high-density matter.

Author Contributions

All the authors contributed equally to the writing with H.D.T. performing the calculations and preparing the first draft of the manuscript. All authors have read and agreed to the published version of the manuscript.

Funding

The authors acknowledge partial support from the IN2P3 Master Project “NewMAC”.

Institutional Review Board Statement

This manuscript has gone through VIRGO document review system as C.M. and F.G. are obliged to make sure any infringement of the VIRGO data has not taken place, being part of the VIRGO collaboration through Caen-Meudon group.

Informed Consent Statement

Not applicable.

Data Availability Statement

Not applicable.

Conflicts of Interest

The authors declare no conflict of interest.

References

  1. Riley, T.E.; Watts, A.L.; Bogdanov, S.; Ray, P.S.; Ludlam, R.M.; Guillot, S.; Arzoumanian, Z.; Baker, C.L.; Bilous, A.V.; Chakrabarty, D.; et al. A NICER View of PSR J0030+0451: Millisecond Pulsar Parameter Estimation. Astrophys. J. Lett. 2019, 887, L21. [Google Scholar] [CrossRef] [Green Version]
  2. Miller, M.C.; Lamb, F.K.; Dittmann, A.J.; Bogdanov, S.; Arzoumanian, Z.; Gendreau, K.C.; Guillot, S.; Harding, A.K.; Ho, W.C.G.; Lattimer, J.M.; et al. PSR J0030+0451 Mass and Radius from NICER Data and Implications for the Properties of Neutron Star Matter. Astrophys. J. Lett. 2019, 887, L24. [Google Scholar] [CrossRef] [Green Version]
  3. Riley, T.E.; Watts, A.L.; Ray, P.S.; Bogdanov, S.; Guillot, S.; Morsink, S.M.; Bilous, A.V.; Arzoumanian, Z.; Choudhury, D.; Deneva, J.S.; et al. A NICER View of the Massive Pulsar PSR J0740+6620 Informed by Radio Timing and XMM-Newton Spectroscopy. arXiv 2021, arXiv:2105.06980. [Google Scholar]
  4. Miller, M.C.; Lamb, F.K.; Dittmann, A.J.; Bogdanov, S.; Arzoumanian, Z.; Gendreau, K.C.; Guillot, S.; Ho, W.C.G.; Lattimer, J.M.; Loewenstein, M.; et al. The Radius of PSR J0740+6620 from NICER and XMM-Newton Data. arXiv 2021, arXiv:2105.06979. [Google Scholar]
  5. Abbott, B.P.; Abbott, R.; Abbott, T.D.; Acernese, F.; Ackley, K.; Adams, C.; Adams, T.; Addesso, P.; Adhikari, R.X.; Adya, V.B.; et al. GW170817: Observation of Gravitational Waves from a Binary Neutron Star Inspiral. Phys. Rev. Lett. 2017, 119, 161101. [Google Scholar] [CrossRef] [Green Version]
  6. Abbott, B.P.; Abbott, R.; Abbott, T.D.; Acernese, F.; Ackley, K.; Adams, C.; Adams, T.; Addesso, P.; Adhikari, R.X.; Adya, V.B.; et al. GW170817: Measurements of Neutron Star Radii and Equation of State. Phys. Rev. Lett. 2018, 121, 161101. [Google Scholar] [CrossRef] [PubMed] [Green Version]
  7. Abbott, B.P.; Abbott, R.; Abbott, T.D.; Acernese, F.; Ackley, K.; Adams, C.; Adams, T.; Addesso, P.; Adhikari, R.X.; Adya, V.B.; et al. Properties of the Binary Neutron Star Merger GW170817. Phys. Rev. X 2019, 9, 011001. [Google Scholar] [CrossRef] [Green Version]
  8. The LIGO Scientific Collaboration; Aasi, J.; Abbott, B.P.; Abbott, R.; Abbott, T.; Abernathy, M.R.; Ackley, K.; Adams, C.; Adams, T.; Addesso, P.; et al. Advanced LIGO. Class. Quantum Grav. 2015, 32, 074001. [Google Scholar] [CrossRef]
  9. Acernese, F.; Agathos, M.; Agatsuma, K.; Aisa, D.; Allemandou, N.; Allocca, A.; Amarni, J.; Astone, P.; Balestri, G.; Ballardin, G.; et al. Advanced Virgo: A second-generation interferometric gravitational wave detector. Class. Quantum Grav. 2015, 32, 024001. [Google Scholar] [CrossRef] [Green Version]
  10. Abbott, B.P.; Abbott, R.; Abbott, T.D.; Acernese, F.; Ackley, K.; Adams, C.; Adams, T.; Addesso, P.; Adhikari, R.X.; Adya, V.B.; et al. Prospects for observing and localizing gravitational-wave transients with Advanced LIGO, Advanced Virgo and KAGRA. Living Rev. Relativ. 2020, 23, 1–69. [Google Scholar] [CrossRef]
  11. Oertel, M.; Hempel, M.; Klähn, T.; Typel, S. Equations of State for Supernovae and Compact Stars. Rev. Mod. Phys. 2017, 89, 015007. [Google Scholar] [CrossRef]
  12. Hartle, J.B. Slowly Rotating Relativistic Stars. 1. Equations of Structure. Astrophys. J. 1967, 150, 1005–1029. [Google Scholar] [CrossRef]
  13. Horowitz, C.J. Neutron Rich Matter in the Laboratory and in the Heavens after GW170817. Ann. Phys. 2019, 411, 167992. [Google Scholar] [CrossRef] [Green Version]
  14. Fiorella Burgio, G.; Vidaña, I. The Equation of State of Nuclear Matter: From Finite Nuclei to Neutron Stars. Universe 2020, 6, 119. [Google Scholar] [CrossRef]
  15. Güven, H.; Bozkurt, K.; Khan, E.; Margueron, J. Multimessenger and Multiphysics Bayesian Inference for the GW170817 Binary Neutron Star Merger. Phys. Rev. C 2020, 102, 015805. [Google Scholar] [CrossRef]
  16. Adhikari, D.; Albataineh, H.; Androic, D.; Aniol, K.; Armstrong, D.S.; Averett, T.; Ayerbe Gayoso, C.; Barcus, S.; Bellini, V.; Beminiwattha, R.S.; et al. Accurate Determination of the Neutron Skin Thickness of 208Pb through Parity-Violation in Electron Scattering. Phys. Rev. Lett. 2021, 126, 172502. [Google Scholar] [CrossRef]
  17. Reed, B.T.; Fattoyev, F.J.; Horowitz, C.J.; Piekarewicz, J. Implications of PREX-2 on the Equation of State of Neutron-Rich Matter. Phys. Rev. Lett. 2021, 126, 172503. [Google Scholar] [CrossRef]
  18. Essick, R.; Tews, I.; Landry, P.; Schwenk, A. Astrophysical Constraints on the Symmetry Energy and the Neutron Skin of 208 Pb with Minimal Modeling Assumptions. arXiv 2021, arXiv:2102.10074. [Google Scholar]
  19. Margueron, J.; Hoffmann Casali, R.; Gulminelli, F. Equation of State for Dense Nucleonic Matter from Metamodeling. II. Predictions for Neutron Star Properties. Phys. Rev. C 2018, 97, 025806. [Google Scholar] [CrossRef] [Green Version]
  20. Steiner, A.W.; Lattimer, J.M.; Brown, E.F. The Neutron Star Mass-Radius Relation and the Equation of State of Dense Matter. Astrophys. J. Lett. 2013, 765, L5. [Google Scholar] [CrossRef]
  21. Margueron, J.; Hoffmann Casali, R.; Gulminelli, F. Equation of State for Dense Nucleonic Matter from Metamodeling. I. Foundational Aspects. Phys. Rev. C 2018, 97, 025805. [Google Scholar] [CrossRef] [Green Version]
  22. Zhang, N.-B.; Li, B.-A.; Xu, J. Combined Constraints on the Equation of State of Dense Neutron-Rich Matter from Terrestrial Nuclear Experiments and Observations of Neutron Stars. Astrophys. J. 2018, 859, 90. [Google Scholar] [CrossRef]
  23. Lim, Y.; Holt, J.W. Bayesian Modeling of the Nuclear Equation of State for Neutron Star Tidal Deformabilities and GW170817. Eur. Phys. J. A 2019, 55, 209. [Google Scholar] [CrossRef]
  24. Carreau, T.; Gulminelli, F.; Margueron, J. General Predictions for the Neutron Star Crustal Moment of Inertia. Phys. Rev. C 2019, 100, 055803. [Google Scholar] [CrossRef] [Green Version]
  25. Tsang, C.Y.; Tsang, M.B.; Danielewicz, P.; Lynch, W.G.; Fattoyev, F.J. Impact of the Neutron-Star Deformability on Equation of State Parameters. Phys. Rev. C 2020, 102, 045808. [Google Scholar] [CrossRef]
  26. Carreau, T.; Gulminelli, F.; Margueron, J. Bayesian Analysis of the Crust-Core Transition with a Compressible Liquid-Drop Model. Eur. Phys. J. A 2019, 55, 188. [Google Scholar] [CrossRef]
  27. Huang, W.J.; Audi, G.; Wang, M.; Kondev, F.G.; Naimi, S.; Xu, X. The AME2016 Atomic Mass Evaluation (I). Evaluation of Input Data; and Adjustment Procedures. Chin. Phys. C 2017, 41, 030002. [Google Scholar] [CrossRef]
  28. Dinh Thi, H.; Carreau, T.; Fantina, A.F.; Gulminelli, F. Uncertainties in the Pasta-Phase Properties in Catalysed Neutron Stars. Astron. Astrophys. 2021. [Google Scholar] [CrossRef]
  29. Ravenhall, D.G.; Pethick, C.J.; Wilson, J.R. Structure of Matter below Nuclear Saturation Density. Phys. Rev. Lett. 1983, 50, 2066. [Google Scholar] [CrossRef]
  30. Lattimer, J.M.; Douglas Swesty, F. A Generalized Equation of State for Hot, Dense Matter. Nucl. Phys. A 1991, 535, 331–376. [Google Scholar] [CrossRef]
  31. Lorenz, C.P.; Ravenhall, D.G.; Pethick, C.J. Neutron Star Crusts. Phys. Rev. Lett. 1993, 70, 379–382. [Google Scholar] [CrossRef]
  32. Newton, W.G.; Gearheart, M.; Li, B.A. A Survey of the Parameter Space of the Compressible Liquid Drop Model as Applied to the Neutron Star Inner Crust. Astrophys. J. Suppl. Ser. 2013, 204, 9. [Google Scholar] [CrossRef] [Green Version]
  33. Balliet, L.E.; Newton, W.G.; Cantu, S.; Budimir, S. Prior Probability Distributions of Neutron Star Crust Models. Astrophys. J. 2021, 918, 79. [Google Scholar] [CrossRef]
  34. Fortin, M.; Providência, C.; Raduta, A.R.; Gulminelli, F.; Zdunik, J.L.; Haensel, P.; Bejger, M. Neutron Star Radii and Crusts: Uncertainties and Unified Equations of State. Phys. Rev. C 2016, 94, 035804. [Google Scholar] [CrossRef] [Green Version]
  35. Drischler, C.; Hebeler, K.; Schwenk, A. Asymmetric Nuclear Matter Based on Chiral Two- and Three-Nucleon Interactions. Phys. Rev. C 2016, 93, 054314. [Google Scholar] [CrossRef] [Green Version]
  36. Antoniadis, J.; Freire, P.C.C.; Wex, N.; Tauris, T.M.; Lynch, R.S.; van Kerkwijk, M.H.; Kramer, M.; Bassa, C.; Dhillon, V.S.; Driebe, T.; et al. A Massive Pulsar in a Compact Relativistic Binary. Science 2013, 340. [Google Scholar] [CrossRef] [PubMed] [Green Version]
  37. Fonseca, E.; Cromartie, H.T.; Pennucci, T.T.; Ray, P.S.; Kirichenko, A.Y.; Ransom, S.M.; Demorest, P.B.; Stairs, I.H.; Arzoumanian, Z.; Guillemot, L.; et al. Refined Mass and Geometric Measurements of the High-Mass PSR J0740+6620. Astrophys. J. Lett. 2021, 915, L12. [Google Scholar] [CrossRef]
  38. Oppenheimer, J.R.; Volkoff, G.M. On Massive Neutron Cores. Phys. Rev. 1939, 55, 374–381. [Google Scholar] [CrossRef]
  39. Tolman, R.C. Static Solutions of Einstein’s Field Equations for Spheres of Fluid. Phys. Rev. 1939, 55, 364–373. [Google Scholar] [CrossRef] [Green Version]
  40. LIGO Document P1800370-v5: Parameter Estimation Sample Release for GWTC-1. Available online: https://doi.org/10.7935/KSX7-QQ51 (accessed on 22 July 2021).
  41. Hinderer, T. Tidal Love Numbers of Neutron Stars. Astrophys. J. 2008, 677, 1216–1220. [Google Scholar] [CrossRef]
  42. Binnington, T.; Poisson, E. Relativistic Theory of Tidal Love Numbers. Phys. Rev. D 2009, 80, 084018. [Google Scholar] [CrossRef] [Green Version]
  43. Damour, T.; Nagar, A. Relativistic Tidal Properties of Neutron Stars. Phys. Rev. D 2009, 80, 084035. [Google Scholar] [CrossRef] [Green Version]
  44. Dinh Thi, H.; Fantina, A.F.; Gulminelli, F. The Effect of the Energy Functional on the Pasta-Phase Properties of Catalysed Neutron Stars. Eur. Phys. J. A 2021. submitted. [Google Scholar]
  45. Espinoza, C.M.; Lyne, A.G.; Stappers, B.W.; Kramer, M. A Study of 315 Glitches in the Rotation of 102 Pulsars. Mon. Not. R. Astron. Soc. 2011, 414, 1679–1704. [Google Scholar] [CrossRef] [Green Version]
  46. Grill, F.; Providência, C.; Avancini, S.S. Neutron Star Inner Crust and Symmetry Energy. Phys. Rev. C 2012, 85, 055808. [Google Scholar] [CrossRef] [Green Version]
  47. Pearson, J.M.; Chamel, N.; Potekhin, A.Y. Unified Equations of State for Cold Nonaccreting Neutron Stars with Brussels-Montreal Functionals. II. Pasta Phases in Semiclassical Approximation. Phys. Rev. C 2020, 101, 15802. [Google Scholar] [CrossRef] [Green Version]
  48. Lindblom, L. Spectral Representations of Neutron-Star Equations of State. Phys. Rev. D 2010, 82, 103011. [Google Scholar] [CrossRef] [Green Version]
  49. Lattimer, J.M.; Prakash, M. Neutron Star Structure and the Equation of State. Astrophys. J. 2001, 550, 426–442. [Google Scholar] [CrossRef] [Green Version]
  50. Landry, P.; Essick, R.; Chatziioannou, K. Nonparametric constraints on neutron star matter with existing and upcoming gravitational wave and pulsar observations. Phys. Rev. D 2020, 101, 123007. [Google Scholar] [CrossRef]
  51. Pang, P.T.H.; Tews, I.; Coughlin, M.W.; Bulla, M.; Van Den Broeck, C.; Dietrich, T. Nuclear-Physics Multi-Messenger Astrophysics Constraints on the Neutron-Star Equation of State: Adding NICER’s PSR J0740+6620 Measurement. arXiv 2021, arXiv:2105.08688. [Google Scholar]
  52. Raaijmakers, G.; Greif, S.K.; Hebeler, K.; Hinderer, T.; Nissanke, S.; Schwenk, A.; Riley, T.E.; Watts, A.L.; Lattimer, J.M.; Ho, W.C.G. Constraints on the Dense Matter Equation of State and Neutron Star Properties from NICER’s Mass-Radius Estimate of PSR J0740+6620 and Multimessenger Observations. arXiv 2021, arXiv:2105.06981. [Google Scholar]
  53. Goriely, S.; Chamel, N.; Pearson, J.M. Further Explorations of Skyrme-Hartree-Fock-Bogoliubov Mass Formulas. XIII. the 2012 Atomic Mass Evaluation and the Symmetry Coefficient. Phys. Rev. C 2013, 88, 024308. [Google Scholar] [CrossRef]
  54. Chabanat, E.; Bonche, P.; Haensel, P.; Meyer, J.; Schaeffer, R. A Skyrme Parametrization from Subnuclear to Neutron Star Densities Part II. Nuclei Far from Stabilities. Nucl. Phys. A 1998, 635, 231–256. [Google Scholar] [CrossRef]
  55. Sumiyoshi, K.; Kuwabara, H.; Toki, H. Relativistic mean-field theory with non-linear σ and ω terms for neutron stars and supernovae. Nucl. Phys. A 1995, 581, 725–746. [Google Scholar] [CrossRef]
  56. Long, W.; Meng, J.; Van Giai, N.; Zhou, S.G. New Effective Interactions in Relativistic Mean Field Theory with Nonlinear Terms and Density-Dependent Meson-Nucleon Coupling. Phys. Rev. C 2004, 69, 034319. [Google Scholar] [CrossRef] [Green Version]
  57. Legred, I.; Chatziioannou, K.; Essick, R.; Han, S.; Landry, P. Impact of the PSR J0740+6620 Radius Constraint on the Properties of High-Density Matter. arXiv 2021, arXiv:2106.05313. [Google Scholar]
  58. Biswas, B. Impact of PREX-II and Combined Radio/NICER/XMM-Newton’s Mass-Radius Measurement of PSRJ0740+6620 on the Dense Matter Equation of State. arXiv 2021, arXiv:2105.02886. [Google Scholar]
  59. Malik, T.; Alam, N.; Fortin, M.; Providência, C.; Agrawal, B.K.; Jha, T.K.; Kumar, B.; Patra, S.K. GW170817: Constraining the Nuclear Matter Equation of State from the Neutron Star Tidal Deformability. Phys. Rev. C 2018, 98, 035804. [Google Scholar] [CrossRef]
  60. Fattoyev, F.J.; Piekarewicz, J.; Horowitz, C.J. Neutron Skins and Neutron Stars in the Multimessenger Era. Phys. Rev. Lett. 2018, 120, 172702. [Google Scholar] [CrossRef] [Green Version]
  61. Annala, E.; Gorda, T.; Kurkela, A.; Vuorinen, A. Gravitational-Wave Constraints on the Neutron-Star-Matter Equation of State. Phys. Rev. Lett. 2018, 120, 172703. [Google Scholar] [CrossRef] [Green Version]
  62. Lourenço, O.; Dutra, M.; Lenzi, C.H.; Flores, C.V.; Menezes, D.P. Consistent Relativistic Mean-Field Models Constrained by GW170817. Phys. Rev. C 2019, 99, 045202. [Google Scholar] [CrossRef] [Green Version]
  63. Klähn, T.; Blaschke, D.; Typel, S.; van Dalen, E.N.E.; Faessler, A.; Fuchs, C.; Gaitanos, T.; Grigorian, H.; Ho, A.; Kolomeitsev, E.E.; et al. Constraints on the High-Density Nuclear Equation of State from the Phenomenology of Compact Stars and Heavy-Ion Collisions. Phys. Rev. C 2006, 74, 035802. [Google Scholar] [CrossRef] [Green Version]
  64. Dobaczewski, J.; Nazarewicz, W.; Reinhard, P.-G. Error estimates of theoretical models: A guide. J. Phys. G 2014, 41, 074001. [Google Scholar] [CrossRef]
  65. Margueron, J.; Gulminelli, F. Effect of High-Order Empirical Parameters on the Nuclear Equation of State. Phys. Rev. C 2019, 99, 025806. [Google Scholar] [CrossRef] [Green Version]
  66. Danielewicz, P.; Lee, J. Symmetry Energy I: Semi-Infinite Matter. Nucl. Phys. A 2009, 818, 36–96. [Google Scholar] [CrossRef] [Green Version]
  67. Chen, L.-W.; Cai, B.-J.; Ko, C.M.; Li, B.-A.; Shen, C.; Xu, J. Higher-Order Effects on the Incompressibility of Isospin Asymmetric Nuclear Matter. Phys. Rev. C 2009, 80, 014322. [Google Scholar] [CrossRef] [Green Version]
  68. Vidaña, I.; Providência, C.; Polls, A.; Rios, A. Density Dependence of the Nuclear Symmetry Energy: A Microscopic Perspective. Phys. Rev. C 2009, 80, 045806. [Google Scholar] [CrossRef] [Green Version]
  69. Ducoin, C.; Margueron, J.; Providência, C. Nuclear Symmetry Energy and Core-Crust Transition in Neutron Stars: A Critical Study. Europhys. Lett. 2010, 91, 32001. [Google Scholar] [CrossRef] [Green Version]
  70. Santos, B.M.; Dutra, M.; Lourenço, O.; Delfino, A. Correlations between the Nuclear Matter Symmetry Energy, Its Slope, and Curvature from a Nonrelativistic Solvable Approach and Beyond. Phys. Rev. C 2014, 90, 035203. [Google Scholar] [CrossRef] [Green Version]
  71. Mondal, C.; Agrawal, B.K.; De, J.N.; Samaddar, S.K.; Centelles, M.; Viñas, X. Interdependence of different symmetry energy elements. Phys. Rev. C 2017, 96, 021302. [Google Scholar] [CrossRef] [Green Version]
  72. Mondal, C.; Agrawal, B.K.; De, J.N.; Samaddar, S.K. Correlations among symmetry energy elements in Skyrme models. Int. J. Mod. Phys. E 2018, 27, 1850078. [Google Scholar] [CrossRef] [Green Version]
  73. Adamczewski-Musch, J.; Arnold, O.; Behnke, C.; Belounnas, A.; Belyaev, A.; Berger-Chen, J.C.; Blanco, A.; Blume, C.; Böhmer, M.; Bordalo, P.; et al. Directed, Elliptic, and Higher Order Flow Harmonics of Protons, Deuterons, and Tritons in Au + Au Collisions at s NN = 2.4 GeV. Phys. Rev. Lett. 2020, 125, 262301. [Google Scholar] [CrossRef] [PubMed]
Figure 1. Probability density distributions of isoscalar empirical parameters E s a t (panel (a)), n s a t (panel (b)), K s a t (panel (c)), and Q s a t (panel (d)), for the prior distribution informed by experimental nuclear masses (black dotted line) and for posteriors of models passing through the low-density (chiral EFT) constraint (blue dashed line), high-density constraints (causality, stability, e s y m 0 , maximum NS mass, and tidal deformability) (red dash-dotted line), and all constraints combined (green shaded region). See texts for details.
Universe 07 00373 g001
Figure 2. Same as Figure 1 but for isovector empirical parameters E s y m (panel (a)), L s y m (panel (b)), K s y m (panel (c)), and Q s y m (panel (d)).
Universe 07 00373 g002
Figure 3. 50% (darker color) and 90 % (lighter color) confidence intervals of energy per nucleon of symmetric nuclear matter ( e S N M , color green) and symmetry energy ( e s y m , color orange) as a function of density n in the four distributions: Prior (panel (a)), LD (panel (b)), HD+LVC (panel (c)), and All (panel (d)).
Universe 07 00373 g003
Figure 4. Joint probability density plots of crust–core transition density n C C and pressure P C C in the four distributions: Prior (panel (a)), LD (panel (b)), HD+LVC (panel (c)), and All (panel (d)). The dashed black contours in each panel indicate the 68%, 95%, and 99 % confidence regions.
Universe 07 00373 g004
Figure 5. Probability density distributions of crust thickness at M = 1.4 M (panel (a)) and M = 2.0 M (panel (b)).
Universe 07 00373 g005
Figure 6. 50% (dark orange) and 90 % (light orange) confidence intervals of pressure P as a function of mass density ρ in comparison with the 90 % confidence interval of the posterior obtained in Abbott et al. 2018 [6] (blue dashed lines) in the four distributions: Prior (panel (a)), LD (panel (b)), HD+LVC (panel (c)), and All (panel (d)). See text for details.
Universe 07 00373 g006
Figure 7. 50% (dark green) and 90 % (light green) confidence intervals of sound speed c s c 2 as a function of mass density ρ in the four distributions: Prior (panel (a)), LD (panel (b)), HD+LVC (panel (c)), and All (panel (d)). Curves in panel (d) show the sound speed of some selected models [53,54,55,56] up to the central density corresponding to the maximum mass. See text for details.
Universe 07 00373 g007
Figure 8. Probability density plots of NS mass M as a function of radius R in comparison with two NICER measurements at 68% (black contours) in the four distributions: Prior (panel (a)), LD (panel (b)), HD+LVC (panel (c)), and All (panel (d)). The three shaded regions in each panel contain 68%, 95%, and 99% of the distribution. See text for details.
Universe 07 00373 g008
Figure 9. Probability density distributions of NS radii at M = 1.4 M (panel (a)) and M = 2.0 M (panel (b)).
Universe 07 00373 g009
Figure 10. Probability density distributions of NS dimensionless tidal deformabilities at M = 1.4 M (panel (a)) and M = 2.0 M (panel (b)).
Universe 07 00373 g010
Figure 11. Probability density distributions of central proton fractions of NS at M = 1.4 M and M = 2.0 M . The arrow in each panel indicates the most probable value of x D U . Panel (a): x D U m p 0.134 . Panel (b): x D U m p 0.138 . At each value of mass, value of x D U m p are very similar in four distributions. See text for details.
Universe 07 00373 g011
Figure 12. Pearson correlation coefficients matrix among bulk and surface empirical parameters in the case all filters are applied.
Universe 07 00373 g012
Figure 13. Pearson correlation coefficients matrix among some observables in the case all filters are applied.
Universe 07 00373 g013
Figure 14. Pearson correlation coefficients between some observables with the empirical and surface parameters in the case all filters are applied.
Universe 07 00373 g014
Table 1. Medians and 68 % confidence limits of EoS empirical parameters of order N < 4 in the four distributions.
E sat n sat K sat Q sat E sym L sym K sym Q sym
[MeV][fm 3 ][MeV][MeV][MeV][MeV][MeV][MeV]
Prior 16.25 0.46 + 0.61 0.159 0.006 + 0.008 231 28 + 27 44 650 + 693 32.6 3.9 + 3.5 42 22 + 24 62 210 + 181 132 1290 + 1394
LD 15.90 0.50 + 0.51 0.163 0.008 + 0.005 239 30 + 22 264 356 + 383 31.2 1.3 + 1.3 43 9 + 11 175 131 + 136 406 1116 + 1026
HD+LVC 16.20 0.47 + 0.60 0.161 0.008 + 0.006 231 27 + 27 321 596 + 467 31.4 3.6 + 4.0 48 19 + 18 2 113 + 121 502 1054 + 891
All 15.86 0.50 + 0.49 0.163 0.007 + 0.006 249 23 + 15 41 267 + 310 30.9 1.3 + 1.3 47 9 + 9 74 65 + 78 1207 539 + 491
Table 2. Estimations of NS crustal properties in four distributions. The results are presented with medians and 68 % confidence limits.
n CC P CC R crust 1.4 R crust 2.0
[fm 3 ][MeV fm 3 ][km][km]
Prior 0.087 0.037 + 0.033 0.163 0.095 + 0.281 1.13 0.29 + 0.25 0.706 0.191 + 0.165
LD 0.078 0.011 + 0.011 0.385 0.097 + 0.104 1.11 0.14 + 0.10 0.693 0.079 + 0.070
HD+LVC 0.079 0.033 + 0.023 0.141 0.076 + 0.202 1.05 0.20 + 0.20 0.627 0.128 + 0.126
All 0.084 0.010 + 0.009 0.423 0.090 + 0.093 1.15 0.08 + 0.10 0.687 0.067 + 0.067
Table 3. Medians and 68 % confidence intervals of NS radii, dimensionless tidal deformabilities, and central proton fractions at M = 1.4 M and M = 2.0 M .
R 1.4 R 2.0 Λ 1.4 Λ 2.0 x p 1.4 x p 2.0
[km][km]
Prior 12.85 0.69 + 0.52 13.26 0.52 + 0.45 601 182 + 171 78 22 + 23 0.115 0.052 + 0.047 0.166 0.070 + 0.073
LD 12.61 0.64 + 0.45 13.03 0.49 + 0.39 541 162 + 151 70 19 + 19 0.117 0.052 + 0.041 0.187 0.067 + 0.072
HD+LVC 12.89 0.40 + 0.38 13.07 0.44 + 0.42 626 107 + 114 71 17 + 20 0.113 0.039 + 0.038 0.154 0.074 + 0.079
All 12.78 0.29 + 0.30 12.96 0.37 + 0.38 598 85 + 105 66 14 + 18 0.117 0.030 + 0.027 0.181 0.065 + 0.070
Publisher’s Note: MDPI stays neutral with regard to jurisdictional claims in published maps and institutional affiliations.

