Article

Investigation of Infrasound Background Noise at Mátra Gravitational and Geophysical Laboratory (MGGL)

1
Institute for Particle and Nuclear Physics, Wigner Research Centre for Physics, Konkoly Thege Miklós út 29-33, 1121 Budapest, Hungary
2
Institute for Nuclear Research (Atomki), Bem tér 18/c, 4026 Debrecen, Hungary
*
Author to whom correspondence should be addressed.
Universe 2020, 6(1), 10; https://doi.org/10.3390/universe6010010
Submission received: 19 September 2019 / Revised: 22 December 2019 / Accepted: 27 December 2019 / Published: 3 January 2020
(This article belongs to the Special Issue Black Hole Physics and Astrophysics)

Abstract

:
Infrasound and seismic waves are supposed to be the main contributors to the gravity-gradient noise (Newtonian noise) of the third-generation subterranean gravitational wave detectors. This noise will limit the sensitivity of the instrument at frequencies below 20 Hz. Investigation of its origin and the possible methods of mitigation have top priority during the designing period of the detectors. Therefore, long-term site characterizing measurements are needed at several subterranean sites. However, at some sites, mining activities can occur. These activities can cause sudden changes (transients) in the measured signal, and increase the continuous background noise, too. We have developed an algorithm based on discrete Haar transform to find these transients in the infrasound signal. We found that eliminating the transients decreases the variation of the noise spectra, and therefore results a more accurate characterization of the continuous background noise. We carried out experiments for controlling the continuous noise. Machines operating at the mine were turned on and off systematically in order to see their effect on the noise spectra. These experiments showed that the main contributor of the continuous noise is the ventilation system of the mine. We also estimated the contribution of infrasound Newtonian noise at MGGL to the strain noise of a subterranean GW detector similar to Einstein Telescope.

1. Introduction

In September 2015, the two aLIGO interferometers detected gravitational waves (GWs) for the first time in history [1]. The GW150914 observation was the first direct experimental proof of the existence of GWs that were predicted by Albert Einstein on the basis of his general relativity theory. The GW was generated by a black hole–black hole merger. Since then, the LSC-Virgo collaboration published observations of GW signals from several more similar events [2,3,4,5]. The first observation of the GWs from merger of two neutron stars was on 17 August 2017 [6]. For the first time, the electromagnetic counterpart of the GW signal was detected, too [7,8,9,10].
Before the detection of gravitational waves, electromagnetic radiation, cosmic ray, and neutrinos were the only messengers of cosmic phenomena. Beyond that GWs may give us new information of these phenomena, previously unobservable cosmic events may become observable by detecting the GWs accompanying them [11,12].
In the ideal case, the relative distance of the test masses of a GW-detector would only be changed by the GWs that pass through the interferometer.
However, the relative distance of the test masses of the detectors is affected by the local environment, too. When extending the sensitivities to lower frequencies down to 1 Hz, seismic and gravity gradient noise are limiting. Gravitational gradient noise (Newtonian noise) is generated by changes of the density of matter near the detector. These density changes modify the local gravitational field around the detector and the resulting forces move the test masses [13,14].
Sensitivity of a GW detector is expressed in the units of strain, defined as the differential arm length normalized by the arm length of the interferometer [15]. To estimate the Newtonian noise of different sources, a transfer function model that converts a measured quantity characterizing the given source to strain of the interferometer is required. A model that considers infrasound spectra measured on the Earth’s surface and specifies transfer functions for a subterranean detector at different depths below the surface is presented in [16].
Passive Newtonian noise (NN) mitigation is accomplished by choosing an installation site with low seismic and acoustic noise level. One way is to install a detector under the ground, where the changes of the density of the matter around the instrument could be attenuated to a greater extent than on the Earth’s surface.
Further mitigation could be achieved by active noise mitigation, when coherent cancellation of seismic (or acoustic) NN is applied [14]. The method aims to subtract seismic (or acoustic) noise from a GW-detector’s data by using a Wiener-filter calculated from the measurement data of several properly chosen seismometers (microphones) placed around the detector’s test mass.
In the case of NN of seismic origin, the method was tested and the investigations ended with promising results [17,18,19]. The coherent cancellation of NN originated of infrasound is considerably different from the seismic case. Several theoretical and experimental problems have to be solved in order to successfully implement the method [14].
To this day, the Japanese Kamioka Gravitational Wave Detector (KAGRA) is the only completed subterranean detector. Starting of its first observation run is scheduled for the end of 2019. KAGRA will join to the GW detector network which currently consist of adVirgo and the two aLIGO detectors, facilitating more precise determination of the parameters and location of the sources of observed GWs [20].
In Europe, a design study project of a subterranean GW-detector has been proposed by eight European leading gravitational wave experimental research institutes [21] in 2011. Along with investigating the technical details of the instrument, site characterization experiments begun, too [22]. The goals of these experiments are (a) better understanding of the technical challenges that emerge during the process of building a detector under the ground and (b) better understanding of the nature and origin of the underground environmental noises and, therefore, the underground NN. The main aim of these experiments is selection of candidate sites for future GW-detectors.
One of the site characterization experiments is performed at the Mátra Gravitational and Geophysical Laboratory (MGGL) [23] that was established near Gyöngyösoroszi in Hungary in 2015. The laboratory is located in a cavern system of an unused ore mine 88 m below the surface. Specialized instruments have been installed in the laboratory for measuring the seismic and infrasound background and the electromagnetic noise. A long-time infrasound measurement program has been carried out to characterize the background noise in the laboratory.
Infrasound in the 0.01 to 10 Hz frequency range was monitored using a measuring system developed by Atomki [24]. The results of the measurements were compared with the Bowman median noise model [25] that is generally used for characterization of the ambient atmospheric infrasound noise. For enabling the comparison we have developed a new signal processing pipeline, too.
In the mine where the MGGL laboratory was built, recultivation occurs in three shifts per day. This activity causes sudden changes in the pressure of the air and transients in the measured infrasound signal, too. As we aimed characterization of the infrasound background noise with eliminating noise of local anthropogenic origin as much as possible, our data processing pipeline includes a step where the software finds the transients in the signal. Then, the data segments that contain the transients can be left out from further analysis.
Finding transients in the signal of a GW-detector and also in the signal of its auxiliary channels was an essential task from the beginning of the detectors’ operation. Auxiliary channels are monitoring the instrumentation and the environment, too. They are needed to identify noise sources that can cause transients in the interferometers’ signal, and to separate GW transients from noise transients. Current algorithms used for this purpose are Bayeswave [26] and Omicron [27]. Our method to find transients is built on elements of a formerly used algorithm presented in [28].
In underground laboratories, the air has to be ventilated and the ventilation system and other machinery can contribute to the infrasound background noise. To examine this, a controlled noise generating experiment was performed by us when turning off the ventilation system and a water pump for a short time was permitted by the operators of the mine.
The aims of this paper are (a) the presentation of the details of the software of the signal processing pipeline and (b) to simulate results of the infrasound measurements obtained in MGGL in December 2018 and in the controlled noise experiment.

2. Materials and Methods

2.1. Data Collecting

The infrasound detector of the measurement system is a new type of infrasound microphone (ISM1) developed by Atomki. The data acquisition (DAQ) system is based on a Raspberry Pi3 Model B single-board computer that runs Raspbian operating system. The analog signal of the infrasound microphone was connected to an Adafruit ADS1115 16-bit ADC.
A real-time clock module was used to provide the timestamps with appropriate accuracy. The measured data were stored on a 32 Gb microSD card connected to the Raspberry computer. The collected data were sent to a remote server that was operated outside of the mine in a building on the surface and provided internet access to the measured data. The downloaded data were processed offline for further analysis.

2.2. Data Processing

2.2.1. Finding Transients

The data processing pipeline was implemented in Python. In the followings, the steps of the data processing are presented using the data that were recorded in the 09–23 January 2019 period at MGGL with the infrasound monitoring system described above.
In the first step the downloaded data were divided into chunks of data measured in consecutive two-hour long time periods. Then the software searches each individual chunks for the possible transients. Typical transients can be seen on Figure 1a.
We applied a modified method for detection of gravitational wave bursts described in [28]. The method is based on the dyadic wavelet decomposition, which decomposes a given signal into components (layers) that can be associated with different sub-bands of the signal. Starting with the original signal, this recursive method halves the frequency band of the given layer in each step, and therefore gives us information about changes in different sub-bands. Although it halves the frequency resolution Δ f n , it doubles the time-resolution of the layers Δ t n . Each wavelet coefficient has the same volume Δ f n Δ t n = 1 2 ; therefore, localization of a given event in the original signal is only possible with uncertainty. The more accurate the localization in time, the less accurate in frequency.
For simpler and faster computation, we choose the Haar transform for the dyadic wavelet decomposition [29]. Starting with the signal s i ( 0 ) (where i = 1 , 2 , , N ), in each step, the transformation gives the approximation coefficients:
s i ( n + 1 ) = 1 2 s 2 i 1 ( n ) + s 2 i ( n ) ,
and the detail coefficients:
d i ( n + 1 ) = 1 2 s 2 i 1 ( n ) s 2 i ( n ) ,
are obtained. The approximation coefficients show the trend, while the detail coefficients show the fluctuations of the signal in different sub-bands of the signal.
We divided the measured infrasound signal into chunks of length of two hours, and took the first 2 20 samples for further analysis beginning with the Haar transform. The sampling frequency of our instrument was 155.5 Hz. Table 1 shows the frequency bands associated with each layer and the corresponding number of detail coefficients of the given layer. Note that the first four layers correspond to frequency bands that are outside of our microphones measuring range, these bands contain only instrumental noise.
In one or more sub-bands the detail coefficients corresponding to transients in the original signal occur as outliers in the detail-coefficient vectors, if the transients are relatively rare events. Because of this, an outlier detection process had to be performed on each detail-coefficient vector individually.
First, the measure of the spread of the components of a given detail-coefficient vector must be specified. The suitable measure can be influenced by outliers only in a small extent, and therefore it can be used as a reference that expresses the spread of the values without the outliers. Therefore, the variance and the standard deviation are not suitable measures. They express how close are the observed data values to the mean value, however, the mean value can be influenced greatly by only a small number of outliers. Considering this the median absolute deviation (MAD) was chosen as a measure of the spread [30].
Let us denote the median of the values of the k-th detail-coefficient vector with m ( k ) . Then the MAD of the n-th detail-coefficient vector is:
M A D ( k ) = m e d i a n ( | d i ( k ) m ( k ) | ) .
If the distribution of the coefficients would be a univariate normal one, the standard deviation would be σ ( k ) = 1.4826 · M A D ( k ) . The distribution of d i ( k ) values of a signal chunk without transients was expected to have a normal distribution approximately. d i ( k ) was considered as an outlier if | d i ( k ) | > 5 · 1.4826 · M A D ( k ) .
To get more information of the transients, a clustering method was applied on the previously found outlier detail coefficients. We only considered layers 5–13 as the frequency interval associated with these layers laps over the measuring range of the infrasound monitoring system.
Detail coefficients were clustered together if the time interval associated with them overlapped, or were inside a coincidence interval corresponds to the time resolution of the 13th layer. This interval length was chosen empirically, suited to the transients in our data. Clusters represent the transient events, and are stored for further analysis (see Results section). Figure 1b illustrates the results of the clustering method.

2.2.2. Computing Representative Spectra

The next part of the data processing started with dividing a data chunk into 128 s long data segments. Then the software checked whether a given segment included a transient found during the previous steps. If the segment included (at least a part of) a transient, it was labeled as “noisy”, else it was labeled as “silent”.
The next steps are intended to get the so-called representative pressure amplitude spectral density (PASD) of the infrasound data collected. PASD of data including “noisy” segments was compared to PASD of data that included only “silent” segments in order to see the effect of the transients of anthropogenic origin on the representative PASD. Note that we aimed characterization of the infrasound background noise with eliminating noise of local anthropogenic origin as much as possible.
First the mean of each signal segment was subtracted from each value of the segment, then the signal was de-trended. After that a Nuttall-window was applied on the signal: s ˜ n = w n · ( s n s ) . Next, the windowed signal was transformed by fast Fourier transform (FFT): S k , where k is the Fourier number related to the frequency f = k f s a m p N . Then one-sided power spectral density(PSD) was computed:
P S D k ( s ) = 2 f s a m p · N · W · | S k | ,
where W = 1 N n N w n 2 is a normalization factor that account for the power lost due to the windowing. PSD expresses the power of the signal at a given frequency.
Pressure amplitude spectral density(PASD) is the square root of the PSD:
P A S D k ( s ) = P S D k ( s ) .
By choosing PASD, the infrasound noise level can be expressed with the unit of pressure (Pa) per H z . To characterize infrasound background noise of the site, we collected all segments of the measurement period 09–23 January 2019, and for each k, the median and the 10th and 90th percentile of all segment’s P A S D k ( s ) values were computed. The 10th (90th) percentile shows the value below which 10 % ( 90 % ) of the observations may be found, and therefore is suitable to inform us about the variations in the PASD.

3. Results of Investigating Infrasound Background Noise at MGGL

3.1. Statistical Analysis of Transients in the Haar Wavelet Domain

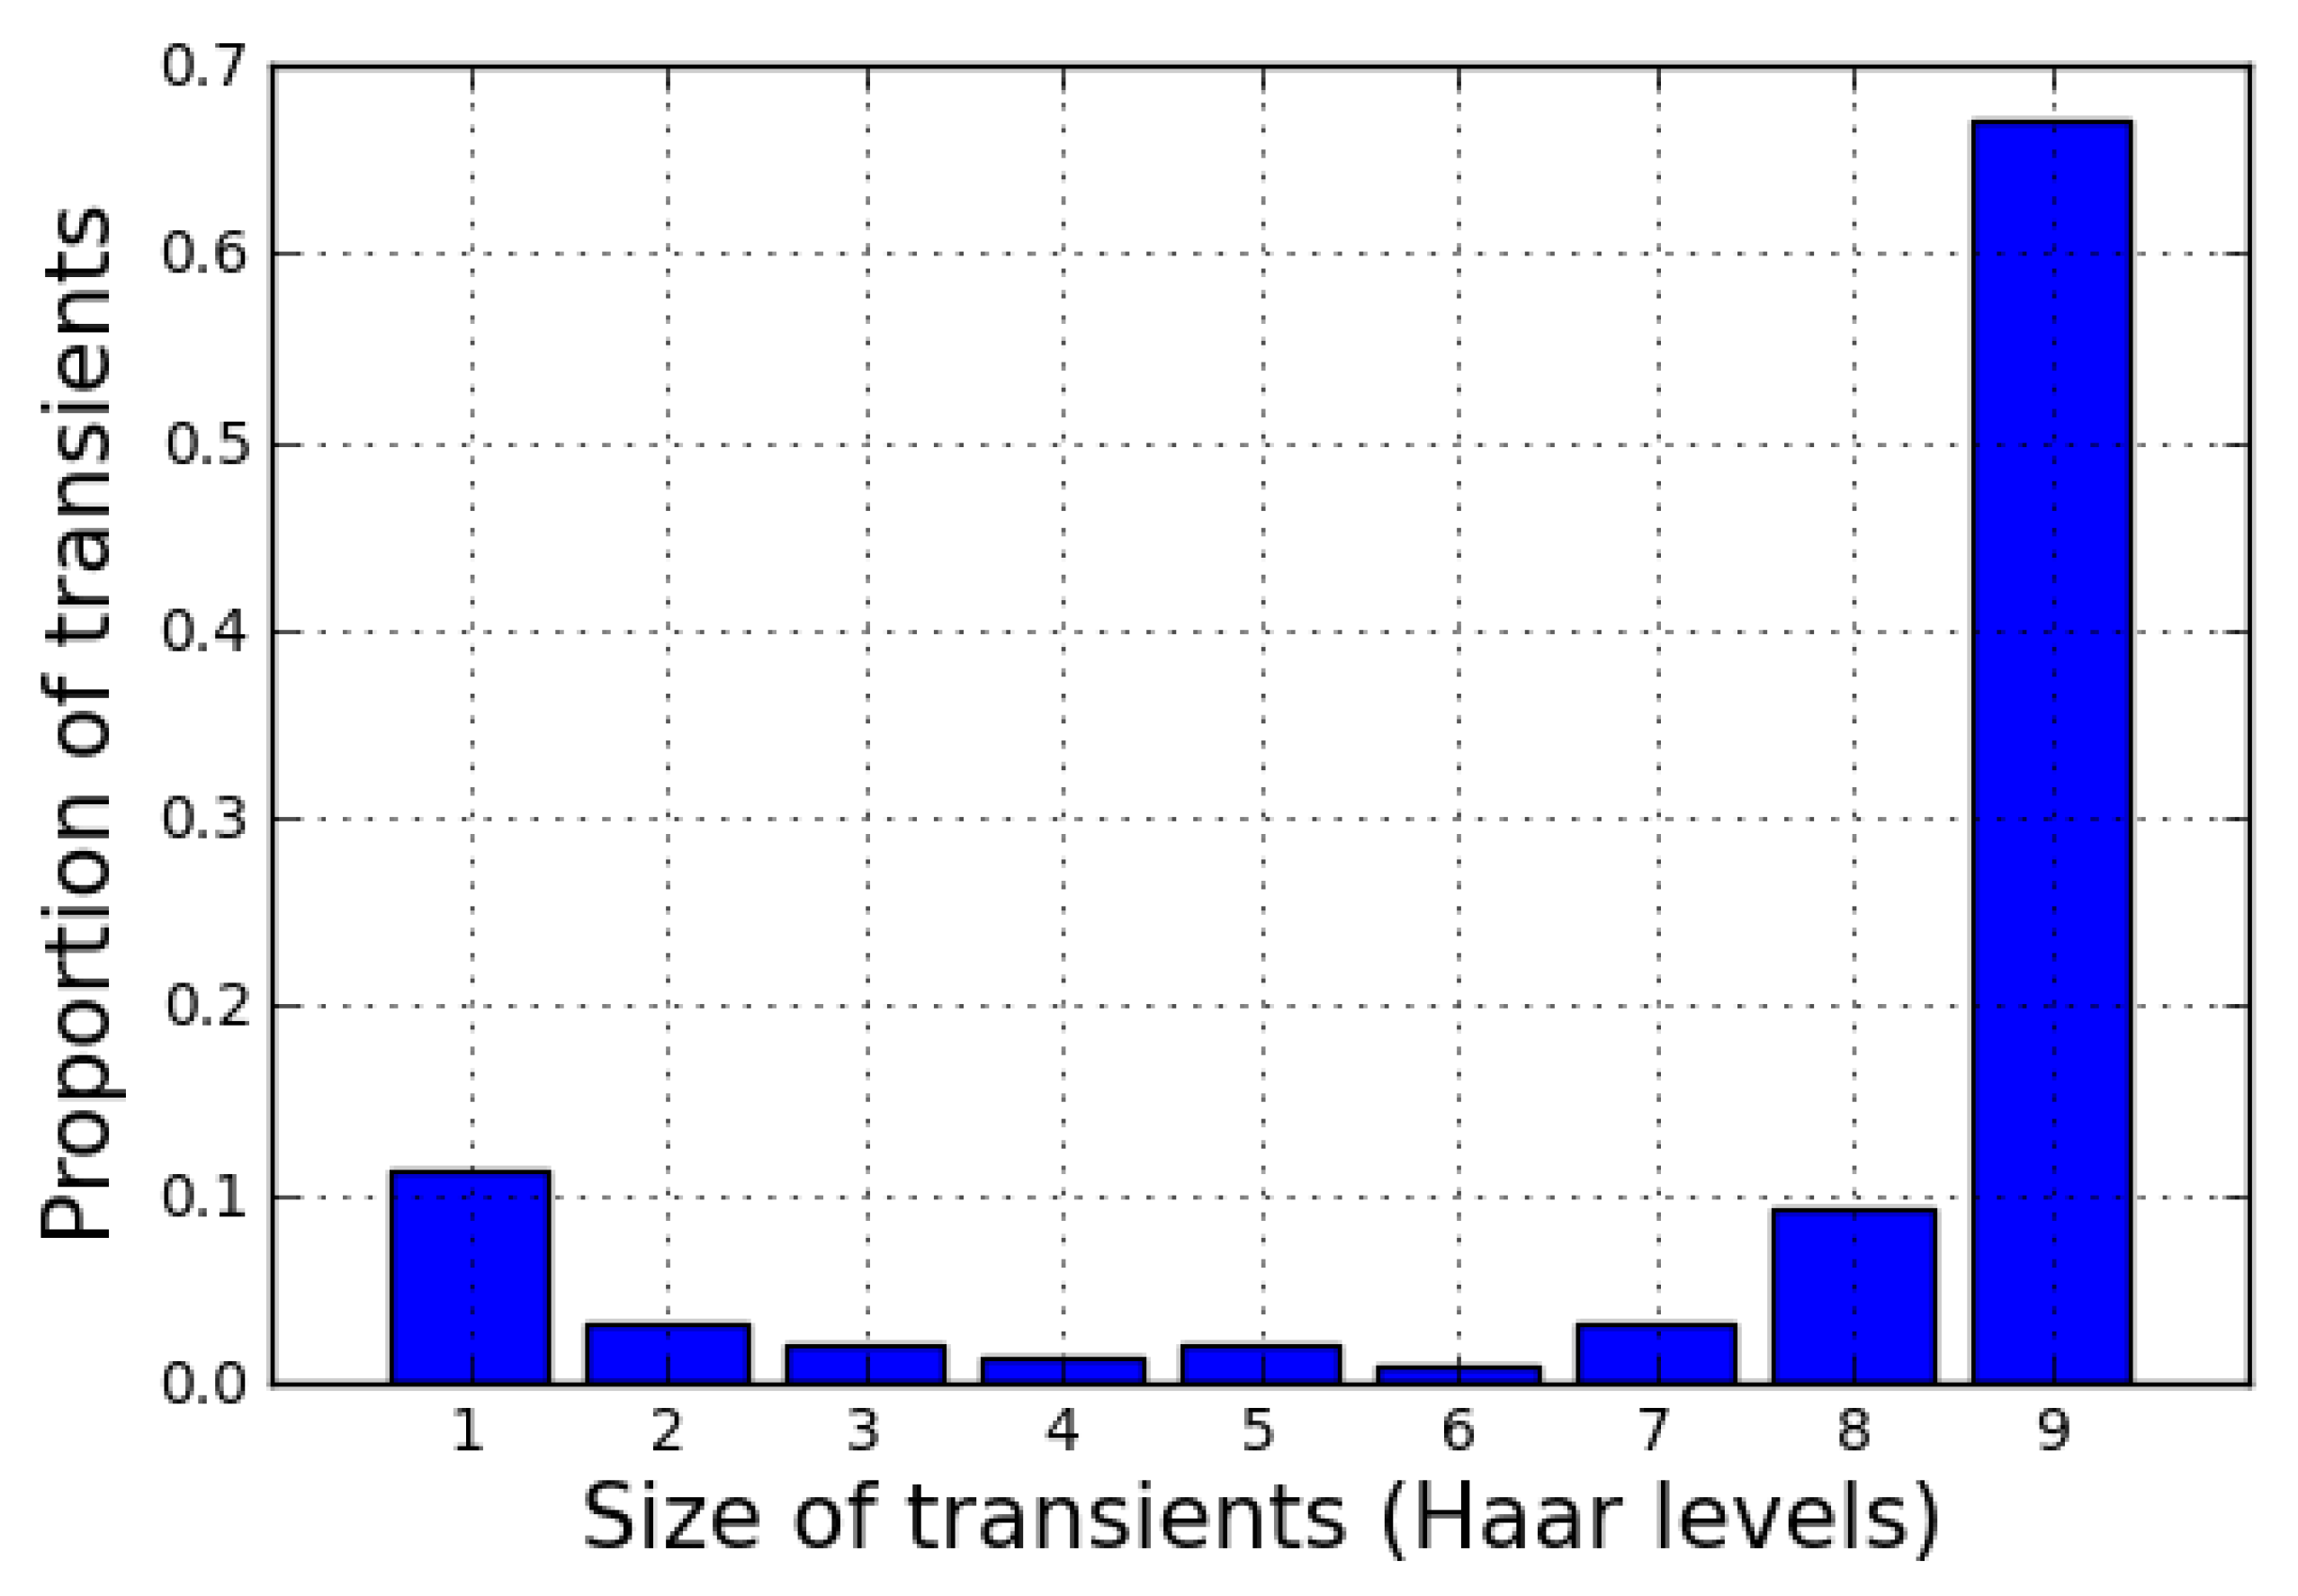
We examined the relative frequency of transients by their bandwidth in terms of Haar layers. Figure 2 shows that the typical transients has a bandwidth of 9 layers. Note that it can be even larger in the raw signal, because we considered only layers 5–13, as that interval laps over with the measuring range of the infrasound microphone.
During the data collecting period, the transients were less frequent in the night hours (see Figure 3). The trend in the number of transients followed the activity of the miners, who worked in three shifts, but with different intensity in each shift. Work that demanded more people and machines was done during daytime. At night, the essential maintenance and some urgent tasks was done typically.
It was not possible to log each activity of the miners with a precise timestamp, so the exact origin of the transients remained unknown, but the pattern that their occurrence follow on Figure 3 and the high amplitude of the typical transients (Figure 2) suggest that they are related to the activity of the miners. As we intended to analyze the natural infrasound background with anthropogenic contribution only from outside of the mine (if that would be present), data segments that were corrupted by transients were excluded from the process of determining the representative infrasound spectrum.

3.2. Effect of Removing Data Segments Corrupted by Transients on the Representative Pressure Amplitude Spectral Density (PASD)

During characterization of a potential site of a planned GW-detector like ET, the investigation of the environmental background noises (seismic, electromagnetic, acoustic, etc.) is a fundamental step. However, there can be cases when the anthropogenic activities at the site can be suspended only for short time periods for enabling “silent” periods for noise background measurements. This can be the case for example at mines near to potential candidate sites for future subterranean GW-detectors [31].
In the case of MGGL, some systems of the mine’s infrastructure (ventilation system, water pumps, etc.) generate continuous background noise that is always present. Furthermore, other activities (e.g., opening and closing sluices) occasionally can cause sudden changes in the air pressure and therefore transients in the measured infrasound signal.
Figure 4 shows results of the infrasound background measurements performed at MGGL in the 09–23 January 2019 period when there was recultivation activity at the site of the mine. The red dashed line, the red solid line and the red dashed-dotted line indicate the 90th percentile, the median and the 10th percentile of the measured PASD before the filtering procedure, respectively. The blue lines indicate the 90th percentile, the median and the 10th percentile of the PASD, that was obtained after carrying out the filtering procedure described above in the Materials and Methods section. It can be seen that the curves are very similar, except below 0.2 Hz where the 90th-percentile curves deviate strongly.
To get a better understanding of these results, we investigated the proportion of outlier detail coefficients at each layer of the previous Haar transform. Table 2 shows that as the layer number increases, the proportion of outliers increases, too. One could expect that outliers increase the 90th percentile PASD curve only at those frequency bands, where their proportion is 10% at least. In Table 2 we can see that this is the frequency band 0.0379–0.0759 Hz which is corresponding to layer 12. This is approximately the frequency band on Figure 4, where the red dashed line (90th percentile PASD with transients) exceeds the blue dashed line (90th percentile PASD without transients). As it was previously shown, the outlier Haar detail coefficients are typically originated from transient events (of large bandwidth) that can be related to the miners’ activity. Eliminating them can result a better estimation of the continuous infrasound background noise at MGGL.

3.3. Investigation of the Sources of the Continuous Background Infrasound Noise at MGGL and Comparison with the Bowman Models

On 28 December 2018 a controlled experiment was carried out, too, for studying the effects of noise sources on the infrasound noise background of MGGL. Miners suspended the recultivation work on that day. As the first step of the experiment a water pump near the laboratory was turned off. Then, a door that separates the corridor of MGGL and a vertical shaft (that is opened to the surface) was opened. In the third step, the ventilation system was turned off, too. During the experiment the infrasound noise background was monitored. Figure 5 shows, for comparison, the median curve of the PASD (dark blue line) that was obtained from the data recorded in the measurement course in the 09–23 January 2019 period. The PASD curve is considered as the reference for the normal working days at the mine. Also, Figure 5 shows the mean curves of the PASDs obtained for the three steps of the experiment.
As the light blue curve in Figure 5 shows, the turning off of the water pump barely affected the infrasound noise background. After opening the door the noise level increased significantly in the f = 0.4 Hz–0.7 Hz and the f = 1 Hz–2 Hz frequency ranges (see the purple curve in Figure 5). The main reason for the changes was the strong air flow in the vertical shaft. The air flow vibrates the walls of the shaft, too, and the vibration waves can propagate to the walls of the MGGL contributing to the noise level in the laboratory even when the door is closed. The orange curve on Figure 5 clearly shows that the noise level decreased very significantly practically in the whole f = 0.05–10 Hz frequency range after turning off the ventilation system. This means that the main source of the continuous noise that is observable in MGGL is the ventilation system.
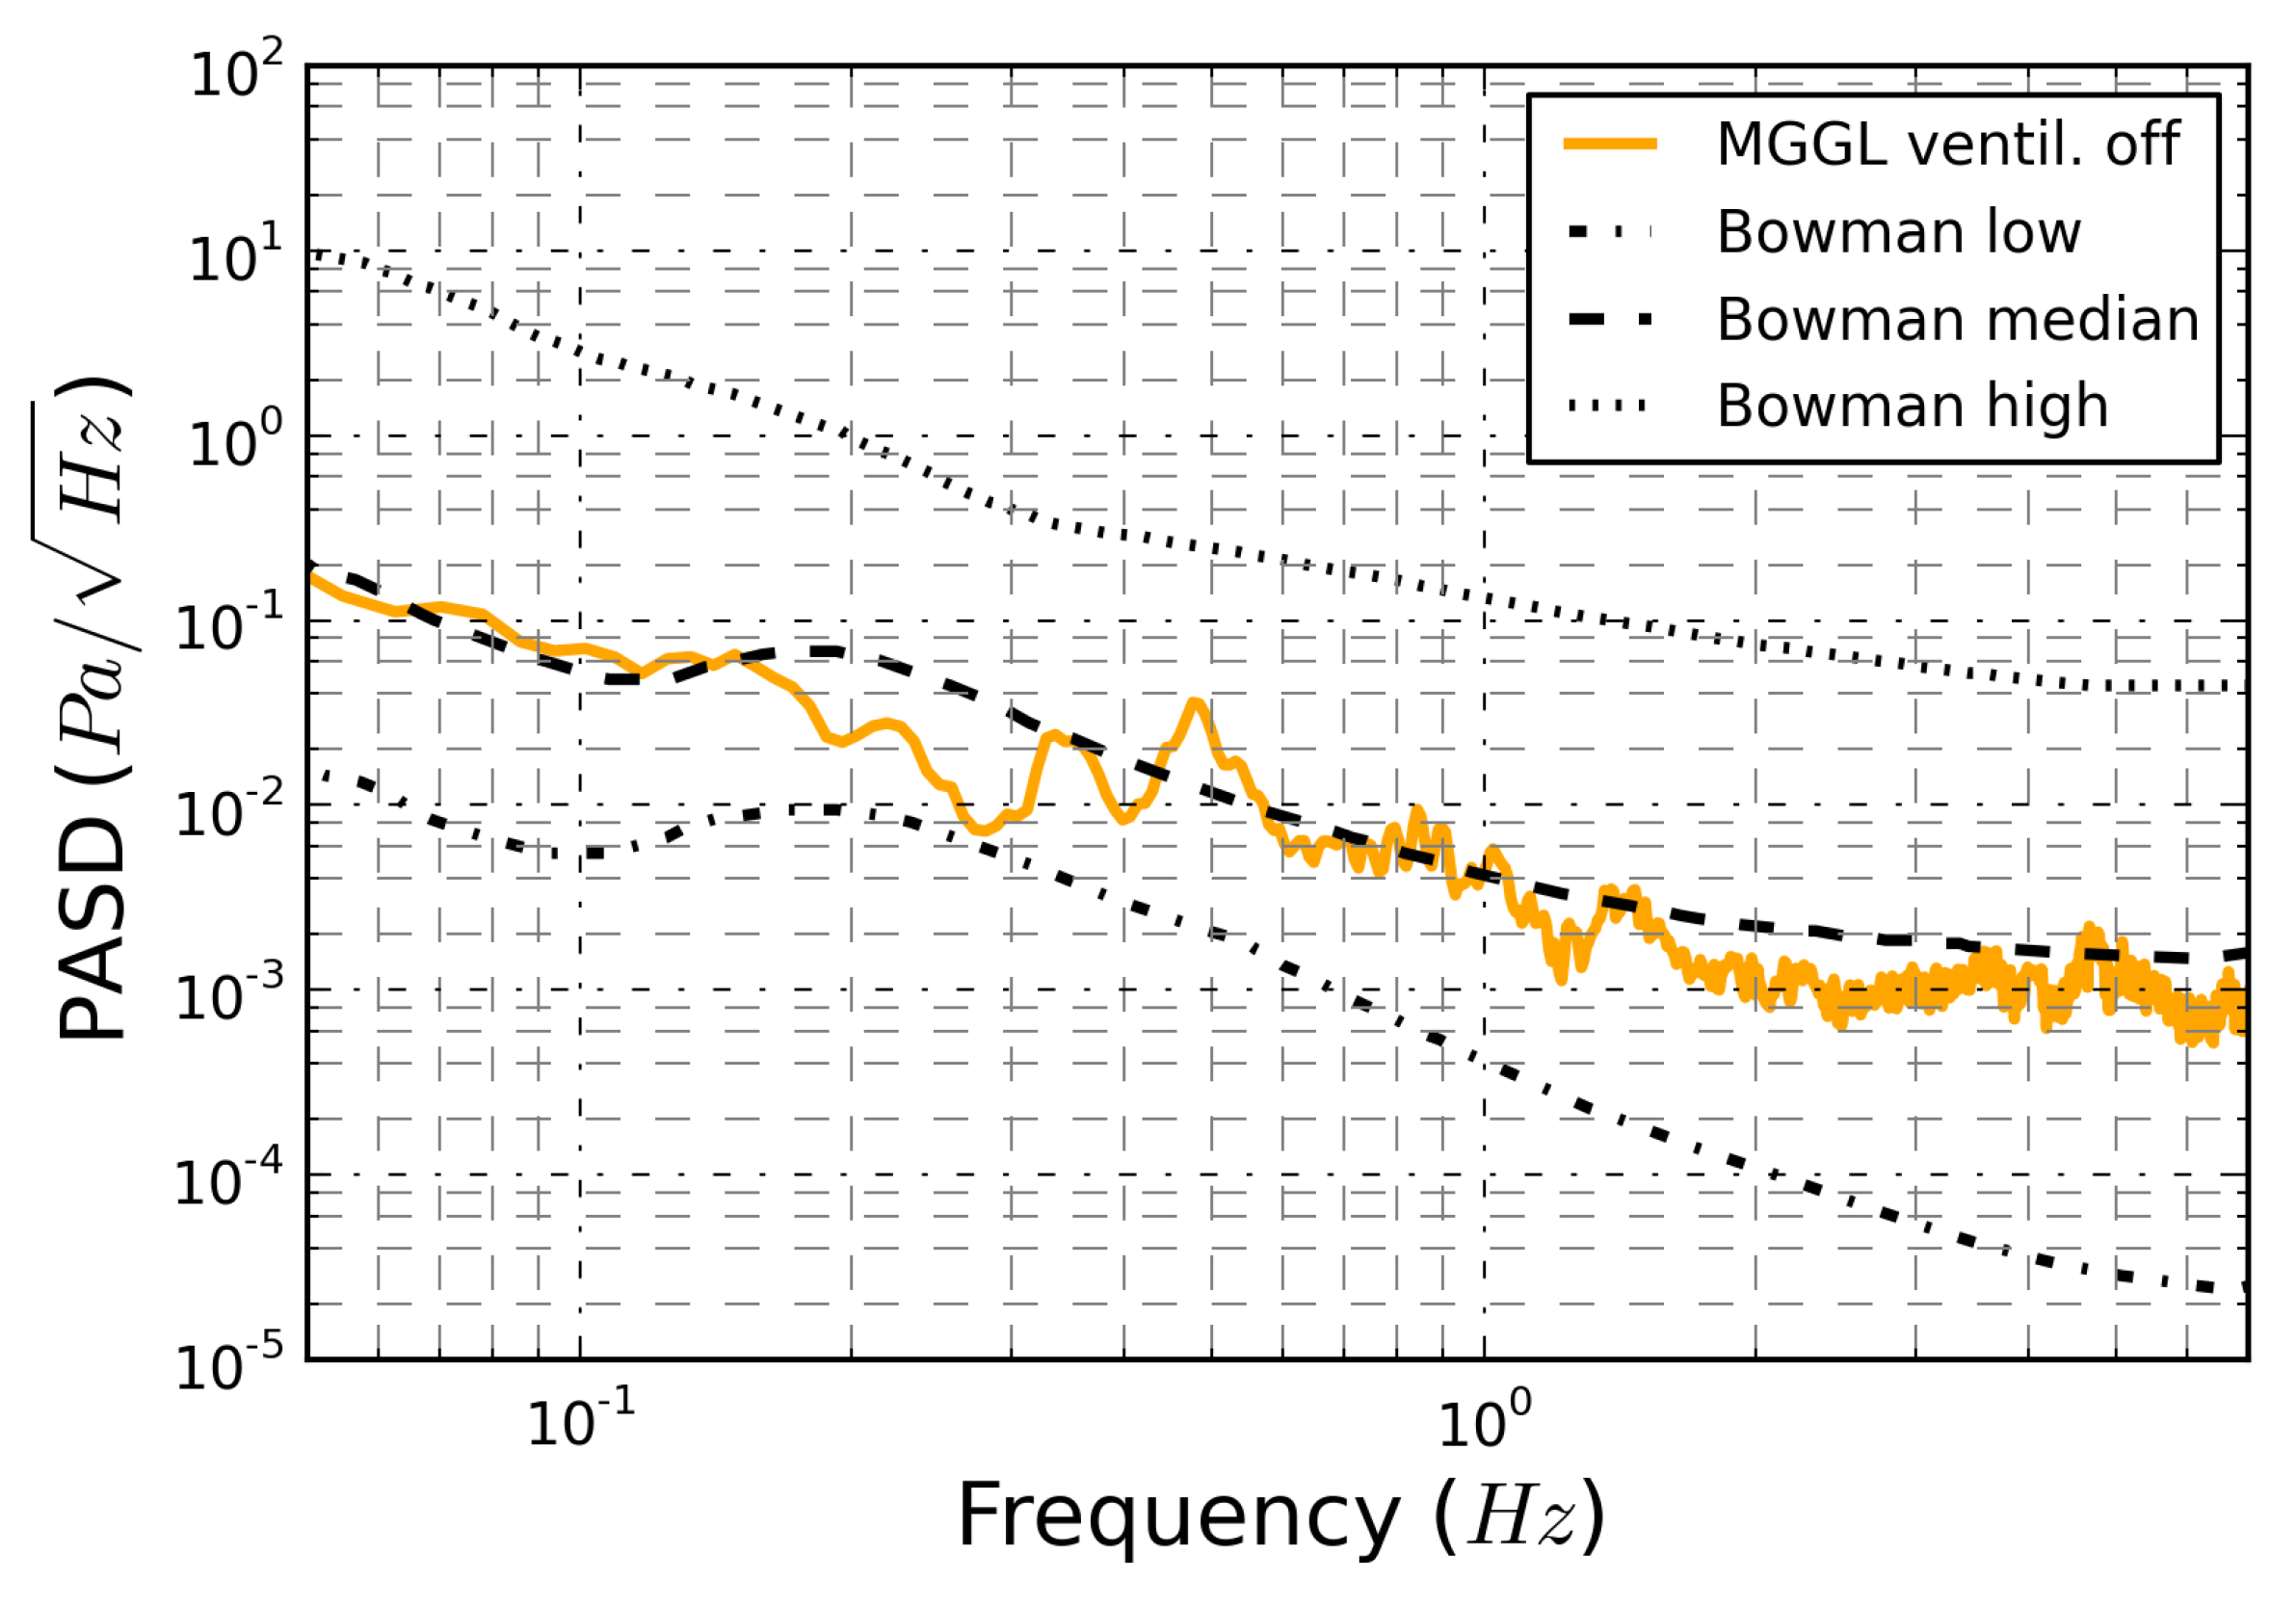
Figure 6 shows the frequency dependency of the median of the PASD (orange solid line) that was obtained from our measurements performed in MGGL when the ventilation system was turned off. Also, Figure 6 shows the three curves (low noise model, median, high noise model) that were obtained from the models developed and published by Bowman et al. in [25] for characterization of the global ambient infrasound noise background on Earth’s surface. Bowman et al. [25] derived their three models from the data measured at many infrasound measurements stations around the world.
One can see that the trend of median of the PASD at MGGL is similar to the trend of the median of the Bowman model, except from structural differences, most notably in the 0.05 to 0.25 Hz range. The structure of the median PASD curve of MGGL may be resulted by the geometry of the tunnels in the mine. The geometry of the laboratory allows resonances of frequencies higher than the infrasound frequency range.

4. Estimating the Contribution of Infrasound Newtonian Noise to the Strain Noise of a Subterranean Gravitational Wave Detector

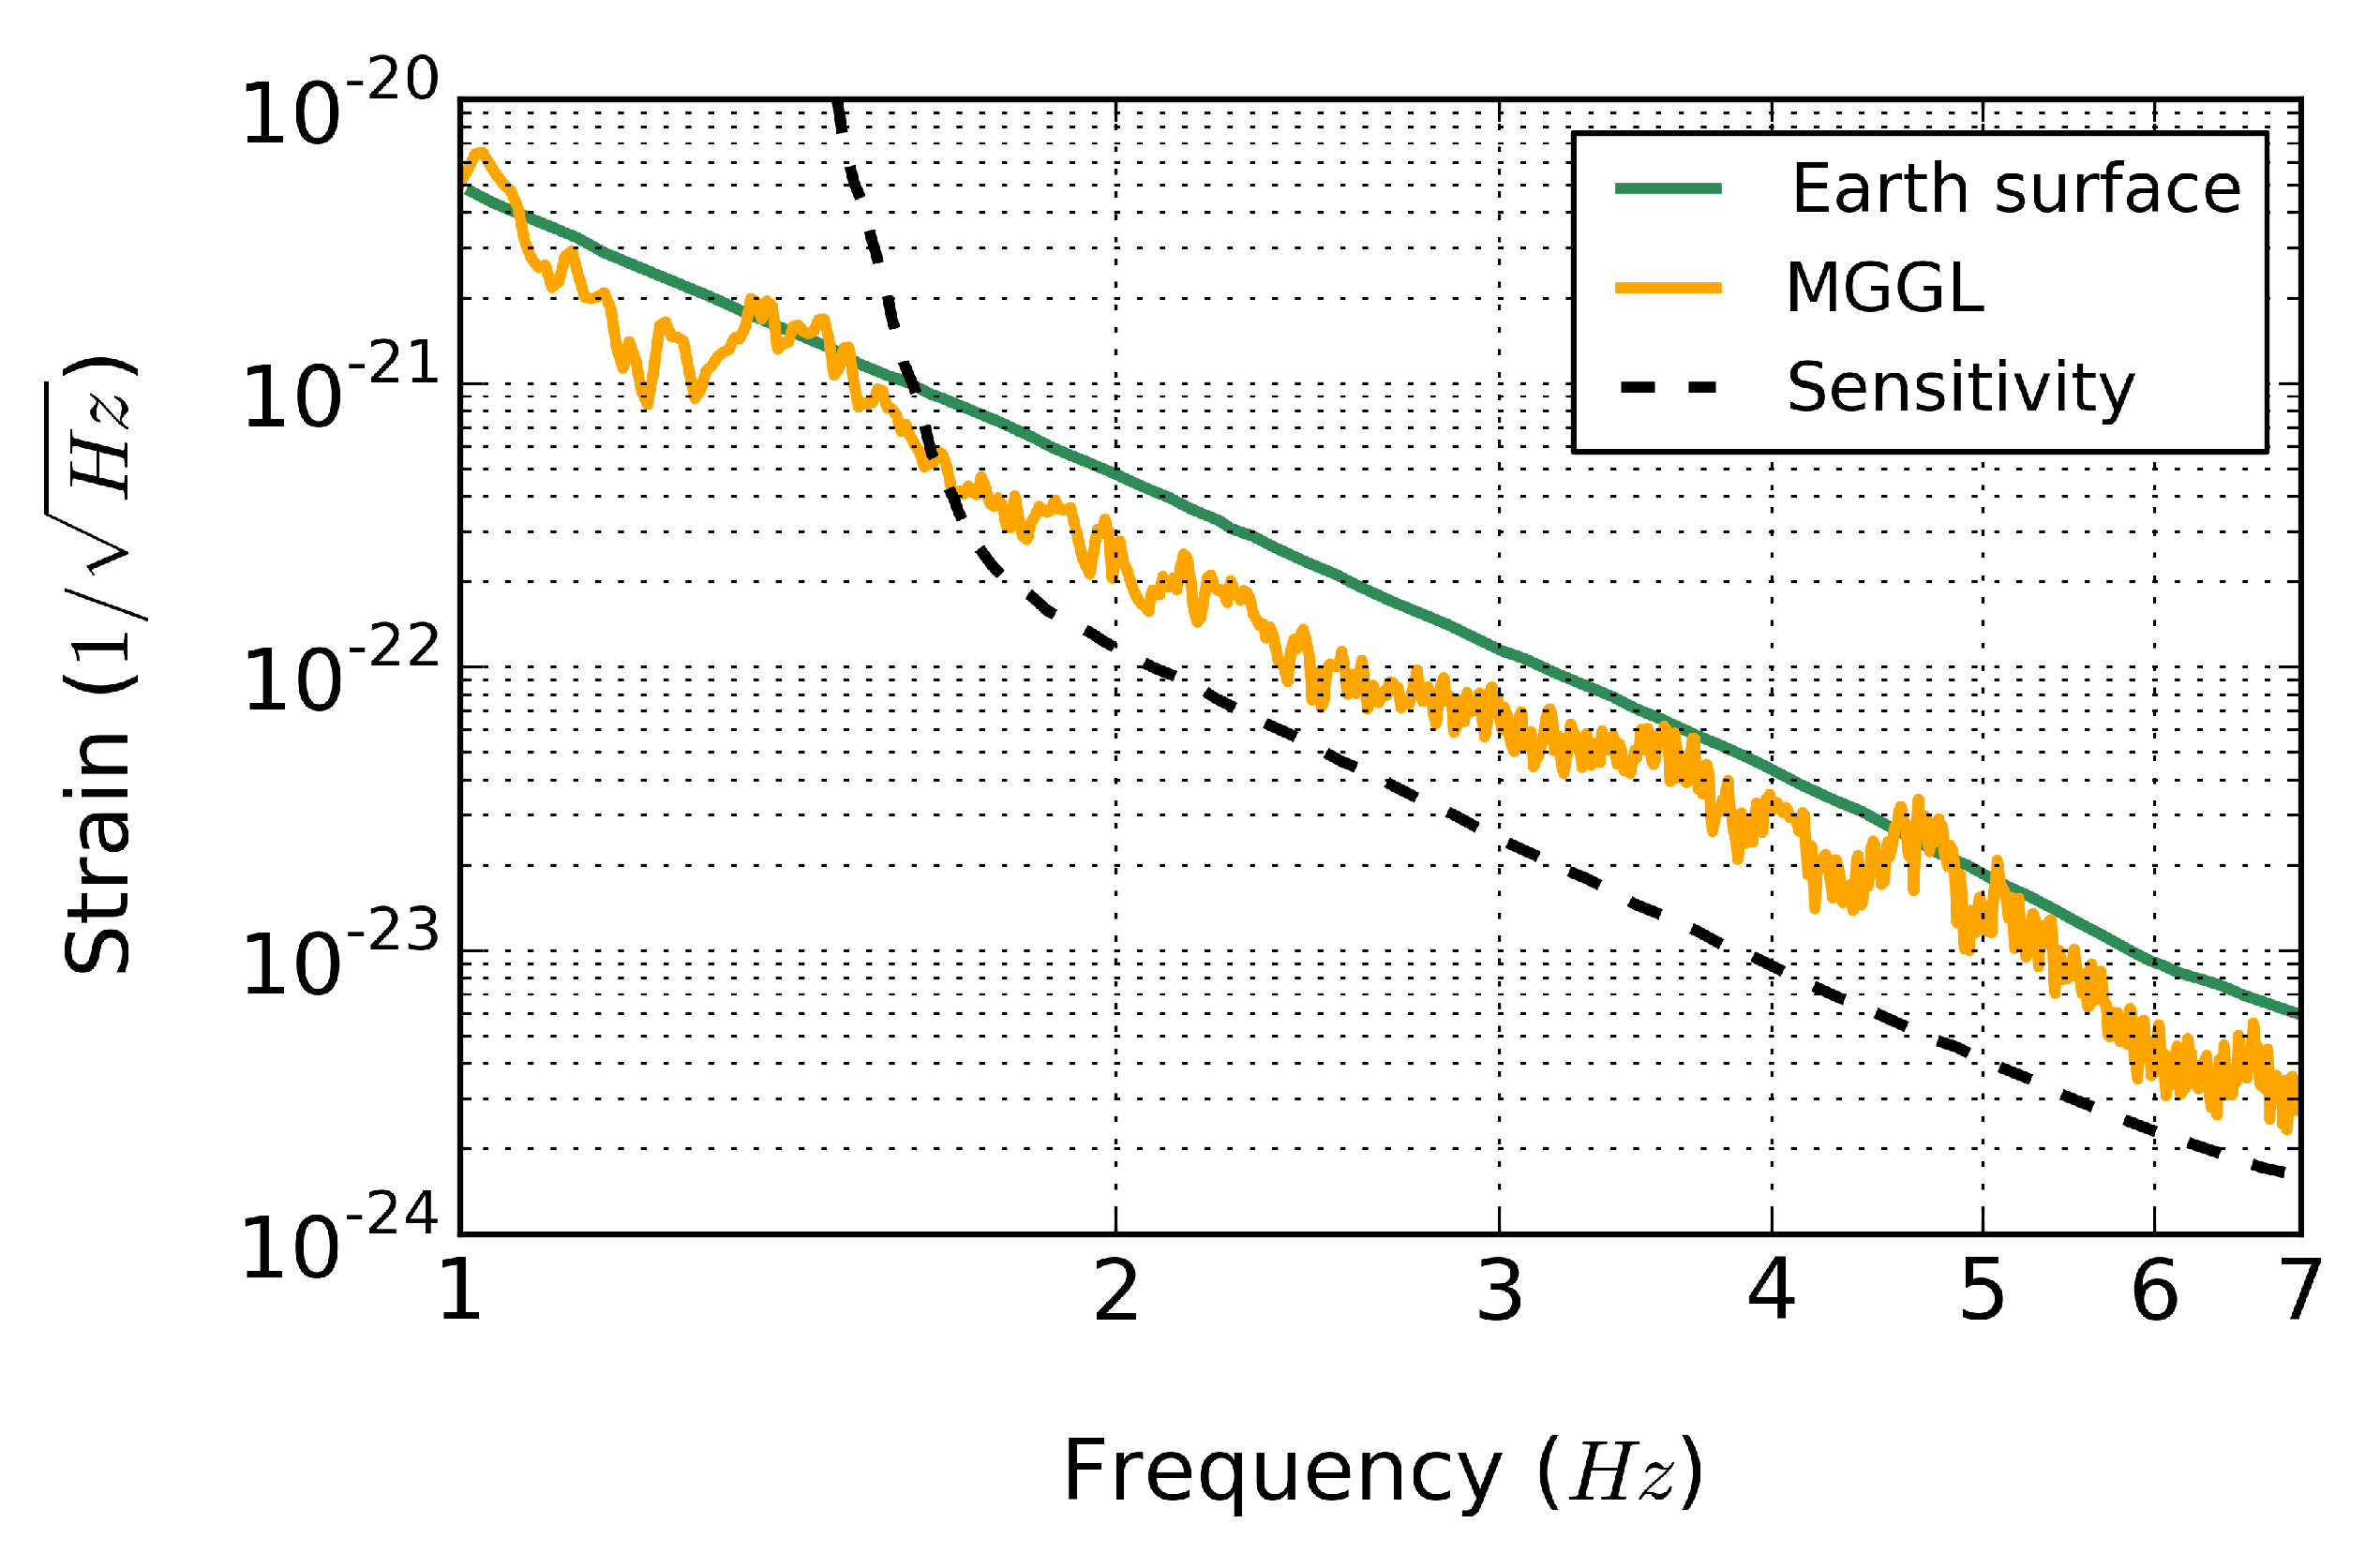
To estimate the Newtonian noise originated of infrasound measured at MGGL, we applied the model presented in [16]. This model considers infrasound spectra measured on the Earth’s surface and specifies transfer functions for a GW detector similar to ET at different depths below the surface. The effect introduced by the building housing the detectors can be considered, too.
We applied the transfer function corresponding to the surface, without considering the specified building effects. This is a conservative choice to estimate the contribution of infrasound to the NN of a subterranean GW detector. However, it can be justified with the fact that the tunnel next to our laboratory at the mine is connected to the surface through a vertical pit (a wooden door is the only separation), so we can not state that the model’s assumption for the extent of the infrasound noise damping at 88 m depth is fulfilled at MGGL. Moreover, the geometrical properties of the tunnels near MGGL are significantly different from the model’s specified cavity shape.
However, our results in Figure 7 suggest that the NN of infrasound origin can be reduced significantly at subterranean sites, but to decrease it below to the sensitivity curve of an ET-like detector requires carefully designed housing and tunnel system with special attention to separate them appropriately from the surface.

5. Conclusions

A method and a data processing pipeline software have been developed for analyzing the infrasound data series measured to investigate the infrasound noise background at the Mátra Gravitational and Geophysical Laboratory (MGGL). The Haar transform was employed for identification of the infrasound noises from anthropogenic activities around the MGGL. An experiment has been carried out, too, when there was no anthropogenic activity in the MGGL and in the cavern system around it. The frequency spectra and other quantities obtained from the analysis of the measured data have been used for the site characterization of MGGL. Contribution of infrasound Newtonian noise to the strain noise of a subterranean GW detector was estimated as well. The possibilities of infrasound noise cancellation at subterranean sites, that could be a site for installing a third-generation GW-detector, like the Einstein Telescope were investigated, too.

Author Contributions

Conceptualization, E.F.; Data curation, E.F.; Formal analysis, E.F.; Funding acquisition, J.M.; Investigation, E.F., J.M. and S.C.; Methodology, E.F.; Resources, J.M. and S.C.; Software, E.F.; Supervision, J.M.; Writing—original draft, E.F.; Writing—review and editing, J.M. and S.C. All authors have read and agreed to the published version of the manuscript.

Funding

The work was supported by the grant National Research, Development and Innovation Office –NKFI 124366. The support of the European Regional Development Fund and Hungary in the frame of the project GINOP-2.2.1-15-2016-00012 is acknowledged.

Acknowledgments

The contribution and support of Nitrokemia Zrt. in particular Árpád Váradi and Vilmos Rofrits are acknowledged. We also thank Geofaber Zrt for the construction work of the laboratory. The authors thank Géza Huba, Péter Ván, Mátyás Vasúth, and László Somlai for their constant support, too.

Conflicts of Interest

The authors declare no conflict of interest.

References

  1. Abbott, B.P.; et al. [LIGO Scientific Collaboration and Virgo Collaboration]. Observation of Gravitational Waves from a Binary Black Hole Merger. Phys. Rev. Lett. 2016, 1166, 061102. [Google Scholar] [CrossRef]
  2. Abbott, B.P.; et al. [LIGO Scientific Collaboration and Virgo Collaboration]. GW151226: Observation of Gravitational Waves from a 22-Solar-Mass Binary Black Hole Coalescence. Phys. Rev. Lett. 2016, 116, 241103. [Google Scholar] [CrossRef]
  3. Abbott, B.P.; et al. [LIGO Scientific Collaboration and Virgo Collaboration]. GW170104: Observation of a 50-Solar-Mass Binary Black Hole Coalescence at Redshift 0.2. Phys. Rev. Lett. 2017, 118, 221101. [Google Scholar] [CrossRef] [Green Version]
  4. Abbott, B.P.; et al. [LIGO Scientific Collaboration and Virgo Collaboration]. GW170608: Observation of a 19 Solar-mass Binary Black Hole Coalescence. Am. Astron. Soc. 2017, 851, L35. [Google Scholar] [CrossRef]
  5. Abbott, B.P.; et al. [LIGO Scientific Collaboration and Virgo Collaboration]. GW170814: A Three-Detector Observation of Gravitational Waves from a Binary Black Hole Coalescence. Phys. Rev. Lett. 2017, 119, 141101. [Google Scholar] [CrossRef] [Green Version]
  6. Abbott, B.P.; et al. [LIGO Scientific Collaboration and Virgo Collaboration]. GW170817: Observation of Gravitational Waves from a Binary Neutron Star Inspiral. Phys. Rev. Lett. 2017, 119, 161101. [Google Scholar] [CrossRef] [Green Version]
  7. Abbott, B.P.; et al. [LIGO Scientific Collaboration and Virgo Collaboration]. Multi-messenger Observations of a Binary Neutron Star Merger. Astrophys. J. 2017, 848, L12. [Google Scholar] [CrossRef]
  8. Abbott, B.P.; Abbott, R.; Abbott, T.D.; Acernese, F.; Ackley, K.; Adams, C.; Adams, T.; Addesso, P.; Adhikari, R.X.; Adya, V.B.; et al. Gravitational Waves and Gamma-Rays from a Binary Neutron Star Merger: GW170817 and GRB 170817A. Astrophys. J. 2017, 848, L13. [Google Scholar] [CrossRef]
  9. Goldstein, A.; Veres, P.; Burns, E.; Briggs, M.S.; Hamburg, R.; Kocevski, D.; Wilson-Hodge, C.A.; Preece, R.D.; Poolakkil, S.; Roberts, O.J.; et al. An Ordinary Short Gamma-Ray Burst with Extraordinary Implications: Fermi-GBM Detection of GRB 170817A. Astrophys. J. 2017, 848, L14. [Google Scholar] [CrossRef] [Green Version]
  10. Savchenko, V.; Ferrigno, C.; Kuulkers, E.; Bazzano, A.; Bozzo, E.; Brandt, S.; Chenevez, J.; Courvoisier, T.J.-L.; Diehl, R.; Domingo, A.; et al. INTEGRAL Detection of the First Prompt Gamma-Ray Signal Coincident with the Gravitational-wave Event GW170817. Astrophys. J. 2017, 848, L15. [Google Scholar] [CrossRef] [Green Version]
  11. Bartos, I.; Kowalski, M. Multimessenger Astronomy; IOP Publishing: Bristol, UK, 2017; ISBN 978-0-7503-1369-8. [Google Scholar]
  12. Krauss, L.M.; Dodelson, S.; Meyer, S. Primordial Gravitational Waves and Cosmology. Science 2010, 328, 732–736. [Google Scholar] [CrossRef] [Green Version]
  13. Saulson, P.R. Terrestrial gravitational noise on a gravitational wave antenna. Phys. Rev. D 1984, 30, 989–992. [Google Scholar] [CrossRef]
  14. Harms, J. Terrestrial gravity fluctuations. Living Rev. Relativ. 2019, 22, 6. [Google Scholar] [CrossRef] [Green Version]
  15. Ballmer, S.; Mandic, V. New Technologies in Gravitational-Wave Detection. Annu. Rev. Nucl. Part. Sci. 2015, 65, 555–577. [Google Scholar] [CrossRef] [Green Version]
  16. Fiorucci, D.; Harms, J.; Barsuglia, M.; Fiori, I.; Paoletti, F. Impact of infrasound atmospheric noise on gravity detectors used for astrophysical and geophysical applications. Phys. Rev. D 2018, 97, 062003. [Google Scholar] [CrossRef] [Green Version]
  17. Coughlin, M.; Harms, J.; Christensen, N.; Dergachev, V.; DeSalvo, R.; Kandhasamy, S.; Mandic, V. Wiener filtering with a seismic underground array at the Sanford Underground Research Facility. Class. Quantum Gravity 2014, 31, 215003. [Google Scholar] [CrossRef]
  18. Coughlin, M.W.; Harms, J.; Driggers, J.; McManus, D.J.; Mukund, N.; Ross, M.P.; Slagmolen, B.J.J.; Venkateswara, K. Implications of Dedicated Seismometer Measurements on Newtonian-Noise Cancellation for Advanced LIGO. Phys. Rev. Lett. 2018, 121, 221104. [Google Scholar] [CrossRef] [Green Version]
  19. Badaracco, F.; Harms, J. Optimization of seismometer arrays for the cancellation of Newtonian noise from seismic body waves. Class. Quantum Gravity 2019, 36, 145006. [Google Scholar] [CrossRef] [Green Version]
  20. Akutsu, T.; Ando, M.; Arai, K.; Arai, Y.; Araki, S.; Araya, A.; Aritomi, N.; Asada, H.; Aso, Y.; Atsuta, S.; et al. KAGRA: 2.5 generation interferometric gravitational wave detector. Nat. Astron. 2019, 3, 35–40. [Google Scholar] [CrossRef] [Green Version]
  21. Abernathy, M.; et al. [ET Science Team]. Einstein Gravitational Wave Telescope Conceptual Design Study. Available online: http://www.et-gw.eu/index.php/etdsdocument (accessed on 29 December 2019).
  22. Beker, M.; van den Brand, J.; Rabeling, D.S. Subterranean ground motion studies for the Einstein Telescope. Class. Quantum Gravity 2015, 32, 025002. [Google Scholar] [CrossRef]
  23. Barnaföld, G.G.; Bulik, T.; Cieslar, M.; Dávid, E.; Dobróka, M.; Fenyvesi, E.; Gondek-Rosinska, D.; Gráczer, Z.; Hamar, G.; Huba, G.; et al. First report of long term measurements of the MGGL laboratory in the Mátra mountain range. Class. Quantum Gravity 2017, 34, 114001. [Google Scholar] [CrossRef]
  24. Ván, P.; Barnaföldi, G.G.; Bulik, T.; Biró, T.; Czellár, S.; Cieślar, M.; Czanik, C.; Dávid, E.; Debreceni, E.; Denys, M.; et al. Long term measurements from the Mátra Gravitational and Geophysical Laboratory. Eur. Phys. J. Spec. Top. 2019, 228, 1693–1743. [Google Scholar]
  25. Bowman, J.R.; Baker, G.E.; Bahavar, M. Ambient infrasound noise. Geophys. Res. Lett. 2005, 32, L09803. [Google Scholar] [CrossRef]
  26. Cornish, N.J.; Littenberg, T.B. Bayeswave: Bayesian inference for gravitational wave bursts and instrument glitches. Class. Quantum Gravity 2015, 32, 135012. [Google Scholar] [CrossRef]
  27. Robinet, F. Omicron: An Algorithm to Detect and Characterize Transient Noise in Gravitational-Wave Detectors. Available online: https://tds.ego-gw.it/ql/?c=10651 (accessed on 29 December 2019).
  28. Klimenko, S.; Mitselmakher, G. A wavelet method for detection of gravitational wave bursts. Class. Quantum Gravity 2004, 21, S1819–S1830. [Google Scholar] [CrossRef]
  29. Bronshtein, I.N.; Semendyayev, K.A.; Musiol, G.; Mühlig, H. Handbook of Mathematics; Springer: Berlin/Heidelberg, Germany, 2015; ISBN 978-3-662-46220-1. [Google Scholar]
  30. Leys, C.; Ley, C.; Klein, O.; Bernard, P.; Licata, L. Detecting outliers: Do not use standard deviation around the mean, use absolute deviation around the median. J. Exp. Social Psychol. 2013, 49, 764–766. [Google Scholar] [CrossRef] [Green Version]
  31. Harms, J.; Acernese, F.; Barone, F.; Bartos, I.; Beker, M.; van den Brand, J.F.J.; Christensen, N.; Coughlin, M.; DeSalvo, R.; Dorsher, S.; et al. Characterization of the seismic environment at the Sanford Underground Laboratory, South Dakota. Class. Quantum Gravity 2008, 27, 225011. [Google Scholar] [CrossRef] [Green Version]
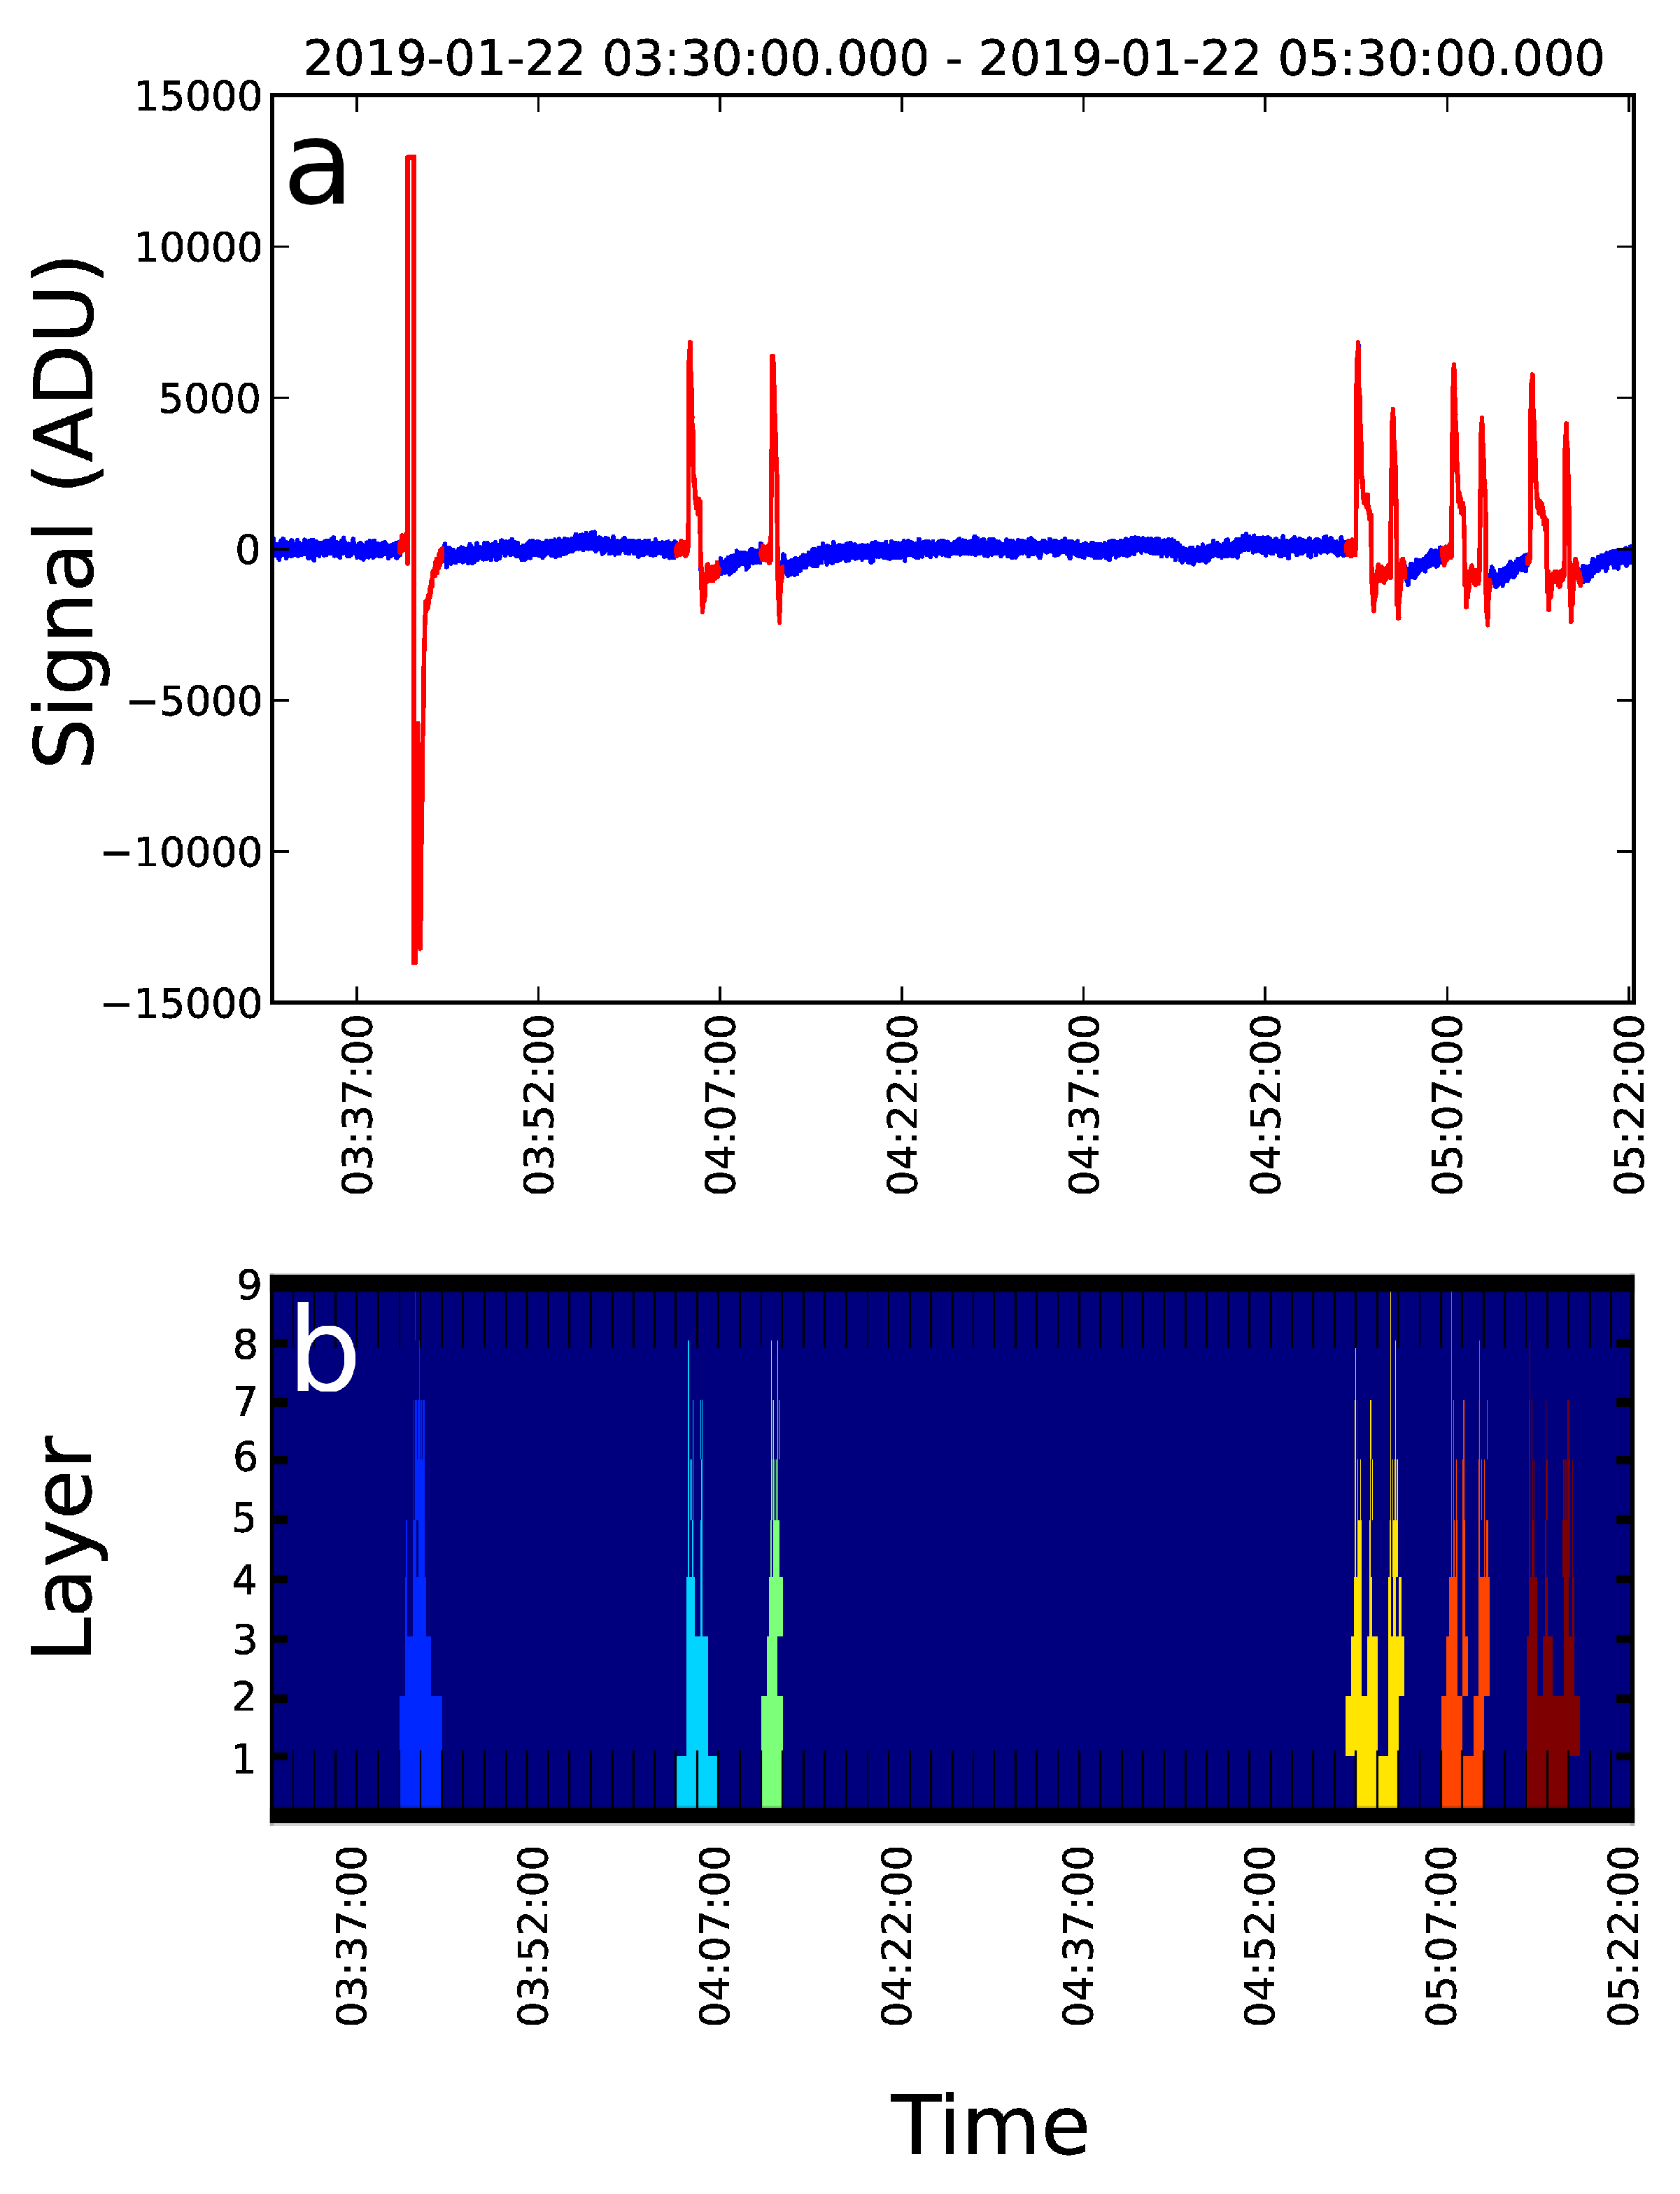
Figure 1. (a) Raw signal of the infrasound monitoring system expressed in ADC units (ADU). Transients found by our software are highlighted with color red. (b) Clusters corresponding to transients found after applying Haar transform on the signal. Outlier detail coefficients are represented by colored rectangles. Rectangles corresponding to the same cluster are colored with the same color.
Universe 06 00010 g001
Figure 2. Relative frequency of transients of different bandwidth from the entire data collecting period. Transients of largest bandwidth are the most frequent.
Universe 06 00010 g002
Figure 3. Number of transients found during the entire data collecting period vs. hour of a day. Dots represent the average number of transients, whereas error bars represent standard deviation. Transients was assigned to the hour when the data segment containing them started. As data was divided into two hour long segments, only every second hour was considered. Generally, transients were more frequent during daytime.
Universe 06 00010 g003
Figure 4. The red lines show the pressure amplitude spectral density (PASD) curves computed from measurement data containing transients, while the blue lines correspond to data without transients.
Universe 06 00010 g004
Figure 5. Results of noise controlling experiment. The MGGL–median curve corresponds to the measurement campaign of January, 2019.
Universe 06 00010 g005
Figure 6. The orange line indicates the lowest noise level measured at MGGL, when the ventilation system was turned off.
Universe 06 00010 g006
Figure 7. Estimated infrasound Newtonian noise of a subterranean GW detector, like Einstein Telescope. The green curve shows NN at the Earth’s surface without building effects (see work in [16]), whereas the orange curve shows NN at MGGL also without building effects. The dashed black line is the sensitivity curve of the detector.
Universe 06 00010 g007
Table 1. Frequency bands associated with each layer of Haar transform and the corresponding number of detail coefficients.
Layer NumberFrequency Band (Hz)Number of Detail Coefficients
177.75–155.5524288
238.875–77.75262144
319.4375–38.875131072
49.7187–19.437565536
54.8593–9.718732768
62.4296–4.859316384
71.2148–2.42968192
80.6074–1.21484096
90.3037–0.60742048
100.1518–0.30371024
110.0759–0.1518512
120.0379–0.0759256
130.0189–0.0379128
Table 2. Frequency bands associated with each layer of Haar transform and the corresponding percentage of outliers of detail coefficients.
Layer NumberFrequency Band (Hz)% of Outliers
54.8593–9.71872.9
62.4296–4.85935.6
71.2148–2.42961.2
80.6074–1.21482.6
90.3037–0.60743.7
100.1518–0.30375.2
110.0759–0.15188.0
120.0379–0.075911.5
130.0189–0.037914.32