Latest Results from RHIC + Progress on Determining
q
^
L in RHI Collisions Using Di-Hadron Correlations


Abstract
1. Introduction
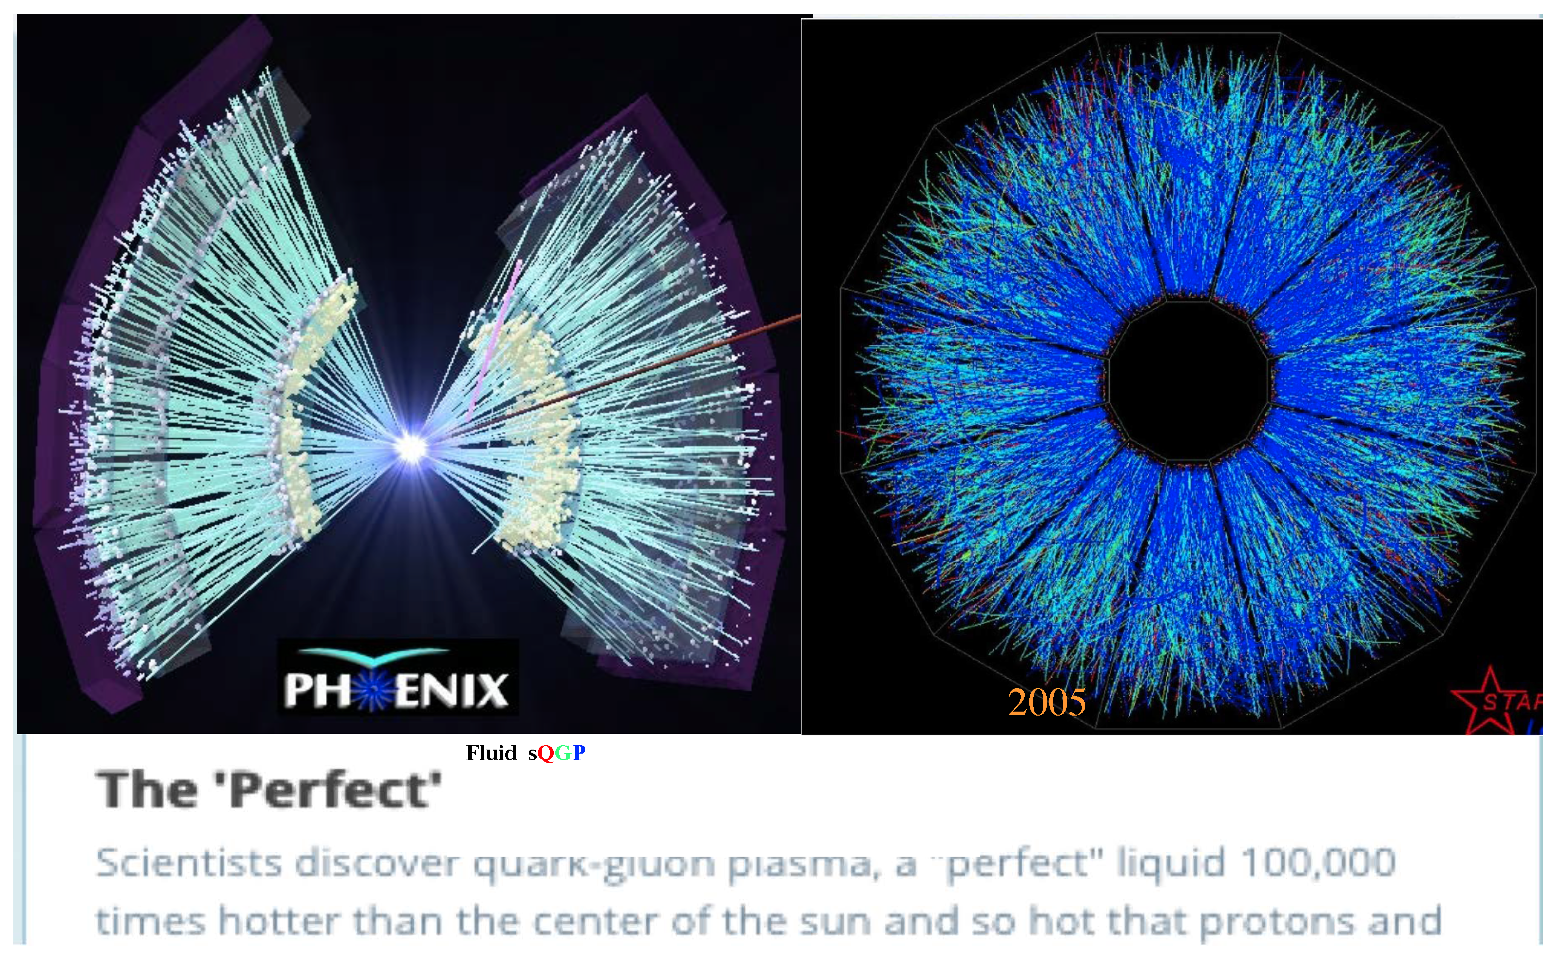
2. Why RHIC Was Built: To Discover the Quark Gluon Plasma (QGP)
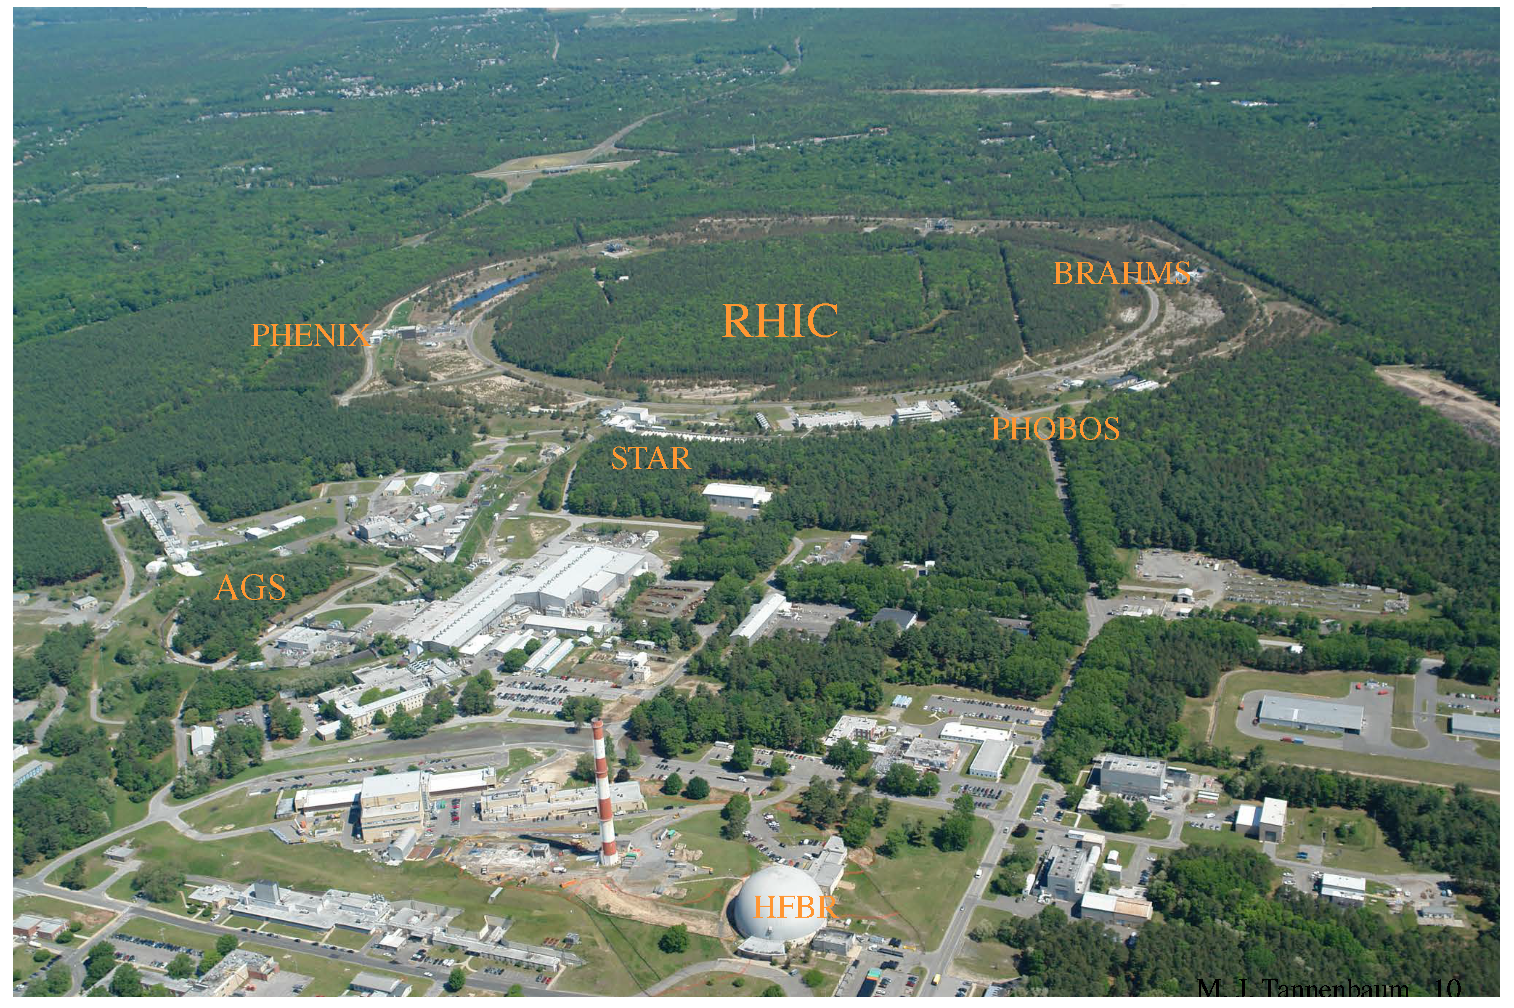
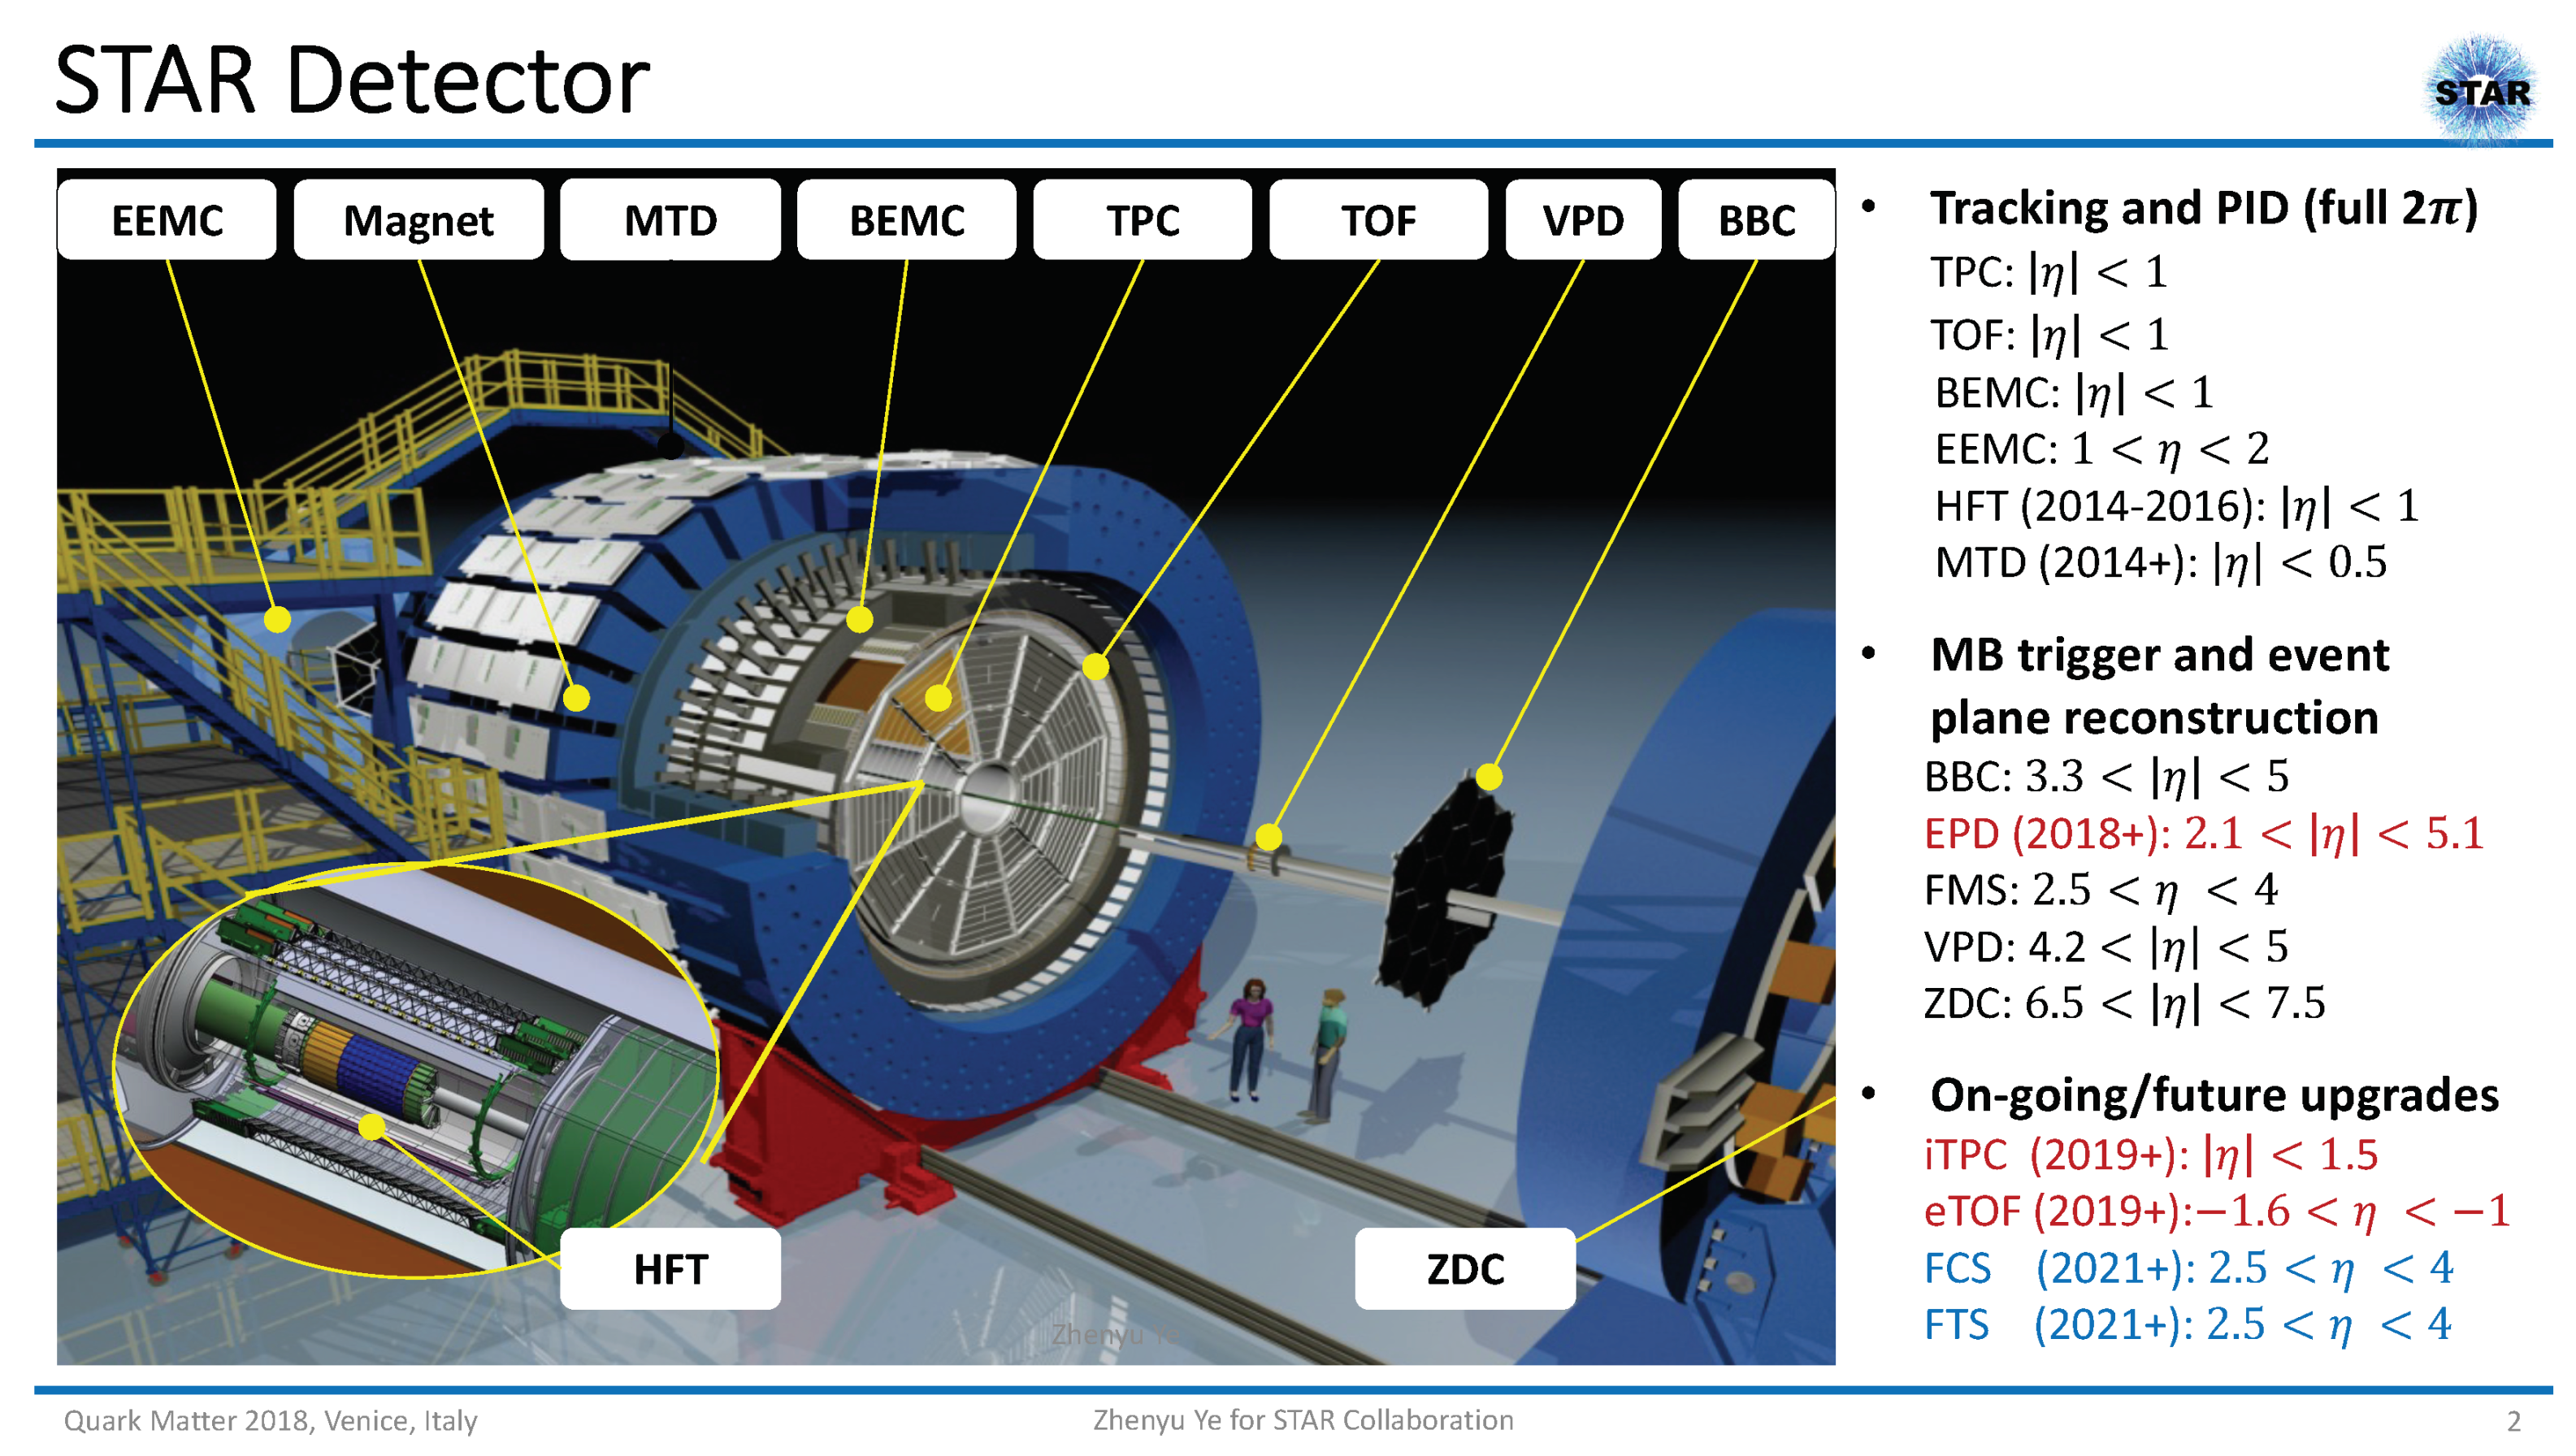
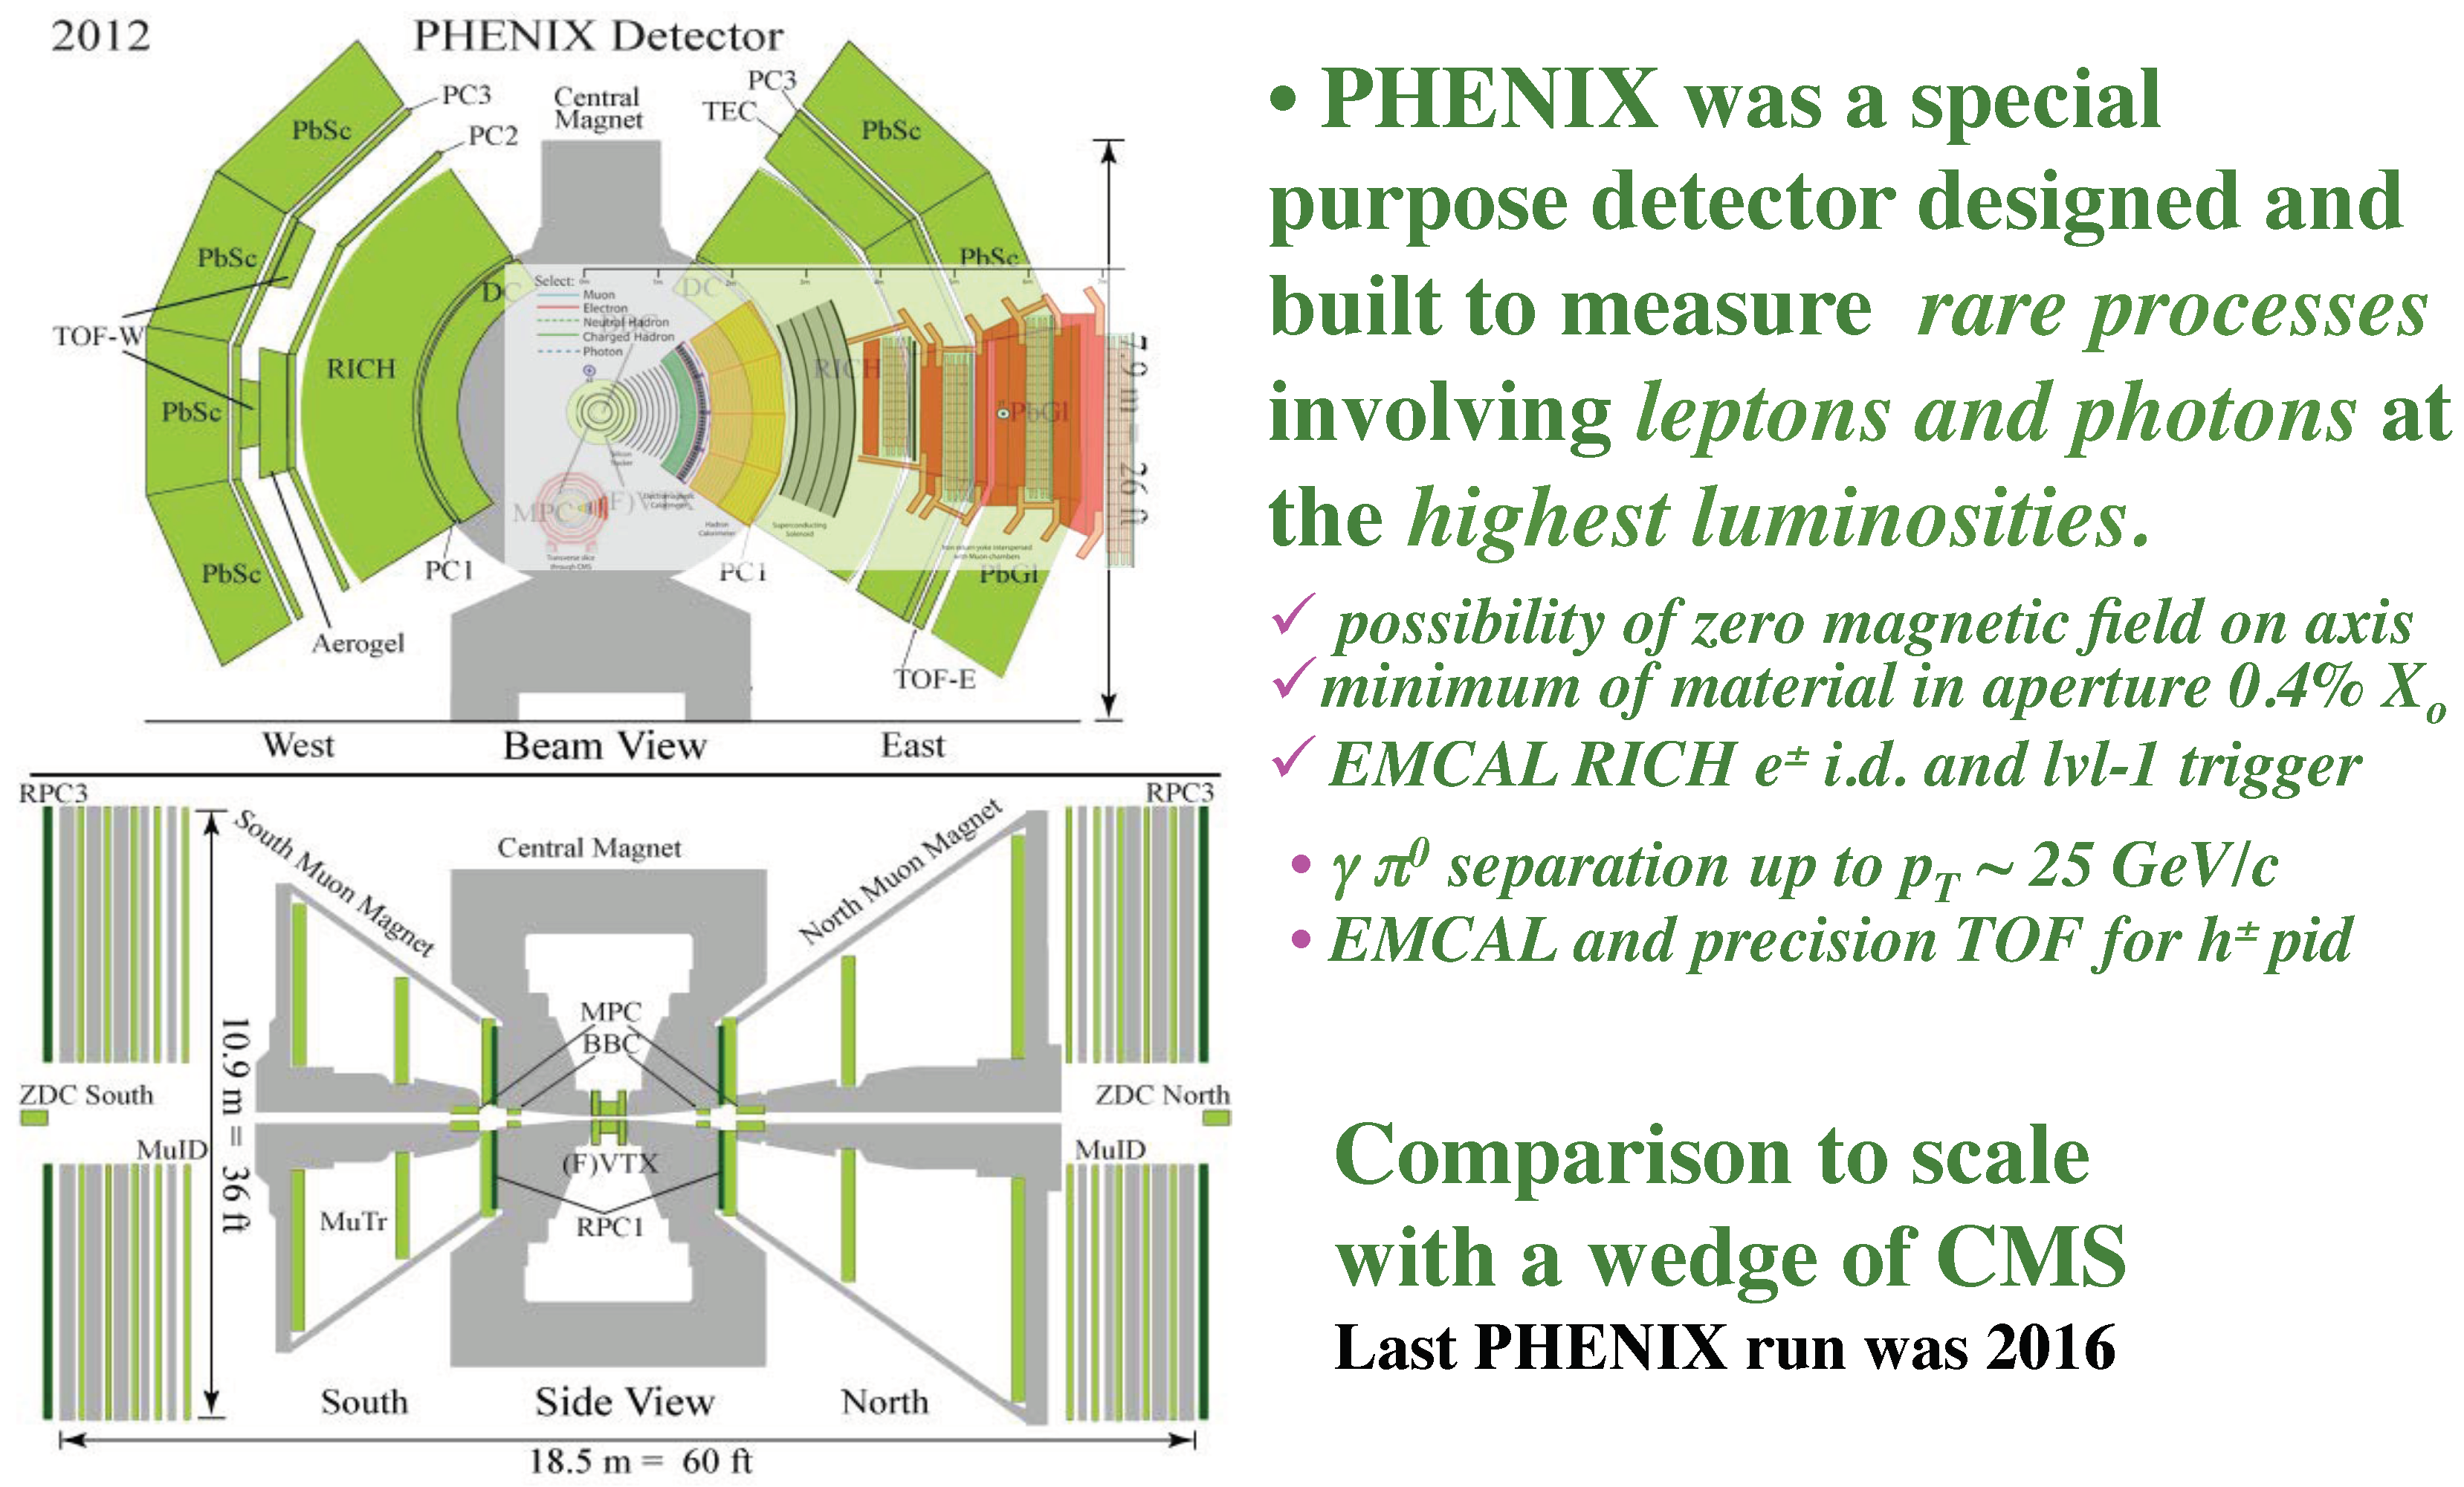
2.1. The First Major RHIC Experiments
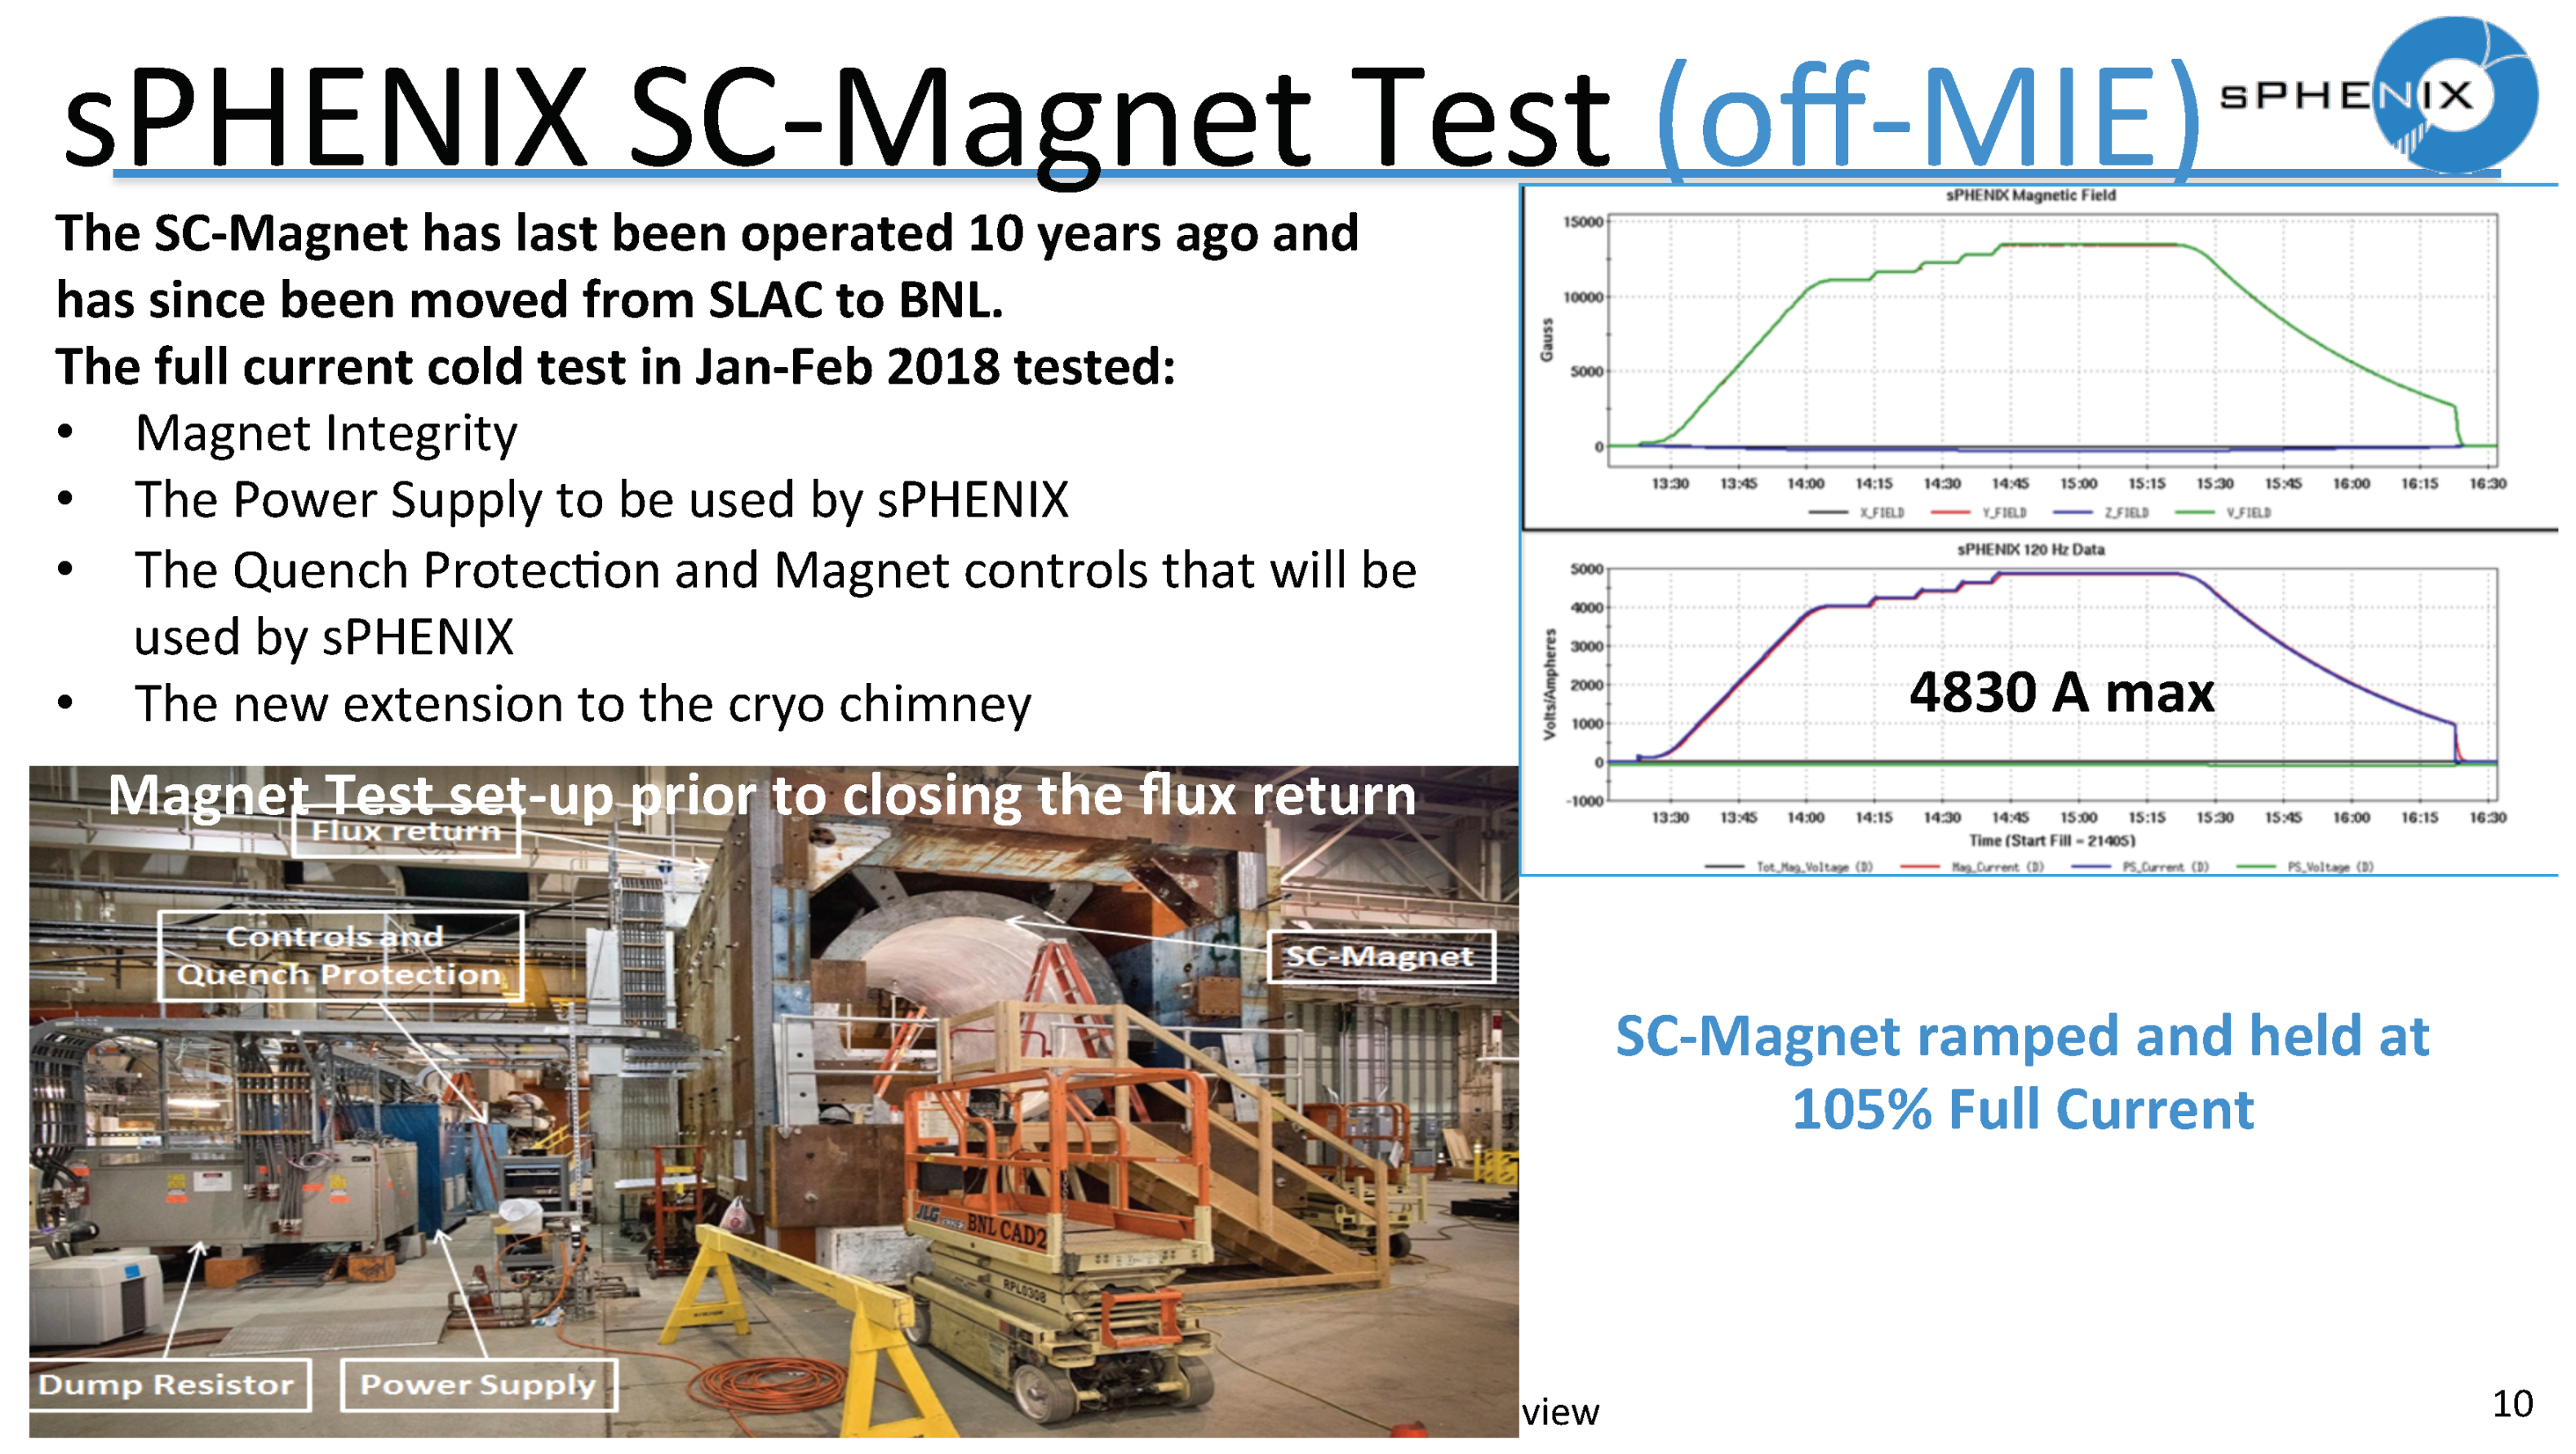
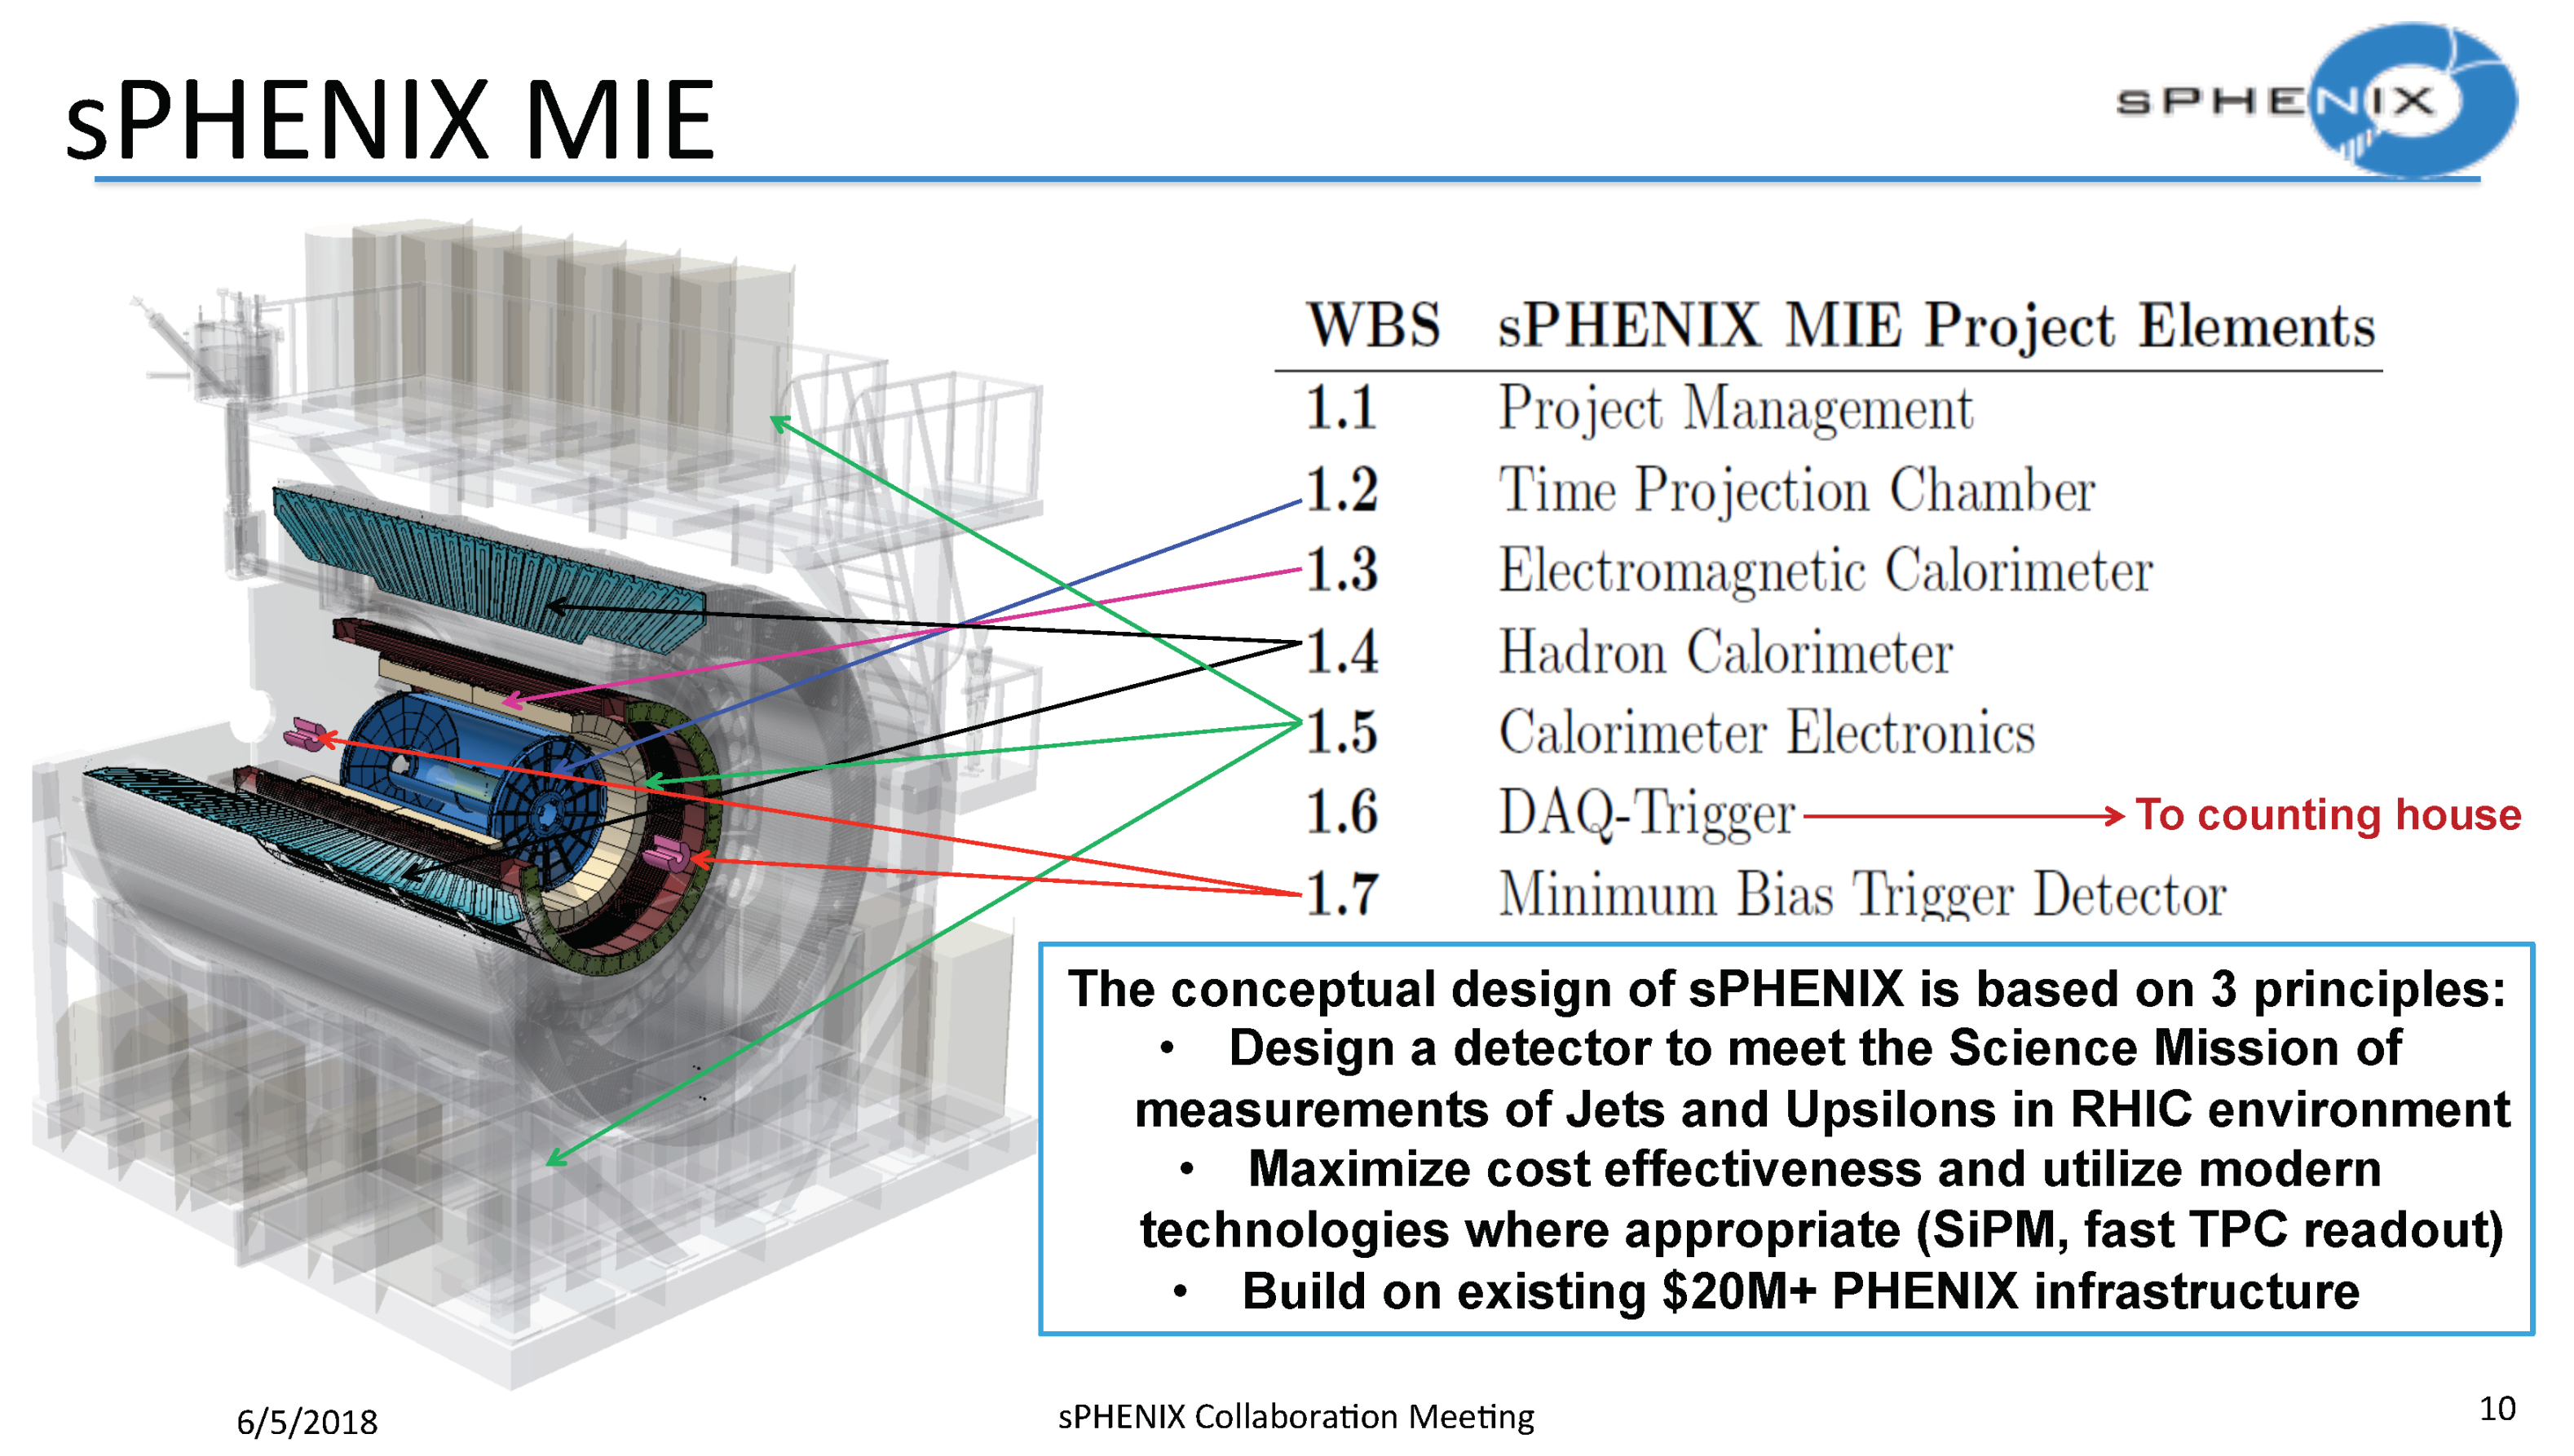
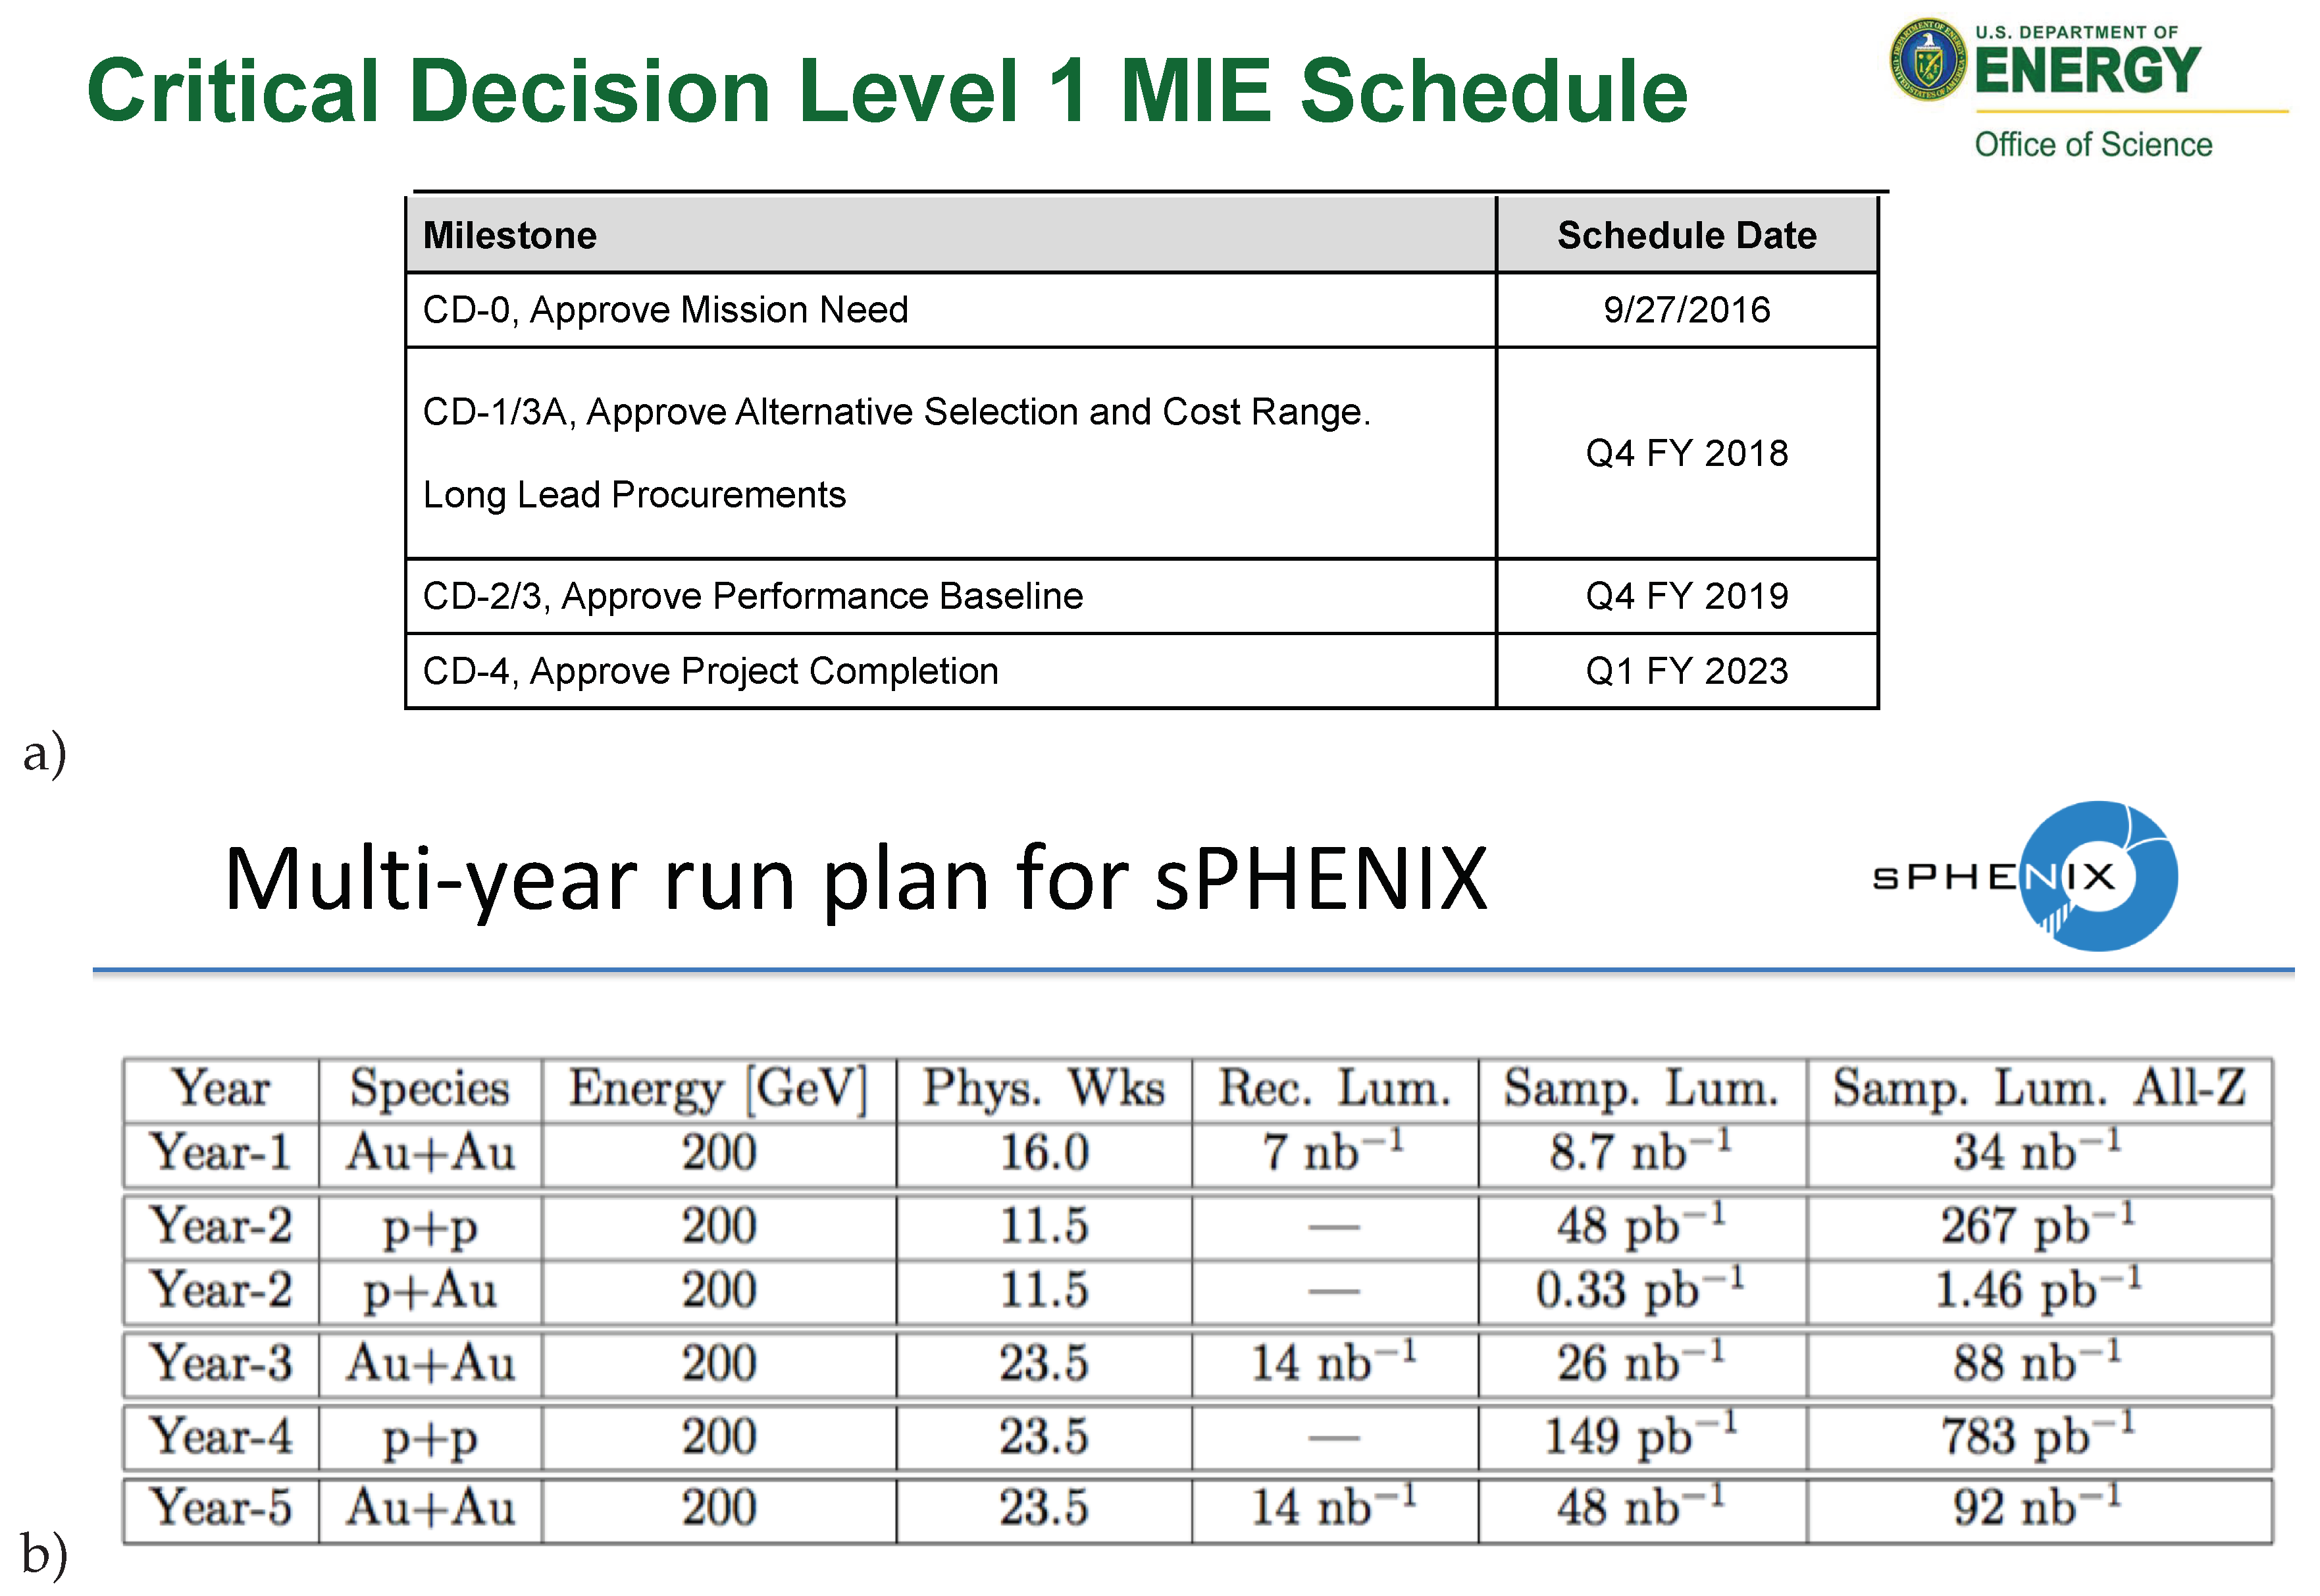
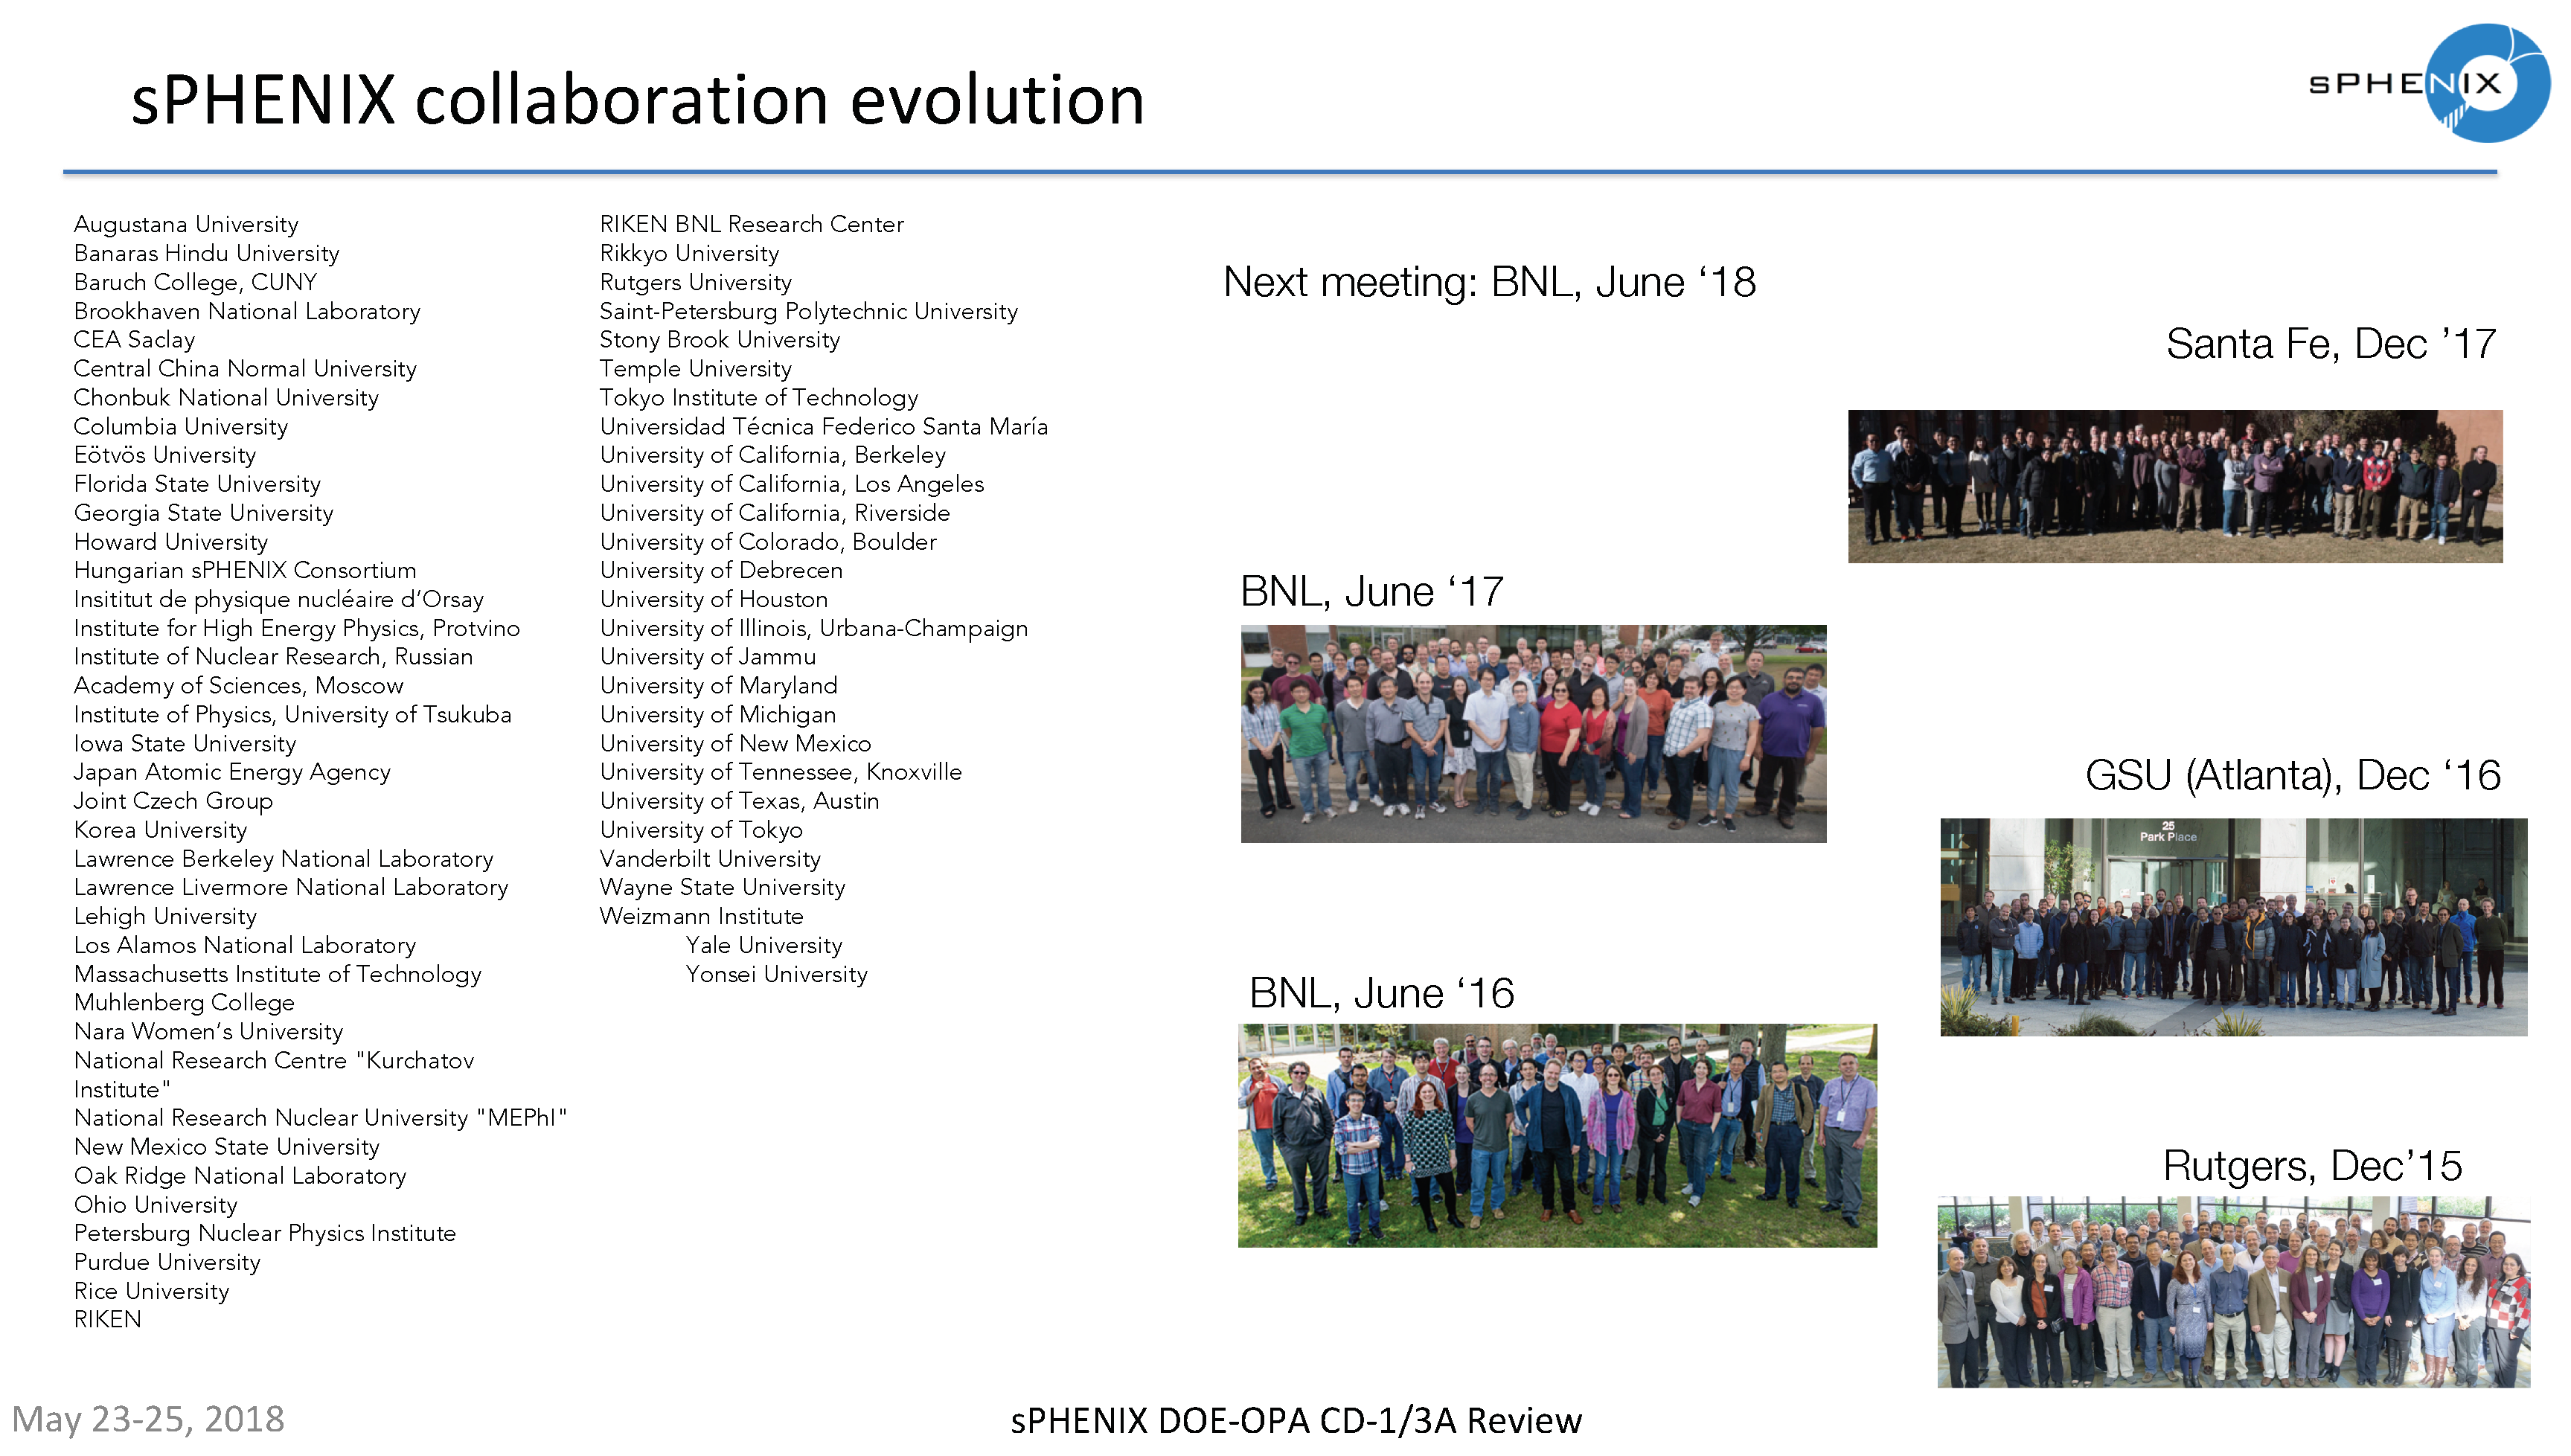
2.2. The New Major RHIC Experiment sPHENIX
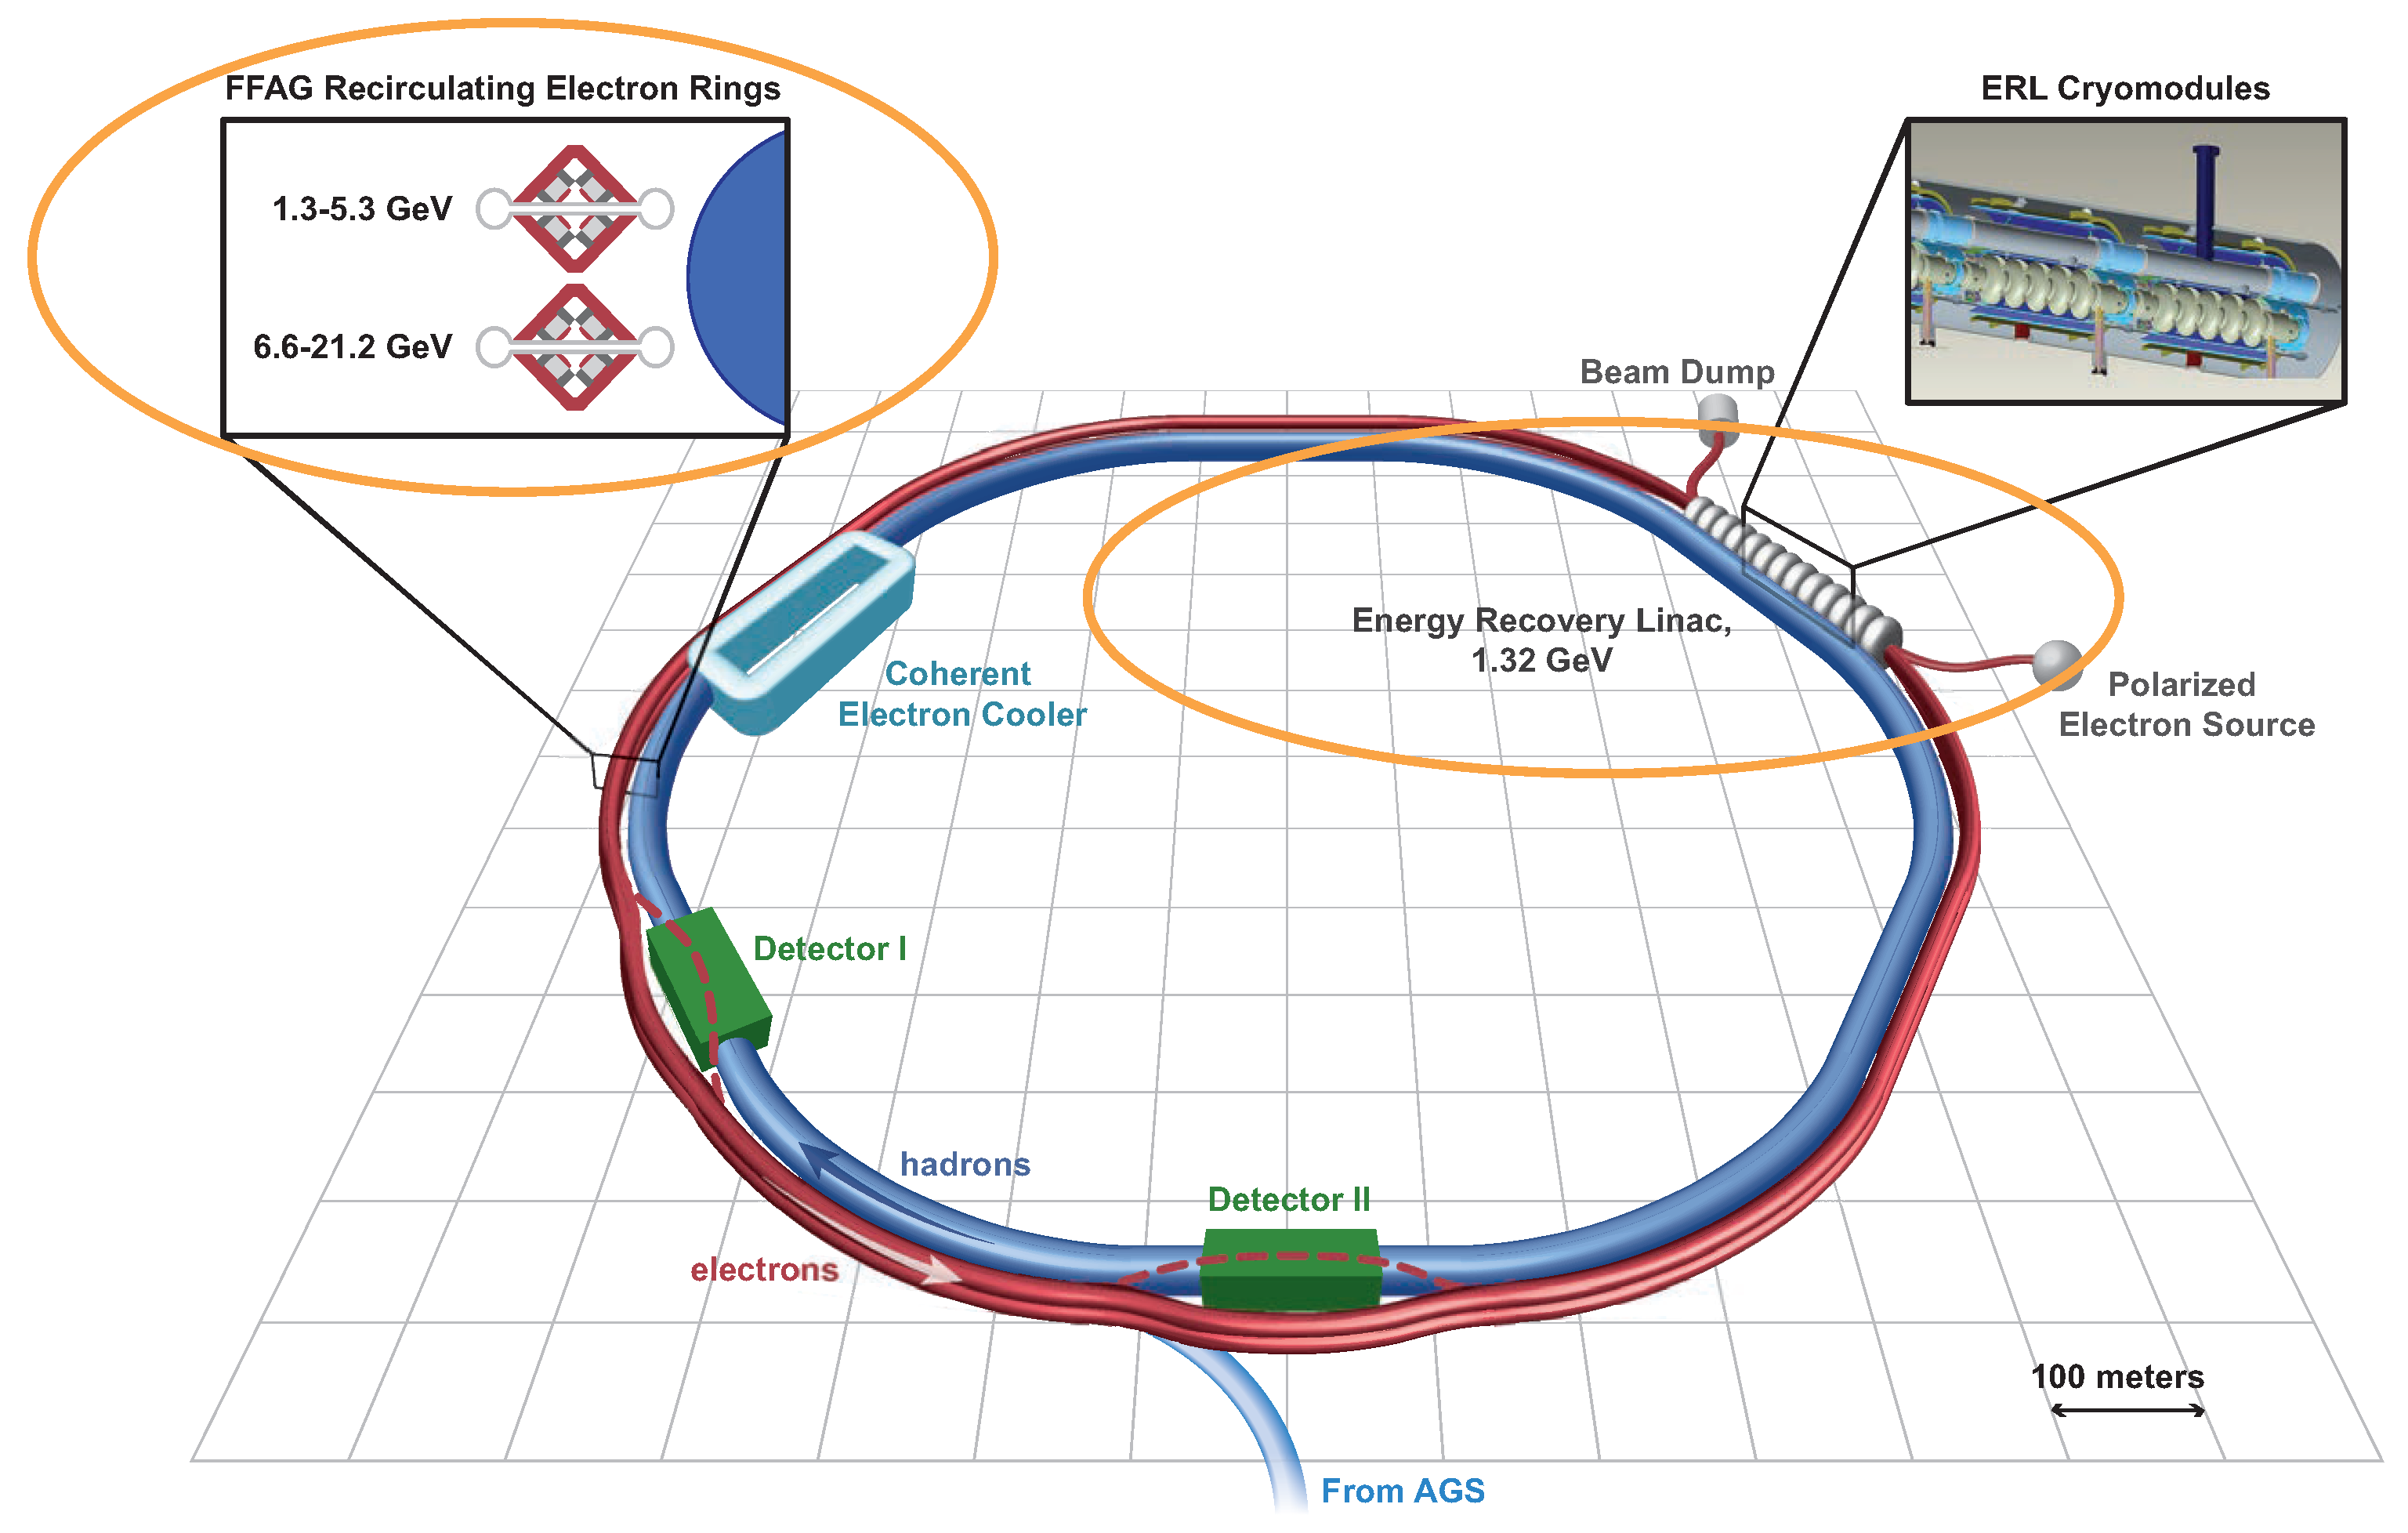
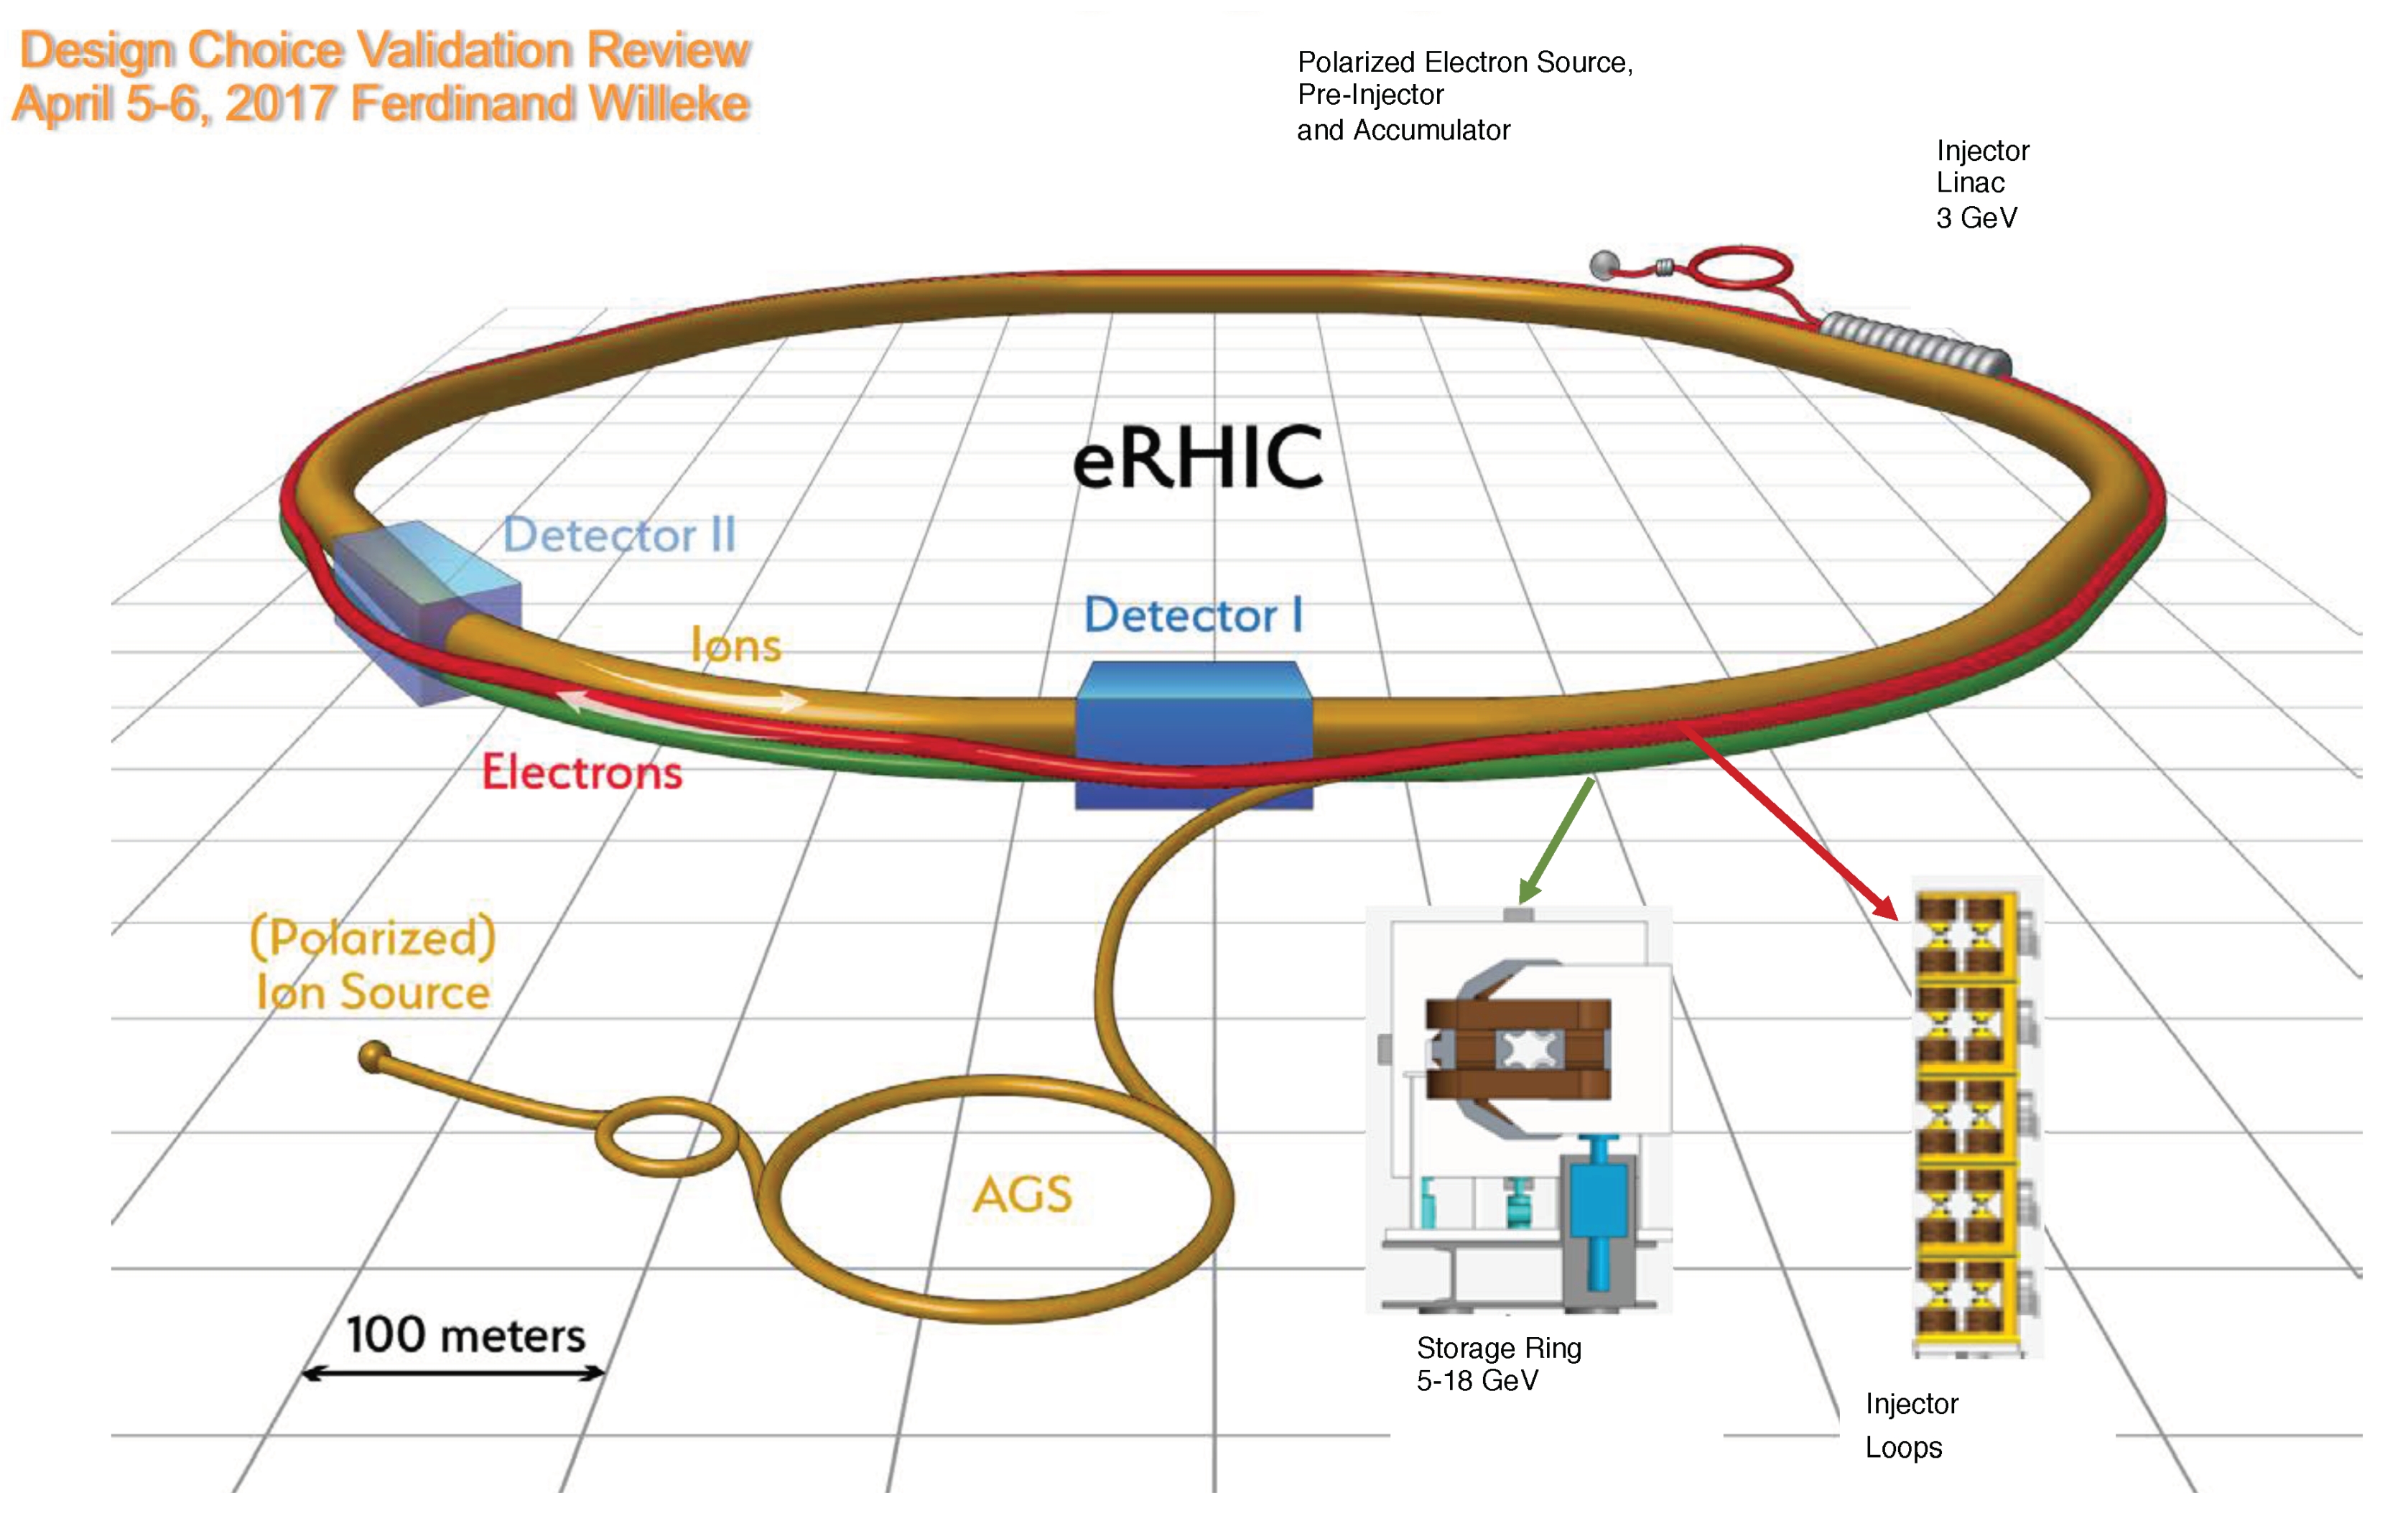
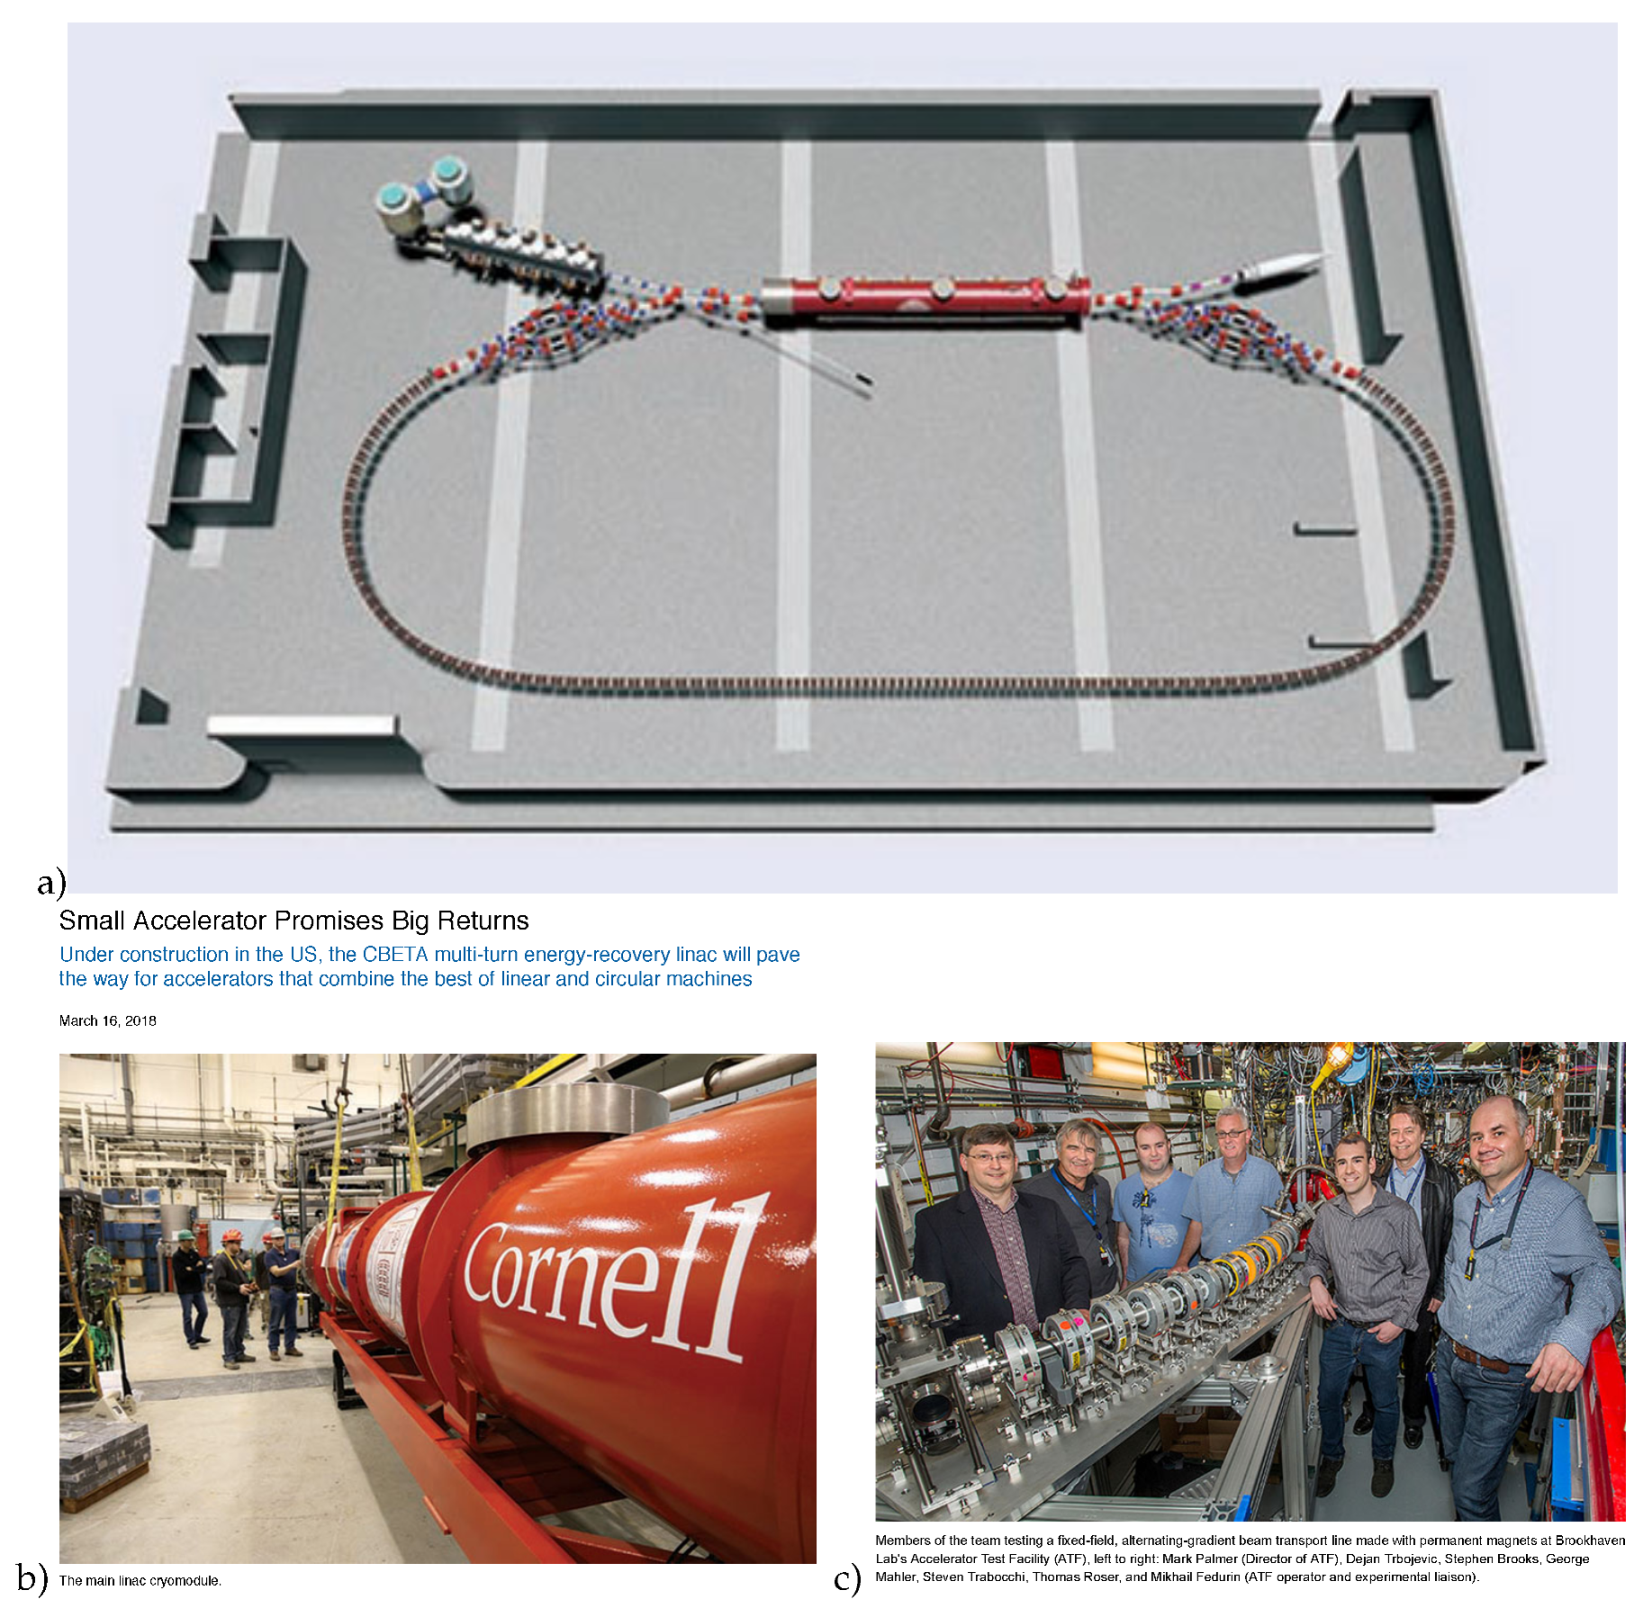
2.3. Following RHIC in U.S. Nuclear Physics: the Electron Ion Collider (EIC)

Research and Development (R&D) for an Improved Less Expensive BNL Machine Is Ongoing
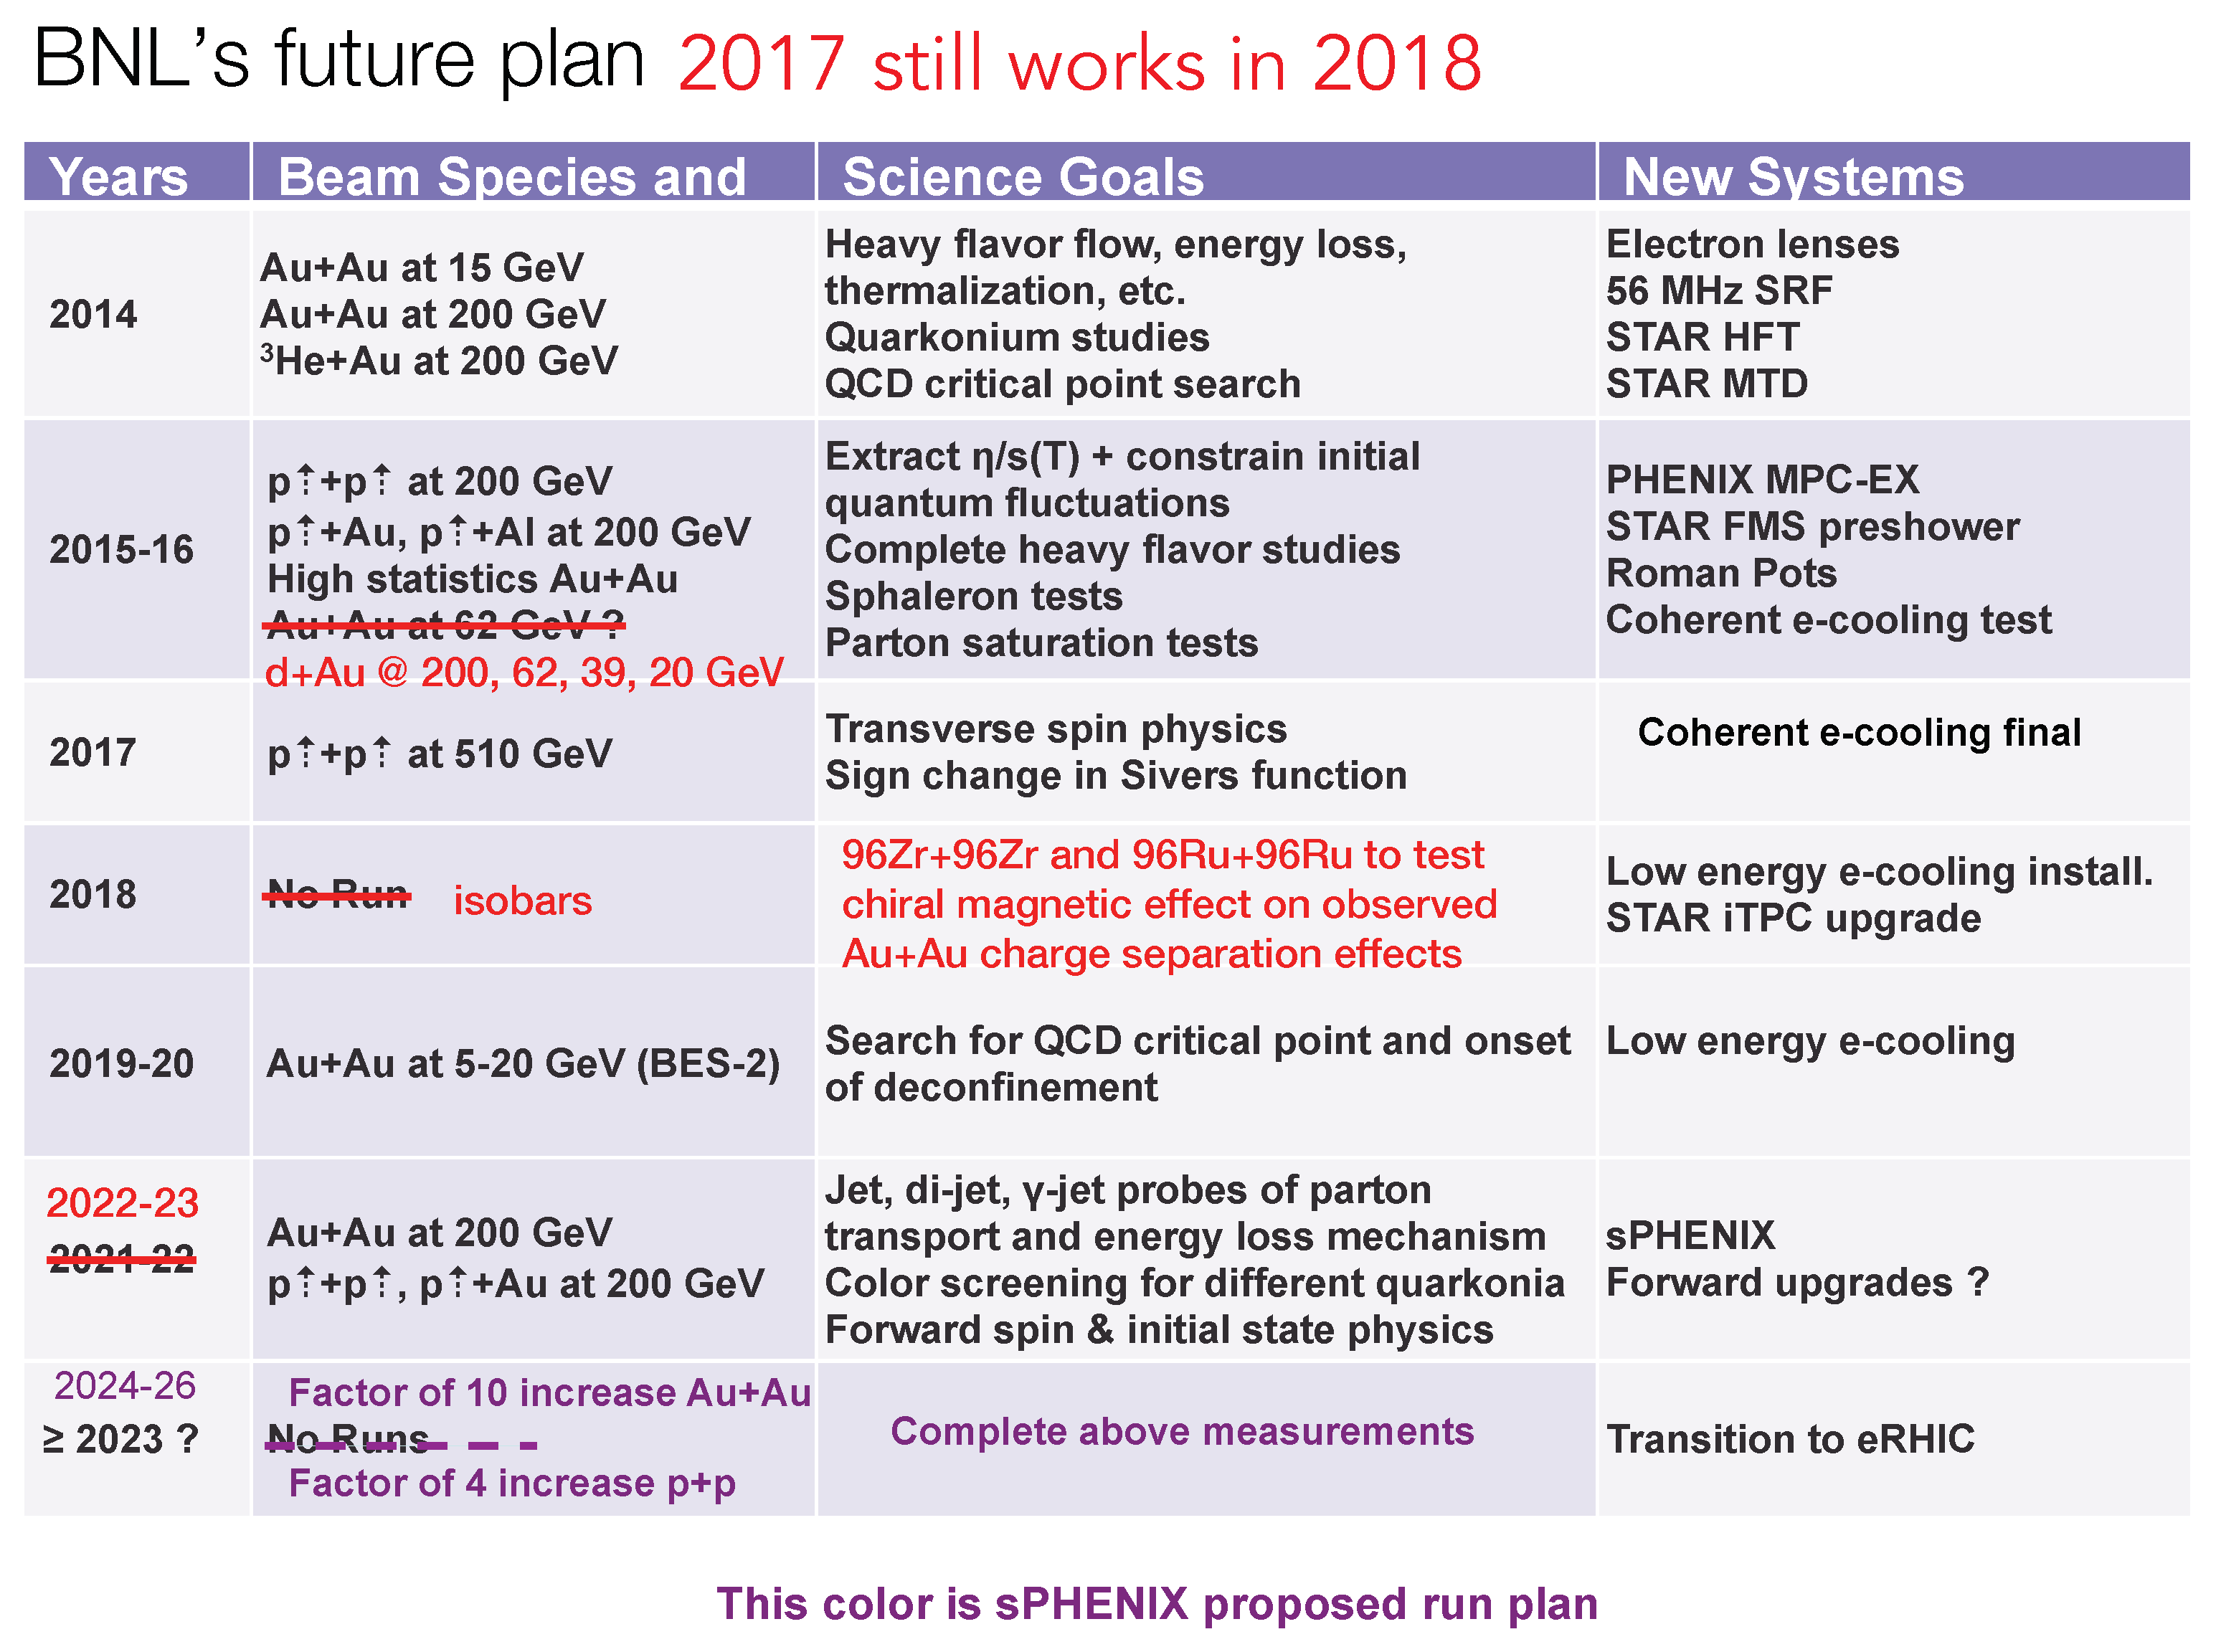
3. RHIC Future Run Plan (Figure 17) and and the Present RHIC Run in 2018 (Figure 18)
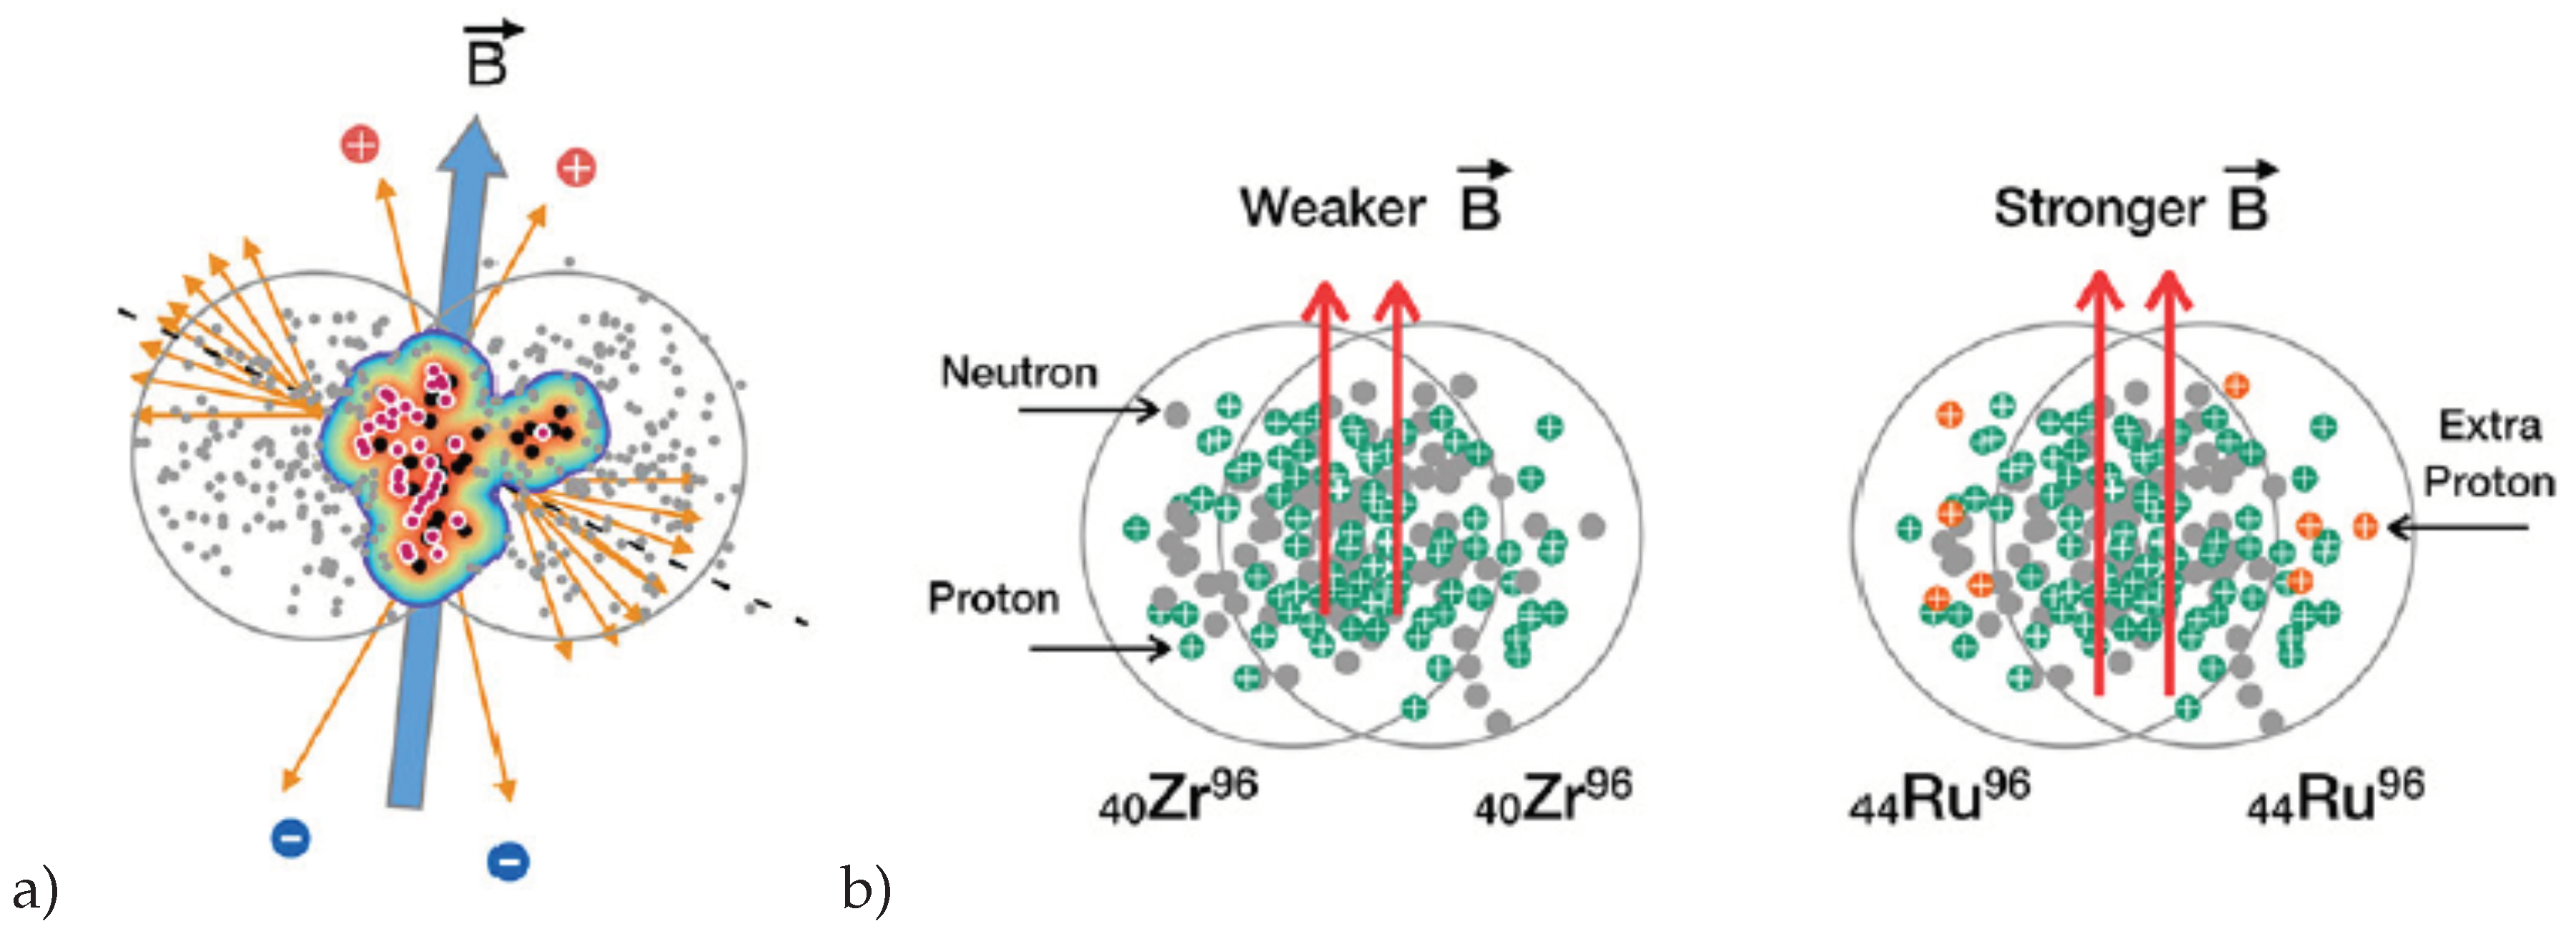
3.1. 2018 RHIC Run Is Zr + Zr and Ru + Ru, Why?
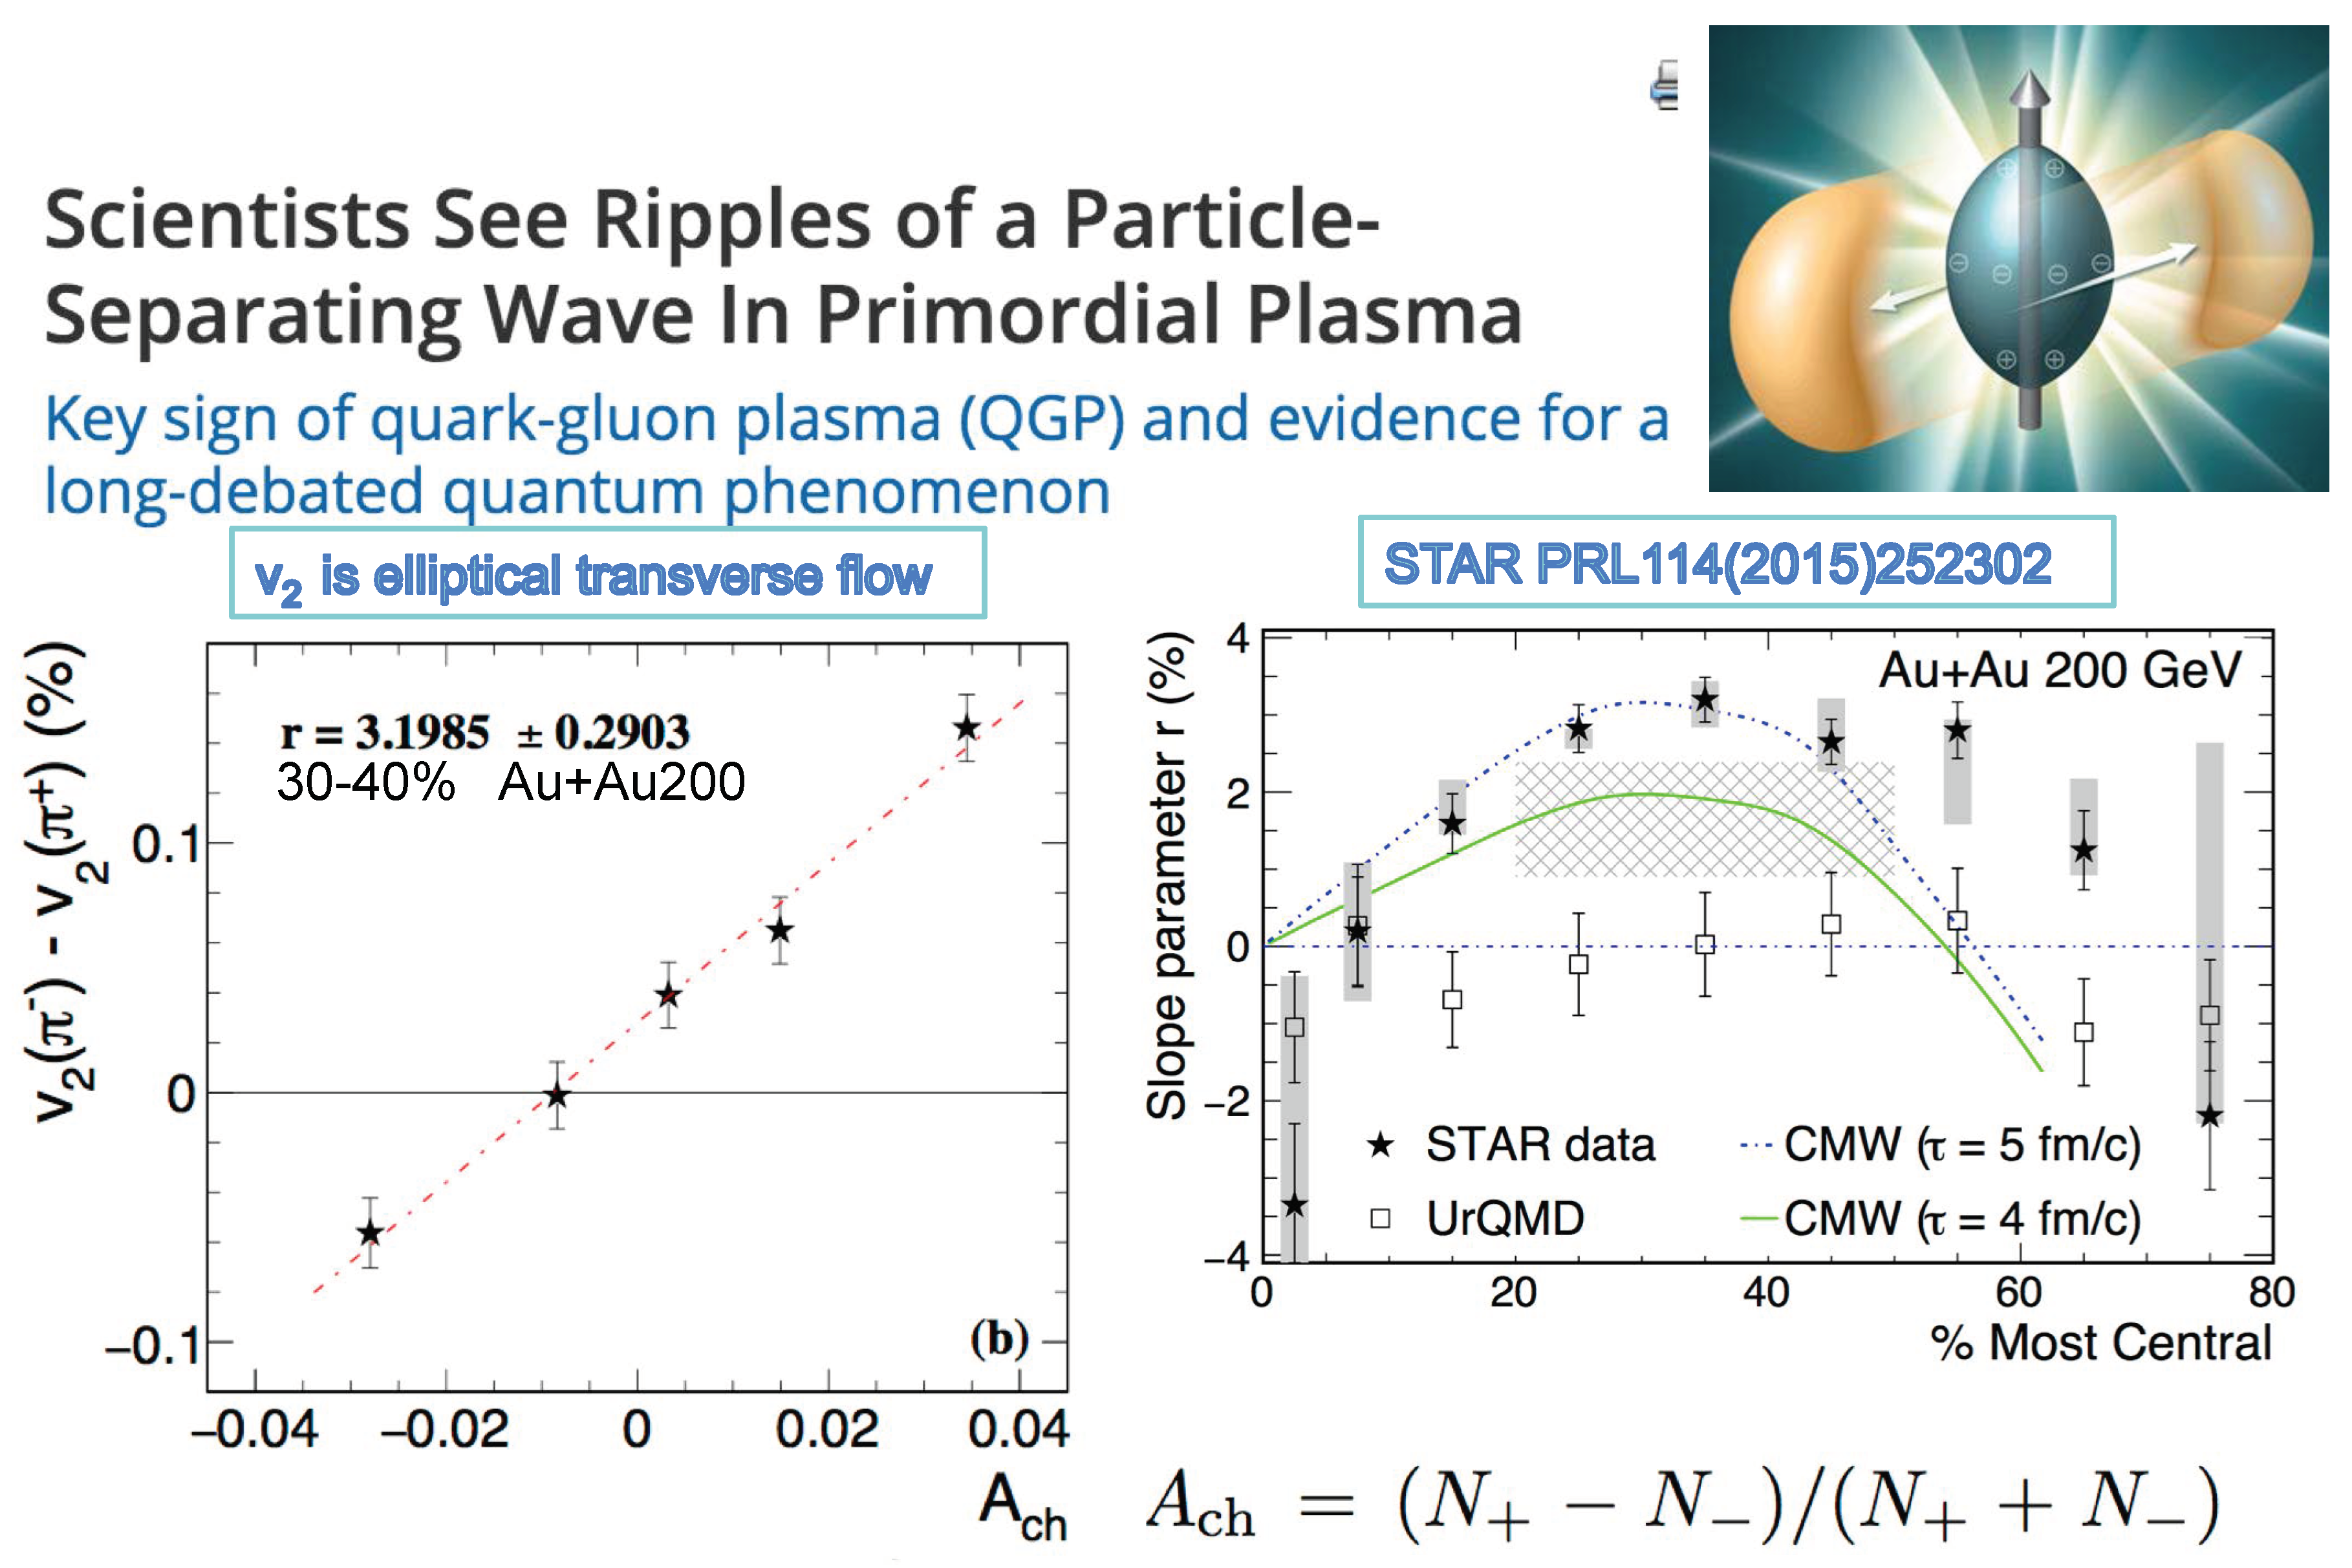
3.2. Vorticity: An Application of Particle Physics to the QGP
4. The Search for the Quark Gluon Plasma at RHIC
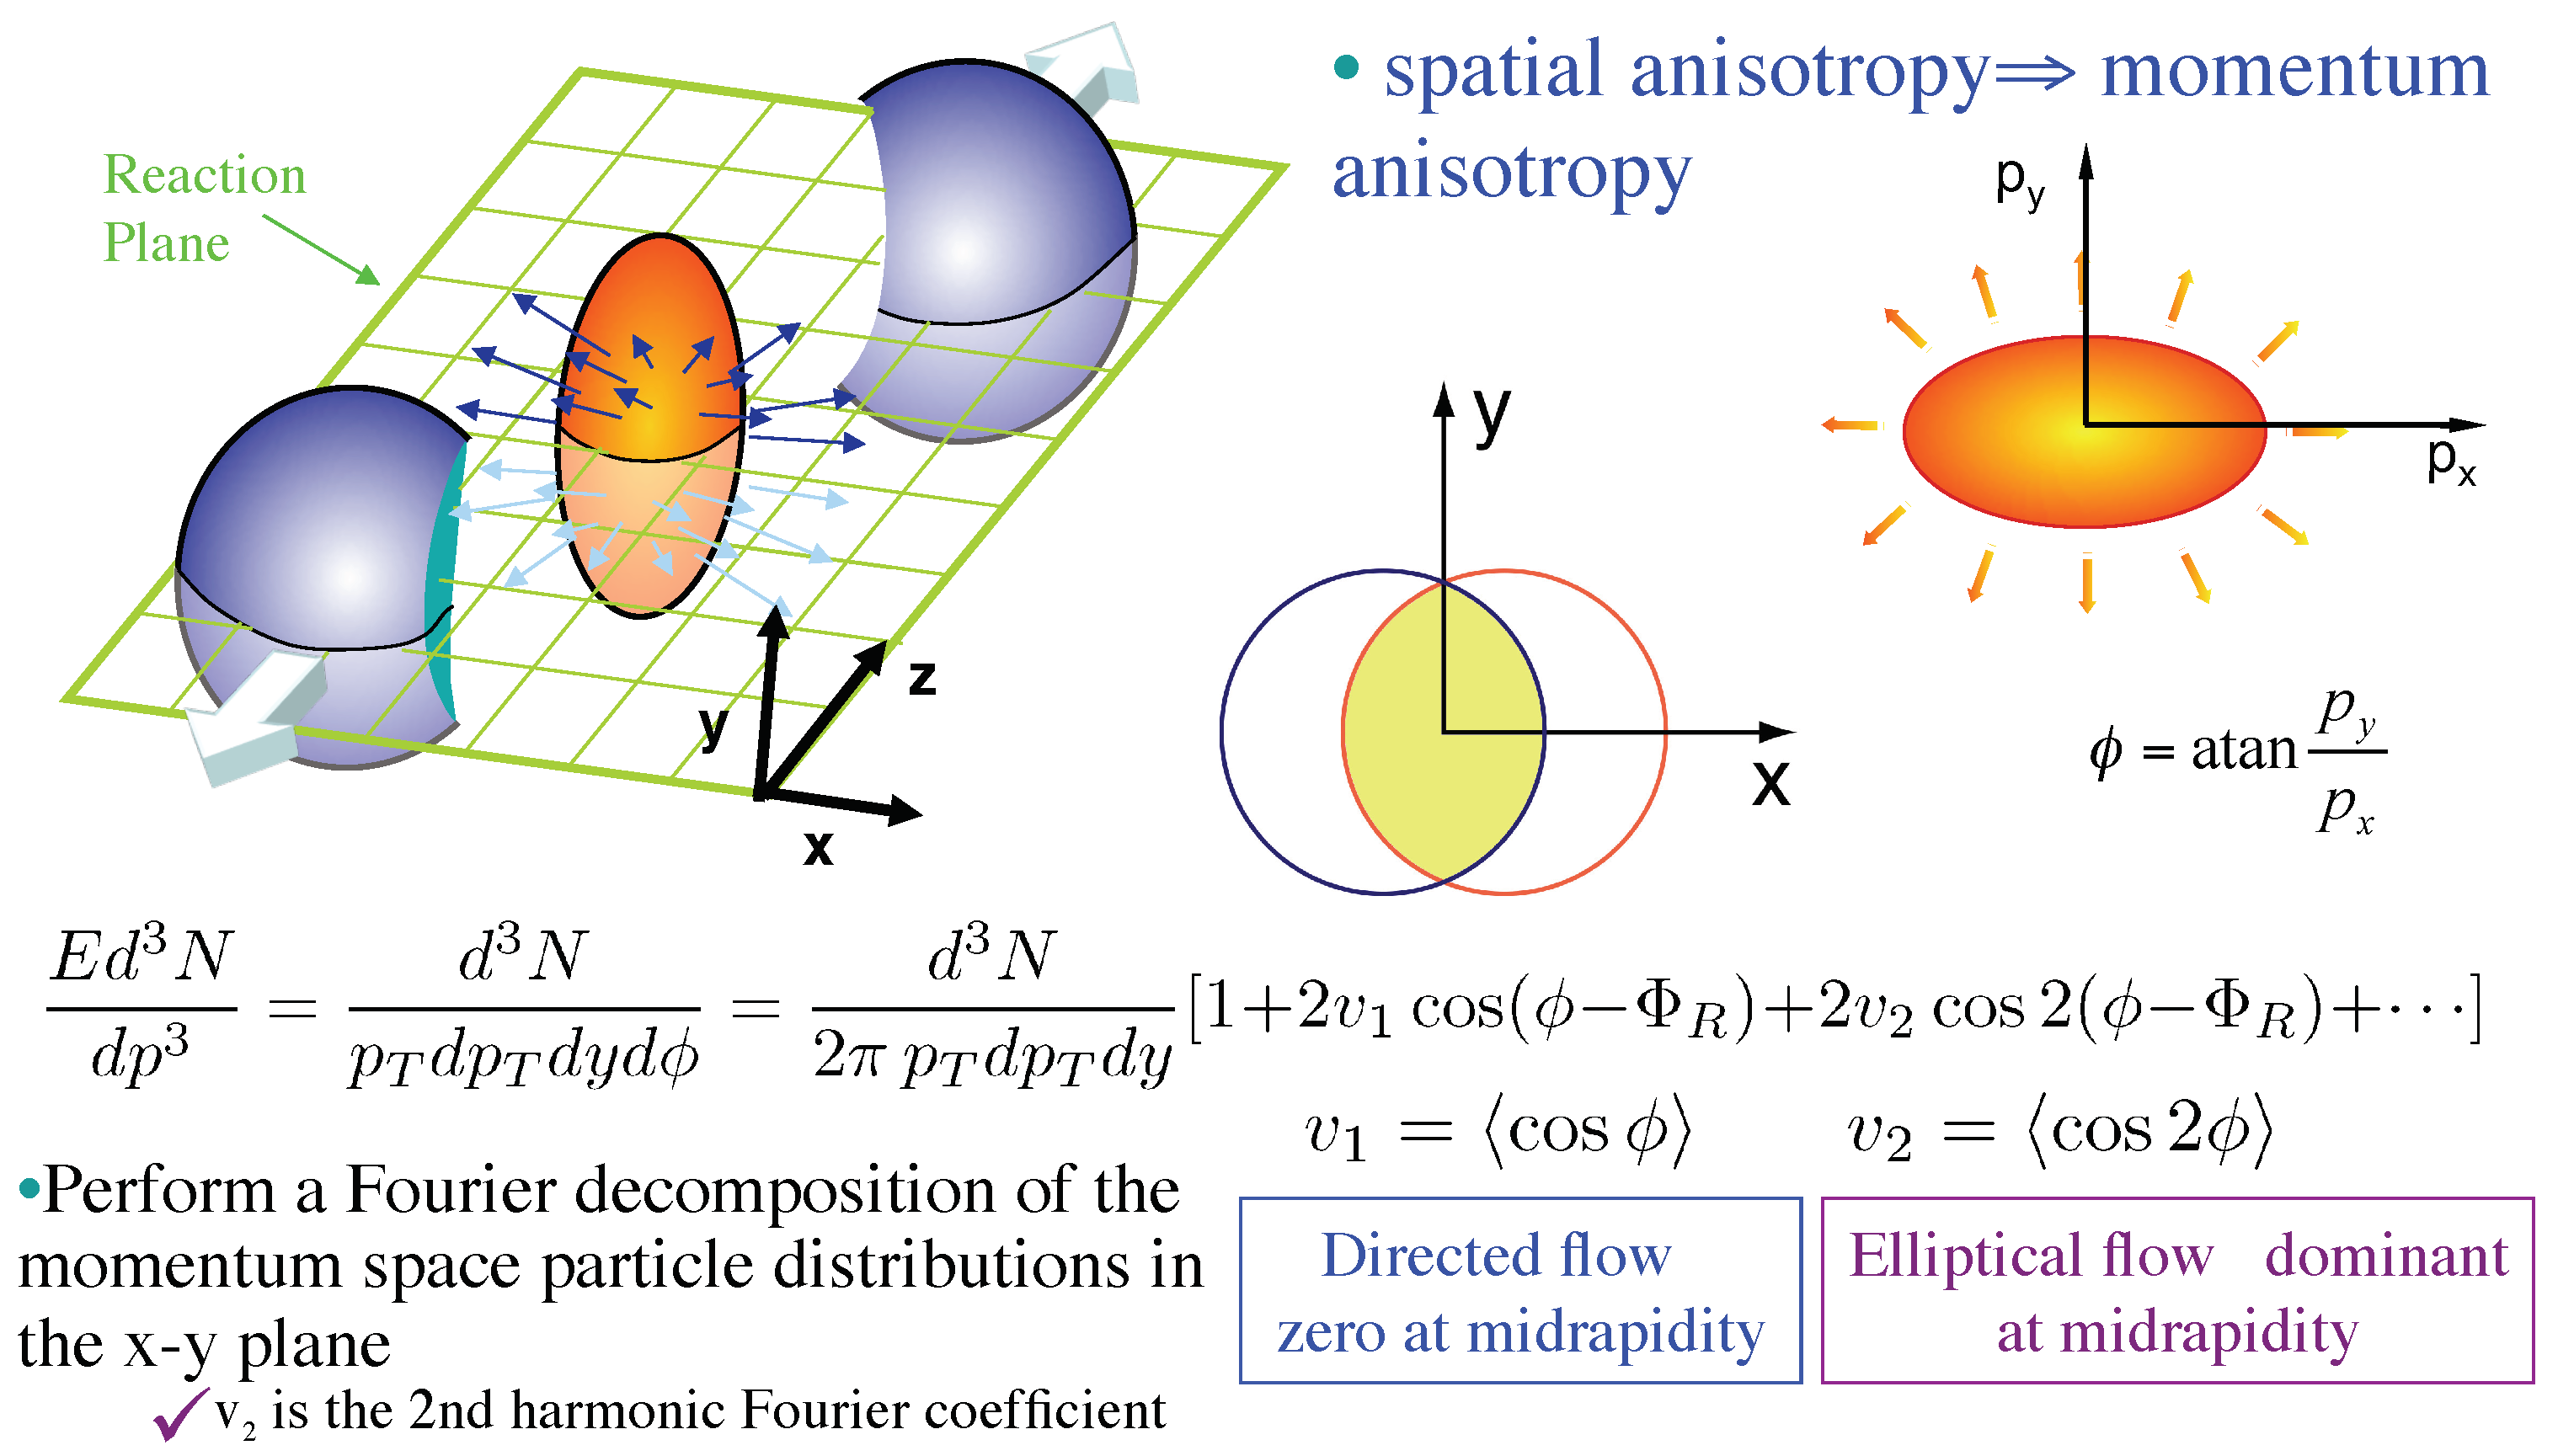
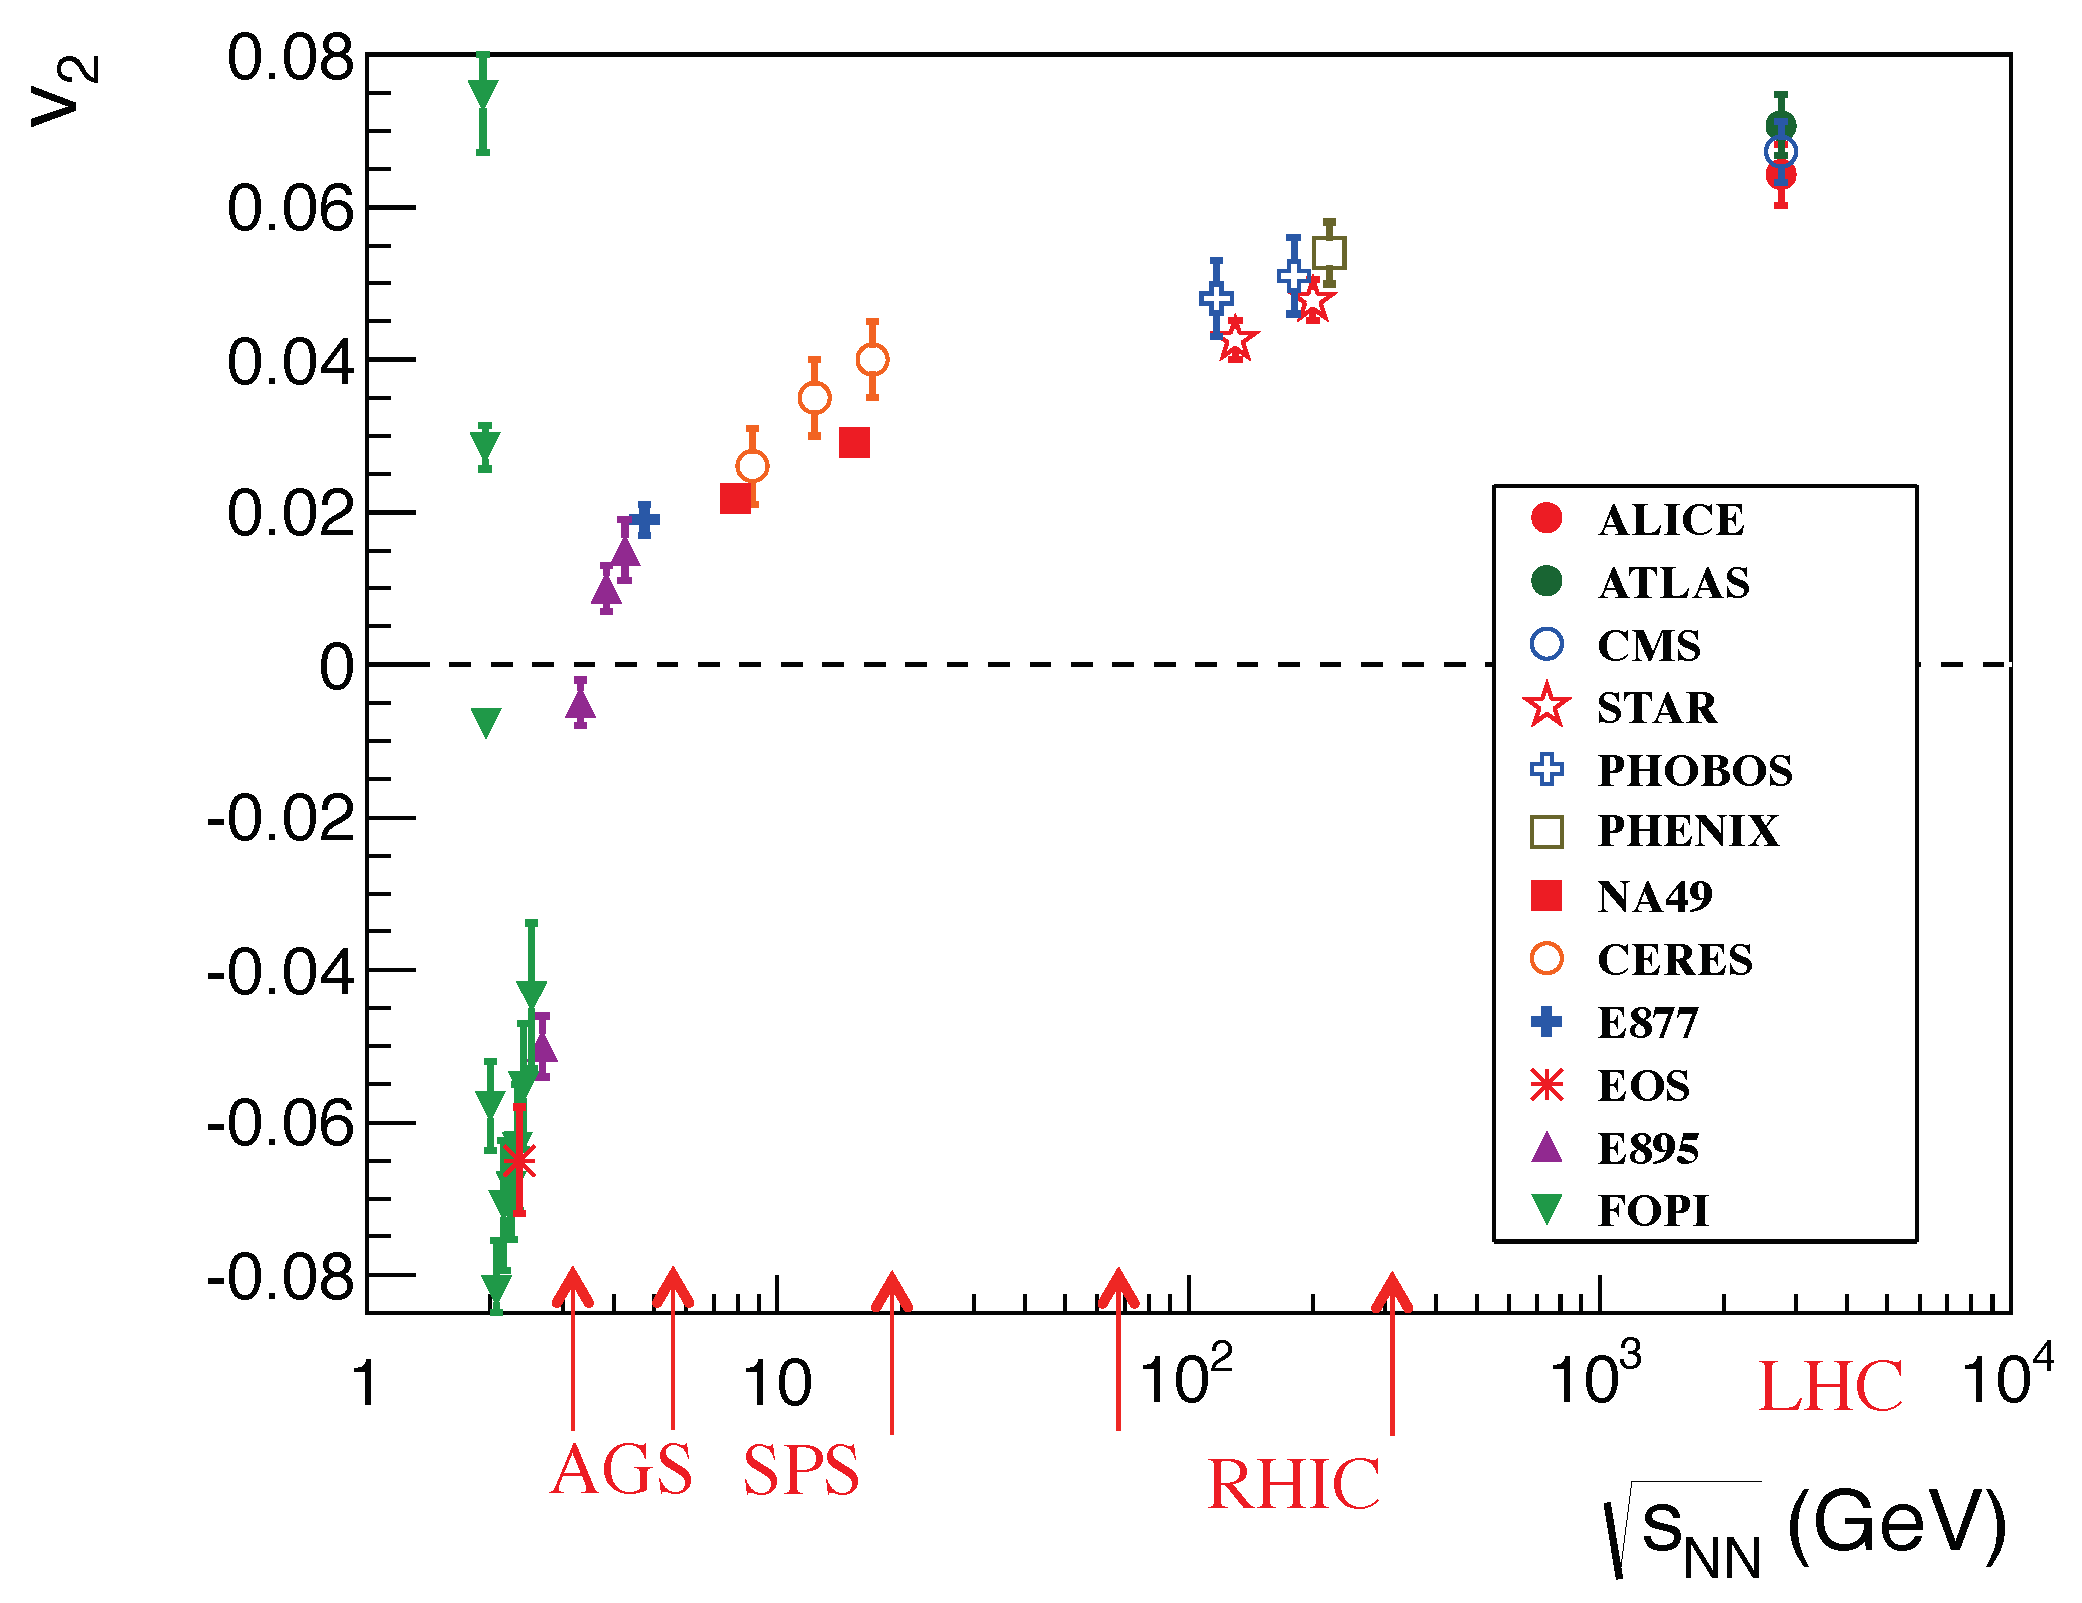
4.1. Anisotropic (Elliptical) Transverse Flow—An Interesting Complication in all A+A Collisions (Figure 24)
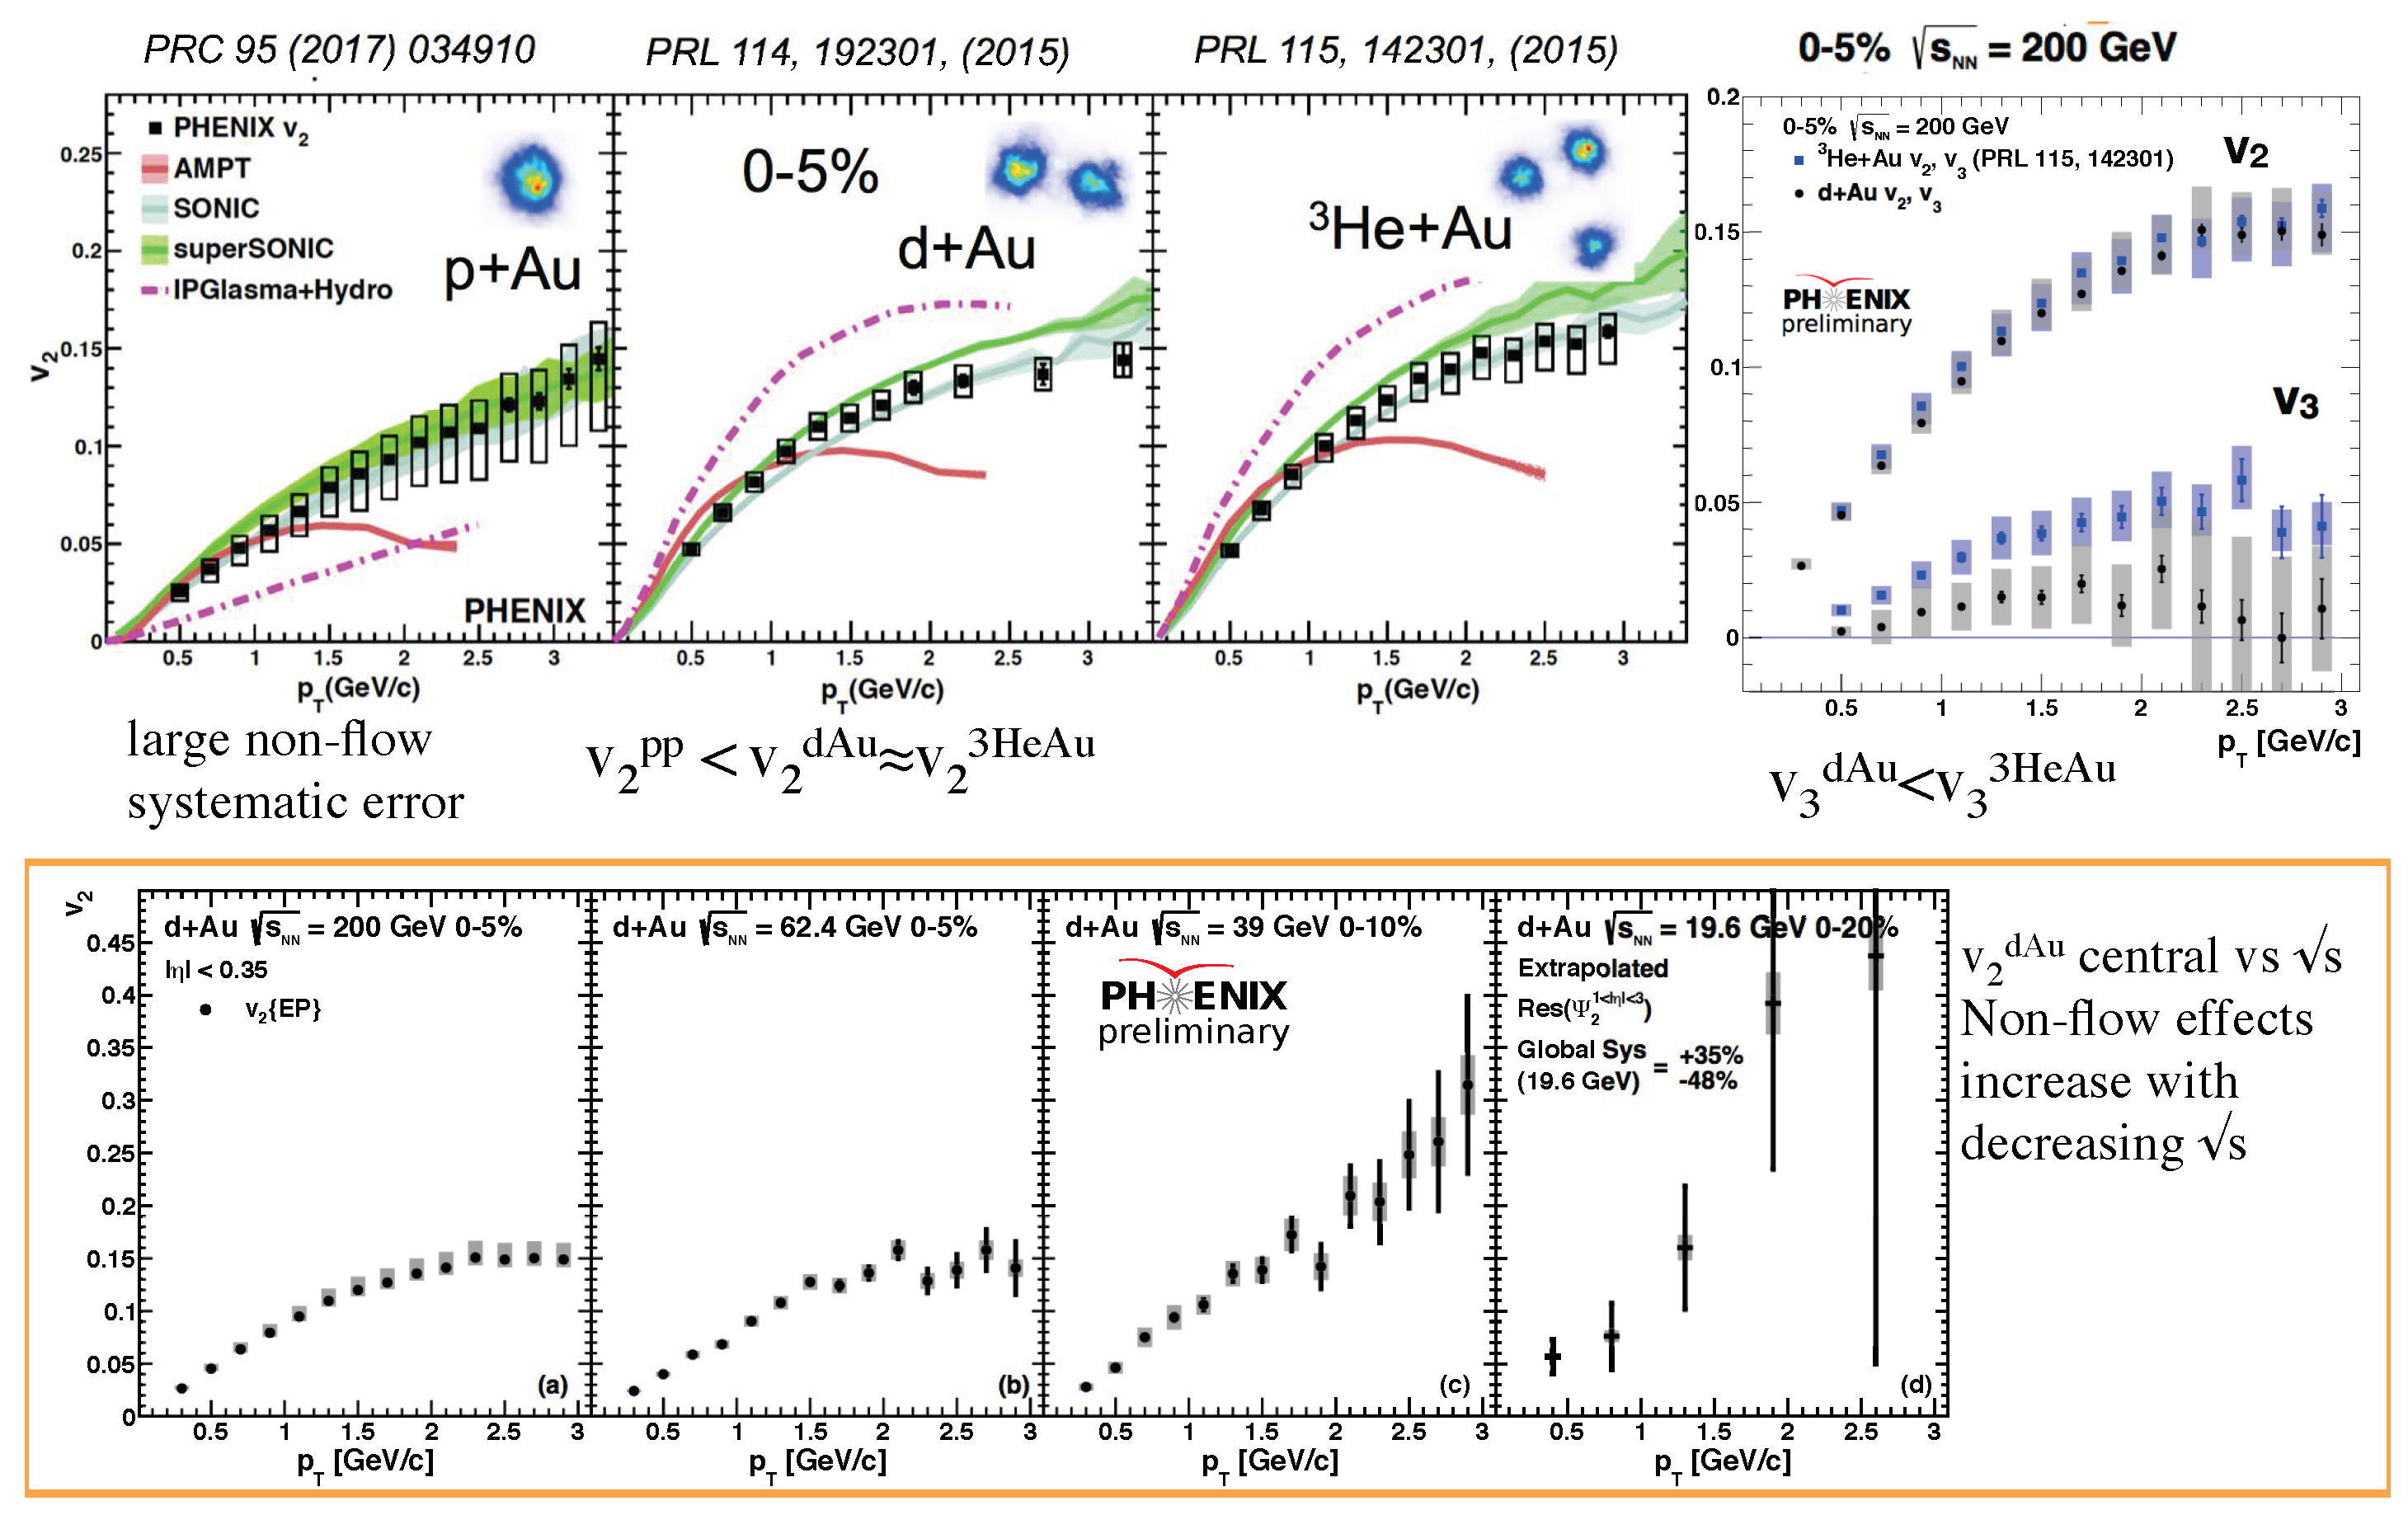
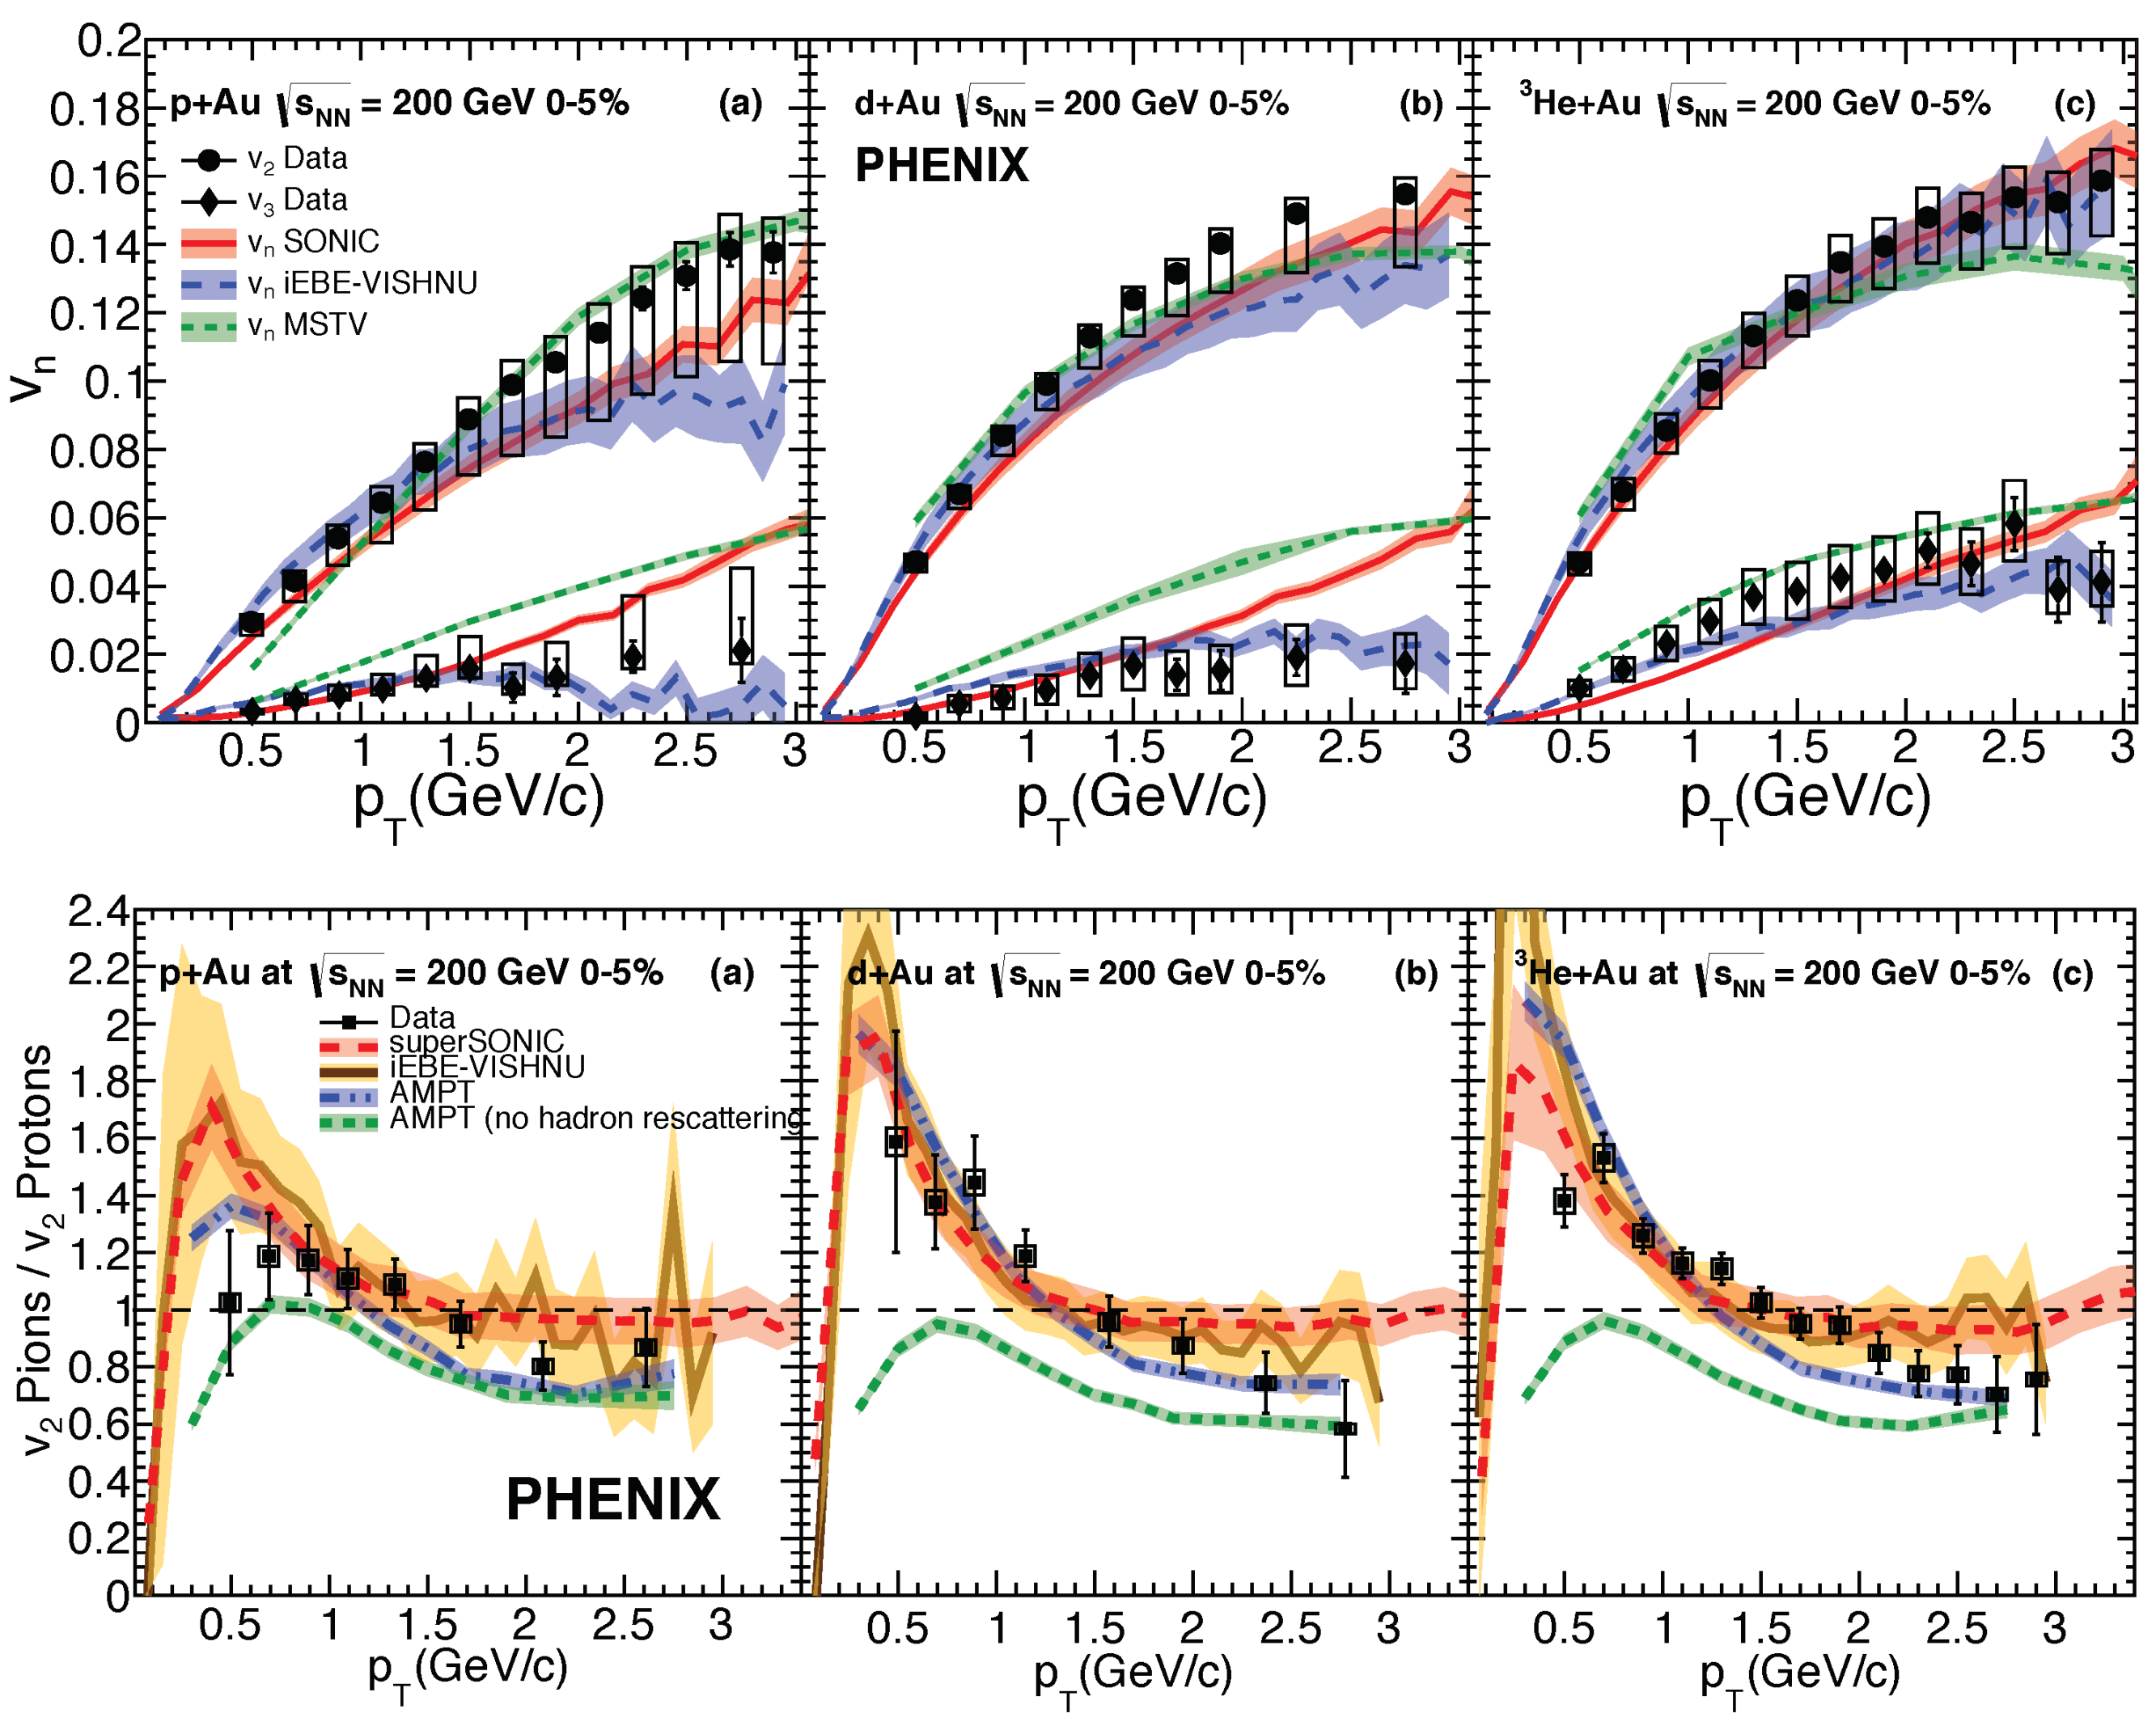
4.2. Flow Also Exists in Small Systems and Is Sensitive to the Initial Geometry
4.2.1. It Takes Two Color Strings for Collectivity—Nagle, J.; et al. [6]
4.2.2. A Fundamental Point about QCD and the String Tension
4.3. The Latest Discovery Claims “Flow” in Small Systems Is From the QGP How Did We Find the QGP in the First Place?
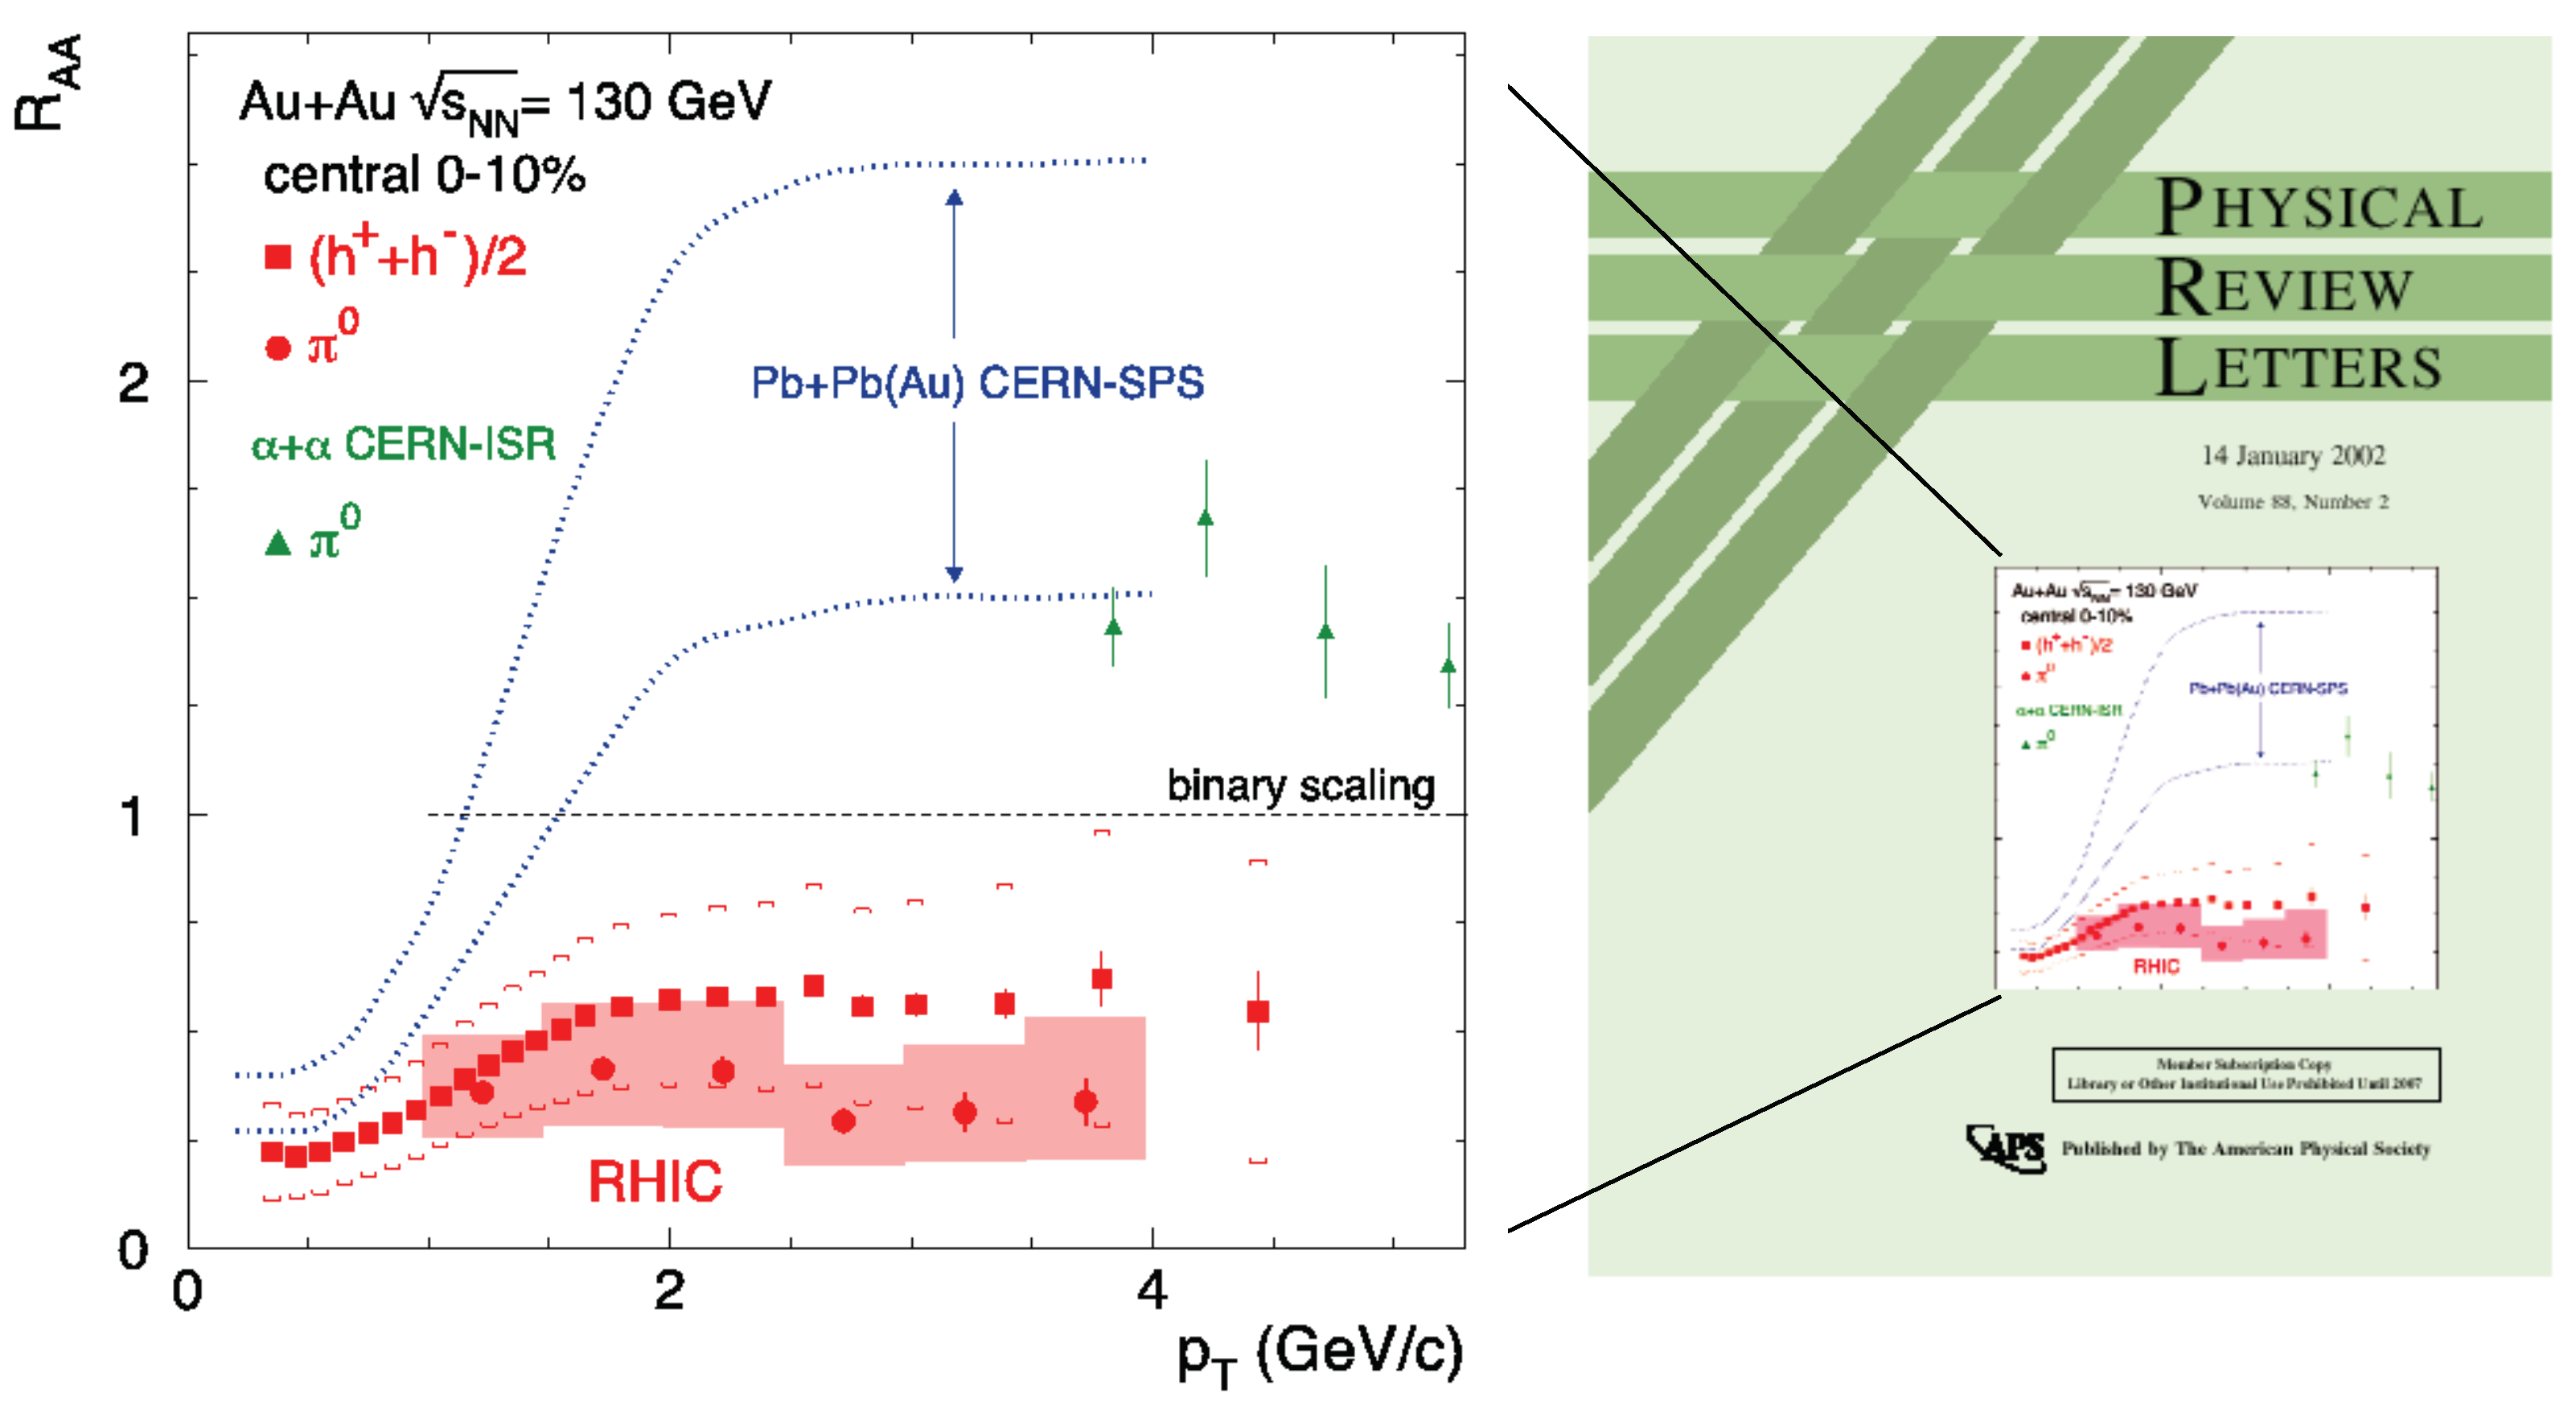
4.3.1. Suppression, 1986
4.3.2. Jet Quenching by Coherent LPM Radiative Energy Loss of a Parton in the QGP, 1997
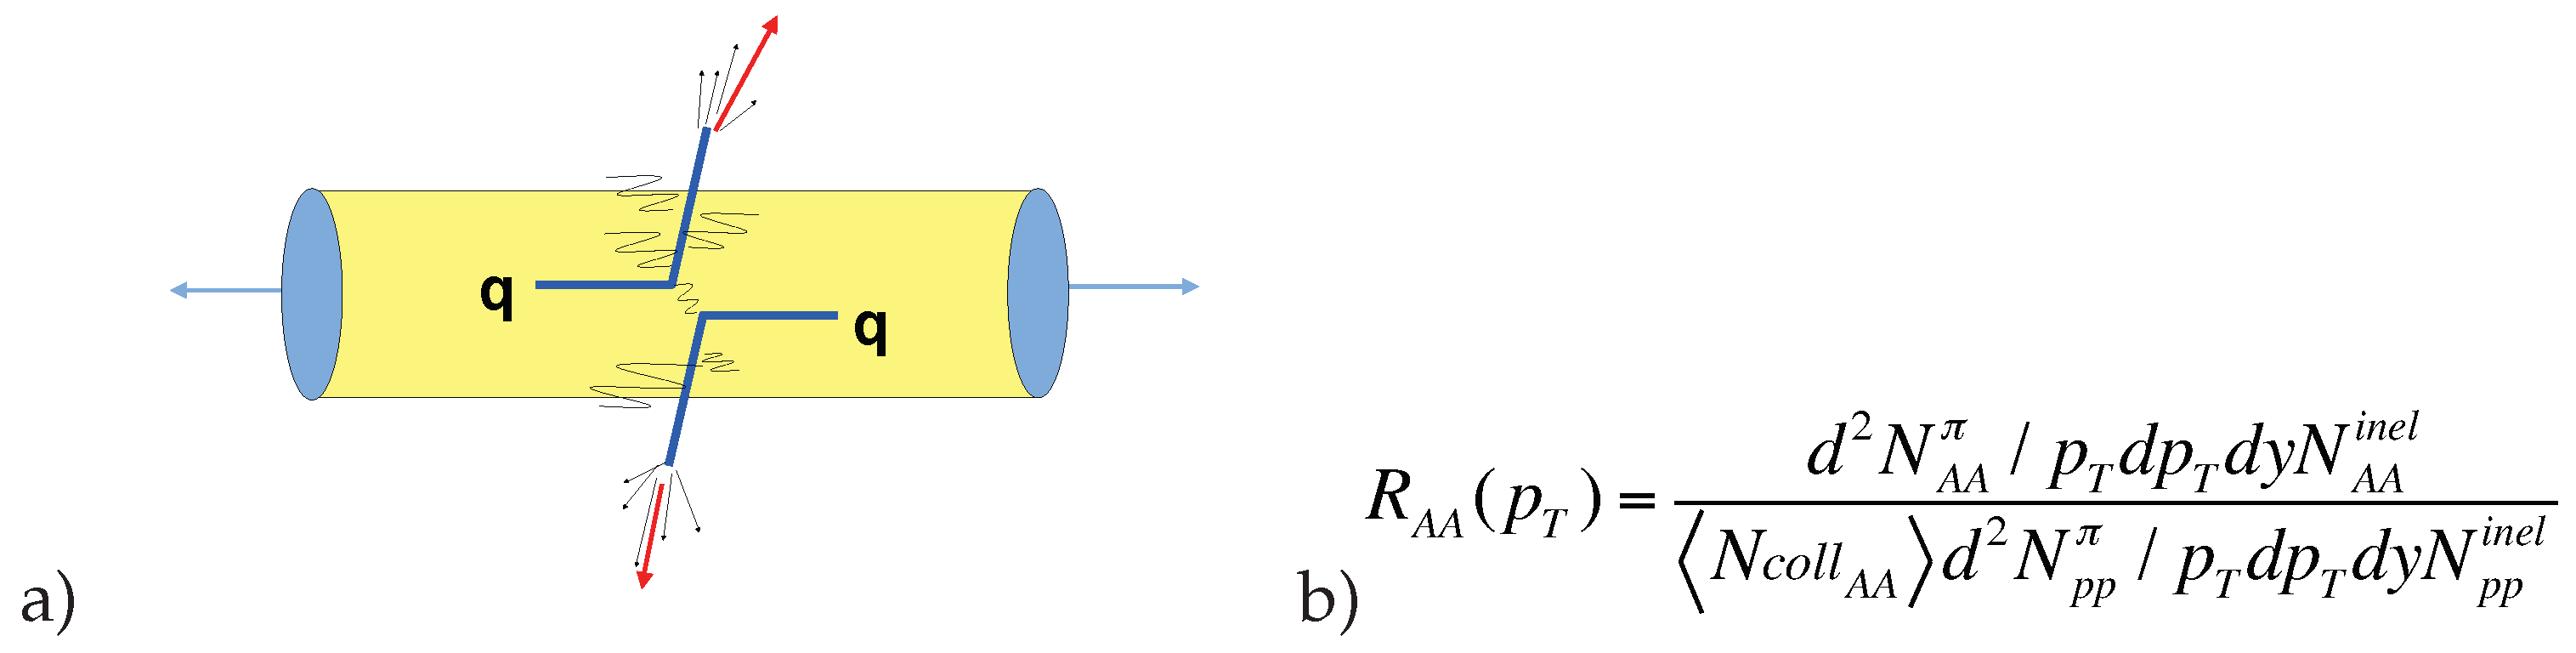
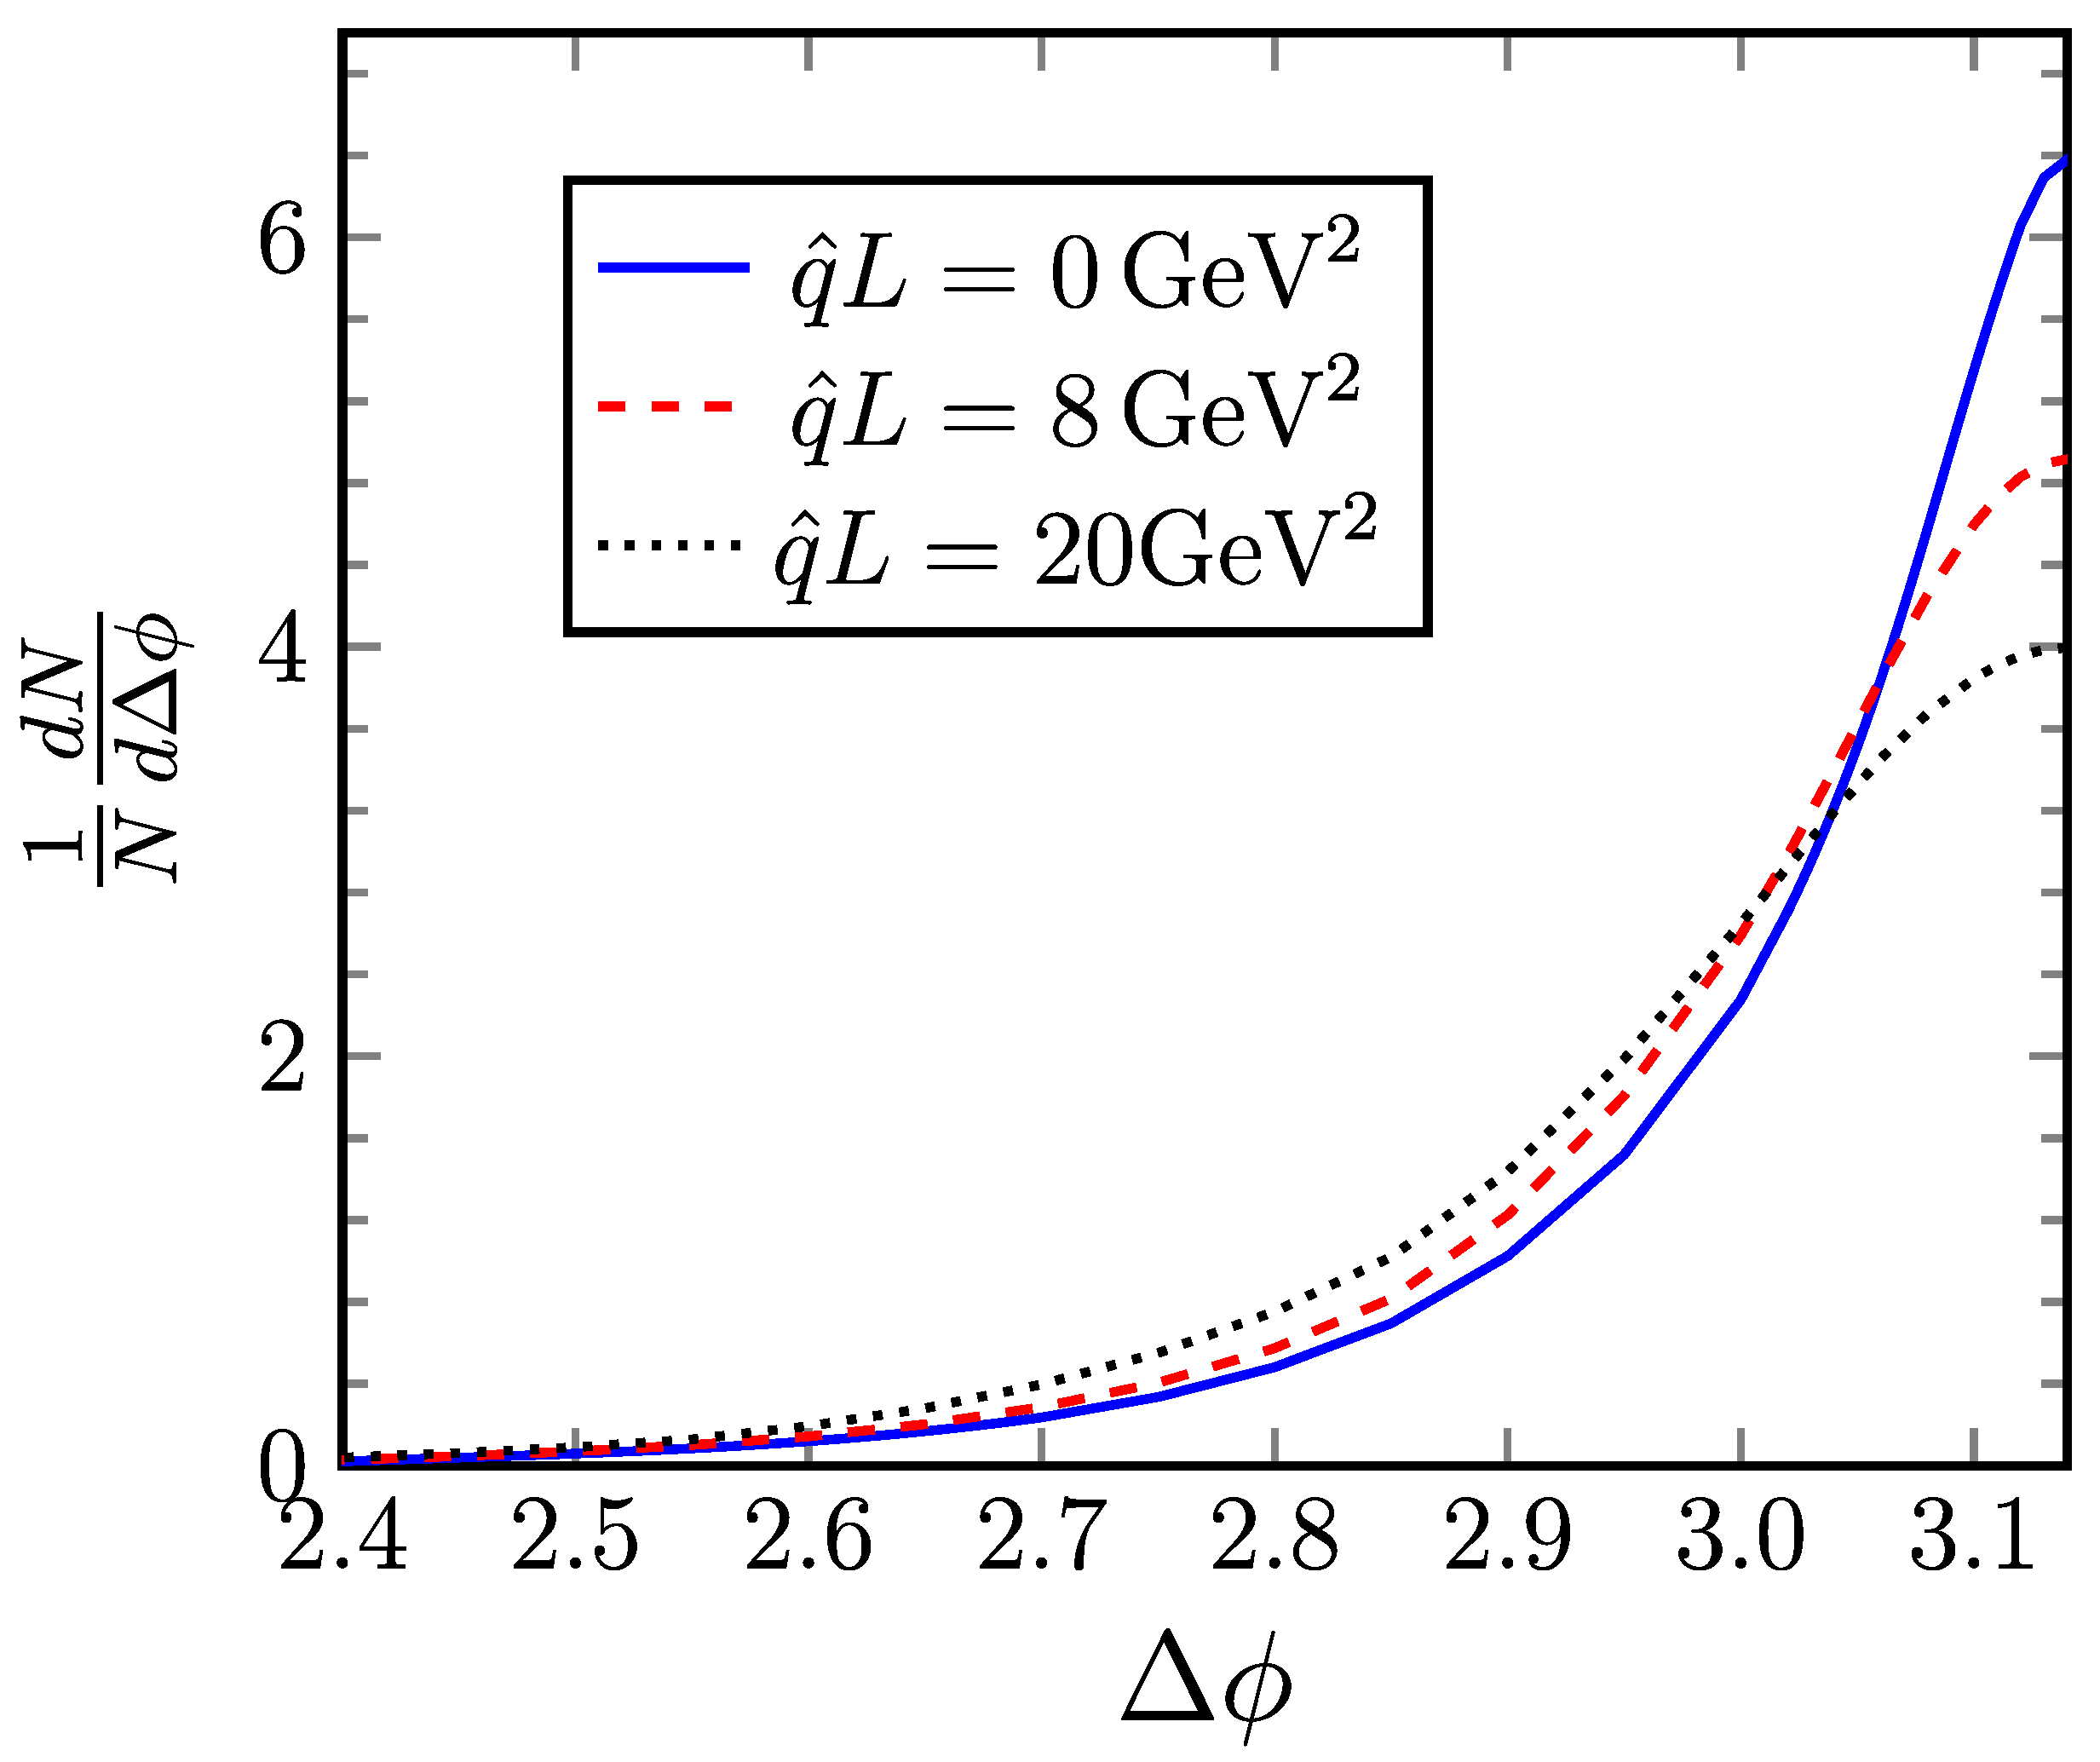
4.4. BDMPSZ: The Cone, the Energy Loss, Azimuthal Broadening, Is the QGP Signature
5. Jet Quenching at RHIC, the Discovery of the QGP
5.1. Status of in Au+Au at = 200 GeV
5.2. Recent Measurements to Test the Second BDMPSZ Prediction
5.2.1. The Key New Idea of Instead of in Equation (3)
5.2.2. A Test of Equation (5) for
5.2.3. How to Calculate with Equation (4) from Di-Hadron Measurements
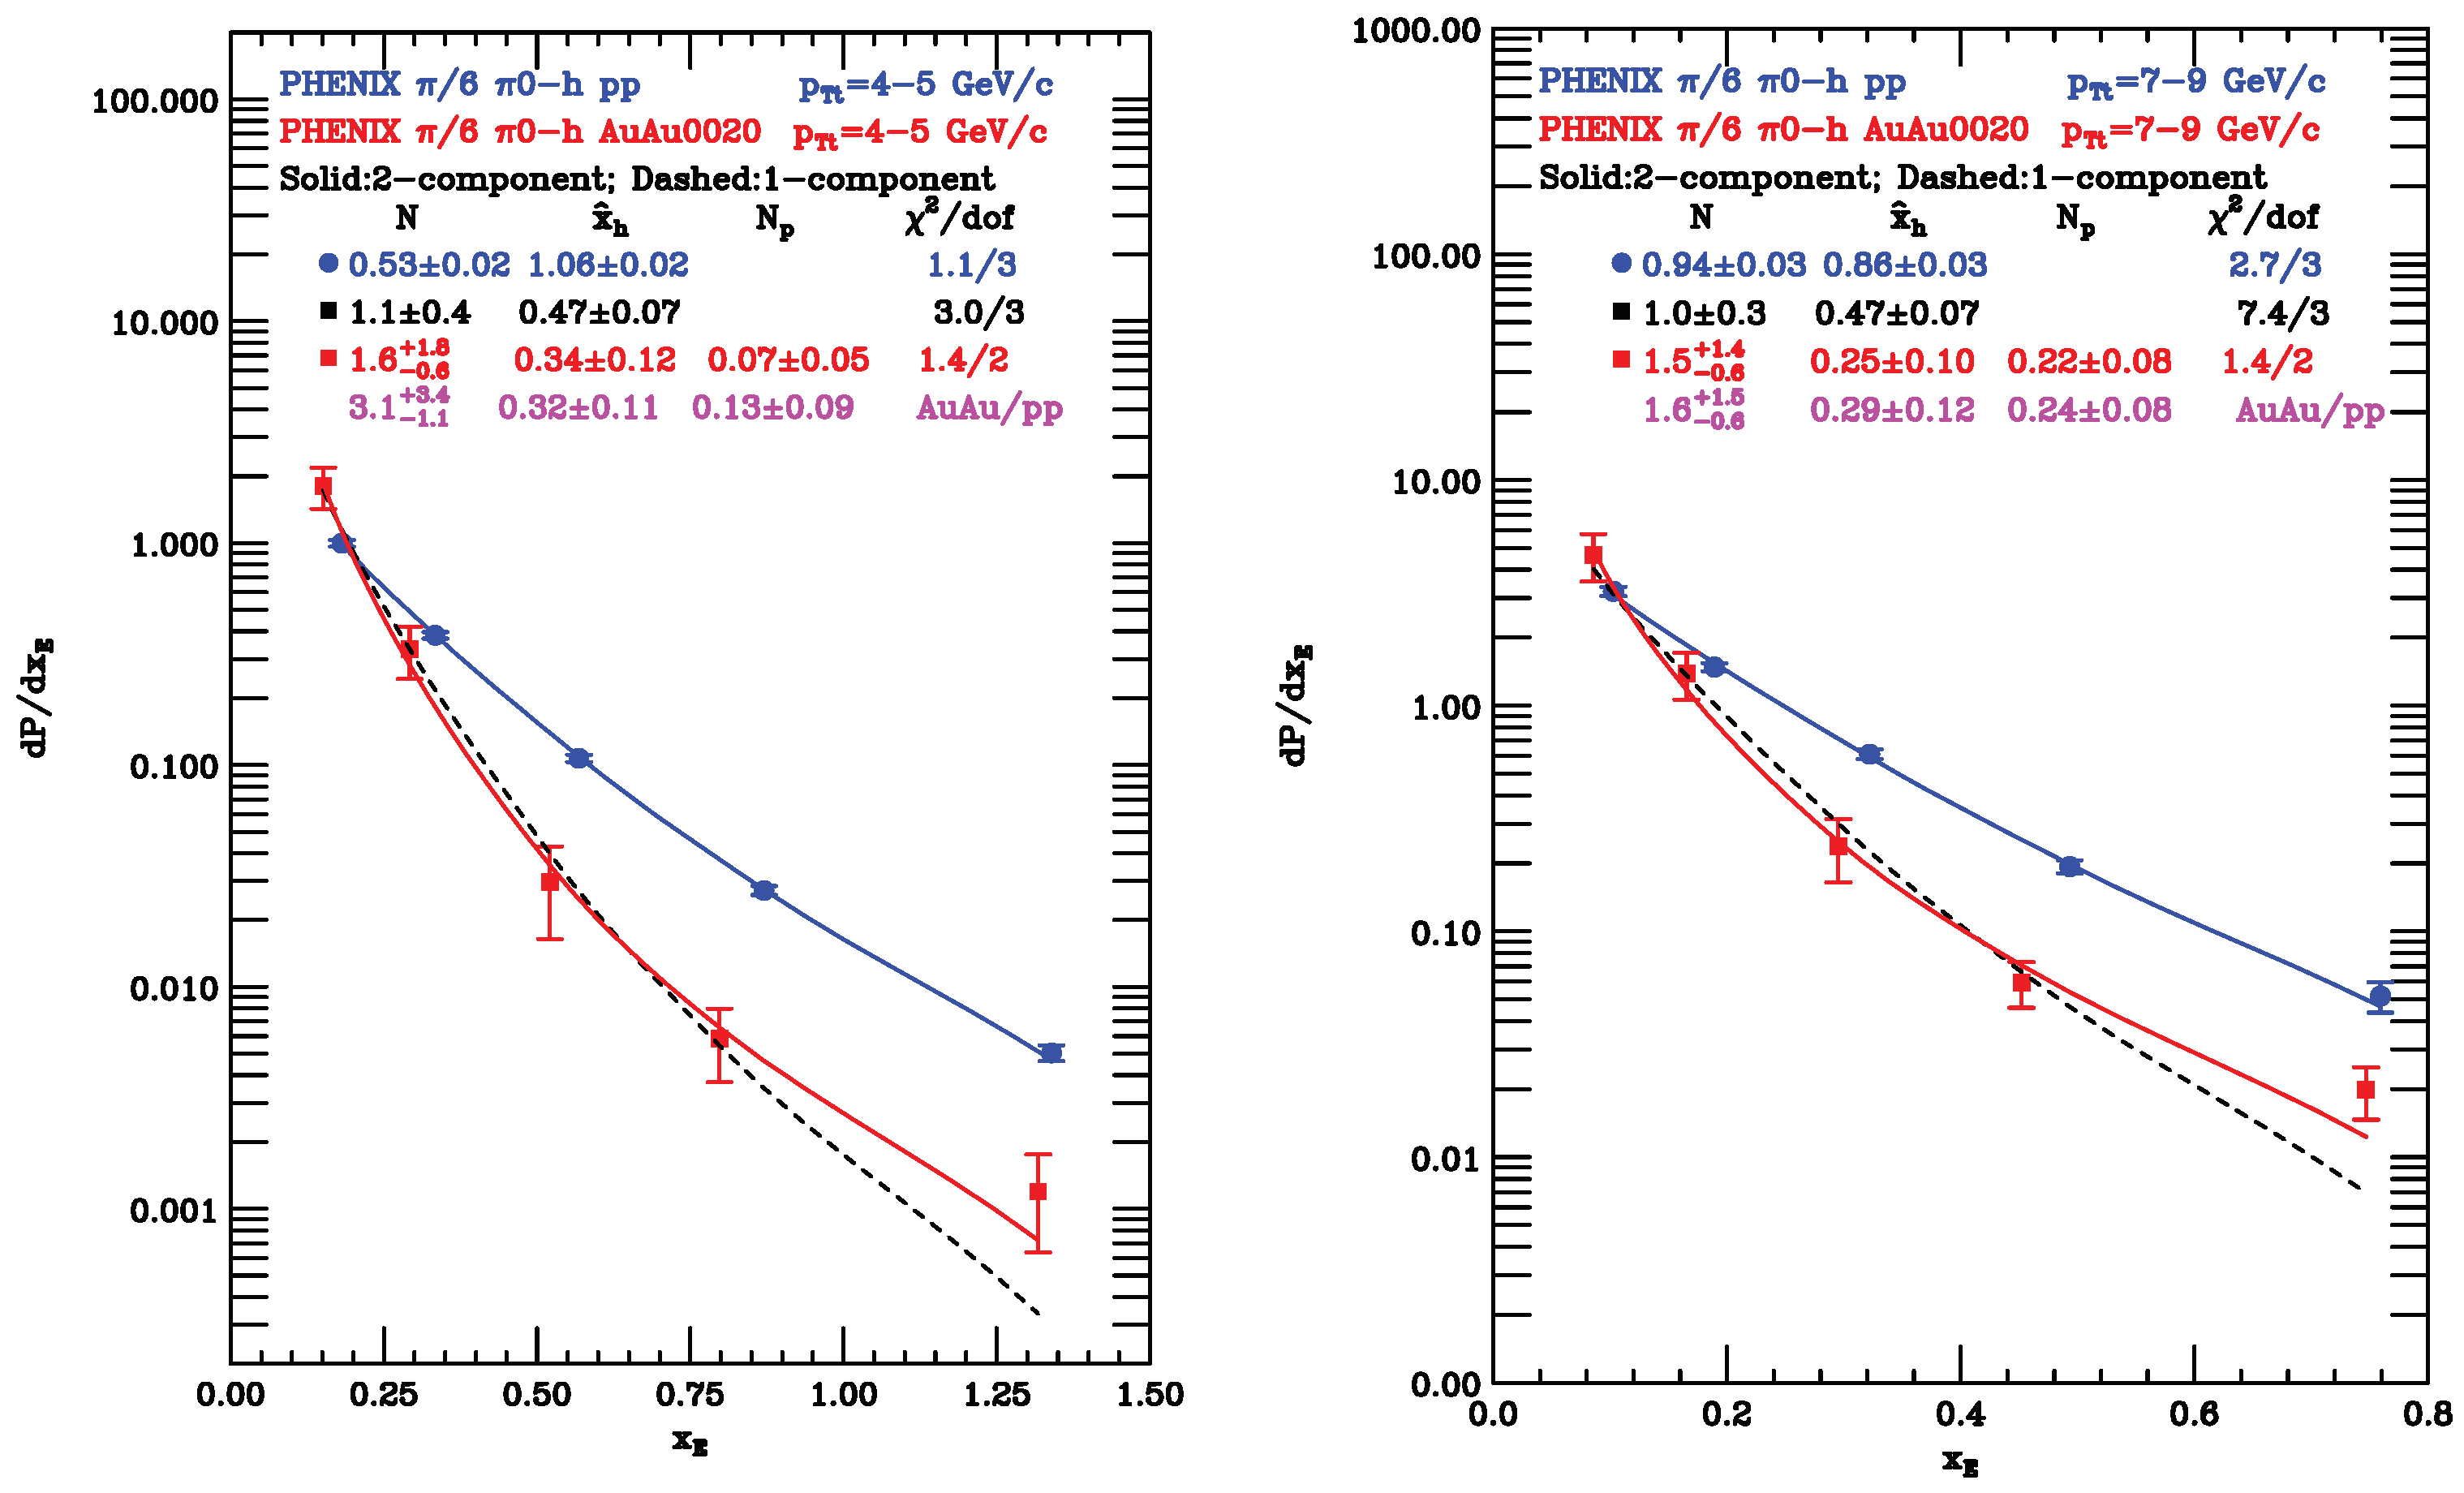
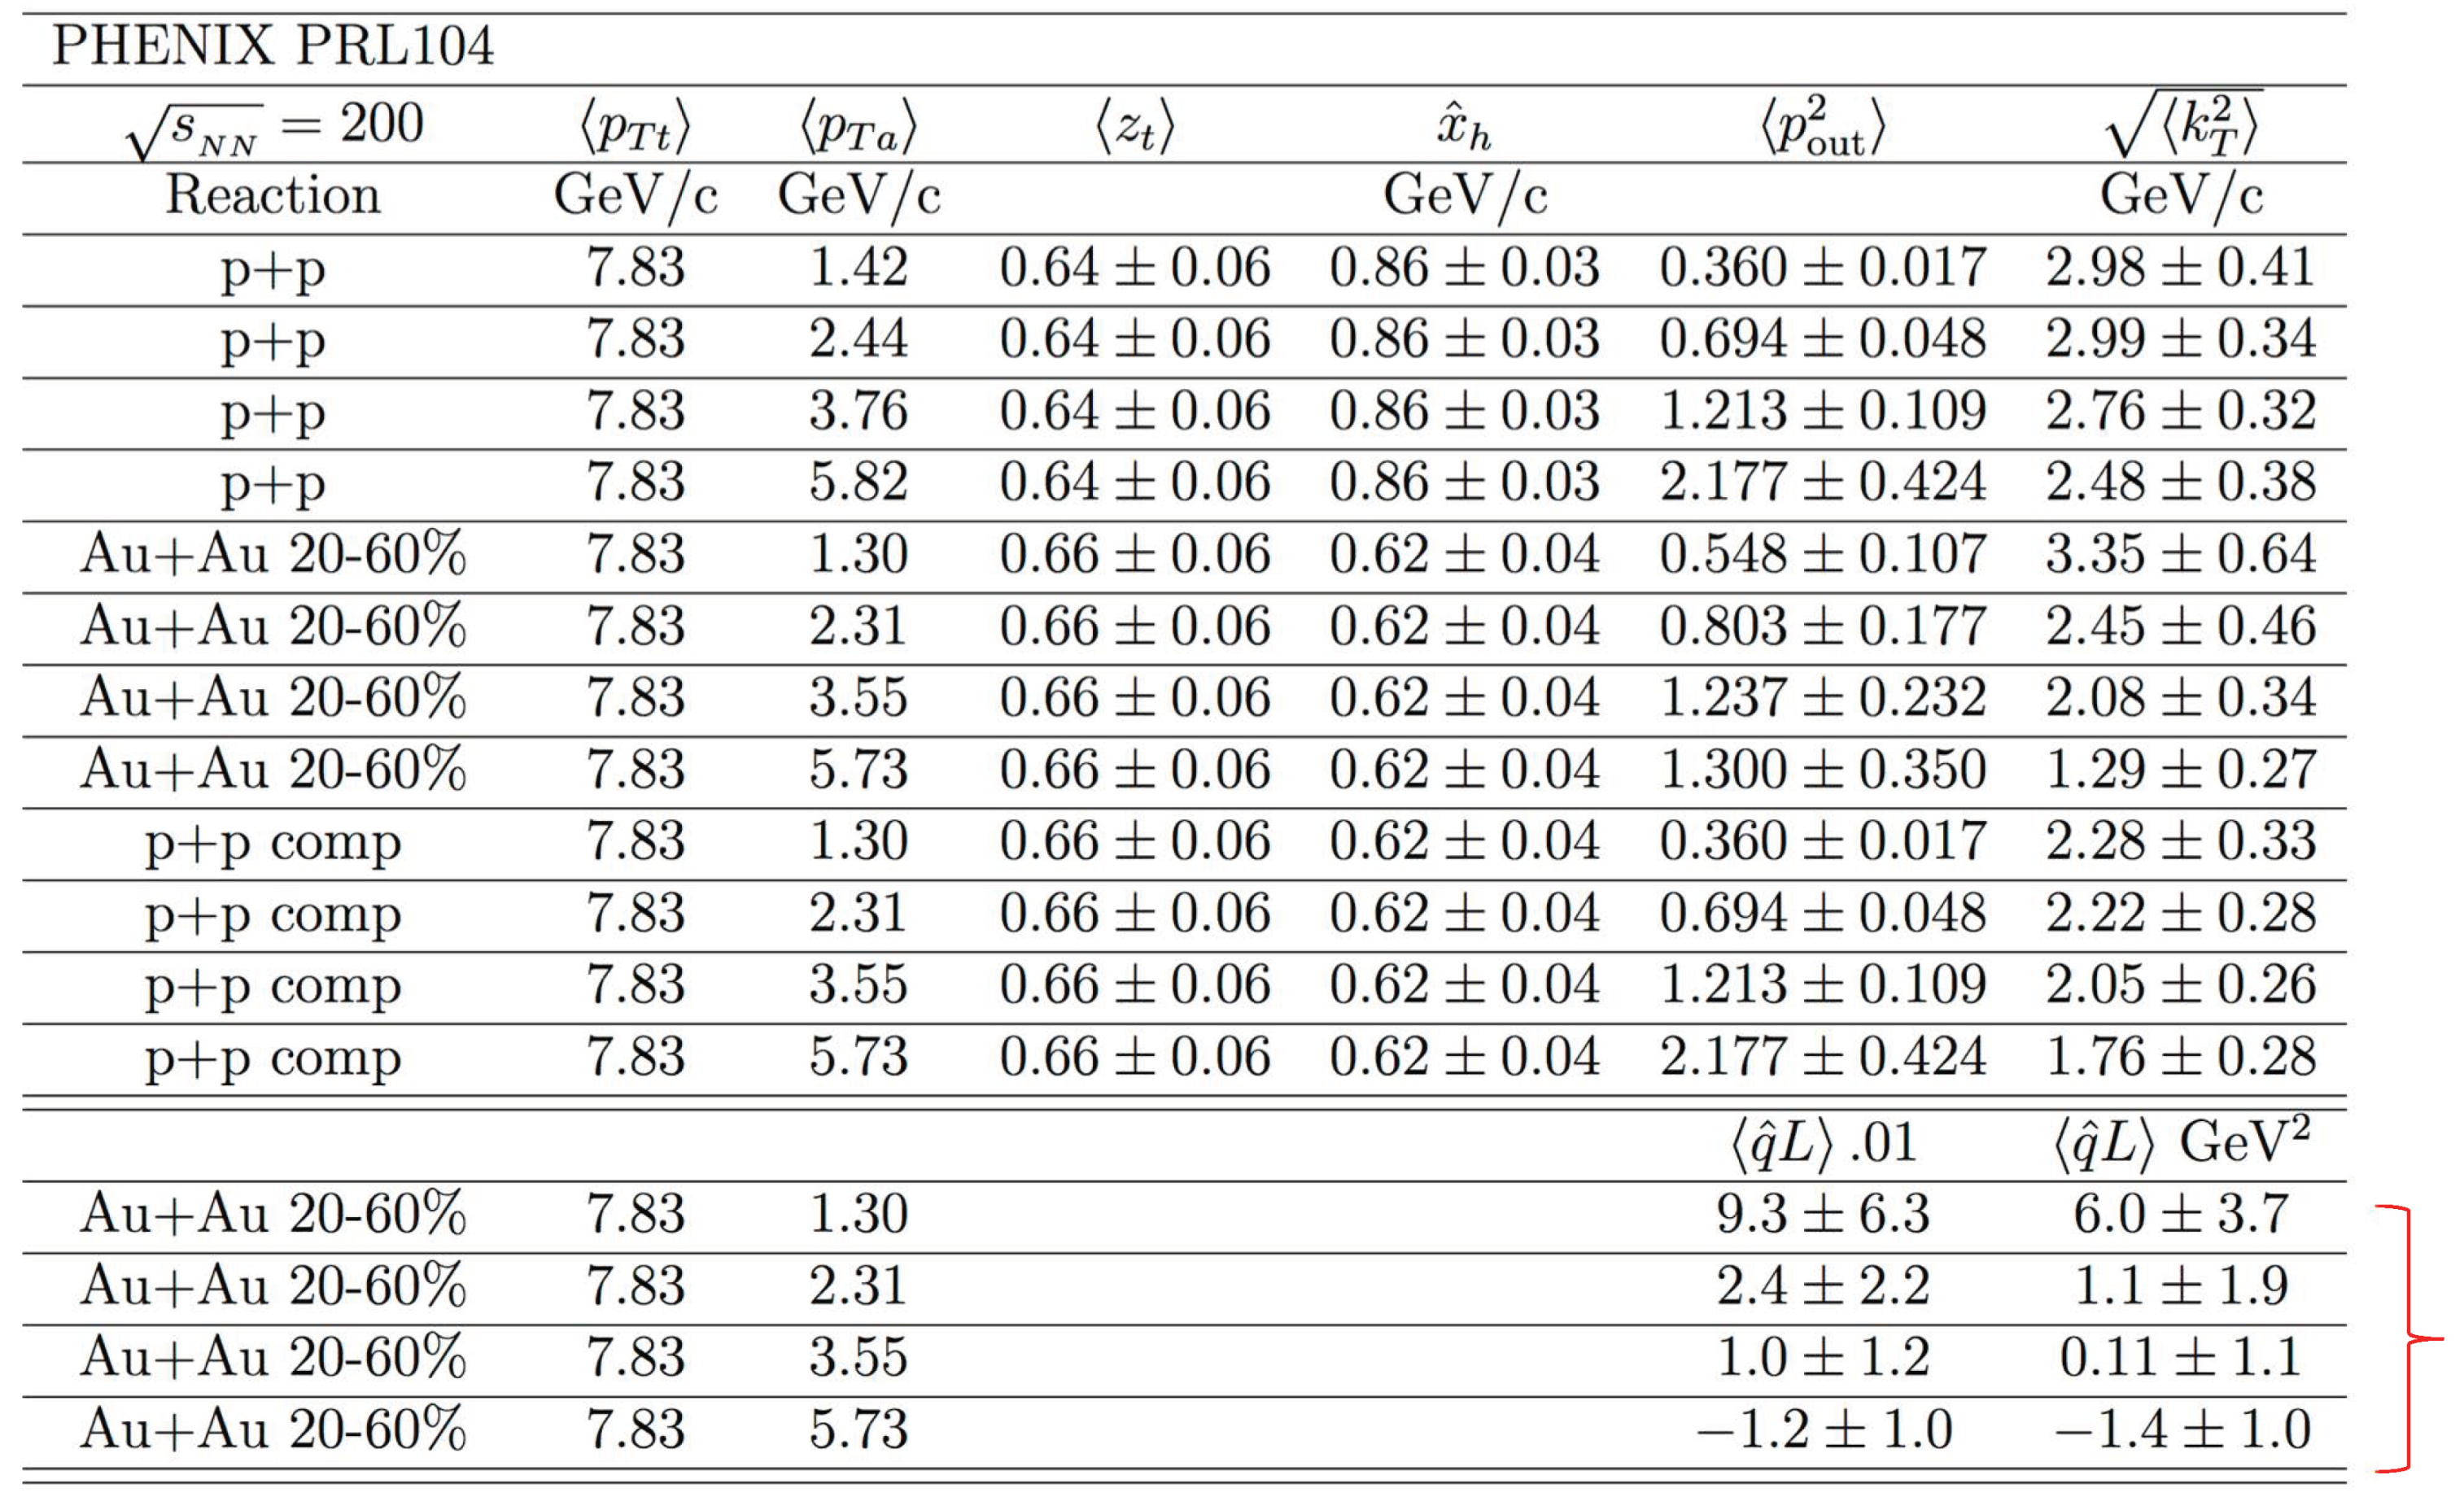
5.2.4. Example: from Fits to the PHENIX Data from Ref. [26]
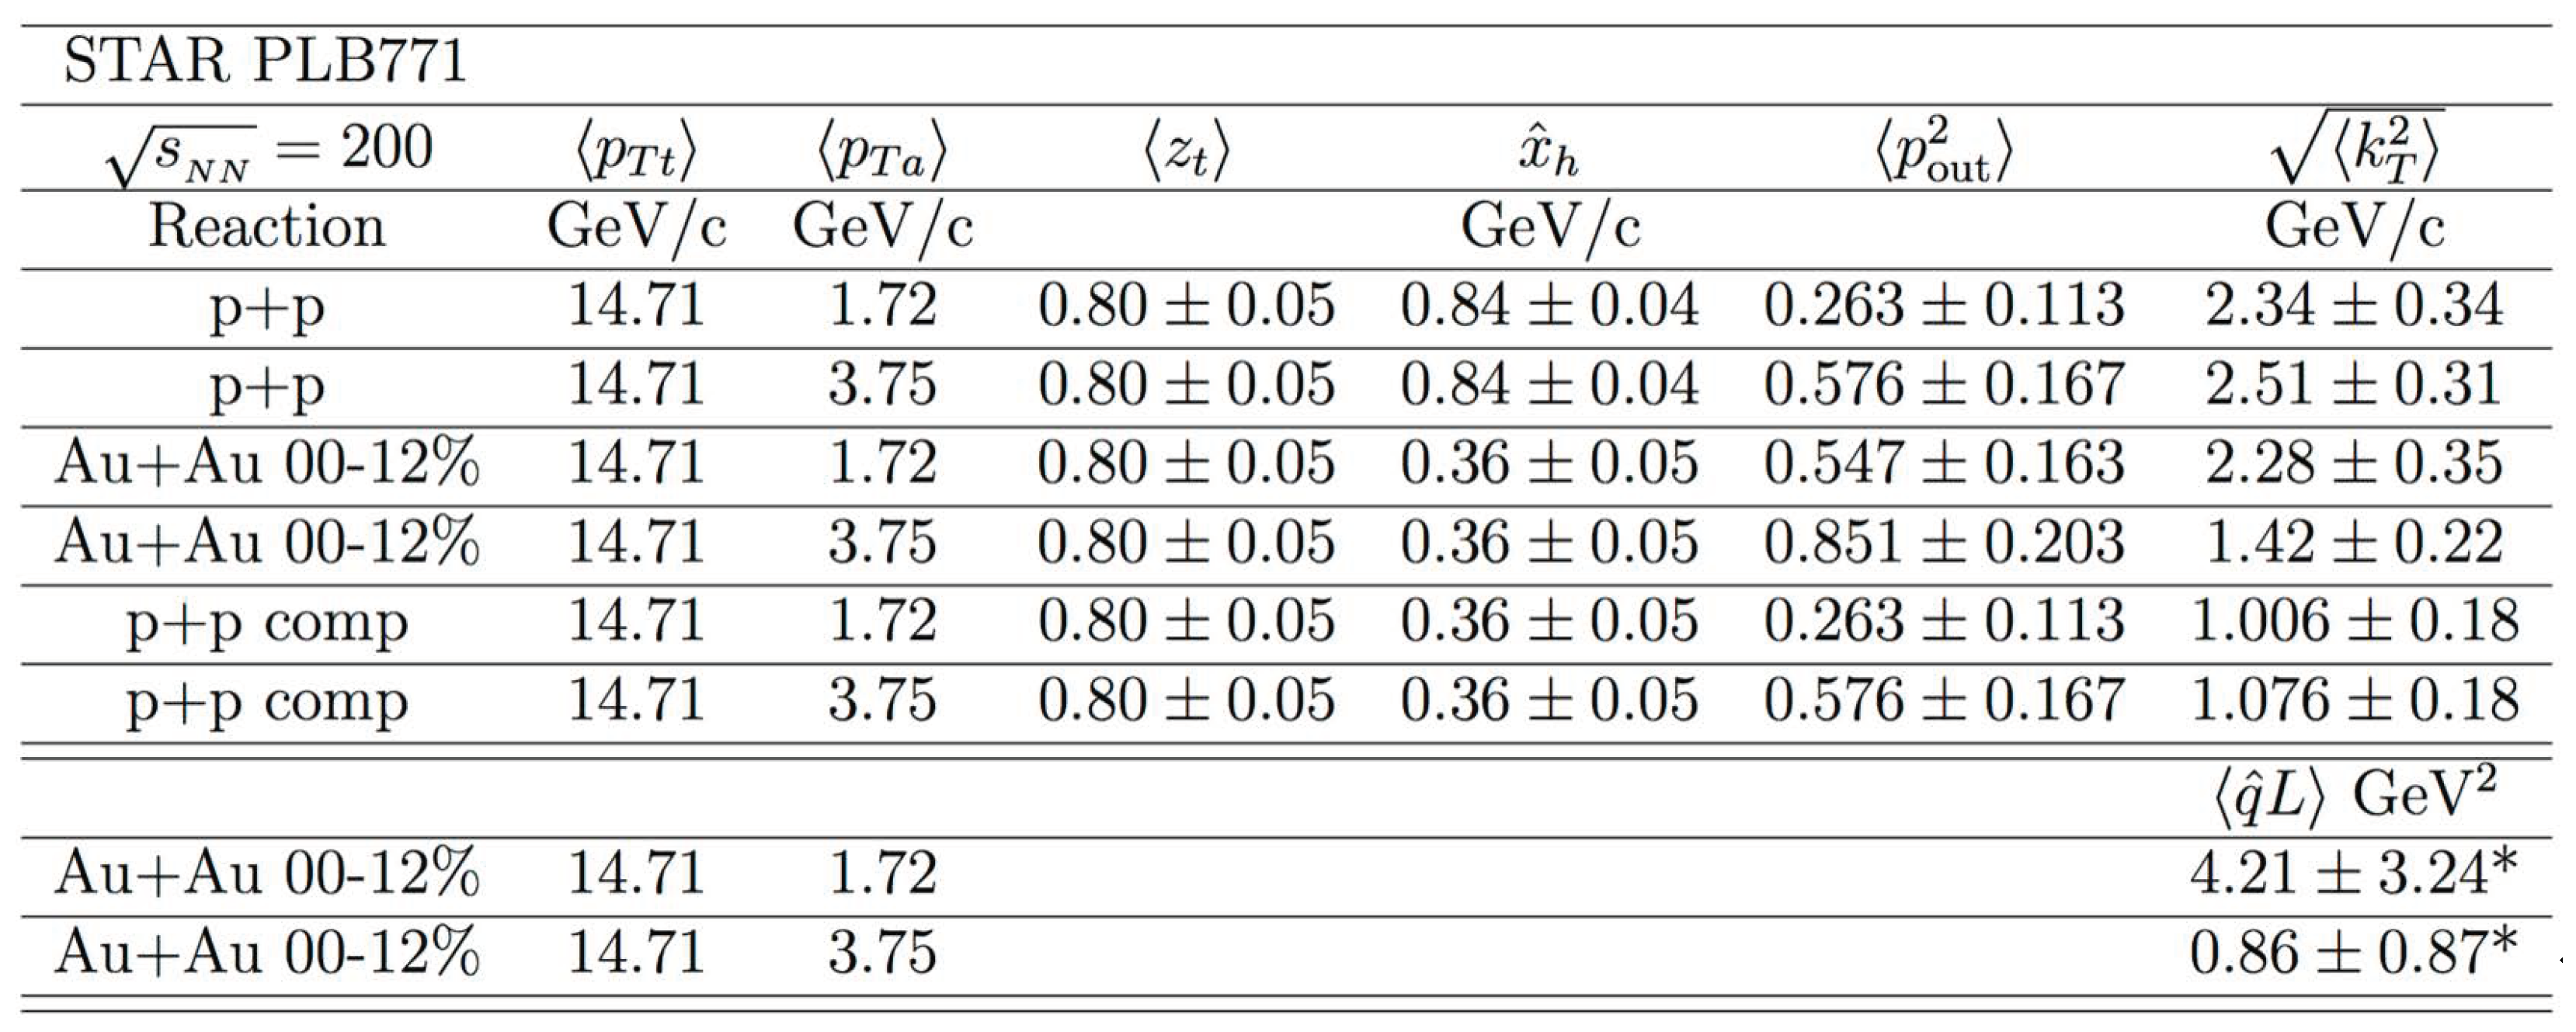
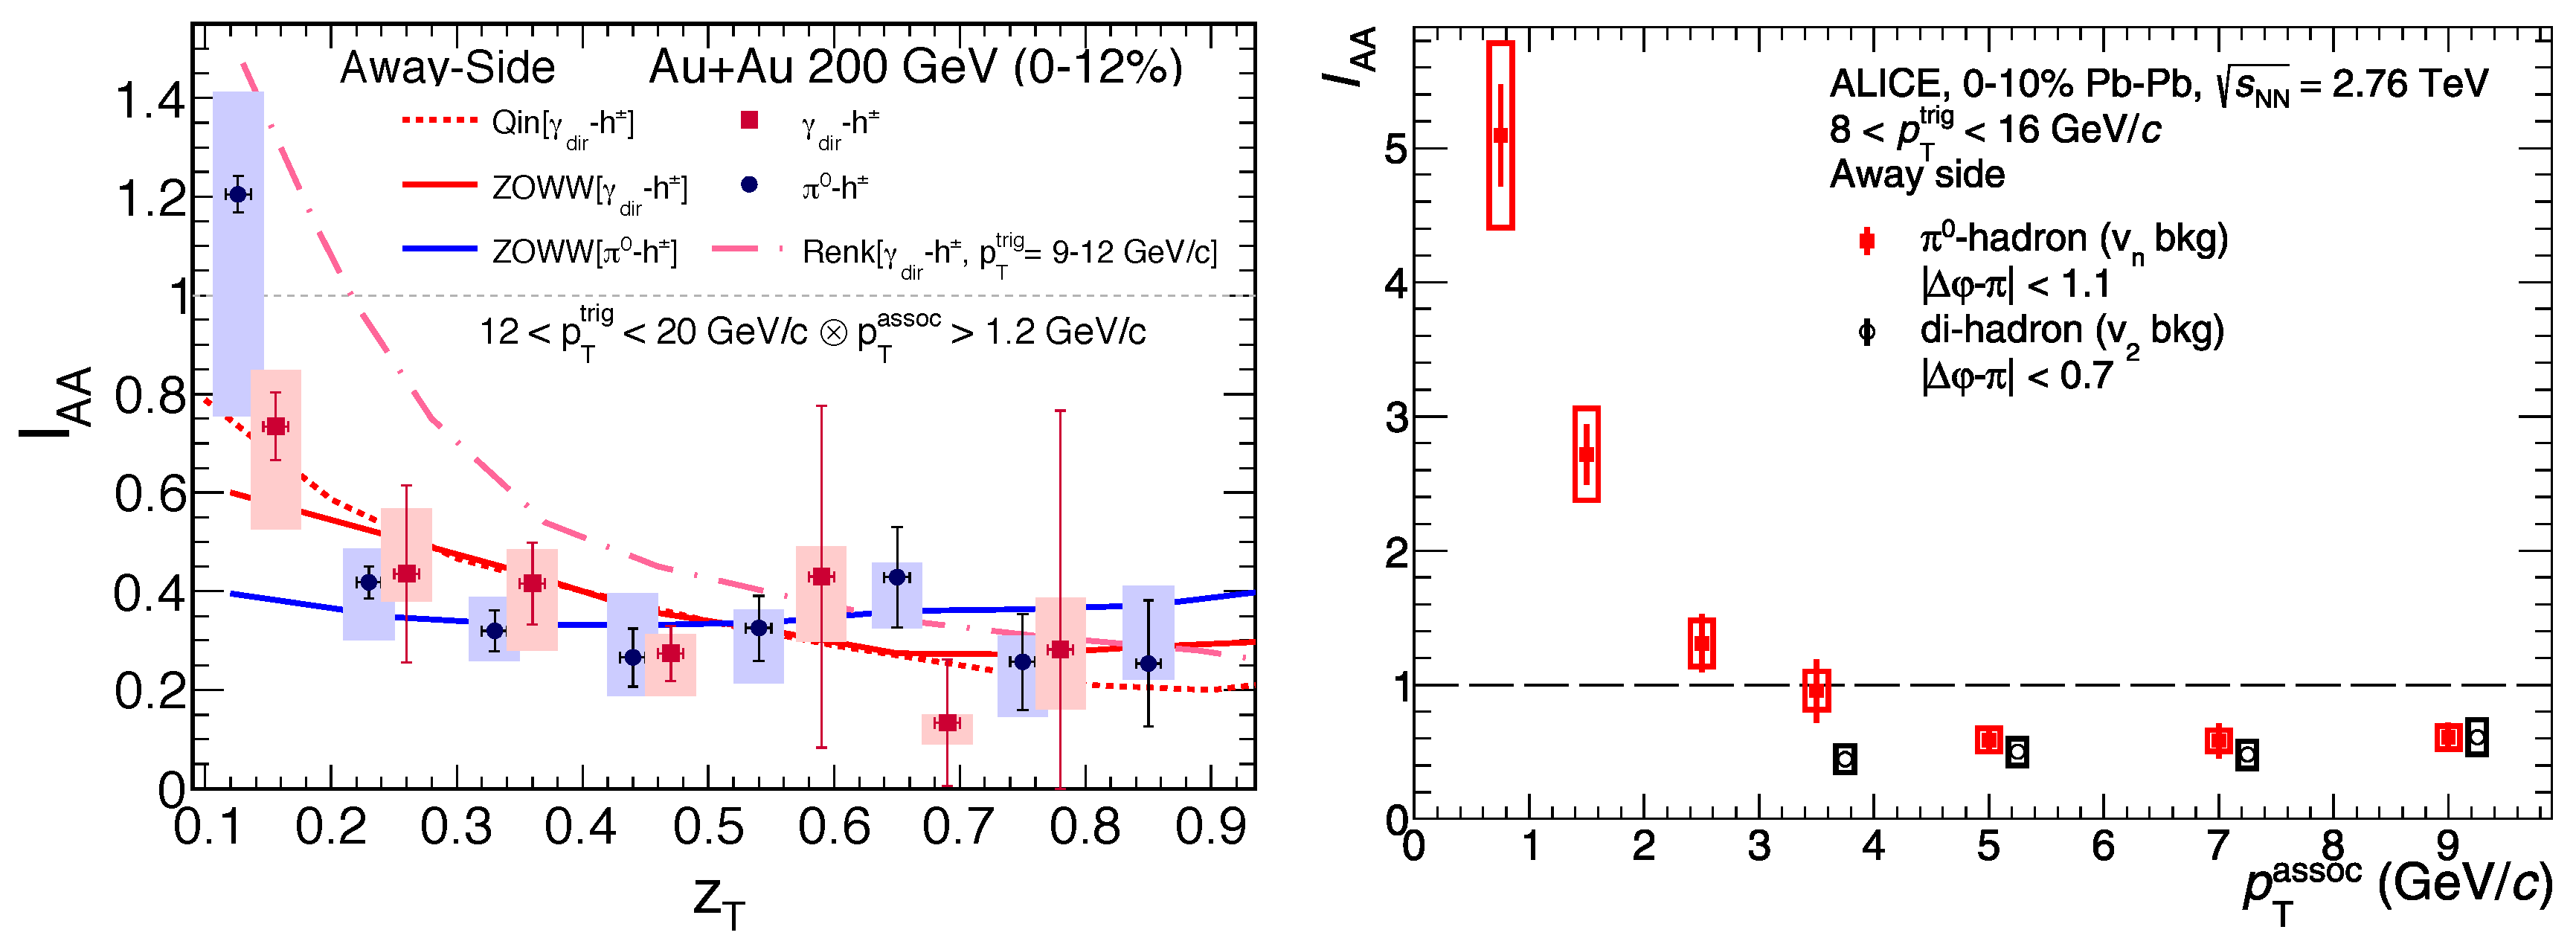
5.2.5. Results from STAR and Correlations [27]
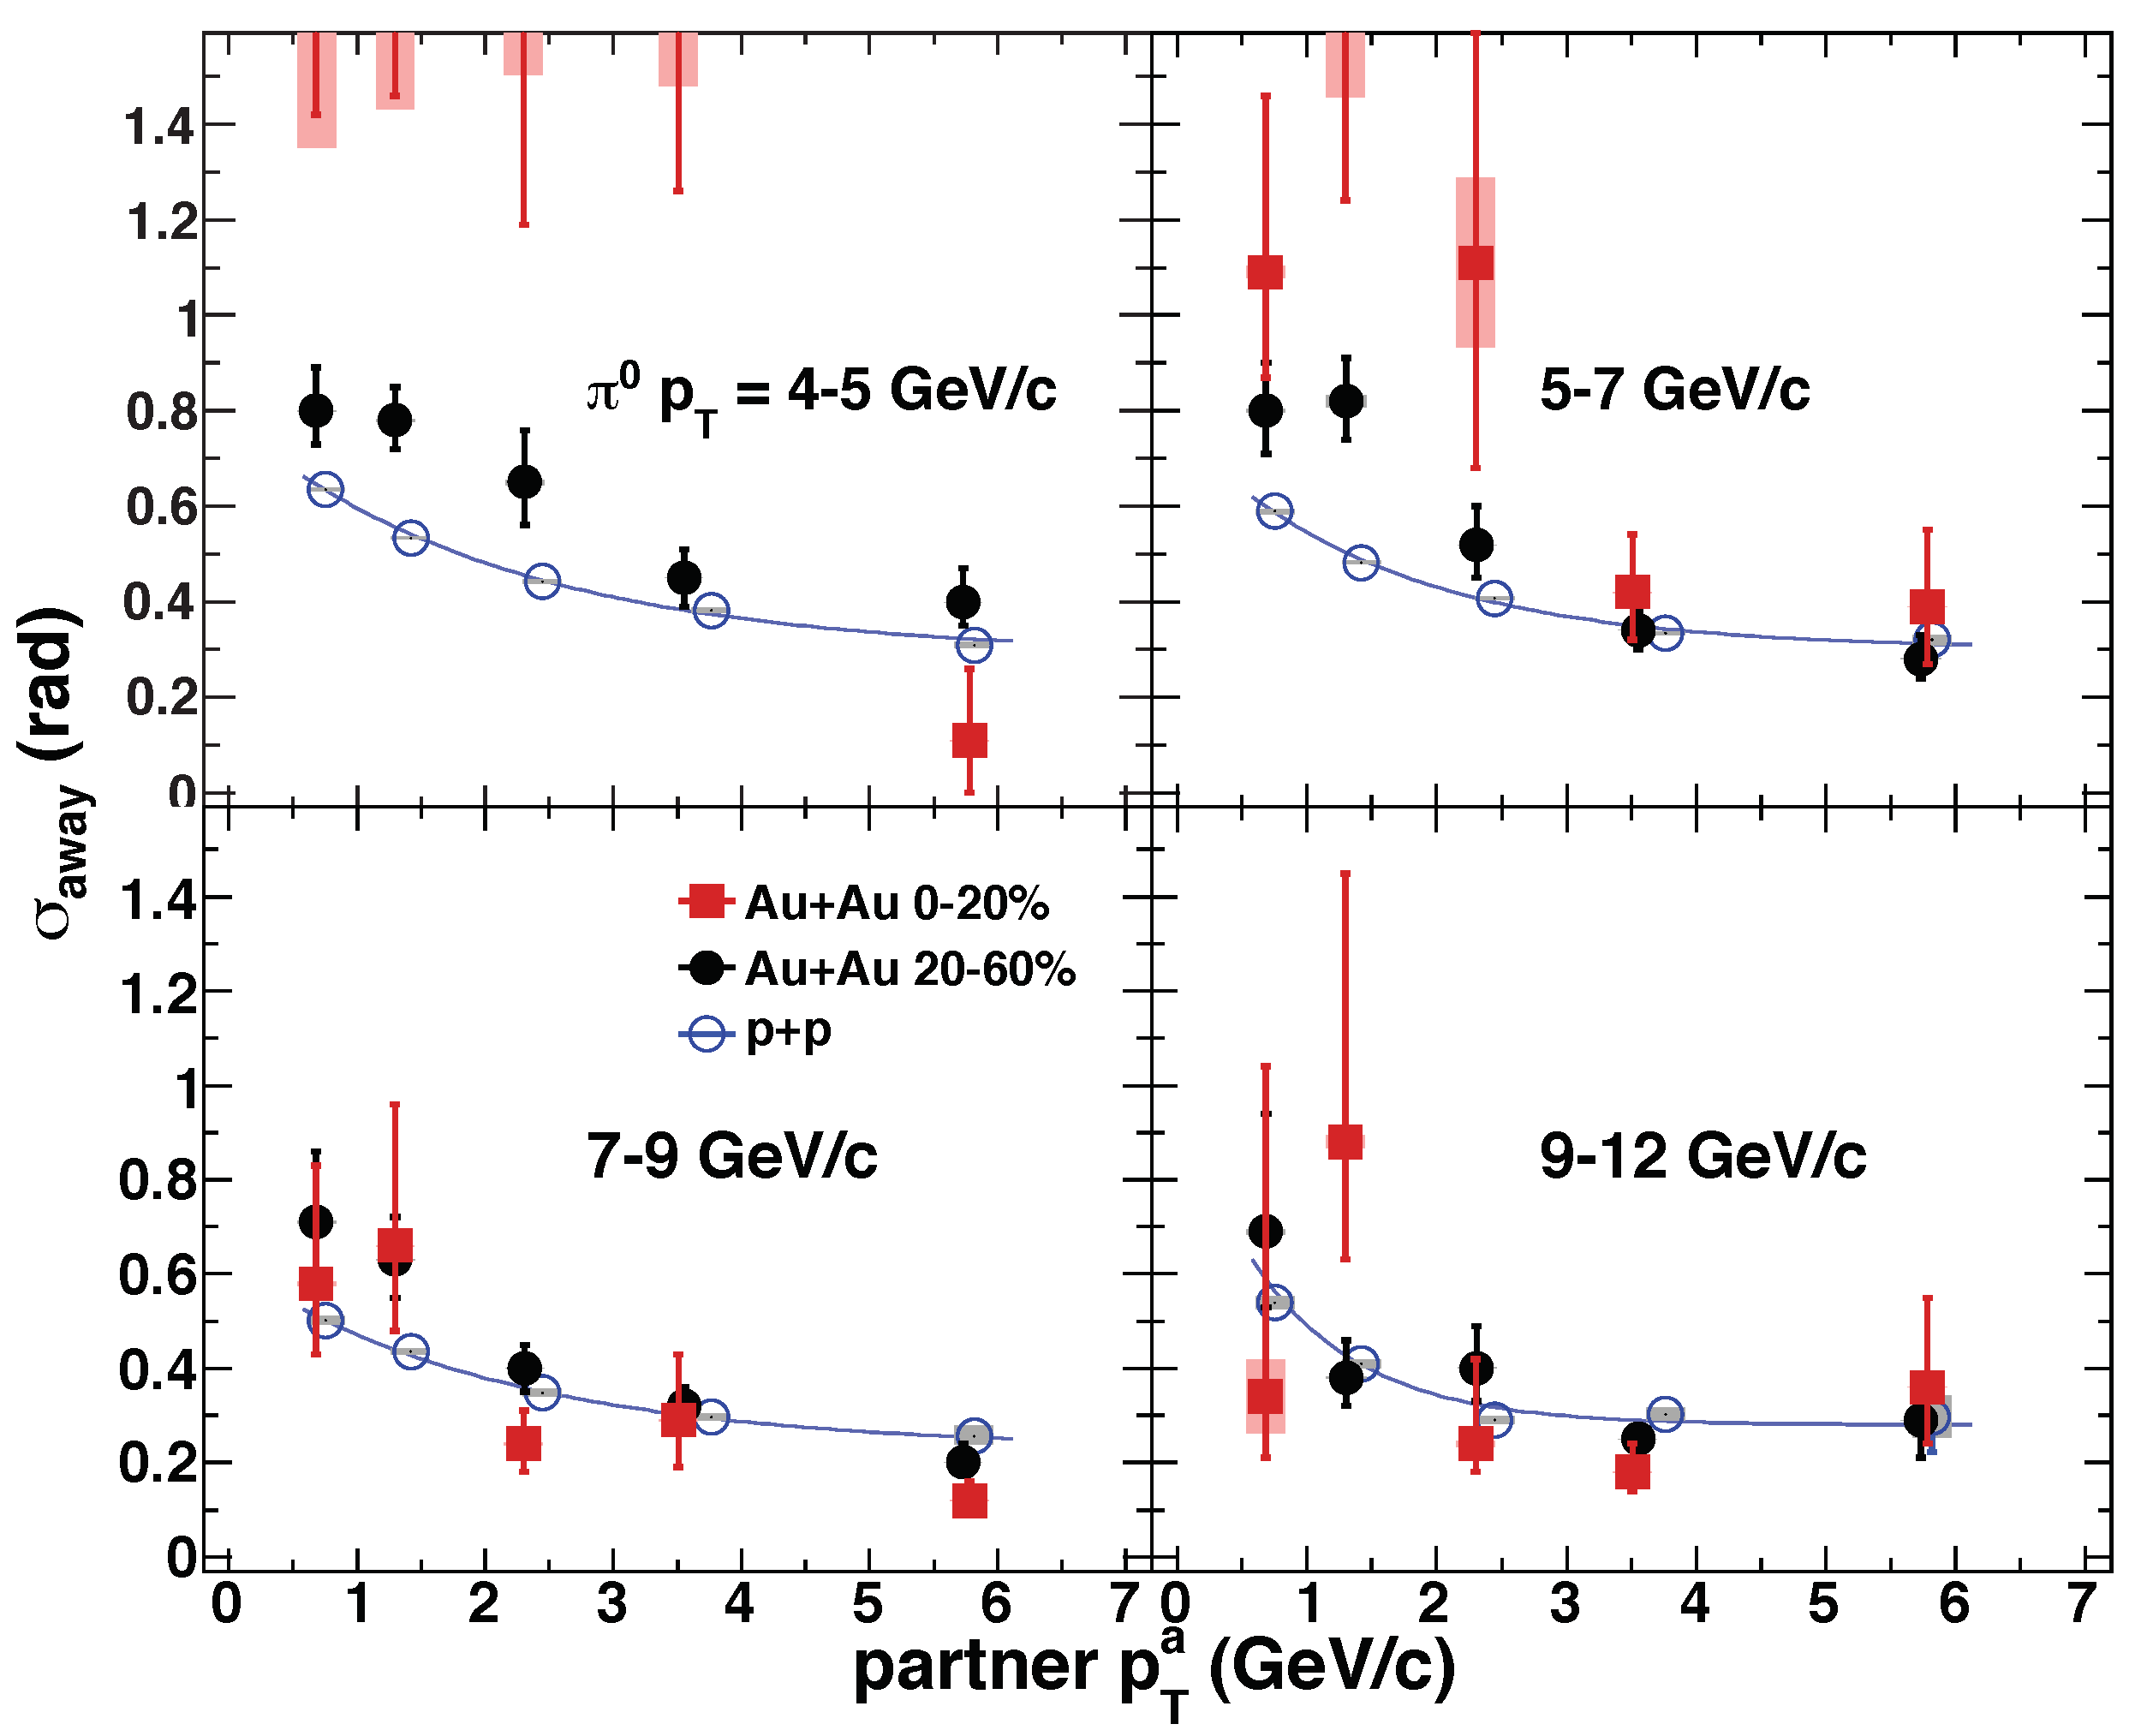
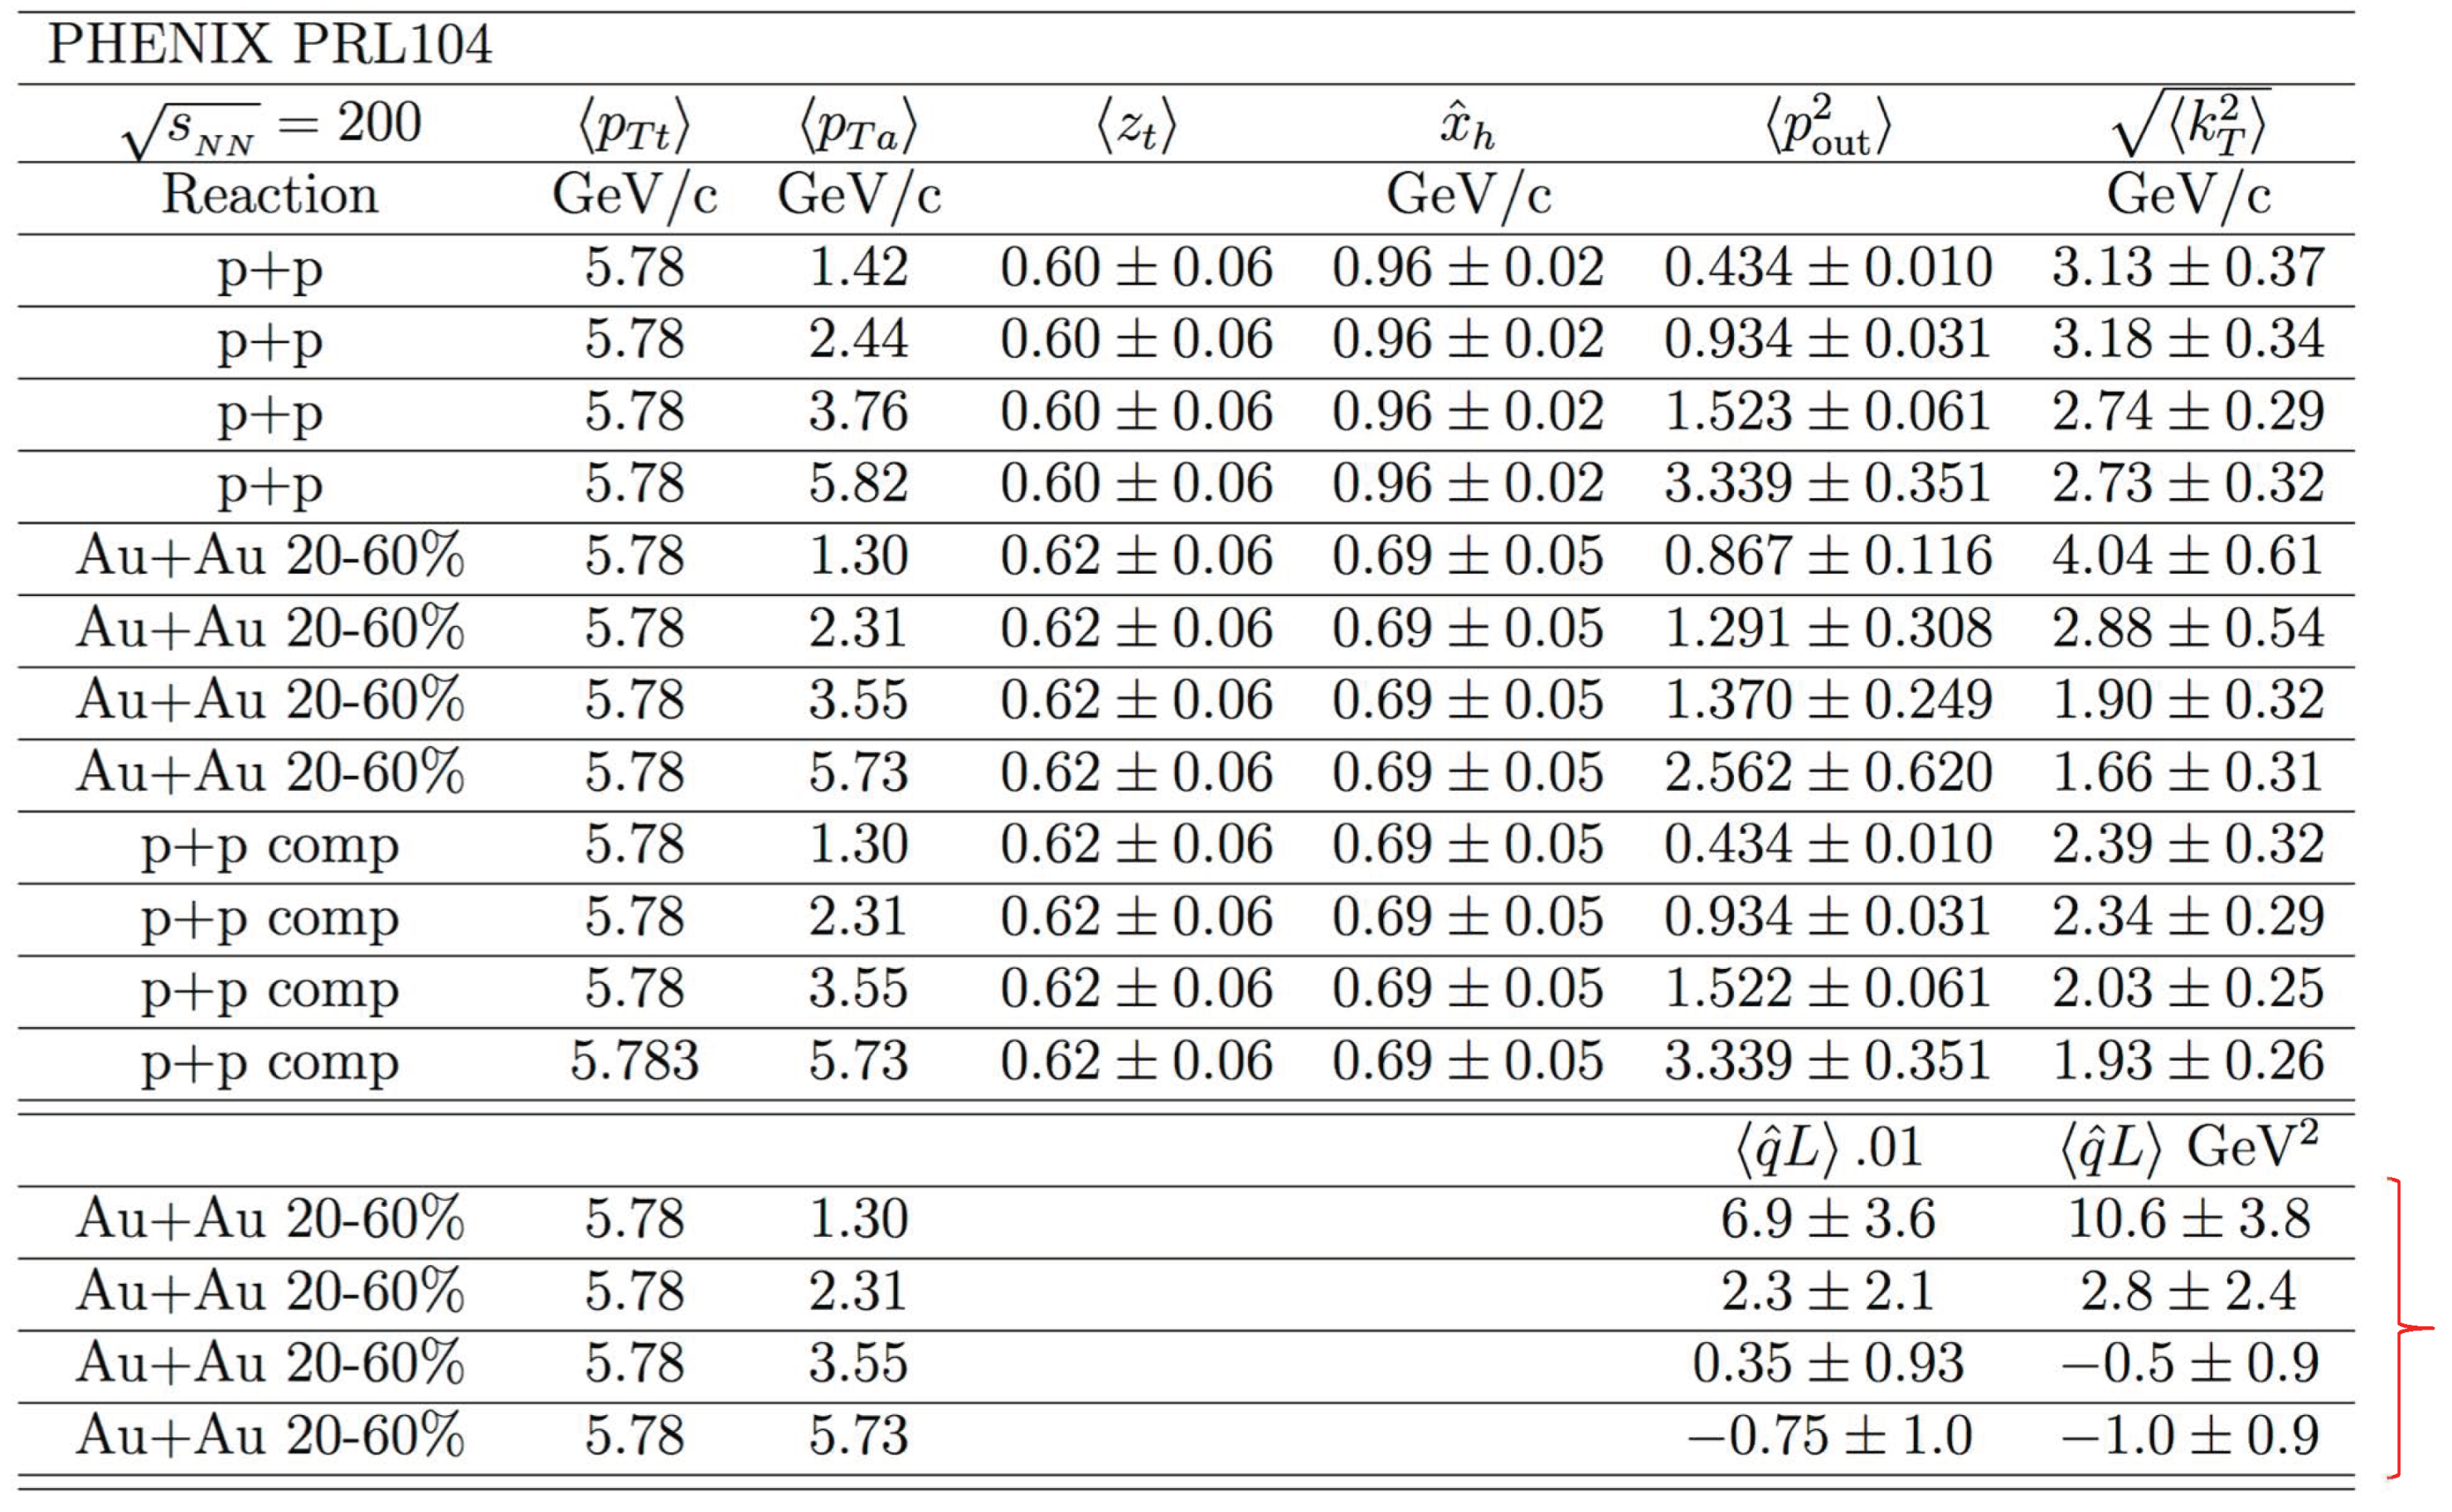
5.3. Some Results from PHENIX [26]
5.4. Conclusions
Funding
Conflicts of Interest
References
- Bunce, G.; et al. [WMR Collaboration]. Λ0 Hyperon Polarization in Inclusive Production by 300-GeV Protons on Beryllium. Phys. Rev. Lett. 1976, 36, 1113–1116. [Google Scholar] [CrossRef]
- Adamczyk, L.; et al. [STAR Collaboration]. Global Λ hyperon polarization in nuclear collisions. Nature 2017, 548, 62–65. [Google Scholar]
- Adam, J.; et al. [STAR Collaboration]. Global polarization of Λ hyperons in Au+Au collisions at = 200 GeV. Phys. Rev. C 2018, 98, 014910. [Google Scholar] [CrossRef]
- Aidala, C.; et al. [PHENIX Collaboration]. Creation of quark-gluon plasma droplets with three distinct geometries. Nat. Phy. 2019, 15, 214–220. [Google Scholar]
- Adare, A.; et al. [PHENIX Collaboration]. Measurements of mass-dependent azimuthal anisotropy in central p+Au, d+Au and 3He+Au collisions at = 200 GeV. Phys. Rev. C 2018, 97, 064904. [Google Scholar] [CrossRef]
- Nagle, J.L.; Belmont, R.; Hill, K.; Orjuela Koop, J.; Perepelitsa, D.V.; Yin, P.; Lin, Z.-W.; McGlinchey, D. Minimal conditions for collectivity in e+e- and p+p collisions. Phys. Rev. C 2018, 97, 024909. [Google Scholar] [CrossRef]
- Kogut, J.; Susskind, L. Vacuum polarization and the absence of free quarks in four dimensions. Phys. Rev. D 1974, 9, 3501–3512. [Google Scholar] [CrossRef]
- Eichten, E.; Gottfried, K.; Kinoshita, T.; Kogut, J.; Lane, K.D.; Yan, T.-M. Spectrum of Charmed Quark-Antiquark Bound States. Phys. Rev. Lett. 1975, 34, 369–372. [Google Scholar] [CrossRef]
- Matsui, T.; Satz, H. J/ψ Suppression by Quark-Gluon Plasma Formation. Phys. Lett. B 1987, 178, 416–422. [Google Scholar] [CrossRef]
- Satz, H. Colour deconfinement in nuclear collisions. Rep. Prog. Phys. 2000, 63, 1511–1574. [Google Scholar] [CrossRef]
- Soltz, R.A.; DeTar, C.; Karsch, F.; Mukherjee, S.; Vranas, P. Lattice QCD Thermodynamics with Physical Quark Masses. Ann. Rev. Nucl. Part. Sci. 2015, 65, 379. [Google Scholar] [CrossRef]
- Braun-Munzinger, P.; Stachel, J. (Non) thermal aspects of charmonium production and a new look at J/ψ suppression. Phys. Lett. B 2000, 490, 196. [Google Scholar] [CrossRef]
- Abelev, B.; et al. [ALICE Collaboration]. J/ψ Suppression at Forward Rapidity in Pb-Pb Collisions at = 2.76 TeV. Phys. Rev. Lett. 2012, 109, 072301. [Google Scholar] [CrossRef] [PubMed]
- Baier, R.; Schiff, D.; Zakharov, B.G. Energy Loss in Perturbative QCD. Ann. Rev. Nucl. Part. Sci. 2000, 50, 37–69. [Google Scholar] [CrossRef]
- Mueller, A.H. On the multiplicity of hadrons in QCD jets. Phys. Lett. B 1981, 104, 161–164. [Google Scholar] [CrossRef]
- Adcox, K.; et al. [PHENIX Collaboration]. Suppression of Hadrons with Large Transverse Momentum in Central Au+Au Collisions at =130 GeV. Phys. Rev. Lett. 2002, 88, 022301. [Google Scholar] [CrossRef] [PubMed]
- Burke, K.M.; et al. [JET Collaboration]. Extracting the jet transport coefficient from jet quenching in high-energy heavy-ion collisions. Phys. Rev. C 2014, 90, 014909. [Google Scholar] [CrossRef]
- Feynman, R.P.; Field, R.D.; Fox, G.C. Correlations among particles and jets produced with large transverse momenta. Nucl. Phys. B 1977, 128, 1–65. [Google Scholar] [CrossRef]
- Adler, S.S.; et al. [PHENIX Collaboration]. Jet properties from dihadron correlations in p+p collisions at = 200 GeV. Phys. Rev. D 2006, 74, 072002. [Google Scholar] [CrossRef]
- Tannenbaum, M.J. Measurement of in Relativistic Heavy Ion Collisions using di-hadron correlations. Phys. Lett. B 2017, 771, 553–557. [Google Scholar] [CrossRef]
- Mueller, A.H.; Wu, B.; Xiao, B.-W.; Yuan, F. Probing transverse momentum broadening in heavy ion collisions. Phys. Lett. B 2016, 763, 208–212. [Google Scholar] [CrossRef]
- Rak, J.; Tannenbaum, M.J. High pT Physics in the Heavy Ion Era; Cambridge University Press: Cambridge, UK, 2013; pp. 1–387. [Google Scholar]
- Jacob, M.; Landshoff, P.V. Large Transverse Momentum and Jet Studies. Phys. Repts. 1978, 48, 285–350. [Google Scholar] [CrossRef]
- Adare, A.; et al. [PHENIX Collaboration]. Double-helicity dependence of jet properties from dihadrons in longitudinally polarized p+p collisions at = 200 GeV. Phys. Rev. D 2010, 81, 012002. [Google Scholar] [CrossRef]
- Adare, A.; et al. [PHENIX Collaboration]. Neutral pion production with respect to centrality and reaction plane in Au+Au collisions at = 200 GeV. Phys. Rev. C 2013, 87, 034911. [Google Scholar] [CrossRef]
- Adare, A.; et al. [PHENIX Collaboration]. Transition in Yield and Azimuthal Shape Modification in Dihadron Correlations in Relativistic Heavy Ion Collisions. Phys. Rev. Lett. 2010, 104, 252301. [Google Scholar] [CrossRef] [PubMed]
- Adamczyk, L.; et al. [STAR Collaboration]. Jet-like correlations with direct-photon and neutral-pion triggers at = 200 GeV. Phys. Lett. B 2016, 760, 689–696. [Google Scholar] [CrossRef]
- Methar-Tani, Y.; Milhano, J.G.; Tywoniuk, K. Jets in Heavy-Ion Collisions. Int. J. Mod. Phys. A 2013, 28, 1340013. [Google Scholar] [CrossRef]
- Adam, J.; et al. [ALICE Collaboration]. Jet-like correlations with neutral pion triggers in pp and central Pb-Pb collisions at 2.76 TeV. Phys. Lett. B 2016, 763, 238–250. [Google Scholar] [CrossRef]


© 2019 by the author. Licensee MDPI, Basel, Switzerland. This article is an open access article distributed under the terms and conditions of the Creative Commons Attribution (CC BY) license (http://creativecommons.org/licenses/by/4.0/).
Share and Cite
Tannenbaum, M.J.
Latest Results from RHIC + Progress on Determining
Tannenbaum MJ.
Latest Results from RHIC + Progress on Determining
Tannenbaum, Michael J.
2019. "Latest Results from RHIC + Progress on Determining
Tannenbaum, M. J.
(2019). Latest Results from RHIC + Progress on Determining