Communication

Highlights from NA61/SHINE: Proton Intermittency Analysis

by
Daria Prokhorova
1,* and
Nikolaos Davis
2,*
1
Saint-Petersburg State University, 199034 St. Petersburg, Russia
2
H. Niewodniczanski Institute of Nuclear Physics, Polish Academy of Sciences, 31-342 Warsaw, Poland
*
Authors to whom correspondence should be addressed.
Universe 2019, 5(5), 103; https://doi.org/10.3390/universe5050103
Submission received: 14 April 2019 / Revised: 27 April 2019 / Accepted: 29 April 2019 / Published: 3 May 2019
(This article belongs to the Special Issue The Zimányi School and Analytic Hydrodynamics in High Energy Physics)

Abstract

:
The NA61/SHINE experiment at CERN SPS searches for the critical point of strongly interacting matter via scanning the phase diagram by changing beam momenta (13A–150A GeV/c) and system size (p + p, p + Pb, Be + Be, Ar + Sc, Xe + La). An observation of local proton-density fluctuations that scale as a power law of the appropriate universality class as a function of phase space bin size would signal the approach of the system to the vicinity of the possible critical point. An investigation of this phenomenon was performed in terms of the second-scaled factorial moments (SSFMs) of proton density in transverse momentum space with subtraction of a noncritical background. New NA61/SHINE preliminary analysis of Ar + Sc data at 150A GeV/c revealed a nontrivial intermittent behavior of proton moments. A similar effect was observed by NA49 in “Si” + Si data at 158A GeV/c. At the same time, no intermittency signal was detected in “C” + C and Pb + Pb events by NA49, as well as in Be + Be collisions by NA61/SHINE. EPOS1.99 also fails to describe the power-law scaling of SSFMs in Ar + Sc. Qualitatively, the effect is more pronounced with the increase of collision-peripherality and proton-purity thresholds, but a quantitative estimate is to be properly done via power-law exponent fit using the bootstrap method and compared to intermittency critical index ϕ 2 , derived from 3D-Ising effective action.

1. Introduction

One of the most challenging tasks today is to determine the structure of the phase diagram of strongly interacting matter. State-of-the-art lattice quantum chromodynamics (QCD) calculations predict a crossover between confined and deconfined states at low baryochemical potential and high temperature at the freeze-out stage. On the other hand, at low temperatures and high baryochemical potentials, a phase transition occurs between nuclear liquid and gas. Beyond these established facts, experimental evidence [1,2] and theoretical predictions [3,4,5] give us a hint that nature may possess some distinct transition between hadron gas and quark–gluon plasma (QGP). The most common scenario [6,7] suggests these two regions to be separated at high baryochemical potentials and moderate temperatures by a first-order phase-transition line, which then ends at a critical point. However, the exact location of the critical end-point in the phase diagram is unknown. Moreover, some lattice QCD calculations suggest that there might be no critical point at all, with only a crossover separating the two phases.
The aim of the strong interactions program of NA61/SHINE [8], a fixed-target experiment at CERN SPS, is to study the properties of the onset of deconfinement and search for the critical point of strongly interacting matter. Since direct control of the freeze-out temperature and baryochemical potential is impossible, one can only vary the initial conditions. Therefore, the main strategy of the NA61/SHINE collaboration in this study [9] is to perform a comprehensive two-dimensional scan of the phase diagram of strongly interacting matter by changing the energy (beam momentum 13A–150A GeV/c) and the size of colliding systems (p + p, p + Pb, Be + Be, Ar + Sc, Xe + La). The characteristic signatures of the critical point could be observed, provided the system freezes out close enough to it, in the parameter space of temperature and baryochemical potential. This brings hope that critical fluctuations would not be washed out during the evolution of the system. Thus, if the critical point exists and can be reached within the NA61/SHINE phase-diagram-scan program, then, at some values of collision energy and system size, an enhancement of fluctuation signals is believed to be observed [10].
The present analysis [11] was inspired by the possibility to detect the QCD critical point not only via study of event-by-event global fluctuations of integrated quantities [12,13,14,15,16], but also by investigating the local power-law fluctuations [17] of the order parameters of QCD, the chiral condensate q ¯ q , and net-baryon density. At finite baryochemical potentials, critical fluctuations are also transferred to the net-proton density and can additionally be detected in the intermittent behavior of antiproton or proton density [18].
In experimental data, one may expect to observe proton-density fluctuations with a power-law dependence on phase-space resolution if the system freezes out right in the vicinity of the critical point [19]. The behavior of second-scaled factorial moments (SSFMs) in transverse-momentum space [20,21] as a function of the number of (equal-size) cells in which it is partitioned, was chosen to be the measure of proton-density fluctuations. Therefore, this analysis approach allows us to search for detectable intermittent behavior originating from the critical behavior of the order parameter in NA61/SHINE experimental data. The expected power-law behavior of factorial moments is quantitatively described by means of intermittency critical index ϕ 2 [19]. Theoretical prediction of its value is provided by the 3D-Ising effective action [19] since fluctuations of the order parameter at the critical point are self-similar [22], belonging to the 3D-Ising universality class. Other effects, such as resonance decays, HBT (Hanbury Brown and Twiss effect or Bose-Einstein momentum correlations), and fragmentation of jets and minijets induced by conventional strong interactions, are not expected to lead to scaling behavior of factorial moments as evidenced by experimental studies in various A + A collision systems, for example, Pb + Pb at 158A GeV/c [23], and further supported by the lack of clear intermittent behavior in EPOS-simulated [24] Ar + Sc collisions at 150A GeV/c in the present work.
New experimental evidence comes from analysis [11] of Ar + Sc collisions at 150A GeV/c, which was performed at midrapidity for three different centralities and three thresholds of proton-purity selection. The results are compared with previous intermittency analyses performed on data collected by NA49 on “C” + C, “Si” + Si and Pb + Pb most central collisions (12%, 12%, 10%, respectively) [23], and by NA61/SHINE for 10% most central Be + Be [25]. The “C” beam as defined by the online trigger and offline selection was a mixture of ions with charge Z = 6 and 7 (intensity ratio 69:31); the “Si” beam of ions with Z = 13, 14, and 15 (intensity ratio 35:41:24) [26]. Only Ar + Sc and “Si” + Si data show nontrivial intermittent behavior, as determined by the power-law scaling of their corresponding SSFMs.

2. Method of Analysis

In quantum electrodynamics (QED) interactions of ordinary matter, the behavior of the system at the critical point may be described through the phenomenon of critical opalescence [27] by the examination of scattered-photon spectra. In QCD, our tool for probing the state of a system is to measure the momenta of particles produced by a chemically and thermally excited QCD vacuum [28]. In the vicinity of a critical point, the correlation length of the system diverges [29,30], and long-range correlations appear. Moreover, the power-law decay of correlations with distance in r-space leads, through Fourier transformation, to power-law singularity of the density–density correlation function in p-space in the limit of small-momentum transfer. The latter can be detected within the framework of intermittency analysis of proton-density fluctuations in transverse-momentum space [20,21] by use of scaled factorial moments at midrapidity.
For this purpose, the available region of transverse-momentum space is partitioned into a Lattice of M 2 equal-size cells (1):
F 2 ( M ) = 1 M 2 i = 1 M 2 n i ( n i 1 ) 1 M 2 i = 1 M 2 n i 2
If the system exhibits critical fluctuations, second-scaled factorial moments F 2 ( M ) as a function of the cell size (or the number of cells) are expected to scale (2) with M for large values of M, as a power-law with ϕ 2 being the intermittency index, which happens if system freeze-out occurs exactly at the critical point [19]:
F 2 ( M ) M 2 ϕ 2 , ϕ 2 = ϕ 2 , c r B = 5 6
Note that the background of noncritical proton pairs must be subtracted at the level of factorial moments in order to eliminate trivial (baseline) and noncritical correlations (with a characteristic length scale that do not scale with bin size). Thus, we can define Formula (3) a correlator Δ F 2 ( M ) in terms of moments of original and mixed events, as well as a cross term:
Δ F 2 ( M ) = F 2 ( d ) ( M ) λ 2 ( M ) F 2 ( m ) ( M ) λ ( M ) ( 1 λ ( M ) ) f a b c , λ ( M ) n b n
In the limit of tiny number of critical protons (when background is dominant), which corresponds to the case of λ 1 , the simplification of Formula (3) by omitting the cross-term [23] and an approximation of noncritical background by correlation-free generated mixed events gives us Equation (4):
Δ F 2 ( e ) ( M ) = F 2 ( d ) ( M ) F 2 ( m ) ( M )
Now, experimentally measured intermittency index ϕ 2 can be compared with the theoretically predicted value derived from 3D-Ising effective action. The analysis of Ar + Sc collisions at 150A GeV/c was performed for different centralities and purity of proton selection.
The calculation of SSFMs is smoothed by averaging over many lattice positions (lattice averaged SSFMs, see Reference [23]) and an improved estimation of statistical errors of SSFMs is achieved by use of the bootstrap method [31,32,33], whereby the original set of events is re-sampled with replacement [23].
It is to be noted that, while individual F 2 ( M ) errors and confidence intervals can be estimated fairly well through the bootstrap, F 2 ( M ) errors for a different M are correlated, since the same dataset is used in the calculation of all F 2 ( M ) . Additional information about error correlations is contained in the full F 2 ( M ) correlation matrix, which can also be estimated through the bootstrap (see, for example, Reference [31]). Furthermore, ϕ 2 and its accompanying uncertainties should be properly determined, not through a simple χ 2 -fit, but through a correlated fit. Unfortunately, such fits are plagued by instabilities [34]. We therefore resort to other methods in order to estimate ϕ 2 uncertainties, such as individually fitting bootstrap samples to obtain a distribution of ϕ 2 values and corresponding confidence intervals; however, present quoted ϕ 2 uncertainties should be considered tentative. A proton-generating modification of the Critical Monte Carlo (CMC) code [17,19] is used to simulate a system of critically correlated protons, which are mixed with a noncritical background to study the effects on the quality of intermittency analysis.
There is a necessity to apply additional quality cuts to selected protons before intermittency analysis. In particular, one must guard against the possibility of split tracks, i.e., sections of a track that are erroneously identified as a pair of distinct tracks and could therefore compromise an analysis on correlations. To this end, we impose a minimum separation distance of accepted tracks in the detector. Additionally, we calculate, for original and mixed events, the distributions of invariant four-momentum difference, q i n v , of proton pairs (5):
q i n v ( p i , p j ) = 1 2 ( p i p j ) 2
Ratio of distributions P ( q d a t a ) / P ( q m i x e d ) is predicted [35] to have a peak around 20 MeV/c due to strong interactions and to be suppressed for lower q i n v due to Fermi–Dirac effects and Coulomb repulsion. Thus, any additional peaks at low q i n v indicate possible split-track contamination and must be removed. This procedure led us to impose a universal cutoff of q i n v > 7 MeV/c to all sets before analysis.

3. Results

Already published results on proton intermittency in “C” + C, “Si” + Si and Pb + Pb data (Figure 1) at the same beam momenta of 158A GeV/c show the distinct signal of intermittent behavior only in “Si”+Si, although with significant statistical errors. The intermittency index value for this collision system was estimated [23] through the bootstrap as ϕ 2 , B = 0.96 0.25 + 0.38 .
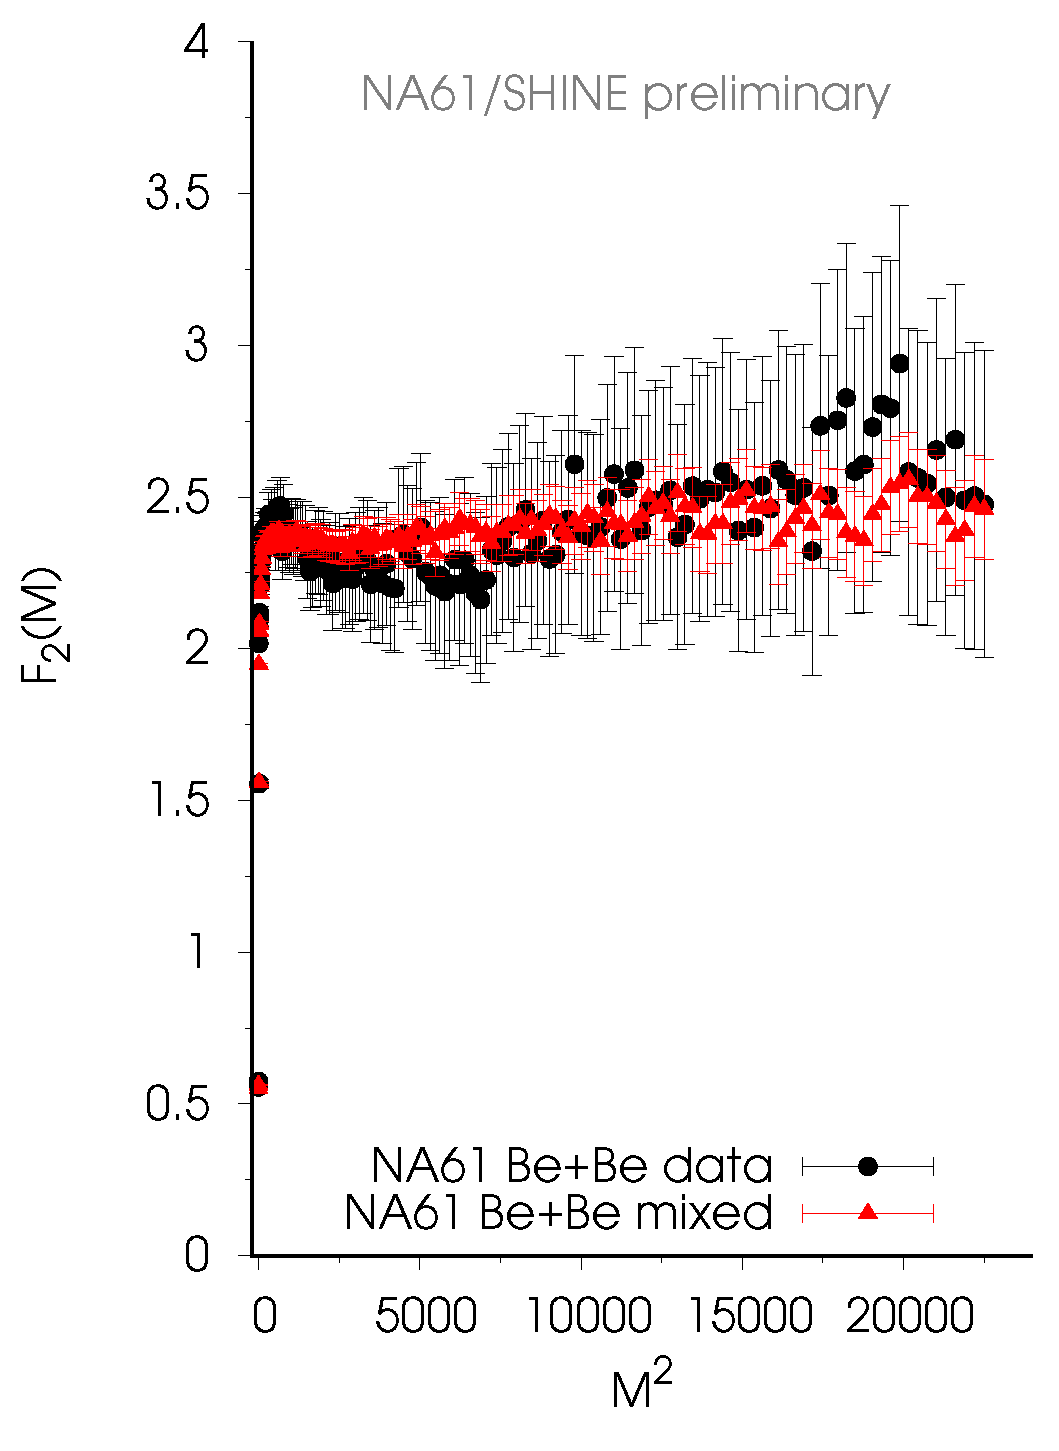
After this success, analysis was extended to other intermediate-size systems for which collisions were performed by the NA61/SHINE experiment. In order to satisfy the requirements of high statistics, reliable proton identification and sufficient mean proton-multiplicity density in midrapidity (to study two-particle correlations), Be + Be and Ar + Sc at 150A GeV/c were chosen for analysis. Preliminary analysis of NA61/SHINE Be + Be events (Figure 2) at 150A GeV/c was presented in Reference [25]. F 2 ( M ) for data and mixed events overlap; thus, Δ F 2 ( M ) fluctuates around zero, and no intermittency effect is observed.
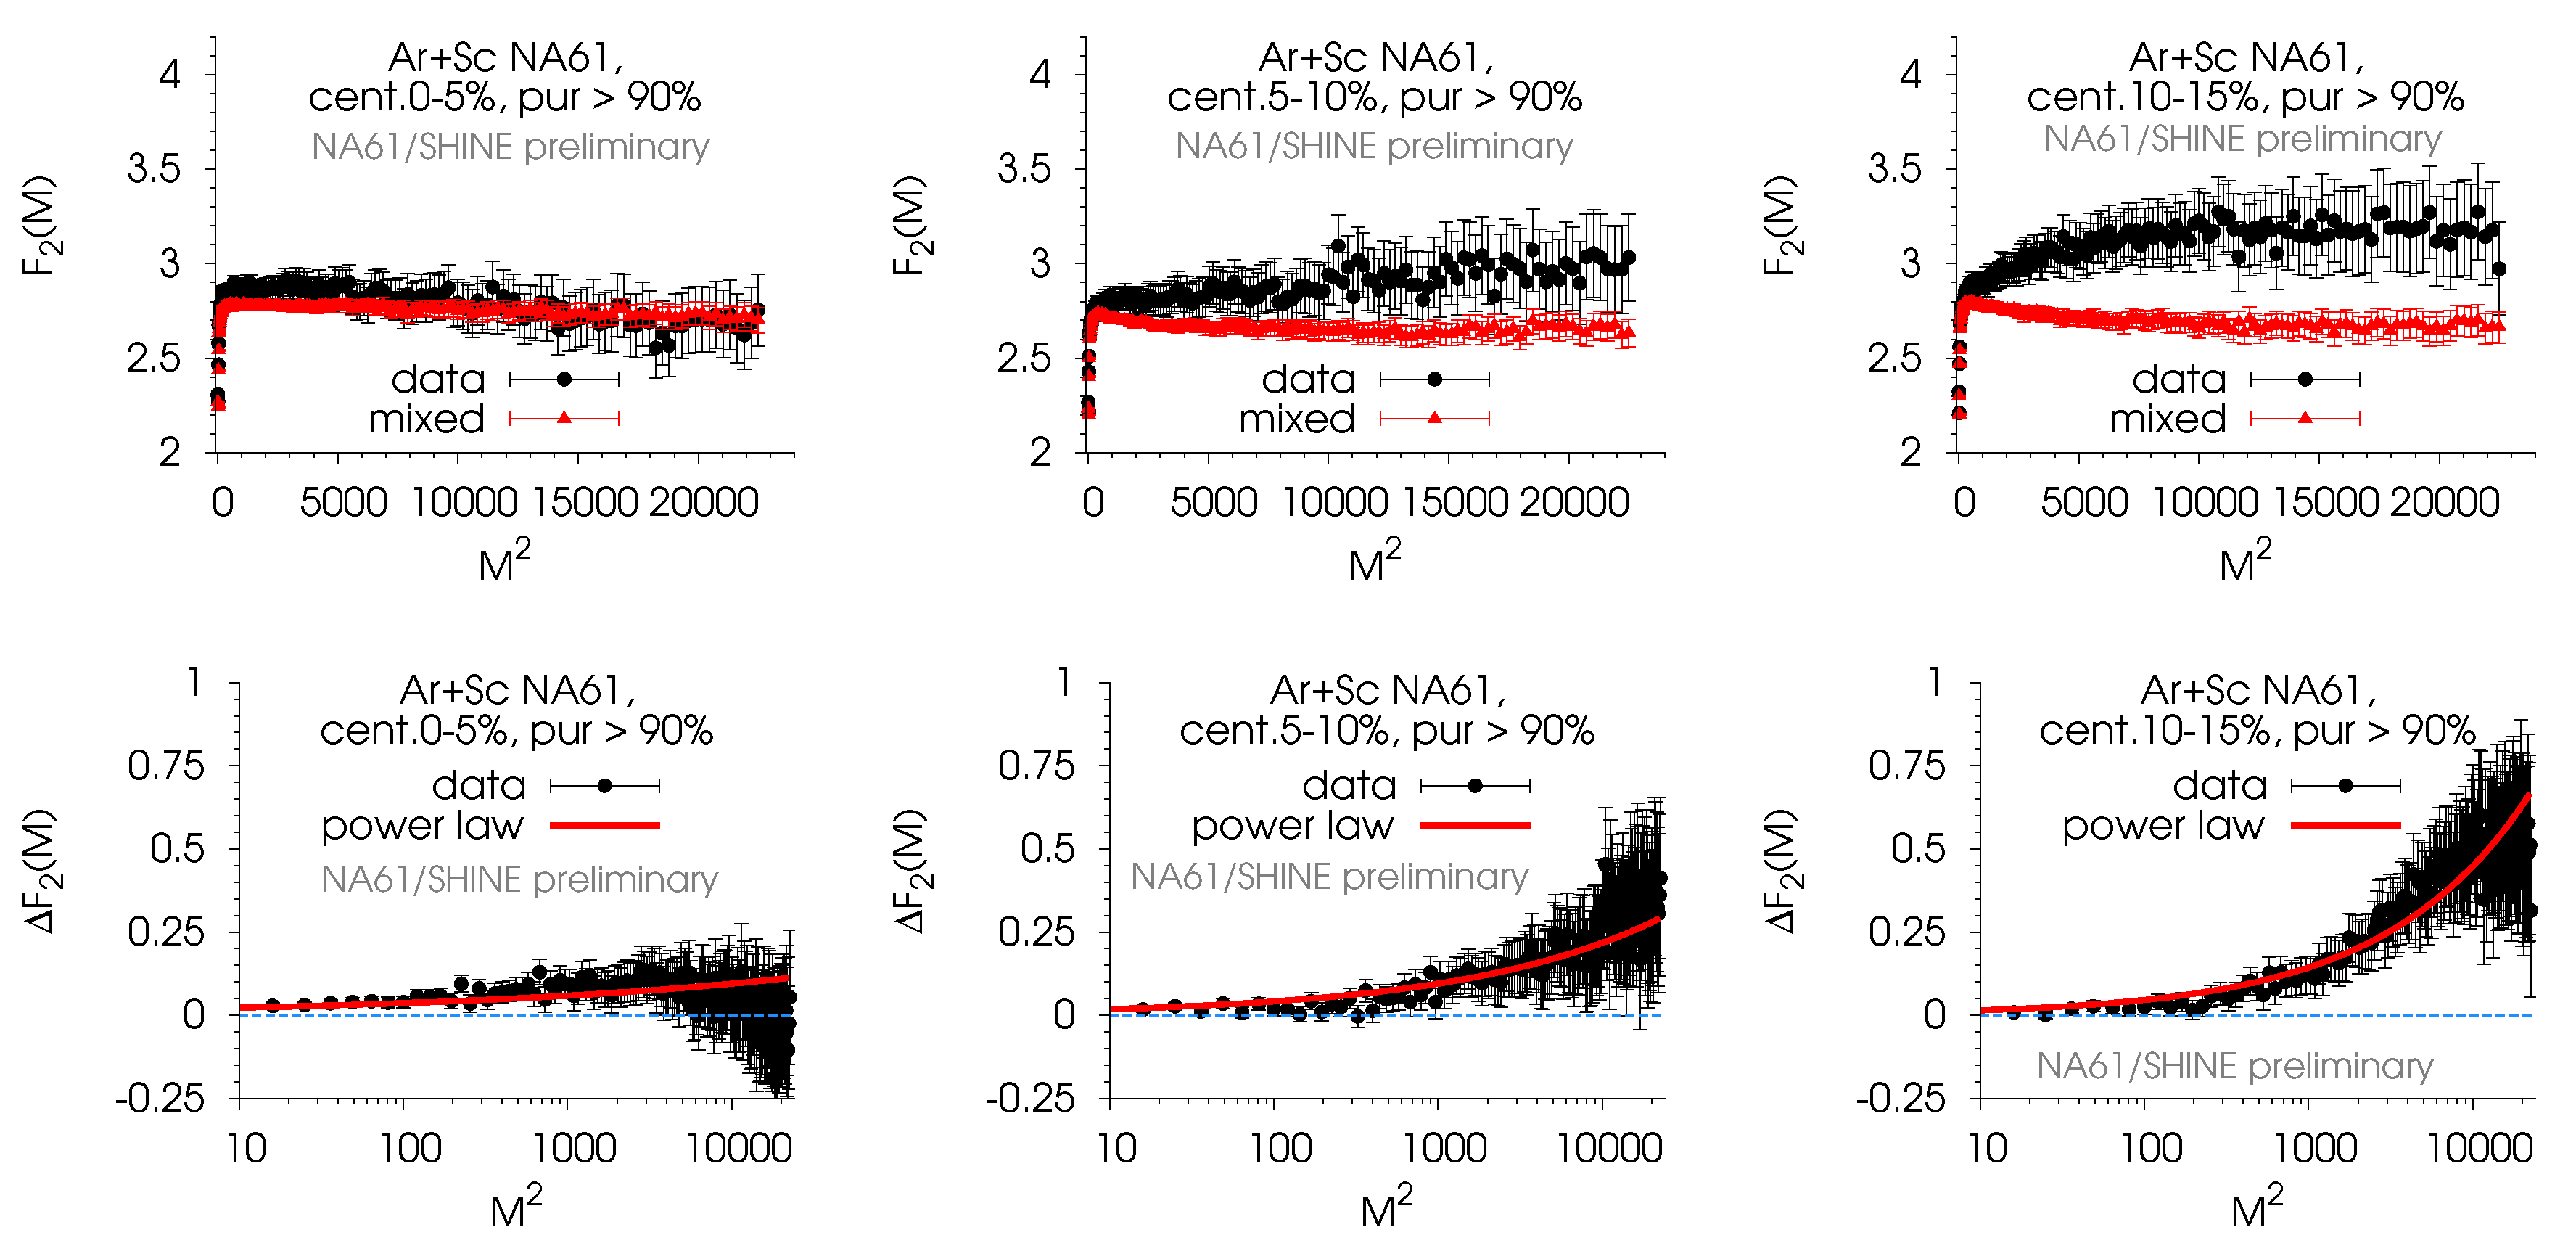
Ar + Sc events at 150A GeV/c were analyzed [11] for three centrality bins: 0–5%, 5%–10%, and 10%–15% of most central collisions. Determination of centrality was performed by projectile spectator energy, which was deposited in PSD [36], the forward hadron calorimeter, located right at the beam line in the end of NA61/SHINE experimental facility. A scan on proton purity thresholds of 80%, 85%, and 90% was also carried out.
Figure 3 shows the results for 90% proton-purity selection for NA61/SHINE Ar + Sc datasets. One may clearly observe a significant separation of F 2 ( M ) of data from those of mixed events for the 10%–15% centrality case. For 5%–10% most central collisions, the effect is weaker, while central (0–5%) collisions show a total overlap of moments (no intermittency effect). At present, the uncertainties of Δ F 2 ( M ) , as well as the fact that they are correlated, do not permit a safe estimation of power-law quality or the calculation of confidence intervals for ϕ 2 .
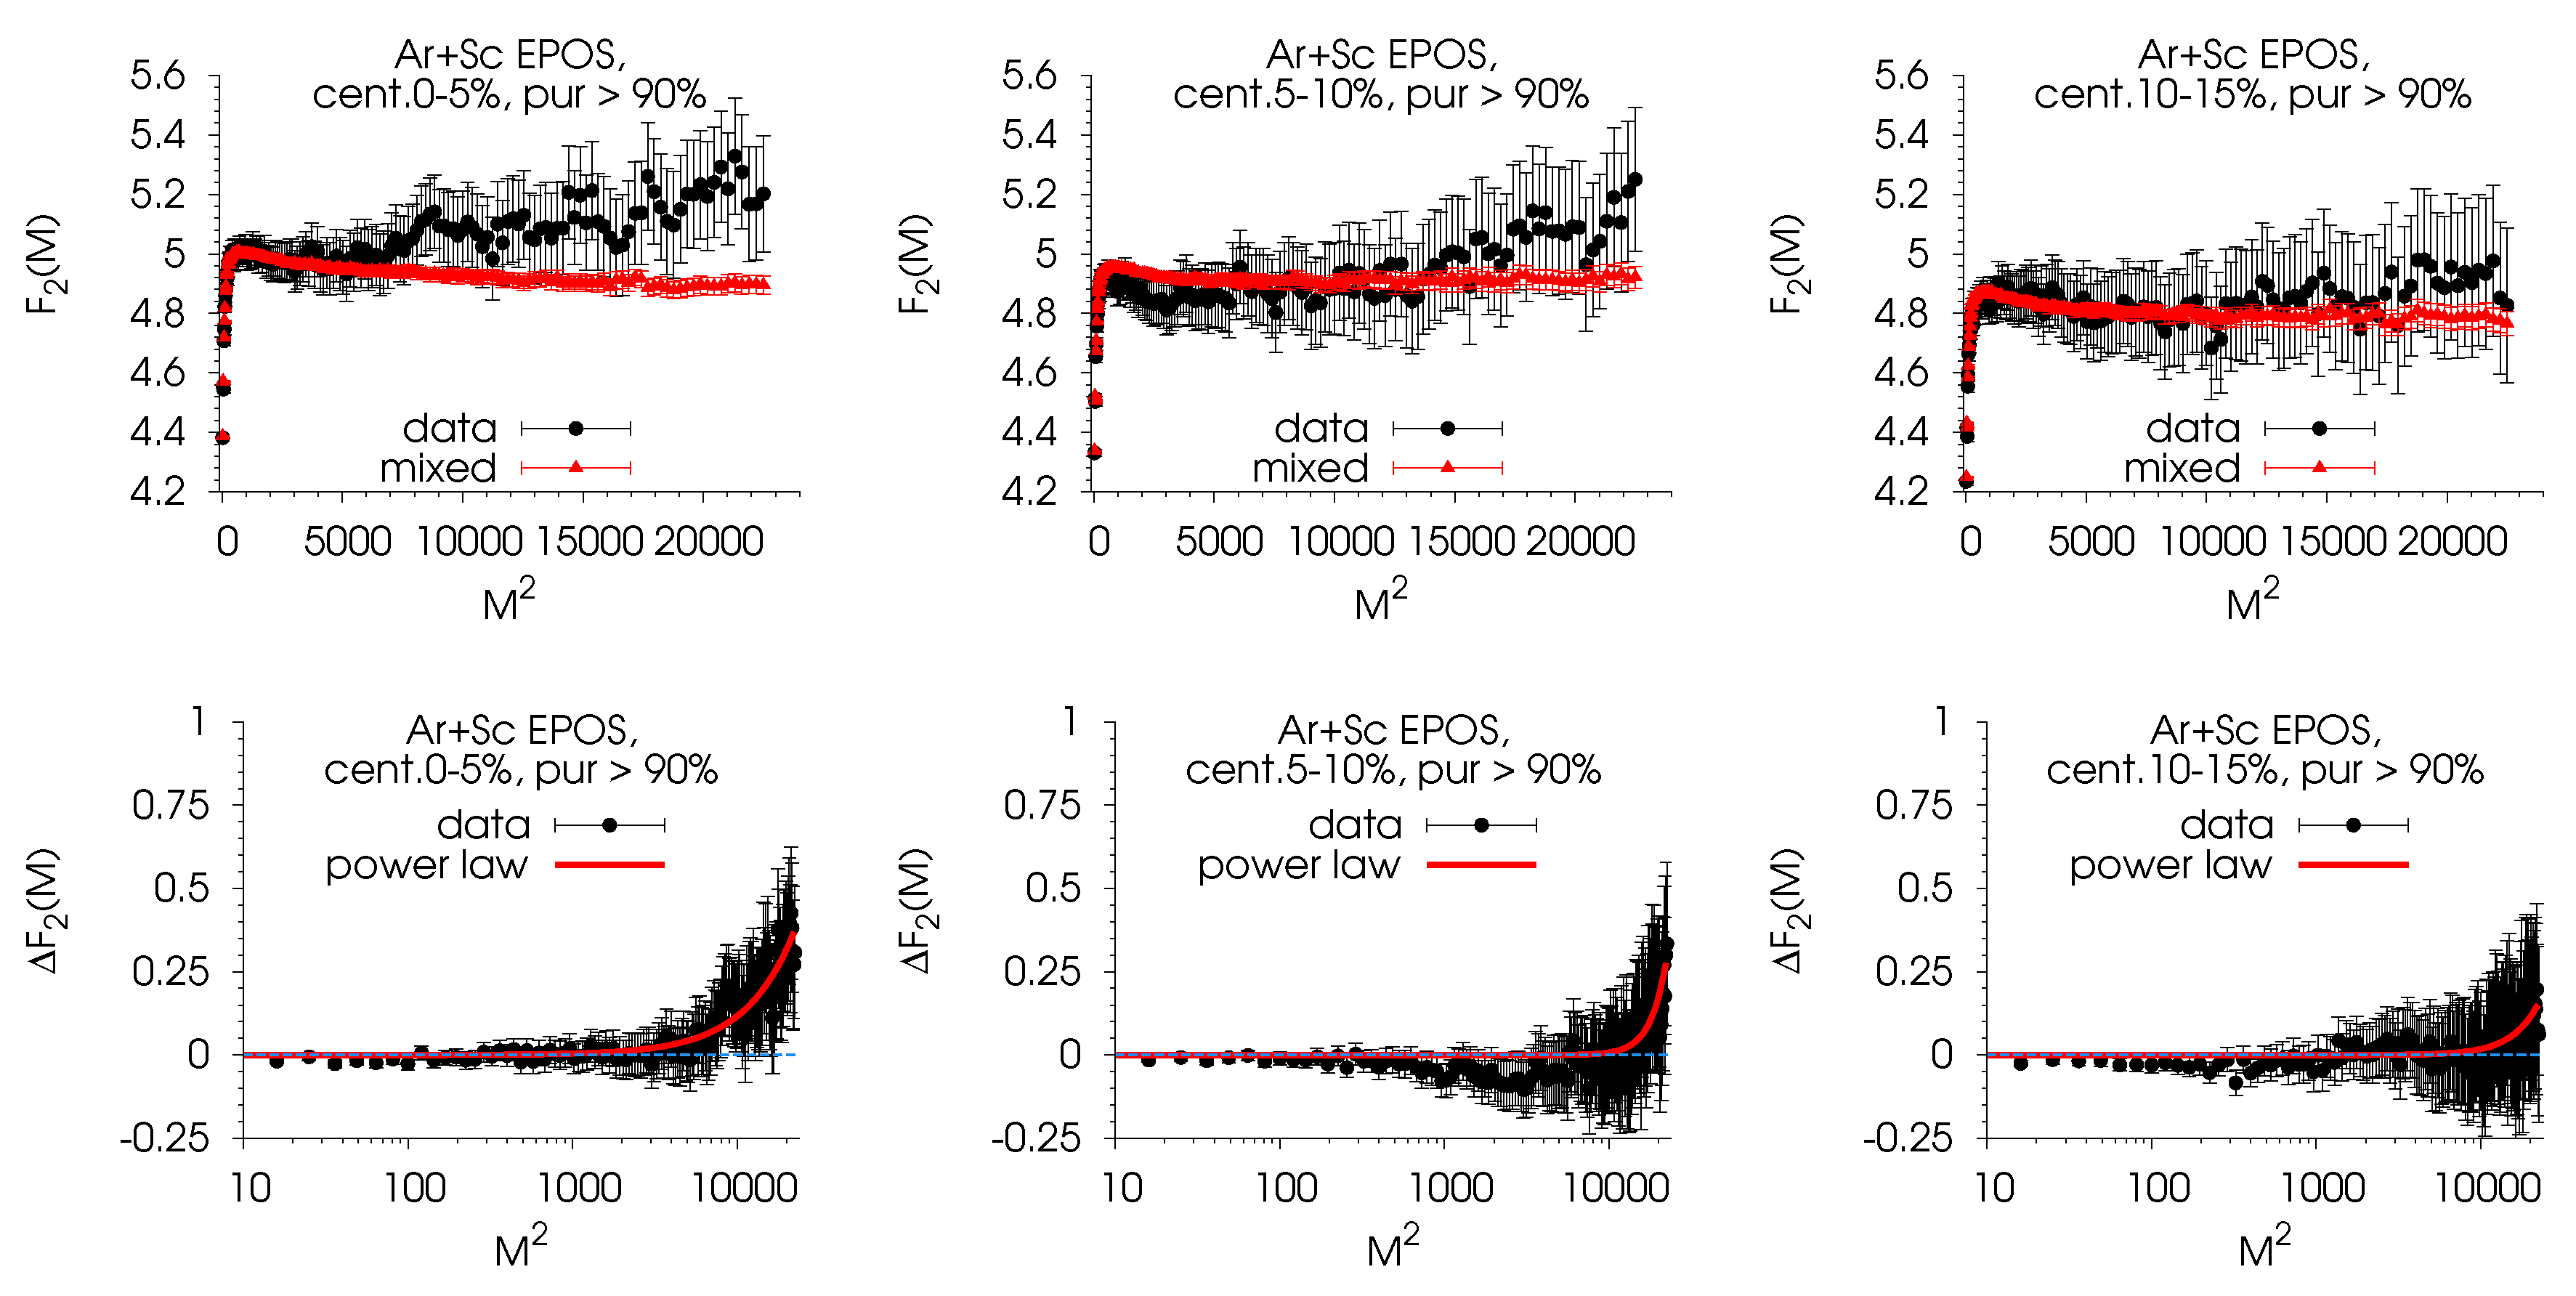
In contrast, Figure 4 shows the corresponding F 2 ( M ) and Δ F 2 ( M ) calculated within EPOS-simulated collisions. There is no prominent scaling of Δ F 2 ( M ) for midcentral collisions: a significant overlap of data and mixed event moments merely allows to perform power-law fits (red solid lines) just to guide the eye, as the fits fail due to the prevalence of negative Δ F 2 ( M ) values.
These results, however, are consistent with the simple but intuitive check that was performed for the ratio of P ( Δ p T d a t a ) / P ( Δ p T m i x e d ) distributions. The comparison of data and an EPOS event-generator simulation of the Ar + Sc system revealed a power-law-like structure for Δ p T 0 for middle-central (5%–10% and 10%–15%) NA61/SHINE Ar + Sc collisions, in contrast to the absence of any clear power-law structure in the corresponding EPOS spectra.

4. Discussion

The study of self-similar (power-law) fluctuations of proton density in transverse-momentum space through intermittency analysis provides us with a powerful tool for the detection of the QCD critical point. The strategy of NA61/SHINE, the successor of NA49, in this search is to perform a comprehensive two-dimensional scan of the phase diagram by changing the energy and size of colliding systems.
Up to now, no observed power-law behavior was detected for “C” + C, Pb + Pb (NA49), and Be + Be (NA61/SHINE) systems. However, a first indication of a nontrivial intermittency effect was detected in middle-central NA61/SHINE Ar + Sc collisions at 150A GeV/c, consistent with the one observed for 12% most-central “Si” + Si collisions at 158A GeV/c, but with large statistical uncertainties. For “Si” + Si, the estimated value of intermittency index 0.96 0.25 + 0.38 overlaps with the critical QCD prediction.
Preliminary NA61/SHINE results exhibit power-law scaling of the second-scaled factorial moments Δ F 2 ( M ) of proton density as a function of transverse-momentum bin size for Ar + Sc collisions at 150A GeV/c. Critical intermittency index ϕ 2 values are still to be properly evaluated, taking into account the magnitude of SSFM uncertainties, and the fact that F 2 ( M ) values for distinct M are correlated; the quality of Δ F 2 ( M ) power-law scaling remains to be established, and an estimation of ϕ 2 confidence intervals is still pending. However, one may qualitatively observe that intermittent behavior in Ar + Sc shows centrality dependence possibly due to the change of baryochemical potential and the small extent of the critical region in the phase diagram [37]. The observed effect is also sensitive to proton-purity selection and increases with the increase of the purity threshold. We note that EPOS1.99 does not reproduce the observed phenomenon. NA61/SHINE continues the analysis of other systems (Xe + La and Pb + Pb) and SPS energies (Ar + Sc) in order to obtain a reliable interpretation of the observed intermittency signal.

Author Contributions

Formal analysis, N.D.; talk on behalf of NA61/SHINE Collaboration at the 18. Zimanyi School Winter Workshop on Heavy Ion Physics, 3–7 December 2018, Budapest, Hungary, D.P.; writing—original draft preparation, D.P.

Funding

This work was funded by the National Science Center, Poland (grant No. 2014/14/E/ST2/00018).

Conflicts of Interest

The authors declare no conflict of interest.

References

  1. Grebieszkow, K. [NA49 Collaboration]. Search for the critical point of strongly interacting matter in NA49. Nucl. Phys. A 2009, 830, 547c–550c. [Google Scholar] [CrossRef]
  2. Anticic, T.; Baatar, B.; Bartke, J.; Beck, H.; Betev, L.; Białkowska, H.; Blume, C.; Boimska, B.; Book, J.; Botje, M.; et al. [NA49 Collaboration]. Measurement of event-by-event transverse momentum and multiplicity fluctuations using strongly intensive measures Δ[PT,N] and Σ[PT,N] in nucleus-nucleus collisions at the CERN Super Proton Synchrotron. Phys. Rev. C 2015, 92, 044905. [Google Scholar] [CrossRef]
  3. Asakawa, M.; Yazaki, K. Chiral restoration at finite density and temperature. Nucl. Phys. A 1989, 504, 668–684. [Google Scholar]
  4. Barducci, A.; Casalbuoni, R.; De Curtis, S.; Gatto, R.; Pettini, G. Chiral symmetry breaking in QCD at finite temperature and density. Phys. Lett. B 1989, 231, 463–470. [Google Scholar] [CrossRef]
  5. Bialas, A.; Peschanski, R.B. Moments of rapidity distributions as a measure of short-range fluctuations in high-energy collisions. Nucl. Phys. B 1986, 273, 703–718. [Google Scholar] [CrossRef]
  6. Bowman, E.S.; Kapusta, J.I. Critical points in the linear σ model with quarks. Phys. Rev. C 2009, 79, 015202. [Google Scholar] [CrossRef]
  7. Stephanov, M.A. QCD Phase Diagram and the Critical Point. Prog. Theor. Phys. Suppl. 2004, 153, 139–156. [Google Scholar] [CrossRef]
  8. Abgrall, N.; Andreeva, O.; Aduszkiewicz, A.; Ali, Y.; Anticic, T.; Antoniou, N.; Baatar, B.; Bay, F.; Blondel, A.; Blumer, J.; et al. [NA61 Collaboration]. NA61/SHINE facility at the CERN SPS: Beams and detector system. J. Instrum. 2014, 9, P06005. [Google Scholar] [CrossRef]
  9. Gazdzicki, M. for the [NA49-future Collaboration]. A new SPS programme. arXiv 2006, arXiv:nucl-ex/0612007. [Google Scholar]
  10. Gazdzicki, M.; Seyboth, P. Search for critical behavior of strongly interacting matter at the CERN Super Proton Synchrotron. Acta Phys. Pol. B 2016, 47, 1201. [Google Scholar] [CrossRef]
  11. Davis, N. Recent results from proton intermittency analysis in nucleus-nucleus collisions from NA61/SHINE at CERN SPS. In Proceedings of the CPOD 2018, Corfu Island, Greece, 24–28 September 2018. [Google Scholar]
  12. Alt, C.; Anticic, T.; Baatar, B.; Barna, D.; Bartke, J.; Betev, L.; Bialkowska, H.; Blume, C.; Boimska, B.; Botje, M.; et al. Centrality and system size dependence of multiplicity fluctuations in nuclear collisions at 158A GeV. Phys. Rev. C 2007, 75, 064904. [Google Scholar] [CrossRef]
  13. Alt, C.; Anticic, T.; Baatar, B.; Barna, D.; Bartke, J.; Betev, L.; Białkowska, H.; Blume, C.; Boimska, B.; Botje, M.; et al. Energy dependence of multiplicity fluctuations in heavy ion collisions at 20A to 158A GeV. Phys. Rev. C 2008, 78, 034914. [Google Scholar] [CrossRef]
  14. Adamczyk, L.; Adkins, J.K.; Agakishiev, G.; Aggarwal, M.M.; Ahammed, Z.; Alekseev, I.; Alford, J.; Anson, C.D.; Aparin, A.; Arkhipkin, D.; et al. [STAR Collaboration]. Energy Dependence of Moments of Net-Proton Multiplicity Distributions at RHIC. Phys. Rev. Lett. 2014, 112, 032302. [Google Scholar] [CrossRef]
  15. Anticic, T.; Baatar, B.; Barna, D.; Bartke, J.; Behler, M.; Betev, L.; Bialkowska, H.; Billmeier, A.; Blume, C.; Boimska, B.; et al. Transverse momentum fluctuations in nuclear collisions at 158A GeV. Phys. Rev. C 2004, 70, 034902. [Google Scholar] [CrossRef]
  16. Anticic, T.; Baatar, B.; Barna, D.; Bartke, J.; Betev, L.; Białkowska, H.; Blume, C.; Boimska, B.; Botje, M.; Bunčić, P.; et al. [NA49 Collaboration]. Energy dependence of transverse momentum fluctuations in Pb+Pb collisions at the CERN Super Proton Synchrotron (SPS) at 20A to 158A GeV. Phys. Rev. C 2009, 79, 044904. [Google Scholar] [CrossRef]
  17. Antoniou, N.G.; Contoyiannis, Y.F.; Diakonos, F.K.; Karanikas, A.I.; Ktorides, C.N. Pion production from a critical QCD phase. Nucl. Phys. A 2001, 693, 799–824. [Google Scholar] [CrossRef]
  18. Hatta, Y.; Stephanov, M.A. Proton-Number Fluctuation as a Signal of the QCD Critical End Point. Phys. Rev. Lett. 2003, 91, 102003. [Google Scholar] [CrossRef]
  19. Antoniou, N.G.; Diakonos, F.K.; Kapoyannis, A.S.; Kousouris, K.S. Critical Opalescence in Baryonic QCD Matter. Phys. Rev. Lett. 2006, 97, 032002. [Google Scholar] [CrossRef]
  20. Antoniou, N.G.; Davis, N.; Diakonos, F.K. Fractality in momentum space: A signal of criticality in nuclear collisions. Phys. Rev. C 2016, 93, 014908. [Google Scholar] [CrossRef]
  21. De Wolf, E.A.; Dremin, I.M.; Kittel, W. Scaling laws for density correlations and fluctuations in multiparticle dynamics. Phys. Rep. 1996, 270, 1–141. [Google Scholar] [CrossRef]
  22. Vicsek, T. Fractal Growth Phenomena; World Scientific: Singapore, 1989; ISBN 9971-50-830-3. [Google Scholar]
  23. Anticic, T.; Baatar, B.; Bartke, J.; Beck, H.; Betev, L.; Białkowska, H.; Blume, C.; Bogusz, M.; Boimska, B.; Book, J.; et al. Critical fluctuations of the proton density in A+A collisions at 158A GeV. Eur. Phys. J. C 2015, 75, 587. [Google Scholar] [CrossRef]
  24. Werner, K.; Pierog, T.; Liu, F.M. Parton ladder splitting and the rapidity dependence of transverse momentum spectra in deuteron-gold collisions at the BNL Relativistic Heavy Ion Collider. Phys. Rev. C 2006, 74, 044902. [Google Scholar] [CrossRef]
  25. Davis, N.; Antoniou, N.; Diakonos, F.K. Search for the critical point of strongly interacting matter through power-law fluctuations of the proton density in NA61/SHINE. In Proceedings of the CPOD 2017, Stony Brook, NY, USA, 7–11 August 2017. [Google Scholar]
  26. Anticic, T.; Baatar, B.; Barna, D.; Bartke, J.; Beck, H.; Betev, L.; Białkowska, H.; Blume, C.; Bogusz, M.; Boimska, B.; et al. K(892)0 and K ¯ (892)0 production in central Pb+Pb, Si+Si, C+C, and inelastic p+p collisions at 158A GeV. Phys. Rev. C 2011, 84, 064909. [Google Scholar] [CrossRef]
  27. Csorgo, T. Correlation Probes of a QCD Critical Point. arXiv 2008, arXiv:0903.0669. [Google Scholar]
  28. Diakonos, F.K.; Antoniou, N.G.; Mavromanolakis, G. Searching for the QCD critical point in nuclear collisions. arXiv 2006, arXiv:1701.02105. [Google Scholar]
  29. Wosiek, J. Intermittency in the Ising Systems. Acta Phys. Pol. B 1988, 19, 863. Available online: http://www.actaphys.uj.edu.pl/fulltextseries=Regvol=19page=863 (accessed on 30 April 2019).
  30. Bialas, A.; Hwa, R.C. Intermittency parameters as a possible signal for quark-gluon plasma formation. Phys. Lett. B 1991, 253, 436–438. [Google Scholar] [CrossRef]
  31. Metzger, W.J. Estimating the Uncertainties of Factorial Moments. HEN-455. 2004. Available online: https://repository.ubn.ru.nl/bitstream/handle/2066/60397/60397.pdf (accessed on 30 April 2019).
  32. Efron, B. Bootstrap Methods: Another Look at the Jackknife. Ann. Stat. 1979, 7, 1–26. [Google Scholar] [CrossRef]
  33. Hesterberg, T.; Moore, D.S.; Monaghan, S.; Clipson, A.; Epstein, R. Bootstrap Method and Permutation Tests; W. H. Freeman & Co.: New York, NY, USA, 2003; ISBN 0716757265. [Google Scholar]
  34. Michael, C. Fitting correlated data. Phys. Rev. D 1994, 49, 2616–2619. [Google Scholar] [CrossRef]
  35. Koonin, S.E. Proton pictures of high-energy nuclear collisions. Phys. Let. B 1977, 70, 43–47. [Google Scholar] [CrossRef]
  36. NA61/SHINE PSD Acceptance Map. Available online: https://edms.cern.ch/document/1867336/1 (accessed on 30 April 2019).
  37. Antoniou, N.G.; Diakonos, F.K.; Maintas, X.N.; Tsagkarakis, C.E. Locating the QCD critical endpoint through finite-size scaling. Phys. Rev. D 2018, 97, 034015. [Google Scholar] [CrossRef]
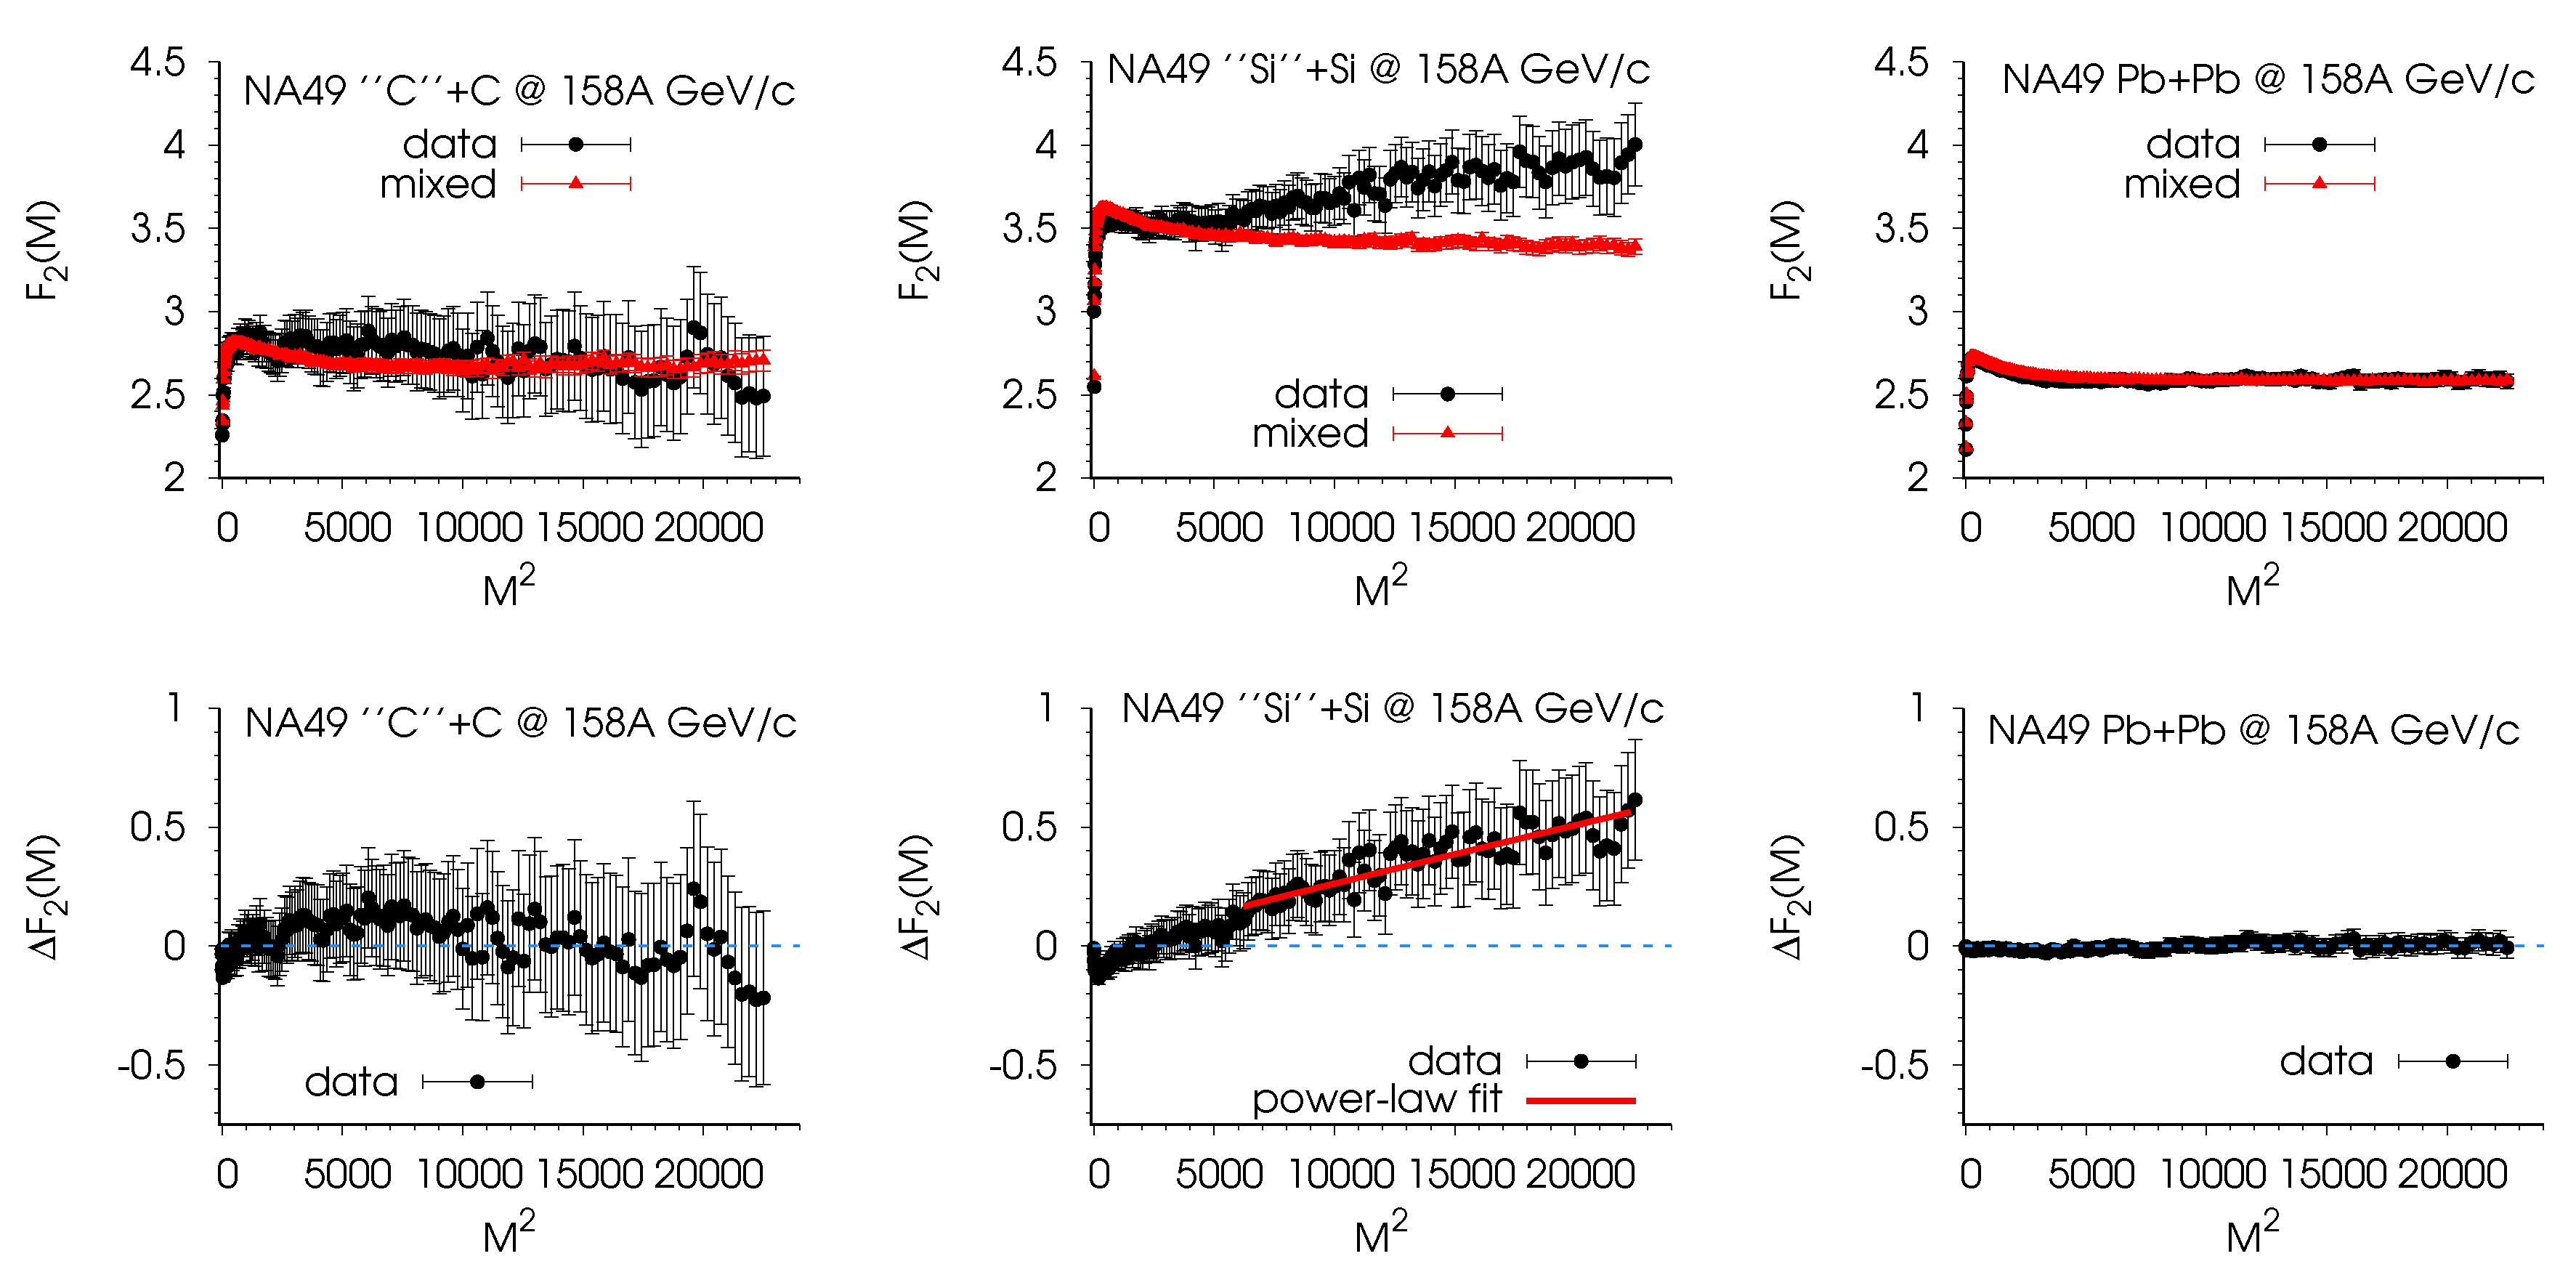
Figure 1. (Top row) F 2 ( M ) of original (filled circles) and mixed events (filled triangles) for NA49 “C” + C (left), “Si” + Si (middle), and Pb + Pb (right) most central collisions (12%, 12%, 10%, respectively) at 158A GeV/c ( s N N = 17.3 GeV). (Bottom row) Δ F 2 ( e ) ( M ) for the corresponding systems. “Si” + Si system (middle) is fitted with a power law, Δ F 2 ( e ) ( M ; C , ϕ 2 ) = e C ( M 2 ) ϕ 2 , for M 2 > 6000 .
Universe 05 00103 g001
Figure 2. F 2 ( M ) of protons in NA61/SHINE 10% most central Be + Be collisions at s N N = 16.8 GeV, for data (black circles) and mixed events (red triangles).
Universe 05 00103 g002
Figure 3. (Top row) F 2 ( M ) of original (filled circles) and mixed events (filled triangles) for NA61 Ar + Sc collisions at 0–5% (left), 5%–10% (middle), and 10%–15% (right) centrality at 150A GeV/c ( s N N = 16.8 GeV). (Bottom row) Δ F 2 ( e ) ( M ) for corresponding systems. Solid curves are drawn to guide the eye and correspond to power-law scaling functions, Δ F 2 ( e ) ( M ; C , ϕ 2 ) = e C ( M 2 ) ϕ 2 with parameters: (left) ϕ 2 = 0.21 , C = 4.27 ; (middle) ϕ 2 = 0.36 , C = 4.84 ; (right) ϕ 2 = 0.49 , C = 5.4 .
Universe 05 00103 g003
Figure 4. (Top row) F 2 ( M ) of original (filled circles) and mixed events (filled triangles) for EPOS Ar + Sc collisions at 0–5% (left), 5%–10% (middle) and 10%–15% (right) centrality at 150A GeV/c ( s N N = 16.8 GeV). (Bottom row) Δ F 2 e ( M ) for the corresponding systems. Solid curves are drawn to guide the eye and correspond to power-law scaling functions, Δ F 2 e ( M ; C , ϕ 2 ) = e C ( M 2 ) ϕ 2 .
Universe 05 00103 g004