4.1. J1606+3124
The 22-GHz radio structure of J1606+3124 agrees well with that recovered at 8 GHz by [
53], while the higher-frequency data resolve the inner region in much finer detail. The two epochs are separated by 76 d in the observer frame (corresponding to
d at
). The largest separation rate measured by [
53],
mas
for N relative to S, predicts a displacement of only
mas over 76 d. The C–S displacement is
mas. These shifts are negligible relative to the restoring beams and fitted component sizes, so component motion does not limit the cross-identification. The proper motions, however, do not constrain flux-density evolution. For that uncertainty, we use the directly measured 15-GHz modulation index,
, from 2014.4–2020 [
53]. Treating an
flux-density change as a conservative characteristic inter-epoch uncertainty gives
. This likely overestimates stochastic variability over only 76 d because the published light curve is dominated by a slow decline, but it provides a quantitative allowance for non-simultaneity. The different angular resolutions remain a separate systematic and prevent component-by-component spectral indices within blended regions.
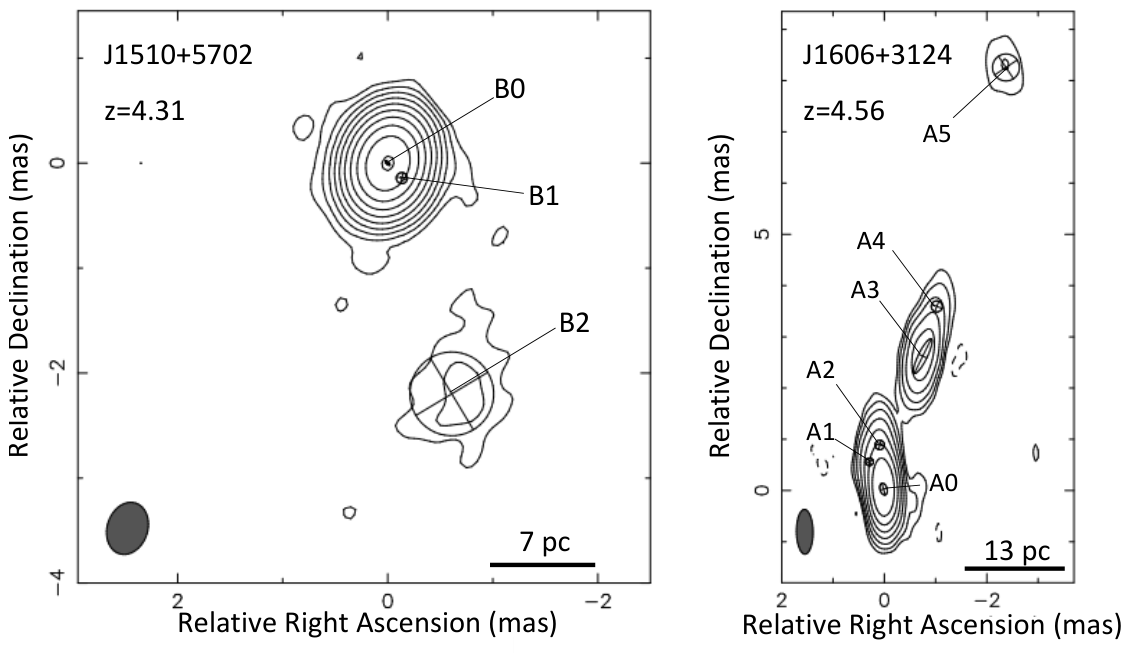
The outermost 22-GHz component A5 is associated with N in [
53]. Their component C corresponds to A3 + A4, while S + S0 corresponds to A0 + A1 + A2. The flux densities and the derived two-point spectral indices are listed in
Table 6. Including the variability term in quadrature gives total uncertainties of
for the spectral indices of the southern, middle, and northern regions. The spectral indices of the southern and middle regions are statistically indistinguishable, so their small difference cannot identify the core. The radio spectrum of the northern region is much steeper than either inner region even under the adopted variability allowance. Thus, the robust result is the strong outer-to-inner spectral steepening, but the derived spectral indices of the inner regions cannot be used as a unique core diagnostic.
An et al. (2022) [
53] described the object as a possible compact symmetric object (CSO) with the center of the AGN located in their component C, approximately at the position of our component A3. The steep radio spectrum they obtained for the northern and southern features using 2- and 8-GHz VLBI data and the overall peaked radio spectral shape of J1606+3124 led them to this classification. It was further supported by the slow long-term flux density variability and the mildly relativistic jet speeds they detected. In the new, higher angular resolution 22-GHz observation, the southernmost, brightest component, A0, has
modestly above the equipartition value, giving a nominal Doppler factor of
. This modest excess alone is not sufficient to rule out a compact hot spot interpretation of A0, but it shows that weak Doppler boosting is allowed by the data. If this Doppler factor is combined with the intrinsic jet speed of
inferred by [
53], it implies an inclination angle of
, consistent with the
value given in [
53]. The detected one-sided polarization could also be explained within the CSO scenario, where the approaching, brighter jet side is more polarized due to a smaller amount of intervening depolarizing material (e.g., [
54]).
Nevertheless, several properties keep a core–jet, blazar-like interpretation viable. The spectral indices calculated between 8 and 22 GHz show that the shapes of the radio spectra of the middle and southern features are very similar. The FWHM size of the assumed CSO core, A3, is larger than that of A0, the southernmost component. Additionally, the CSO description of J1606+3124 does not conform straightforwardly to the standard picture of expanding radio galaxies [
55]. According to that simple picture, assuming intrinsic symmetry, the approaching, brighter lobe should be seen farther away from the AGN center, while in J1606+3124, the arm-length ratio of the brighter to the fainter regions is smaller than unity. However, arm-length asymmetries in compact sources can also be produced by environmental gradients, so this argument is suggestive rather than decisive. Thus, our findings are also compatible with a core–jet scenario, where the center of the AGN is located at the brightest feature, A0, and a one-sided northern jet showing a slight wiggle at a few mas from the core can be detected.
The relatively low value of
was obtained assuming the equipartition value for the intrinsic brightness temperature. However, Homan et al. [
56] derived a lower median intrinsic brightness temperature,
K, using a large sample of quasars, implying
for J1606+3124. Moreover, the 22 GHz observing frequency corresponds to 124 GHz in the rest frame of J1606+3124, and Cheng et al. [
57] showed that the brightness temperature decreases with increasing frequency above 7 GHz until 240 GHz (in the source rest frame). This decrease is due to changes in the synchrotron opacity in the core region from optically thick to optically thin regimes. Thus, the low Doppler factor obtained at the 22 GHz observing frequency does not by itself exclude the possibility that J1606+3124 is a mildly-beamed core–jet source.
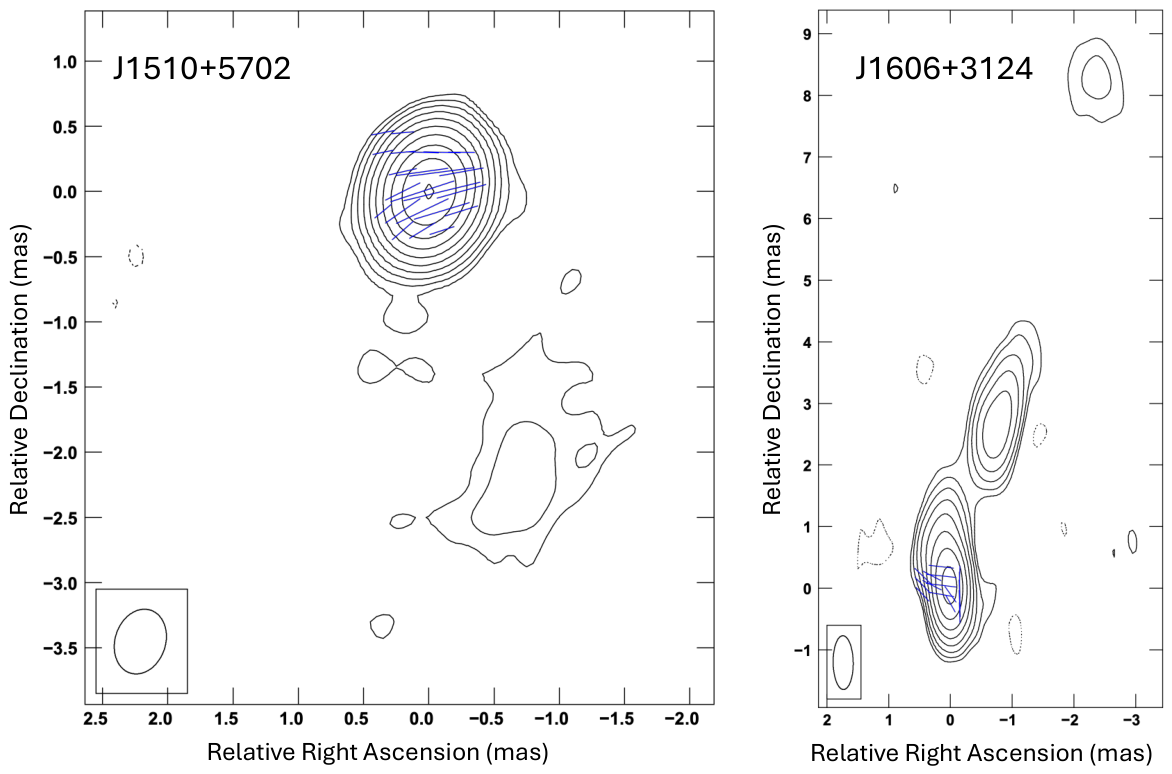
In that picture, the polarization would originate from an ordered magnetic-field component in the core region. Because the absolute EVPA is not calibrated for J1606+3124, only the relative EVPA structure can in principle be discussed. Moreover, given the low fractional polarization, the detailed EVPA pattern should be treated cautiously. In the displayed, uncalibrated EVPA frame, the components A0 and A1 fitted to the total-intensity visibility data roughly coincide with regions where the plotted EVPAs differ by
in J1606+3124. For comparison, the highest-redshift blazar with detected polarized radio emission, J0906+6930, showed a polarized component at a projected distance of
pc from the core at the similarly high rest-frame frequency of
GHz [
26]. This polarized feature was interpreted as arising due to jet–ISM interaction.
Multi-wavelength data of J1606+3124 indicate the presence of obscuration. X-ray measurements show a lack of ultraviolet and soft X-rays compared with quasars of similar redshift, and an obscuring column density of
, consistent with a Compton-thick absorber [
58]. According to the colour index given by the difference between the
-
m and 12-
m measurements [
59] of the
Wide-field Infrared Survey Explorer (
WISE) space telescope, J1606+3124 is an obscured AGN [
60]. The exact nature of J1606+3124 could be revealed if high-resolution optical data were available to pinpoint the location of the central engine. The source is not detected in the available data release of the
Gaia optical astrometry space mission, most likely because of its optical faintness (
R magnitude
[
32]), so no independent optical position of the nucleus with accuracy comparable to that of VLBI can presently be used for this purpose.
We note that the spectroscopic redshift of J1606+3124 is indicated to be uncertain by [
32]. The 8th data release of the Dark Energy Survey Instrument (DESI DR8 [
33]) gives a photometric redshift estimate well below the spectroscopic value,
. By adopting this redshift, the brightness temperature of component A0 of J1606+3124 turns to be
K, lower than the equipartition limit, thus not requiring Doppler boosting of the radio emission. Additionally, the expansion speed derived from the changing separation of components N and S by [
53] using this lower redshift value would result in an apparent transverse speed of
, and consequently a hot spot apparent advance speed of
. The projected linear extent of the radio-emitting structure would be
pc if it were located at this lower redshift. All these properties are in accordance with the CSO classification of J1606+3124. Within this lower-redshift framework, the polarization detection at 22 GHz corresponds to a rest-frame frequency of
GHz. Polarization was detected in the hot spot regions of a handful of CSOs in VLBI observations at 8 GHz and 15 GHz [
54,
61]. These showed that the closer, brighter side of the CSOs is polarized, possibly due to a lower level of Faraday depolarization. Thus, our detection of polarization can be interpreted in the CSO picture. However, we are not aware of the detection of a polarized signal in CSO hot spots at rest-frame frequencies as high as those in the case of J1606+3124.
4.2. J1510+5702
Our observation of J1510+5702 is in agreement with the blazar classification of this source, as we infer a high Doppler factor,
, for the brightest core feature under the equipartition assumption. This object is one of the highest-redshift
-ray emitters known. One
-ray flare of J1510+5702 was detected on 4 February 2022 with a
-GeV flux
times larger than the value given in the fourth
Fermi Large Area Telescope catalog [
28]. During the investigation of this flare, VLBI observations of J1510+5702 were performed at multiple frequencies (15, 22, 43, and 86 GHz) in three epochs with an array consisting of the Very Long Baseline Array (VLBA), the Effelsberg radio telescope, and the Green Bank Telescope [
29]. The 22-GHz radio structure of the source in our observation is similar to that found by [
29], except that they detected the core and two jet components in the northern region in 2022 and 2023. One month after the
-ray brightening, the jet component closest to the core had the highest flux density, which then continuously faded at 22 GHz. Our observation took place
yr before the
-ray flare (corresponding to
yr in the source rest frame). At that time, the core component was the brightest feature. The elliptical shape of the core component, B0, and its PA towards the jet extension in our observation indicate that in 2018, the core and the closest jet feature seen by [
29] could not yet be resolved in our observation. This is further supported by the change in the core separation of this component derived by [
29], which indicated a component ejection between 2016 and 2019. The core separation of B1 in our observation can be reconciled with the proper motion derived by [
29] for their C2 component.
Polarization of J1510+5702 was detected with VLBI earlier, at 5 and
GHz [
62]. At 5 GHz, polarization from both the core and the lobe feature could be detected, whereas at
GHz, only the core was significantly polarized. At 22 GHz, we similarly detected polarization from the core region only. The polarized flux density at 22 GHz is
, comparable to the
-GHz value reported by [
62],
mJy.
The 22 GHz observing frequency corresponds to 118 GHz in the rest frame of J1510+5702. At such high frequencies, the emission is expected to arise farther upstream in the blazar jet than at cm wavelengths, where a more ordered magnetic field, less Faraday rotation, weaker depolarization, and consequently higher polarization degrees may occur ([
5] and references therein). This was observed by [
5] in simultaneous polarimetric observations of more than 200 radio-loud AGNs at 86 and 229 GHz. They found median polarization degrees for flat-spectrum radio quasars of
% and
% at 86 and 229 GHz, respectively. We obtained a value similar to the former,
%, for the rest-frame 118 GHz polarization degree for J1510+5702. Additionally, this value exceeds the polarization degree obtained by [
62] at 8 GHz observing (43 GHz rest-frame) frequency,
%. This is consistent with the finding of [
5] that at mm wavelengths the degree of polarization increases with increasing frequencies, probably due to the lower Faraday depolarization effect, although the comparison here is based on non-simultaneous measurements. The diminished Faraday depolarization was also supported by the similar EVPAs they found at the two frequencies for their samples.
The average EVPA in the core of J1510+5702 is
at 22 GHz, while O’Sullivan et al. [
62] reported values of
and
at 5 and
GHz observing frequencies, respectively. The 22-GHz EVPA is therefore broadly similar to the lower-frequency EVPAs within the limitations of the non-contemporaneous observations and the approximate absolute EVPA calibration. We do not derive an RM from these data. The comparison nevertheless does not contradict the expectation that Faraday rotation and depolarization become less important at higher emitted frequencies. This is similar to the findings of [
5] for their samples.




 ,
,