1. Introduction
The discovery of the accelerated expansion of the Universe in 1998 [
1,
2] is an important milestone of modern cosmology. This behavior is quite different from the Friedmann model, which is expected from the Standard Cosmology description, developed in the 1960s–1970s. The Friedmann model description assumes only ordinary matter sources, and leads to power-law behavior, so that to fit the observed evolution, we need to add “unusual” matter, or to modify General Relativity (GR). The class of matter sources which could lead to the accelerated expansion is called Dark Energy (DE), as an energy source of unknown origin, and corresponding to the naming of Dark Matter (DM).
Of course, this behavior requires an explanation—and preferably a natural one—and, as a consequence, it has led to a rapid increase in suggested possible causes. The simplest of the DE models is just the cosmological constant (
-term), but this approach has its own difficulties [
3,
4,
5]. Other approaches include phantom cosmology [
6,
7], tachyonic matter [
8,
9], braneworld scenarios [
10,
11], scalar-tensor theories [
12,
13,
14],
-gravity [
15,
16,
17], holographic gravity [
18,
19,
20], Chaplygin gas [
9,
21,
22,
23,
24], models with extra (i.e., more than four) dimensions [
25], neutrinos of varying mass [
26,
27,
28], multi-coupled DE scalar fields [
29,
30] and many others. In addition, there are also models with fluid-based approaches (e.g., [
31]) or Cardassian cosmology [
32,
33,
34]. One may note that many of the theoretical models could be united under the approach of Horndeski’s theory [
35], which builds the most general ghost-free second-order Lagrangian. It includes some of the above-mentioned theories, but not all—for instance, it includes scalar fields and
, but not
, the generalization of
for the Gauss–Bonnet term. In addition to the references above, we would like to recommend [
36] as a comprehensive review of the current status of DE models—mostly observational, though.
In our work, we are using a scalar field to describe the accelerated expansion. In a sense, it is similar to the inflationary approach, but with a number of differences, like the energy scale (for inflation, we require Planck energy, while for current expansion, it is much lower) and other features (for instance, inflation should end and there should be a mechanism for inflaton decay, while for the scalar field responsible for current acceleration, there are no such requirements); one can even describe both inflation and DE with the same potentials [
37].
Without doubt, this is not the first attempt to reconstruct the DE scalar field—see, e.g., [
38,
39,
40,
41] as examples of early reconstruction attempts. However, the cited papers used one or another parameterization—of either the equation of state of the DE
or the Hubble parameter
or some other quantity—with a small number of free parameters. We can also note that similar reconstructions for some general parameterized DE can be found (see, e.g., [
42,
43,
44,
45,
46,
47,
48,
49,
50,
51]).
The above-cited works, as well as the current investigation, use supernovae Ia (SNe Ia) data. This is a good choice—it is agreed that the SNe Ia are “standard candles” (with a certain precision) which means that they have the same (known) luminosity and by measuring the flux one can obtain the distance, known as the photometric distance
, to them. On the other hand, spectroscopic observations provide us with the redshift
z for each particular SNe. Having both the photometric distance
and the redshift
z, one can build the so-called comoving distance
and reconstruct
. The reconstructed
is the starting point for all DE reconstructions—for instance, in our scalar field case, the potential and the kinetic terms are reconstructed from
and its derivative
; the other approaches are quite similar. If
CDM assumes parameterization of the equation of state of the Dark Energy in the form
, it could be connected to our considered scalar field case quite easily: in the simplest case,
, the Dark Energy could be described in terms of scaling [
52,
53] or tracker [
54] solutions—exponential, inverse power-law and several others [
54]. With more terms in the
decomposition, the solutions for the scalar field become less likely to be found, especially in the closed form, which makes the connection of
CDM with scalar fields less obvious. Clearly, the potential, resulting from
CDM, is a simple exponential or power-law potential that depends only on one or two parameters. In this case, the reconstruction will be much less noisy than in our parameter-free case. Similarly, the cosmography approach (see [
55] for review; [
56,
57,
58,
59] for the effects on GR level; [
60] for extended gravity; [
61] for
gravity; and [
62,
63] for
gravity) uses higher-order derivatives of the Hubble parameter:
,
and others. One can see that both of them are quite similar in approach but parameterize different variables.
We mentioned above that the previous DE scalar field reconstructions used some sort of parameterization while in our work we keep all parameters free. As we discussed in [
64], the models with and without parameterization pursue different goals and, as a consequence, have different results. With the use of parameterization, one usually has much lower errors—indeed, with parameterized
or
, it is much easier to reconstruct all the necessary quantities (sometimes even in a semi-analytical way), but particular parameterization immediately biases the scalar field potential shape (for our case). By contrast, without use of any parameterization, the errors of the reconstruction are several-fold higher, but the results do not have any bias (see [
64] for details).
The current manuscript extends the analysis performed in [
64]. There, we reported the technical details of the reconstruction process while we now undertake a full-scale analysis of the entire process. The manuscript has three goals—to demonstrate that the proposed scheme works correctly, to demonstrate that the error propagation leads to unreasonably high uncertainties due to employment of the binning scheme, and to investigate the effect of the usage of wrong values of
and
on the reconstructed potential (“(in)stability of the reconstruction”). The structure of the manuscript is as follows: In
Section 2, we present the basic equations and show how the
potential could be reconstructed using Friedman equations for the Friedmann–Robertson–Walker (FRW) metrics; in the same section, we also present the reconstruction techniques and methods. After that, we test our reconstruction method on synthetic data—
CDM in
Section 3 and the exponential potential in
Section 4. Error propagation and its effects on the reconstruction are analyzed in
Section 5 while analysis of the reconstruction stability is performed in
Section 6. Finally, we discuss the obtained results in
Section 7 and draw conclusions in
Section 8.
2. Potential Reconstruction
First of all, we must demonstrate the possibility of scalar field reconstruction without any assumptions. Thereby, let us show that there always exists a single field potential
that reproduces any observed Hubble parameter as a function of the redshift,
. We also need to demonstrate that the scalar field
could also be reconstructed from
. The only general assumptions are that the Universe contains matter with a known generic constant equation of state
and a single canonical minimally coupled scalar field. The well-known two independent Friedmann equations are (we put
)
Adopting the redshift
z as an affine parameter, we can write from (
2)
where
is the solution of
Obtaining
from (
4) and substituting it to (
3), after integration, we can derive
. Then, by combining (
3) and (
1), with use of (
4), one obtains
Finally, by jointly using and , it is possible to reconstruct for any observed . There is no guarantee, however, that the formal solution obtained this way is stable or unique or free of singularities.
Under the assumption that
(the pressureless matter), the solution of (
4) could be written in the form
, where
is the current value for the fraction of ordinary matter in the total energy budget. After we also introduce
, the current value for the Hubble parameter, the equations can be rewritten in the following way:
Our next step is to show how and its derivatives can be reconstructed from data, namely, from SNe type Ia for which as an input, we have the distance modulus with its error for each ith supernova at redshift (maybe with error , depending on the data).
For smoothing of the individual values of the distance modulus, we use two binning methods—binning with equal and with equal (number of supernovae), as well as their combination, if necessary. Later, we will discuss the pros and cons of these methods. Because we assume the Gaussian nature of the SNe errors, in each bin, the average values for the distance modulus are with an error , where is the number of supernovae in the jth bin. We also define —the error in z as the half-width of the bin (in case we have for each individual supernova, the definition for the error in binned z becomes more complicated). We keep this notation for the general case as for equal z binning, it gives the same value for , but for alternative binning, it will be different.
Firstly, we transform the distance modulus and its errors into the comoving distance
:
We process further to
, which is defined as
. We use a one-step differentiation scheme for simplicity, then the value and the error take the form
Let us also calculate the derivative of
with respect to
z:
Now, with both
(see Equation (
9)) and
(see Equation (
10)) calculated, we can recover the potential
and the kinetic part
. Errors can be calculated from Equations (
6) and (
7), in the following way:
The Equation (
7) (if positive!) could be integrated to get
(with an additive constant!). We use the rectangle method for integration; thus, the error propagation for the remaining steps is as follows:
Finally, using and together, we can recover .
At this point, it is appropriate to mention an ambiguity within the potential reconstruction, rooted in two steps. The first of the sources originates from (
7)—we reconstruct the kinetic term which is quadratic, which means that the field itself could either rise or decrease with
z (so that in the first of (
13), there should be ± in front of the square root). The second source derives from the fact that when we integrate the kinetic term to get the field itself, the reconstruction is valid up to a null-point (integration constant). So, we actually reconstruct the shape of the potential which is subject to shifts along the
-axis as well as mirroring to account for rising/falling potential. Due to the reconstruction technique, it is possible to reconstruct the potential only up to this ambiguity, and to get the actual potential, we have to rely on the additional assumptions or observational data.
In the sections to follow, we try the described scheme first on synthetic CDM data and then on synthetic data from the model with exponential potential.
3. CDM Synthetic Data
In this section, we test our scheme with synthetic
CDM data. We generate binned data for
CDM cosmology with
km/s/Mpc and
with bin size
and
, process it and recover
and
. As it is
CDM, the data are generated using the standard cosmological relationships
an appropriate rescaling and normalizations. Since our goal here is just to verify that
CDM recovers as a constant potential, we have not introduced additional variation of the central values with respect to
CDM predictions, as it will only contribute to the error budget. For the reference, the resulting data file used for the potential reconstruction for
CDM case is provided as
synth_LCDM.dat within the
Supplementary Materials; the format is (
z,
,
,
) with
(half-bin size) and
(some accepted value; affects only error propagation).
The results are presented in
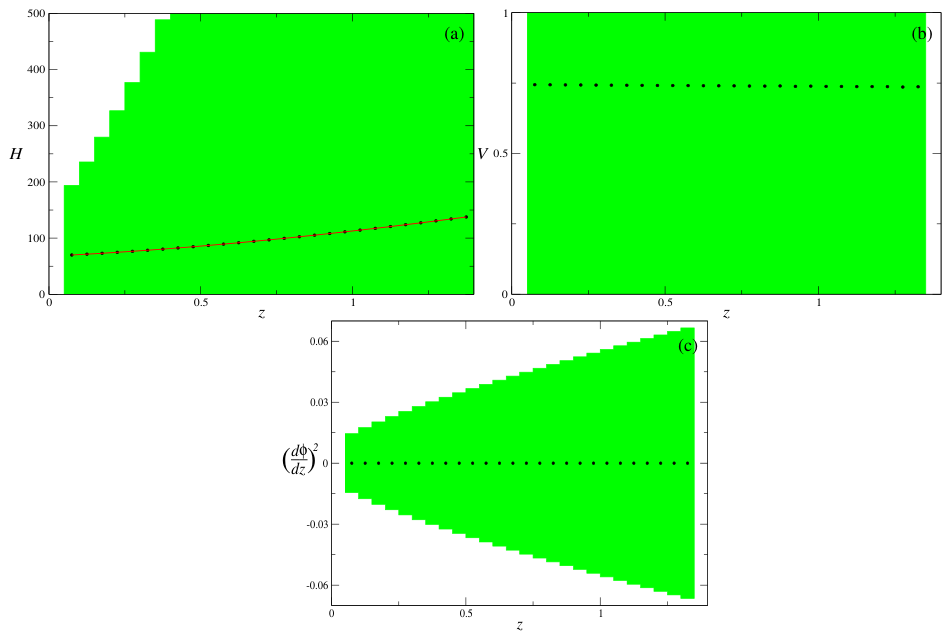
Figure 1. There, in panel (a), we present the results of the
recoverery—central values as black circles, green area as the
area and the red curve as the theoretical
curve calculated for
km/s/Mpc and
. One can clearly see that the
recovery is perfect—the central values exactly coincide with the theoretical curve. In panel (b), we present the recovered
with the same notations (except for the theoretical curve). As expected, for
CDM, the “potential” is just the constant
-term and with the proper coefficient, it corresponds to the chosen
. Finally, in panel (c), we present the results for the
recovery. Again, as expected from the theory, for
CDM, it should be exactly zero and that is what we observe in
Figure 1c—the divergences are on the level of
, which could be treated as “exact zero”.
So, one can clearly see that for CDM (and so for the constant potential), our scheme works perfectly; in the next section, we test it with real non-constant potential and see how the recovery works in that case.
4. Exponential Potential Synthetic Data
Now, it is time to test our scheme with synthetic data obtained from use of the exponential potential for the scalar field. Similarly to the previous section, we generate binned data with the following parameters:
km/s/Mpc,
and with bin size
and
. Since it is a Friedmann model with the scalar field, (
14) could not be used anymore and we have to solve the full system with the scalar field instead:
and the initial conditions are found from the constrain equation
There,
and
are the Hubble parameter and scalar field as functions of cosmic time
t and
accounts for ordinary matter (normalized to meet the accepted
at current time). Then, we start the numerical simulation at some time in the past and perform it until the contribution of the scalar field to the energy budget (
) meets the current accepted value (
) with
given as
Then, we renormalize the scale factor to 1 and the Hubble parameter to the accepted value
and recover
; for the reference, the resulting data file used for the potential reconstruction for the exponential potential case is provided as
synth_exp.dat within the
Supplementary Materials; the exact form of the potential is
with
,
and
. There,
(since we normalize everything to the critical density), which leads to the accepted numerical value after applying
normalization; as for the value of
B, in [
52], it was noted that for the exponential potential in the form of
with
, in order to be consistent with the nucleosynthesis bound, one needs
; to be conservative, we adopted an even higher value
which leads to the accepted numerical value for
B after applying
normalization; see also [
65] for example of
.
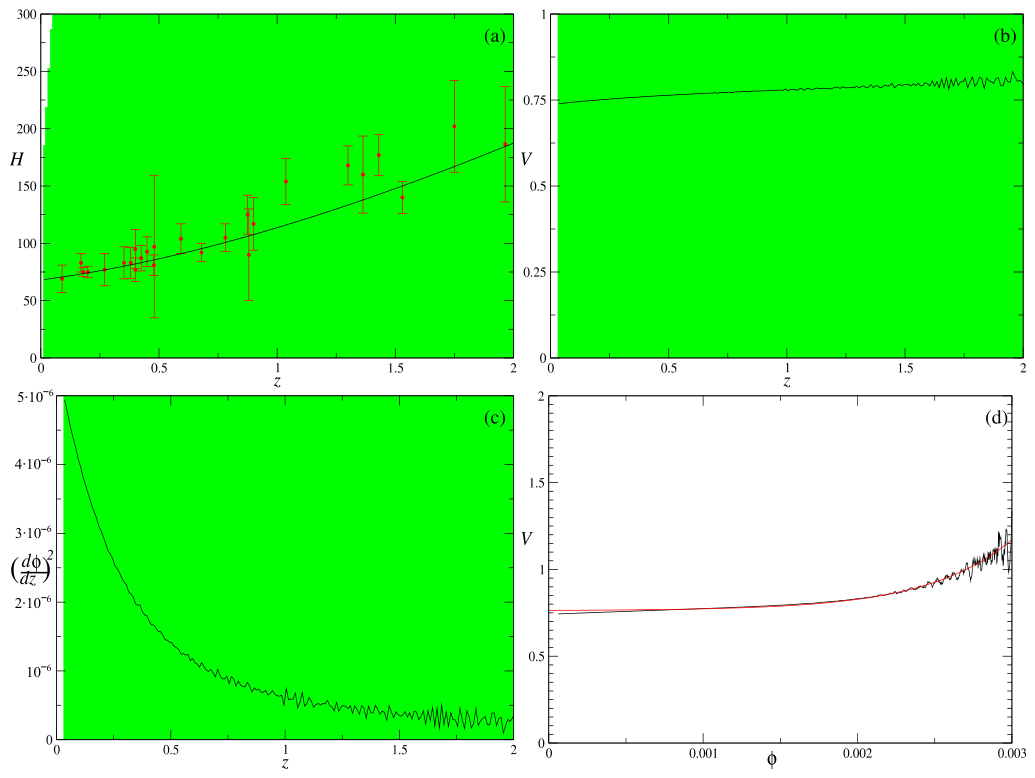
Then, we process the data as described above and the intermediate and final results are presented in
Figure 2. On all panels, the green area corresponds to the
error budget; black lines show the reconstructed quantity. So, in panel (a), we present the reconstructed
curve and add available non-SNe-based measurements of
as red points. In panel (b), we present the reconstructed
potential, while in panel (c), we present the reconstructed kinetic term
. Please note that it is always positive—as we will see later, this is not always the case when dealing with realistic data. After integrating the kinetic term, we obtain the scalar field
and by combining
with it, we finally obtain the “true” form of the potential
in panel (d). There, we have omitted the error budget—from the previous panels, we can see that it is immense. Also, for comparison, we have provided the theoretical curve for the potential as a red line.
Bearing in mind the reconstruction ambiguity mentioned above, since it is mock data and its purpose is just a demonstration, we assumed that we know that the potential is growing and there is no shift of the null point; however, for any realistic reconstruction, we have to be more careful with such assumptions.
To conclude, our scheme works well for the non-constant scalar field potential as well—we have checked it with the exponential potential. So, by using the mock data, we have demonstrated that our scheme works and reconstructs what it should. Now, there are several more points we need to note before testing the scheme with realistic data.
5. Error Budget and Propagation
As we defined previously, for synthetic data, we use half-bin size as
, so that
. Then, we can substitute it into (
9) and get
so that
; similar expressions could be obtained for
and
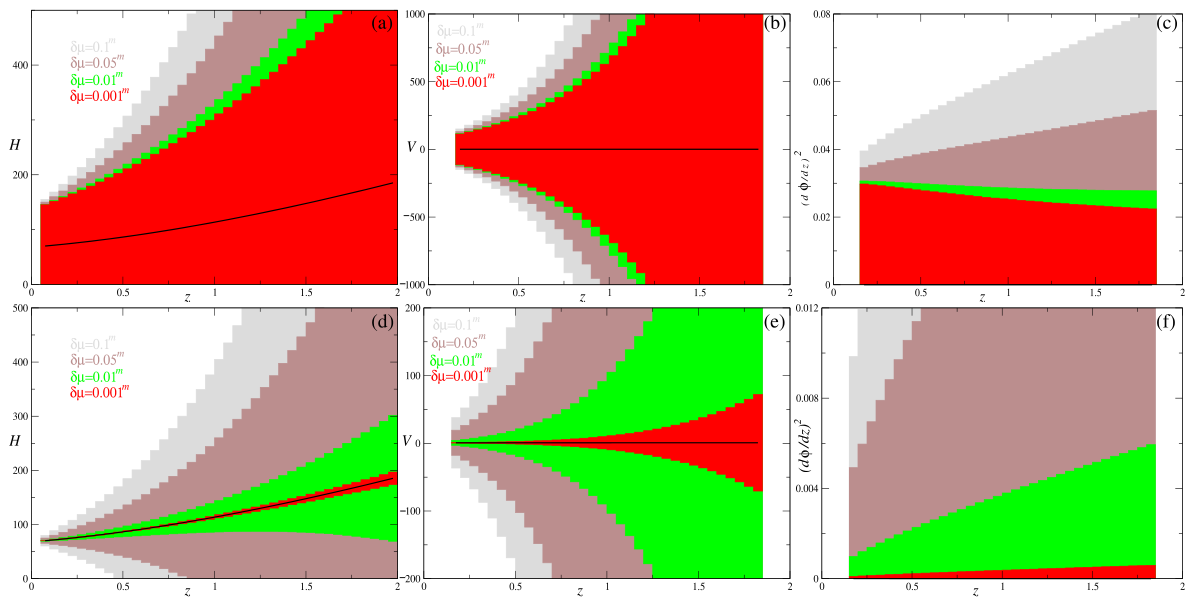
. There is some minimum error for the values and this error cannot be lessened by any means. The situation is illustrated in
Figure 3a–c—one can see that all
,
and
have some “constant” contribution to their errors which is not eliminated as
. We find this situation strange and decided to consider the
case. In this case, the error budget calculations look simpler and the “constant” contribution is eliminated; we present the results in
Figure 3d–f. Still, the errors are immense and for the variables of interest (
and
), the errors exceed the values by orders of magnitude. For instance,
, as seen from
Figure 3f, while
, as seen from
Figure 2c, which is 3 orders of magnitude lower; the situation is similar with
:
while
(see
Figure 2b and
Figure 3e). This is the situation with synthetic data, the situation with real data would be even worse.
The main source of increase in the errors lies in the numerical differentiation—indeed, say,
(green areas in
Figure 3) is quite low (please keep in mind that this is the error of the binned distance modulus) and unlikely to be achieved, yet, after one differentiation, it gives rise to a more-or-less wide area in
(see
Figure 3d) and after the second differentiation, the resulting error in
is already two orders of magnitude beyond the central value. So, due to the technique, it is natural to expect big errors in the resulting values.
Still, with extremely low values for
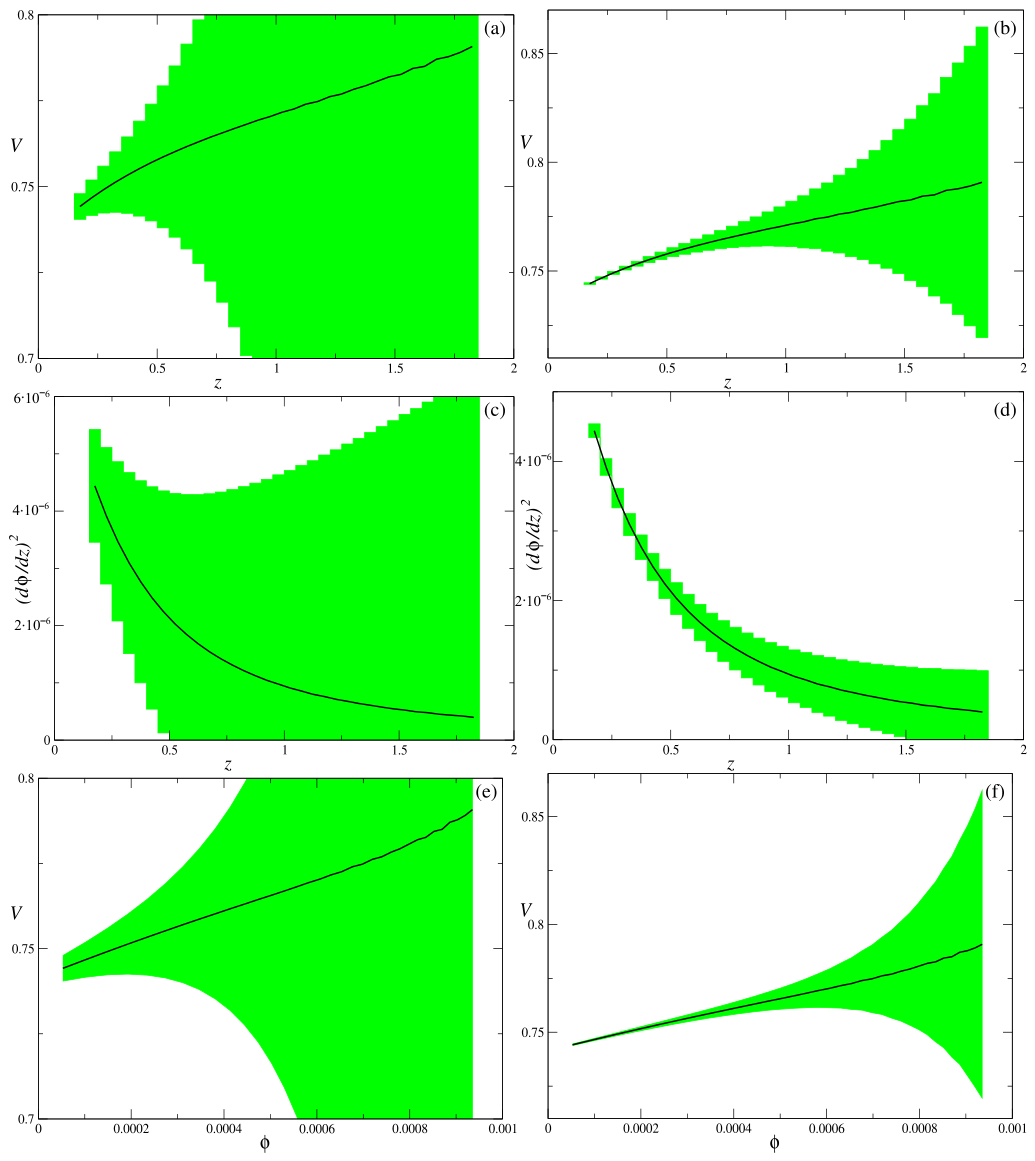
, a “good-looking” reconstruction of the potential is possible, but the values in question are orders of magnitude below what is reasonable. In
Figure 4, we depict the results of such reconstruction for
(left column, panels (a), (c) and (e)) and
(right column, panels (b), (d) and (f)). We present a reconstruction for the potential
(panels (a) and (b)), kinetic term (panels (c) and (d)) and the potential in the final form
(panels (e) and (f)). One can see that with these low values for
, the reconstructed potential looks quite good. Still, the values for
which are needed for such precision are extremely low and orders of magnitude below realistic values.
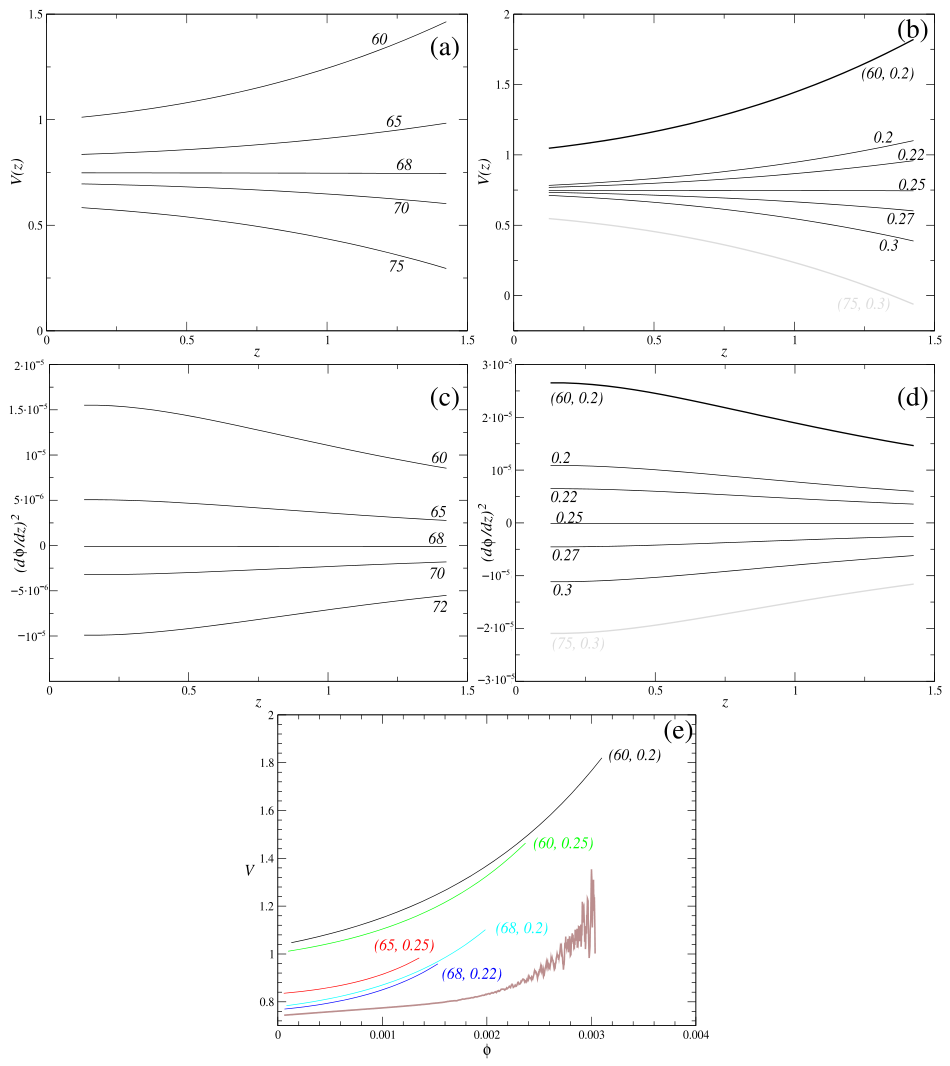
6. Stability of the Reconstruction
Another important issue we would like to address is the stability of the reconstruction. As noted and mentioned in many papers, the
and
are the parameters of the reconstruction and if we use “wrong” values for them, the reconstructed potential will be incorrect. In this section, we investigate the stability of the reconstruction with respect to this. For illustration purposes, we use synthesized
CDM data with
parameters and recover the potential for different values of
and
. The results are presented in
Figure 5. There, in panels (a) and (b), we reconstruct the potential
for different values of
(in panel (a)) and
(in panel (b)). One can see that the exact
values give exactly
CDM with constant potential and a zeroth kinetic term, as demonstrated earlier. One can see that underestimated values for both
and
give rise to growth of the potential with
z while overestimated values start to violate the energy budget. This can be seen more clearly from panels (c) and (d), where we present the kinetic term reconstruction. One can see from panels (c) and (d) that overestimated values for both
and
result in a negative kinetic term, which is non-physical (at least within the considered model). Finally, in panel (e), we perform the reconstruction of the potential for underestimated
and
values. We also present the reconstructed potential from the scalar field section for comparison (solid brown curve).
So, the underestimation of the and values acts as effective positive potential while overestimation acts as negative: indeed, we performed the analysis for CDM where the “native” kinetic term is identically zero, but if there were some “native” potential, the overestimation of the and values subtracts some effective potential from the real one and, depending on the exact potential and the parameters, this could even lead to violation of the energy budget, as in the CDM case.
The extent of influence of the “fake” potential arising from use of the wrong
parameters is quite high—as we can see from
Figure 5e, the potentials arising from all the considered cases exceed the potential reconstructed from our mock scalar field data.
7. Discussion
The main obtained results can be summarized as follows:
We proposed and developed a scheme which reconstructs the scalar field potential for the Dark Energy without any additional priors or assumptions. The latter is important—indeed, this is not the first attempt to reconstruct the scalar field potential, but earlier attempts used priors for parametrization or the equation of state , or some others; our scheme is free from all of them—we reconstruct the potential purely from raw (synthetized) SNe data (photometric redshift and distance modulus);
Our scheme is proved to work perfectly for both CDM and mock scalar field data;
We showed that the resulting uncertainties are huge even for quite precise mock data, and even the limit of negligibly small intrinsic uncertainties in data does not eliminate the resulting errors. The reason for this lies in usage of binning—we binned the data and processed the binned data, which implies that if one still wants to reconstruct the potential in an unparametrized way, some other technique should be used;
We demonstrated that usage of “wrong” (different from apparent) values for
gives rise to fake real or “phantom” (negative kinetic term) potential. Underestimation of
gives rise to real fake potential as shown in
Figure 5e, which could be even greater than the actual potential. Overestimation of
gives a negative potential and kinetic term and could prevent the actual potential from being detected.
Let us discuss the results further. The reconstruction method proves to work perfectly on the
CDM data—the recovered
potential is non-zero constant which corresponds to the chosen
and the kinetic term is zero with appropriate numerical precision (see
Figure 1). The exponential potential scalar field data provide for the reconstructed
and the kinetic term, both always positive. This allows us to further reconstruct the potential in the
form (see
Figure 2). One can note a “flickering” in the high
z region on the reconstructed
and the kinetic term; this comes from the numerics—the mock data were generated with small
which leads to“flickering” of this type while performing numerical differentiation with even a tiny deviation from the smoothness—and any generated data would be like this. The
curve also has them but of much smaller amplitude, but after performing the second differentiation (
is the second derivative of
), their amplitude would rise, and that is what we observe in
Figure 2b–d. Overall, the resulting reconstructed
(see
Figure 2d) fits quite well with the original. As mentioned in the main text, reconstruction is subject to ambiguity coming from the sign alternating of the square root as well as uncertainty of the reconstructed potential zero-point location, so that for the reconstruction from real data, we will need additional insights on both of them.
In [
64], we mentioned that the main source of the extrinsic error is the numerical differentiation—since we are not using any
ansatz for the effective equation of state or
or some other parametrization, we have to perform full numerical differentiation and this give rise to the uncertainties. To reduce them we decided to skip
—errors in
z. Formally,
z is also a result of the measurement, but different from
. Also, while binning, we average data over a number of SNe with different
z, so consideration of
could make sense. But, apparently, consideration of
equal to the half of the bin size gives rise to a constant contribution to the propagated errors. Analytical considerations are given in the appropriate section, and the results are presented in
Figure 3. There, on the upper row ((a–c) panels), we present the results of the errors with
for several different
. One can easily see that even at
, the resulting error does not tend to zero but approaches some constant value instead. We found this to be contradictory to common sense and tried the same analysis but with
; the results are provided on the bottom row of
Figure 3d–f. There, one can see more realistic behavior of the resulting errors for different
. Still, the errors for
and the kinetic term are immense and for the considered values for
, restoration of the potential is possible but the resulting uncertainties raise questions about the viability of the reconstruction. And this is happening for
—the values are unlikely to be reached for realistic SNe datasets anytime soon. Still, it is interesting to find values for
which allow clean reconstruction of the potential. So, in
Figure 4, we present reconstruction of the potential for
and
—one can see the errors for the reconstructed potential, but one also should note that such small values for the
are impossible from a practical standpoint.
This implies that the binning technique which we used in the current paper to smooth the SNe data amplifies error beyond reasonable values and this method cannot be used for practical purposes. Thus, one requires another way around and one of the widely used possibilities is mentioned in the Introduction parametrization of the Hubble parameter. In addition to the pros and cons discussed there, let us add one more argument. Generally speaking, typical parametrization of the Hubble parameter functional form is a mathematical procedure—like that mentioned in the Introduction series on powers. However, for the Friedman equations, this parametrization is made physical with all terms having physical meaning; so, all the terms of the parametrization should also have some physical meaning and determining this could be nontrivial. So, usage of such parametrization, despite being mathematically correct, would raise questions about the physical meaning of the introduced terms. However, if we dig deeper, we will find out that, in some cases, even the usage of parametrization itself is not quite mathematically rigorous—for instance, when using series, they obviously have some radius of convergence and outside of this radius, formally, we cannot consider such parametrization.
One of the recent potential reconstruction attempts can be found in [
66]. The authors considered not SNe data but
, compiled from different sources such as cosmic chronometers and baryon acoustic oscillations. This simplifies the procedure—only one differentiation is needed in this case, at the cost of a much smaller quantity of data points. Also, to smooth/average the data, the authors used a Gaussian process, and, as a result, the authors reconstructed the potential both in power-law and free forms.
However, there are examples of physically motivated parametrizations as well—for instance, in [
67], the authors considered interacting DE and DM with the interaction rate being proportional to the energy density of DE and obtained the functional form of the Hubble parameter as
; a similar model but with the interaction rate proportional to the energy density of DM leads to a slightly different form [
68]
which allowed [
69] to consider a generalization form of these two. However, these two forms are obtained under the condition that DE and DM interact; so, their usage for the “usual” model where both DE and DM are conserved individually is not quite rigorous. Overall, one can clearly see that the parametrization indeed allows one to set constraints on the parameters but creates additional questions which are not that easy to address.
Another important issue with the potential reconstruction techniques which we studied is the stability of the reconstruction with respect to the values of
and
. Indeed, as one can see from (
11) and (
12), the values for
and
are the parameters of the reconstruction, so that they define the shape of the reconstructed potential. So, if we choose them wrongly, we will not be able to properly reconstruct the potential. To quantitatively analyze the situation, we used
CDM data generated for
km/s/Mpc and
and reconstructed the potential with different values for
and
. The results of the reconstruction are presented in
Figure 5. From
Figure 5a,b one can see that underestimation of
and
leads to the appearance of the positive potential while underestimation, the negative. The same is true for the kinetic term, presented in
Figure 5c,d—underestimation of
and
leads to the appearance of the positive kinetic term while overestimation to the negative. Combining the two, we see that underestimation of
and
leads to the appearance of the “fake” potential while overestimation to its disappearance (if there was any). In other words, even if there was no potential to begin with but we underestimate
and/or
, we shall reconstruct a “fake” one, while if there is a potential but we overestimate
and/or
, we detect it as suppressed or even do not detect it at all. The magnitude of the “fake” reconstructed potential could be estimated from
Figure 5e where we plot reconstructed potentials from different (
) combinations alongside the scalar field potential reconstructed from the mock data (as a brown curve)—one can see that the amplitude of the “fake” potential could easily surpass the real one. This could be seen as something to be expected—indeed, if we reconstruct with use of parameter values different from “intrinsic”, one would expect that the result of the reconstruction will not be the same as the original, but to the best of our knowledge, this is the first quantitative description of the effect so far, making it a good reference.