


Abstract
In this work, the light curve of the Seyfert galaxy Mrk 6 constructed from photometric observations in the B, V, and filters over the period from 5 April 2016 to 1 February 2026 is presented and analyzed. Over the entire monitoring interval (2016–2026), the variability amplitude of the light curve reaches mag, mag, and mag. During 2024–2026, the galaxy exhibits synchronous photometric variability in the B, V, and filters with an amplitude of ∼0.3 mag. The study also uses spectroscopic observations obtained on 15 and 22 November 2025 and 16 February 2026 at the Shamakhy Astrophysical Observatory (Azerbaijan), as well as on 9 January 2026 at the Fesenkov Astrophysical Institute (Kazakhstan). The fluxes in the H emission line were calibrated using the [O III] Å line, ensuring consistent relative calibration of the spectral data. A comparison of the optical spectra reveals a pronounced transformation of the H line profile between November 2025 and January 2026. The broad component, clearly present in November 2025, becomes strongly suppressed and nearly disappears in January 2026, while the narrow emission lines remain stable. This behavior is consistent with a changing-look transition, indicating a temporary weakening of the broad-line region emission. The radius of the broad-line region was taken to be equal to the average time delays (lags), amounting to ≈20 light days for the H emission and ≈28 light days for the H.
1. Introduction
Markarian 6 (IC 450) is an intermediate-type active galactic nucleus (Sy 1.0–1.5) that exhibits pronounced variability in the optical, ultraviolet, and X-ray bands. Sergeev and Doroshenko (2003) [1,2] analyzed the optical spectral variability of the Mrk 6 nucleus during 1970–1991 and showed that the H emission lags behind the continuum by an average of days. The long-term UBV photometric variability of Mrk 6 was investigated by Doroshenko (2003) [2] using combined data from 1970 to 2002, where the variability amplitudes were found to be , , and . In a subsequent large-scale monitoring campaign (1992–2008) based on reverberation mapping, lags of ≈ days for H and ≈27 days for H were obtained [3], and the mass of the central black hole was estimated as ∼(1.8–2.0) [3]. Analysis of XMM–Newton data showed that the X-ray absorption has a multi-component and variable nature [4]. Schurch & Griffiths reported significant changes in the absorption between observations and proposed a clumpy or partially ionized structure of the absorbing material [5]. More recent studies have confirmed the presence of ionized X-ray winds (UFO/WA) in Mrk 6 [6], while long-term X-ray monitoring has revealed the multi-timescale temporal and spectral variability of the nucleus [7]. Spectropolarimetric data indicate a short lag between the polarized and total continuum, suggesting a compact scattering region and a complex internal structure of the BLR [8]. VLBA observations show that the galactic nuclear jet has a curved, multi-component morphology, and that the energy of the large-scale radio cavities is driven by AGN jet activity [9]. IFU spatially resolved spectroscopic studies have revealed extended structures of ionized gas and their connection with AGN emission [10], while spectral variations on hourly timescales confirm strong turbulence and inhomogeneous dynamics in the BLR [11,12]. Thus, Mrk 6 is a suitable target for multiwavelength comparative analysis of the BLR structure, the multilayered nature of the absorbing medium, and the optical–X-ray–radio connections. Building on the results of previous long-term monitoring [13,14], this paper presents a comprehensive variability analysis of Mrk 6 using photometric observations starting from 5 April 2016 and supplemented with new data taken in 2026.
2. Materials and Methods
Photometric observations of the Seyfert galaxy Mrk 6 were carried out at the Tien Shan Astronomical Observatory (TShAO) of the Fesenkov Astrophysical Institute using the Zeiss-1000 (Carl Zeiss Jena, GDR) “East” telescope ( mm, m). The angular field of view of a single CCD frame is .
Since 2016, observations and image acquisition have been performed using the Alta F16M CCD camera (4096 × 4096 pixels, 9 μm pixel size), which was operated until November 2021. From mid-2022 onward, observations have been conducted with the U9000D9 CCD camera in combination with Astrodon filters. The angular scale of the CCD frames was 0.56″/pixel after 2016 and 0.752″/pixel after 2021.
The spectra of Mrk 6 were obtained with the 1.5 m AZT-20 telescope at the Assy-Turgen Observatory of the Fesenkov Astrophysical Institute. Its spectrograph is equipped with volume phase holographic gratings and an EMCCD camera. Additional spectral observations of the galaxy were carried out with the 2 m telescope at the Shamakhi Astrophysical Observatory. Wavelength calibration was performed using comparison lamp spectra of He, Ne, and Ar. Absolute flux calibration relied on spectra of standard stars with known energy distributions. A spectral data reduction was performed using the IRAF (Image Reduction and Analysis Facility) software package [15] developed at the National Optical Astronomy Observatory (NOAO).
Photometric observations of Mrk 6 were obtained during 2016–2026. The galaxy brightness was measured using differential aperture photometry with nearby comparison stars. The photometric reduction was performed using the MaximDL Pro 6 [16] software package with an aperture radius of 6″. Instrumental magnitudes were transformed to the standard B, V, and photometric system using the standardization equations described in Shomshekova et al. (2017) [17].
For each observation night, 5–7 CCD frames were obtained in each filter, and the instrumental magnitudes and their uncertainties were calculated as mean values over the corresponding series of frames. The resulting photometric errors are therefore small and are listed in Table 1.
Table 1.
New photometric observations of Mrk 6 obtained in 2024–2026.
The root–mean–square (RMS) error was calculated for each image and is also presented in Table 1. The maximum magnitude variations in each filter were determined as the difference between the observed maximum and minimum brightness values on the corresponding light curves; no averaging near the extrema was applied.
3. Results
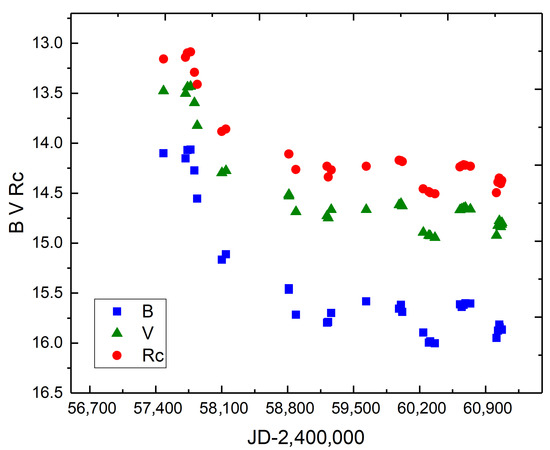
The results of our new photometric observations obtained between 14 November 2024 and 1 February 2026 in the B, V, and filters are presented in Table 1. The observations show that the variability of the galaxy in the B, V, and filters is synchronous in nature. Over this interval, the brightness amplitudes are 0.35 mag in the B filter, 0.27 mag in the V filter, and 0.28 mag in the filter. Over the entire monitoring period from 2016 to 2026, the total variability amplitude of the light curve reaches 1.9 mag in the B filter, 1.5 mag in the V filter, and 1.4 mag in the filter. The maximum brightness of the galaxy was recorded on 17 January 2017.
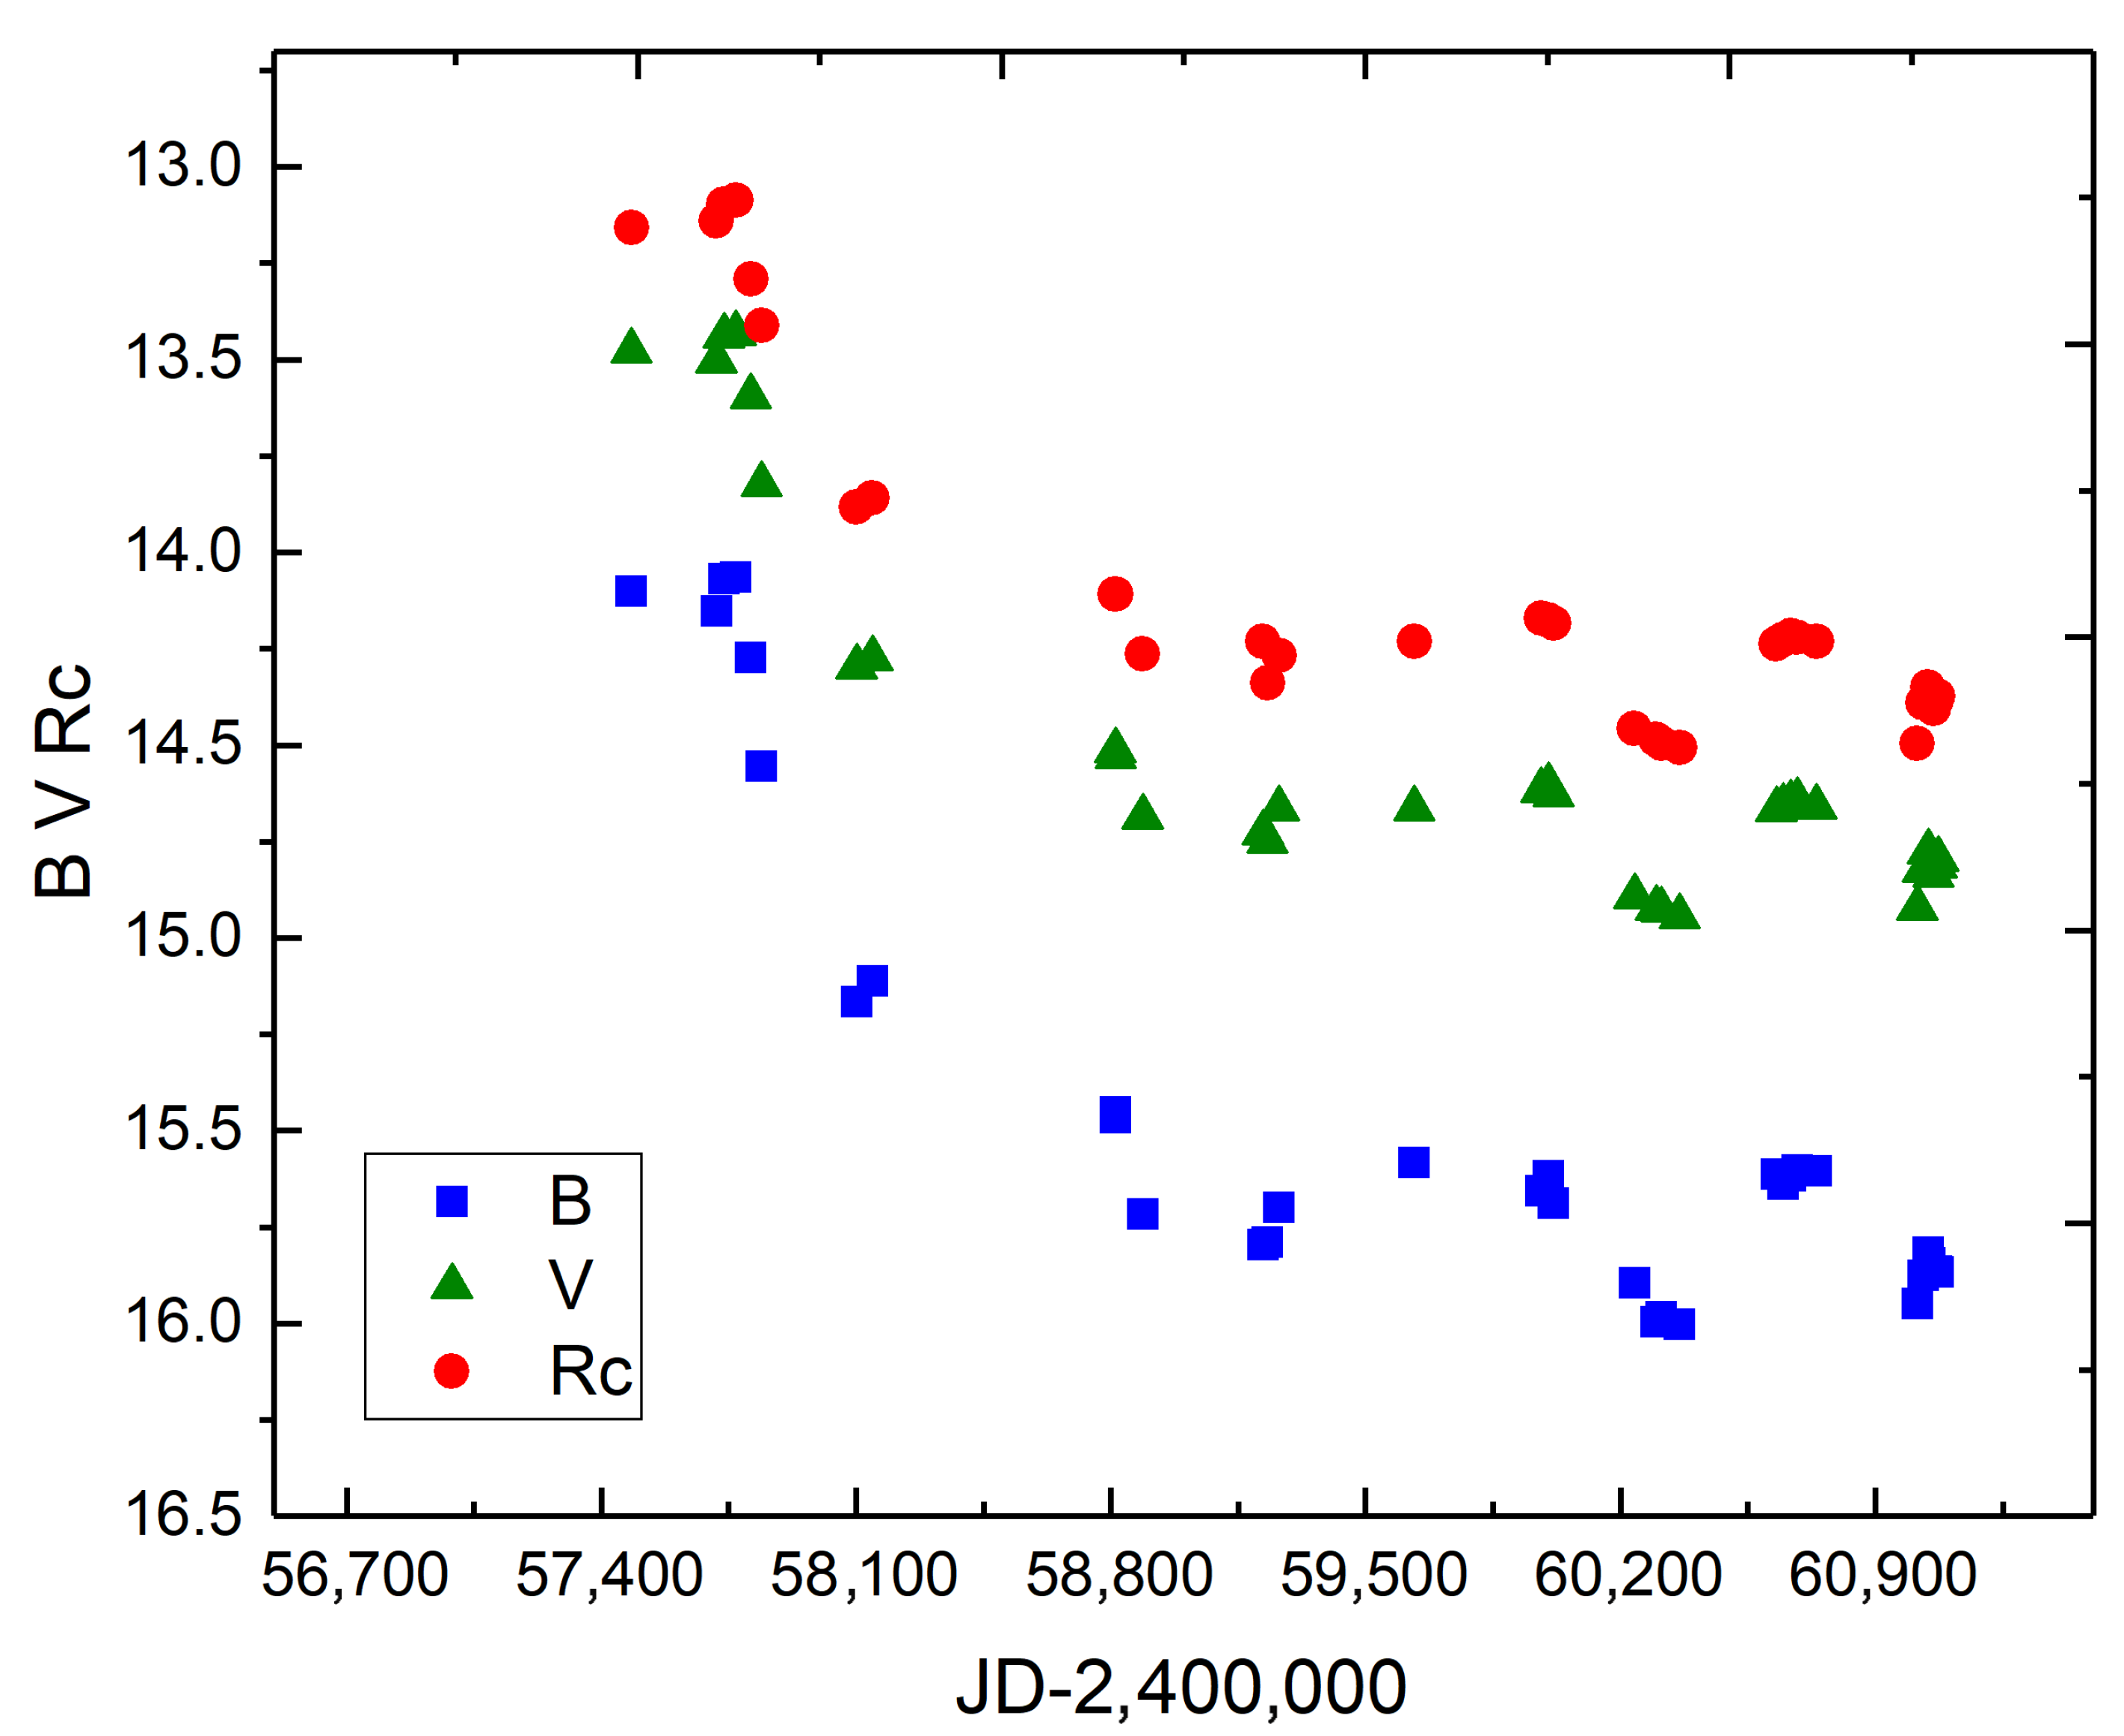
For completeness of the analysis, we used all photometric data obtained starting from 5 April 2016 together with the new observations. Figure 1 presents the light curve constructed in three photometric filters over the period from 5 April 2016 to 1 February 2026. The light curve includes data from Shomshekova et al. (2019) [13], covering the interval 2016–2019, where a decrease in the object brightness by approximately 0.9 mag was reported during 2017–2019. Photometric observations presented in Shomshekova et al. (2025) [14] for the period from November 2019 to February 2024 confirmed this trend: after reaching maximum brightness in early 2017, the object faded by approximately 1 mag by the beginning of 2018. In addition, comparison of archival and recent spectral data revealed that the additional component in the blue wing of the H line, detected in the 1976 spectra, is also present in the 2024 spectra, with a radial velocity of about 2450 km s−1 (Shomshekova et al., 2025) [14].
Figure 1.
Light curves of MRK6 obtained in 2016–2026.
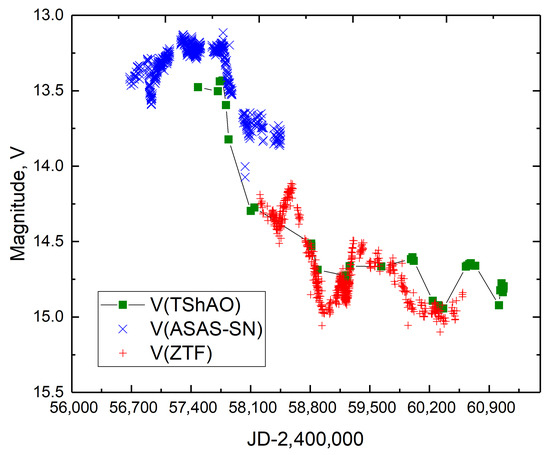
For an independent verification of the variability amplitude, data from the ASAS-SN and ZTF survey programs were used. According to the ASAS-SN data in the V filter for the period from 25 January 2014 to 29 November 2018, the variability amplitude is about 0.6 mag. The ZTF photometric data in the g and r filters were transformed to the V system using the relation
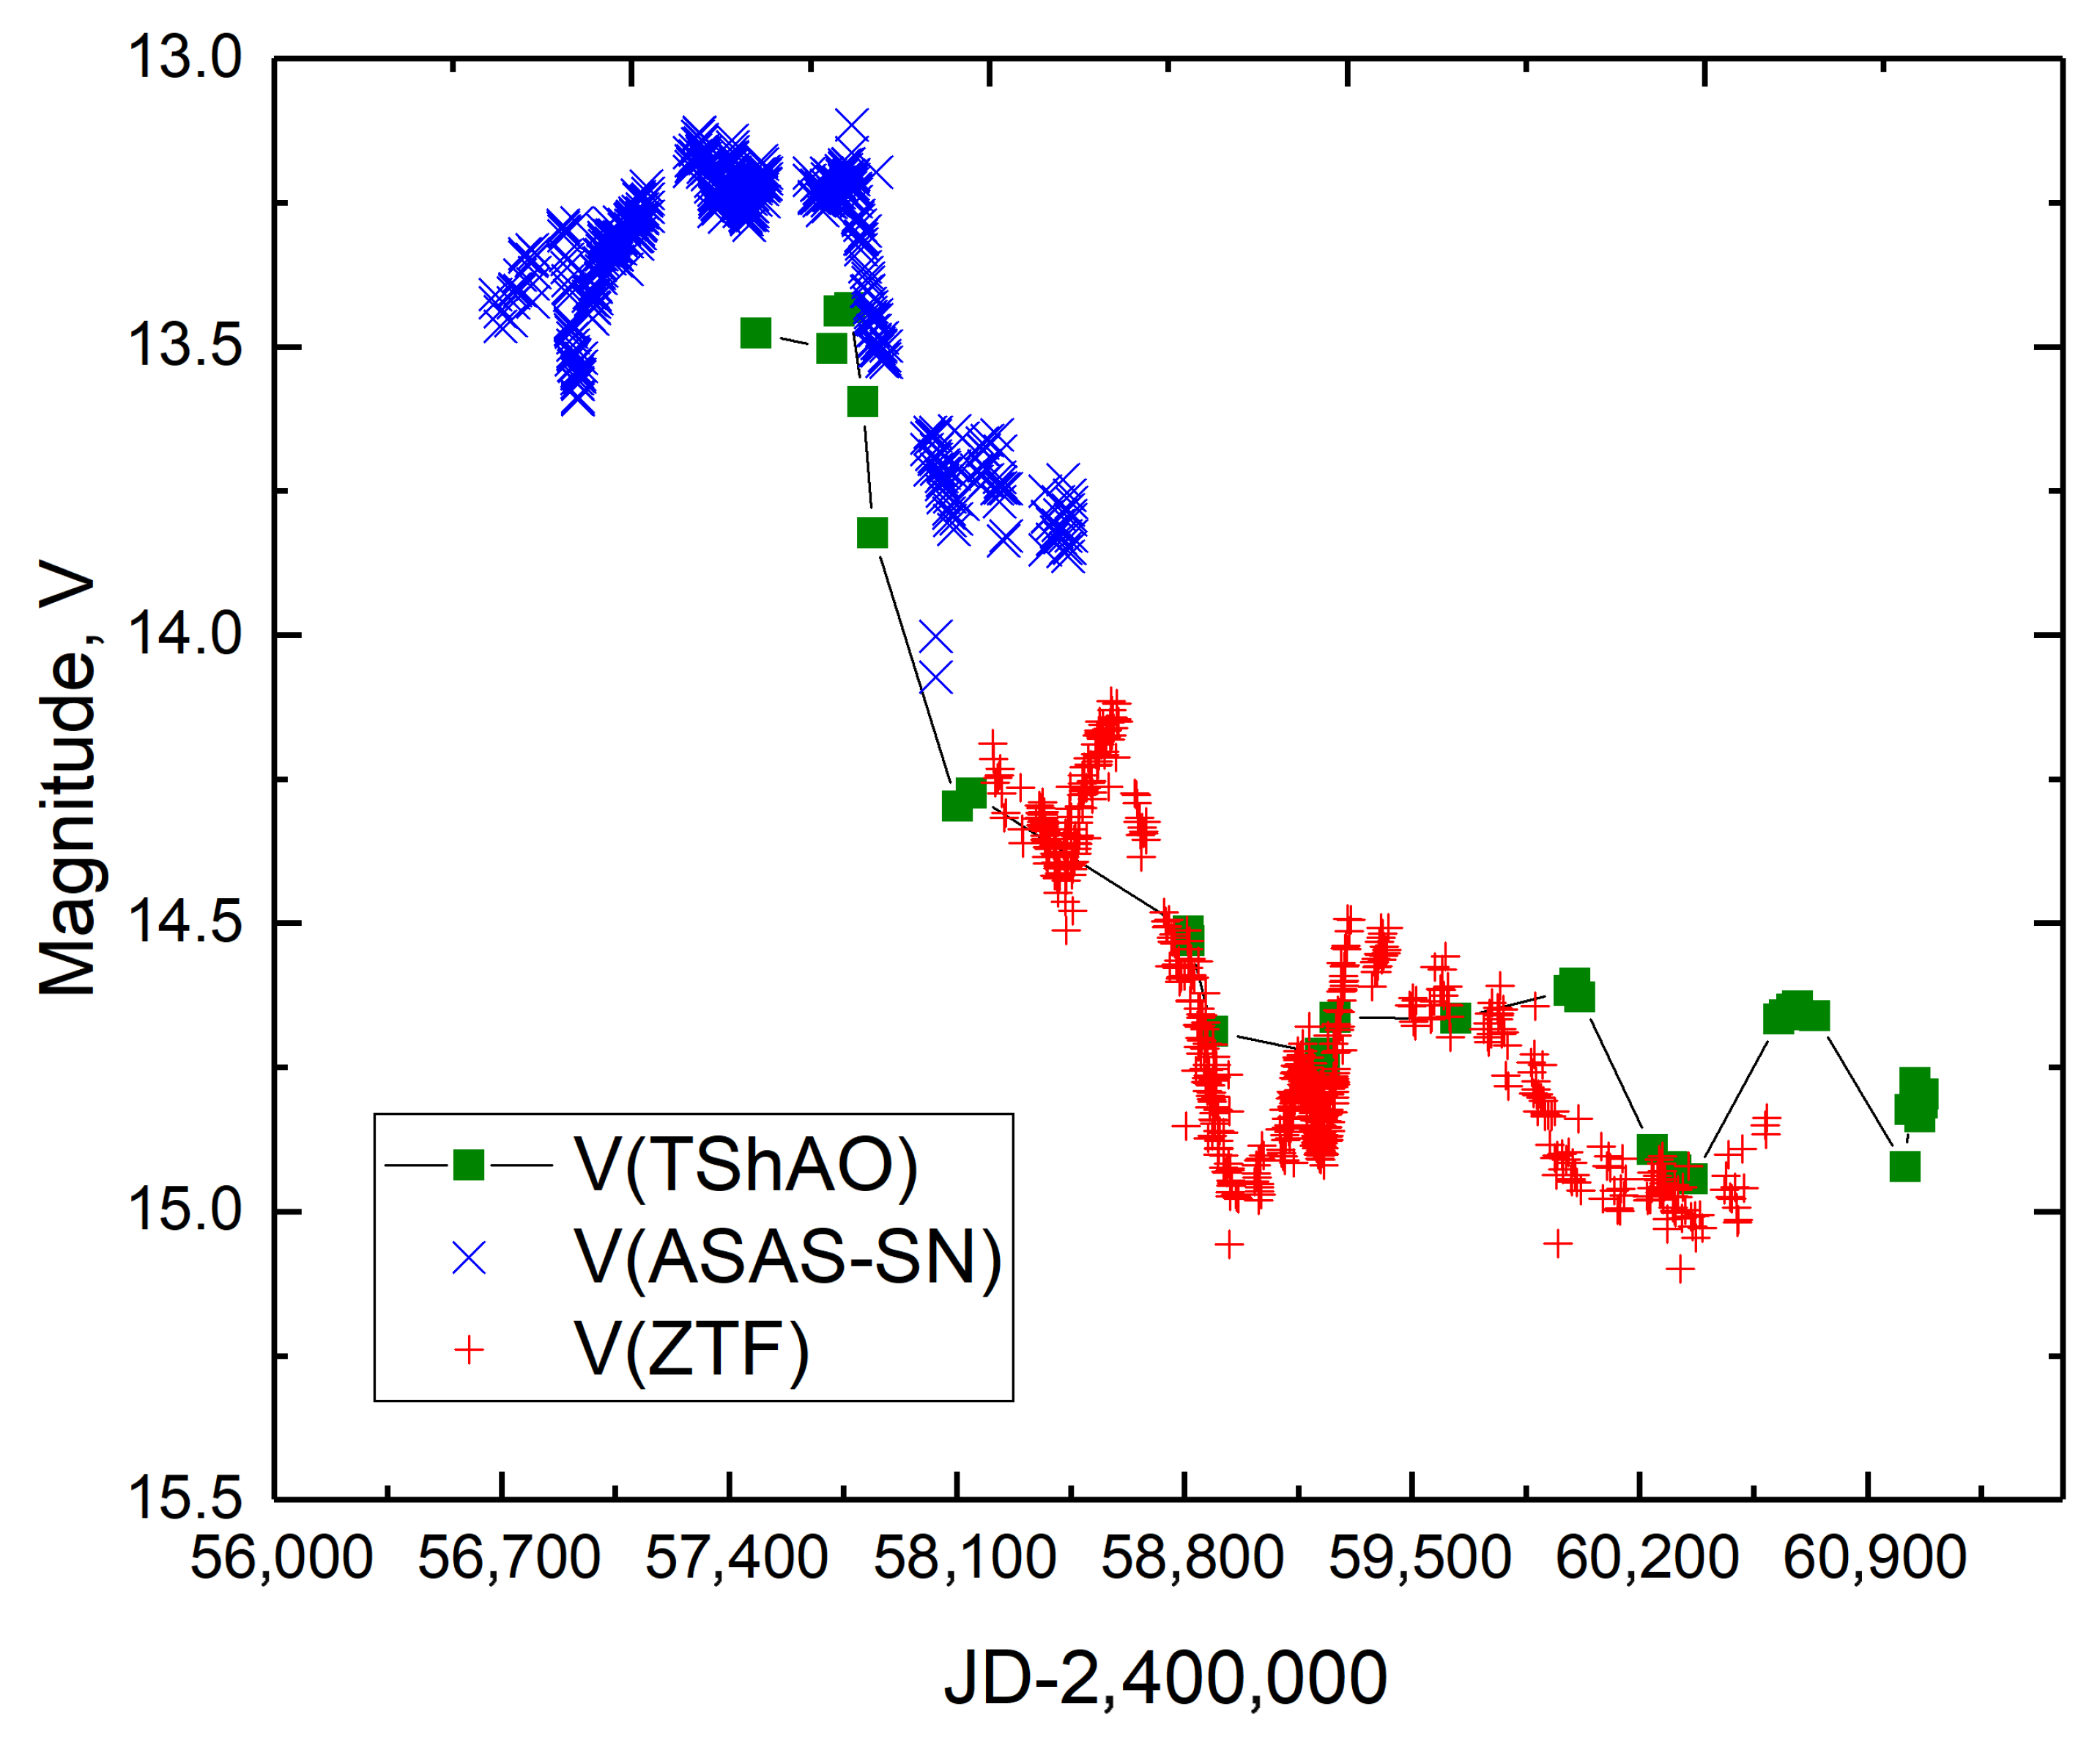
After the transformation, the variability amplitude of Mrk 6 during the period from September 2018 to 22 November 2023 was found to be about 0.7 mag, as shown in Figure 2.
Figure 2.
Independent verification of the optical variability of Mrk 6 using ASAS-SN V-band data (2014–2018) and ZTF photometry transformed to the V system. The observed amplitudes are ∼0.6 mag and ∼0.7 mag, respectively.
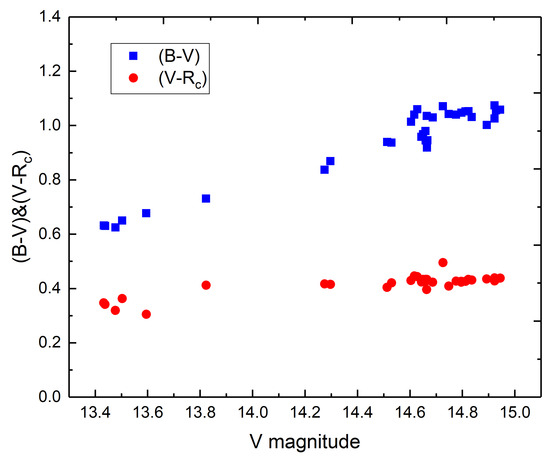
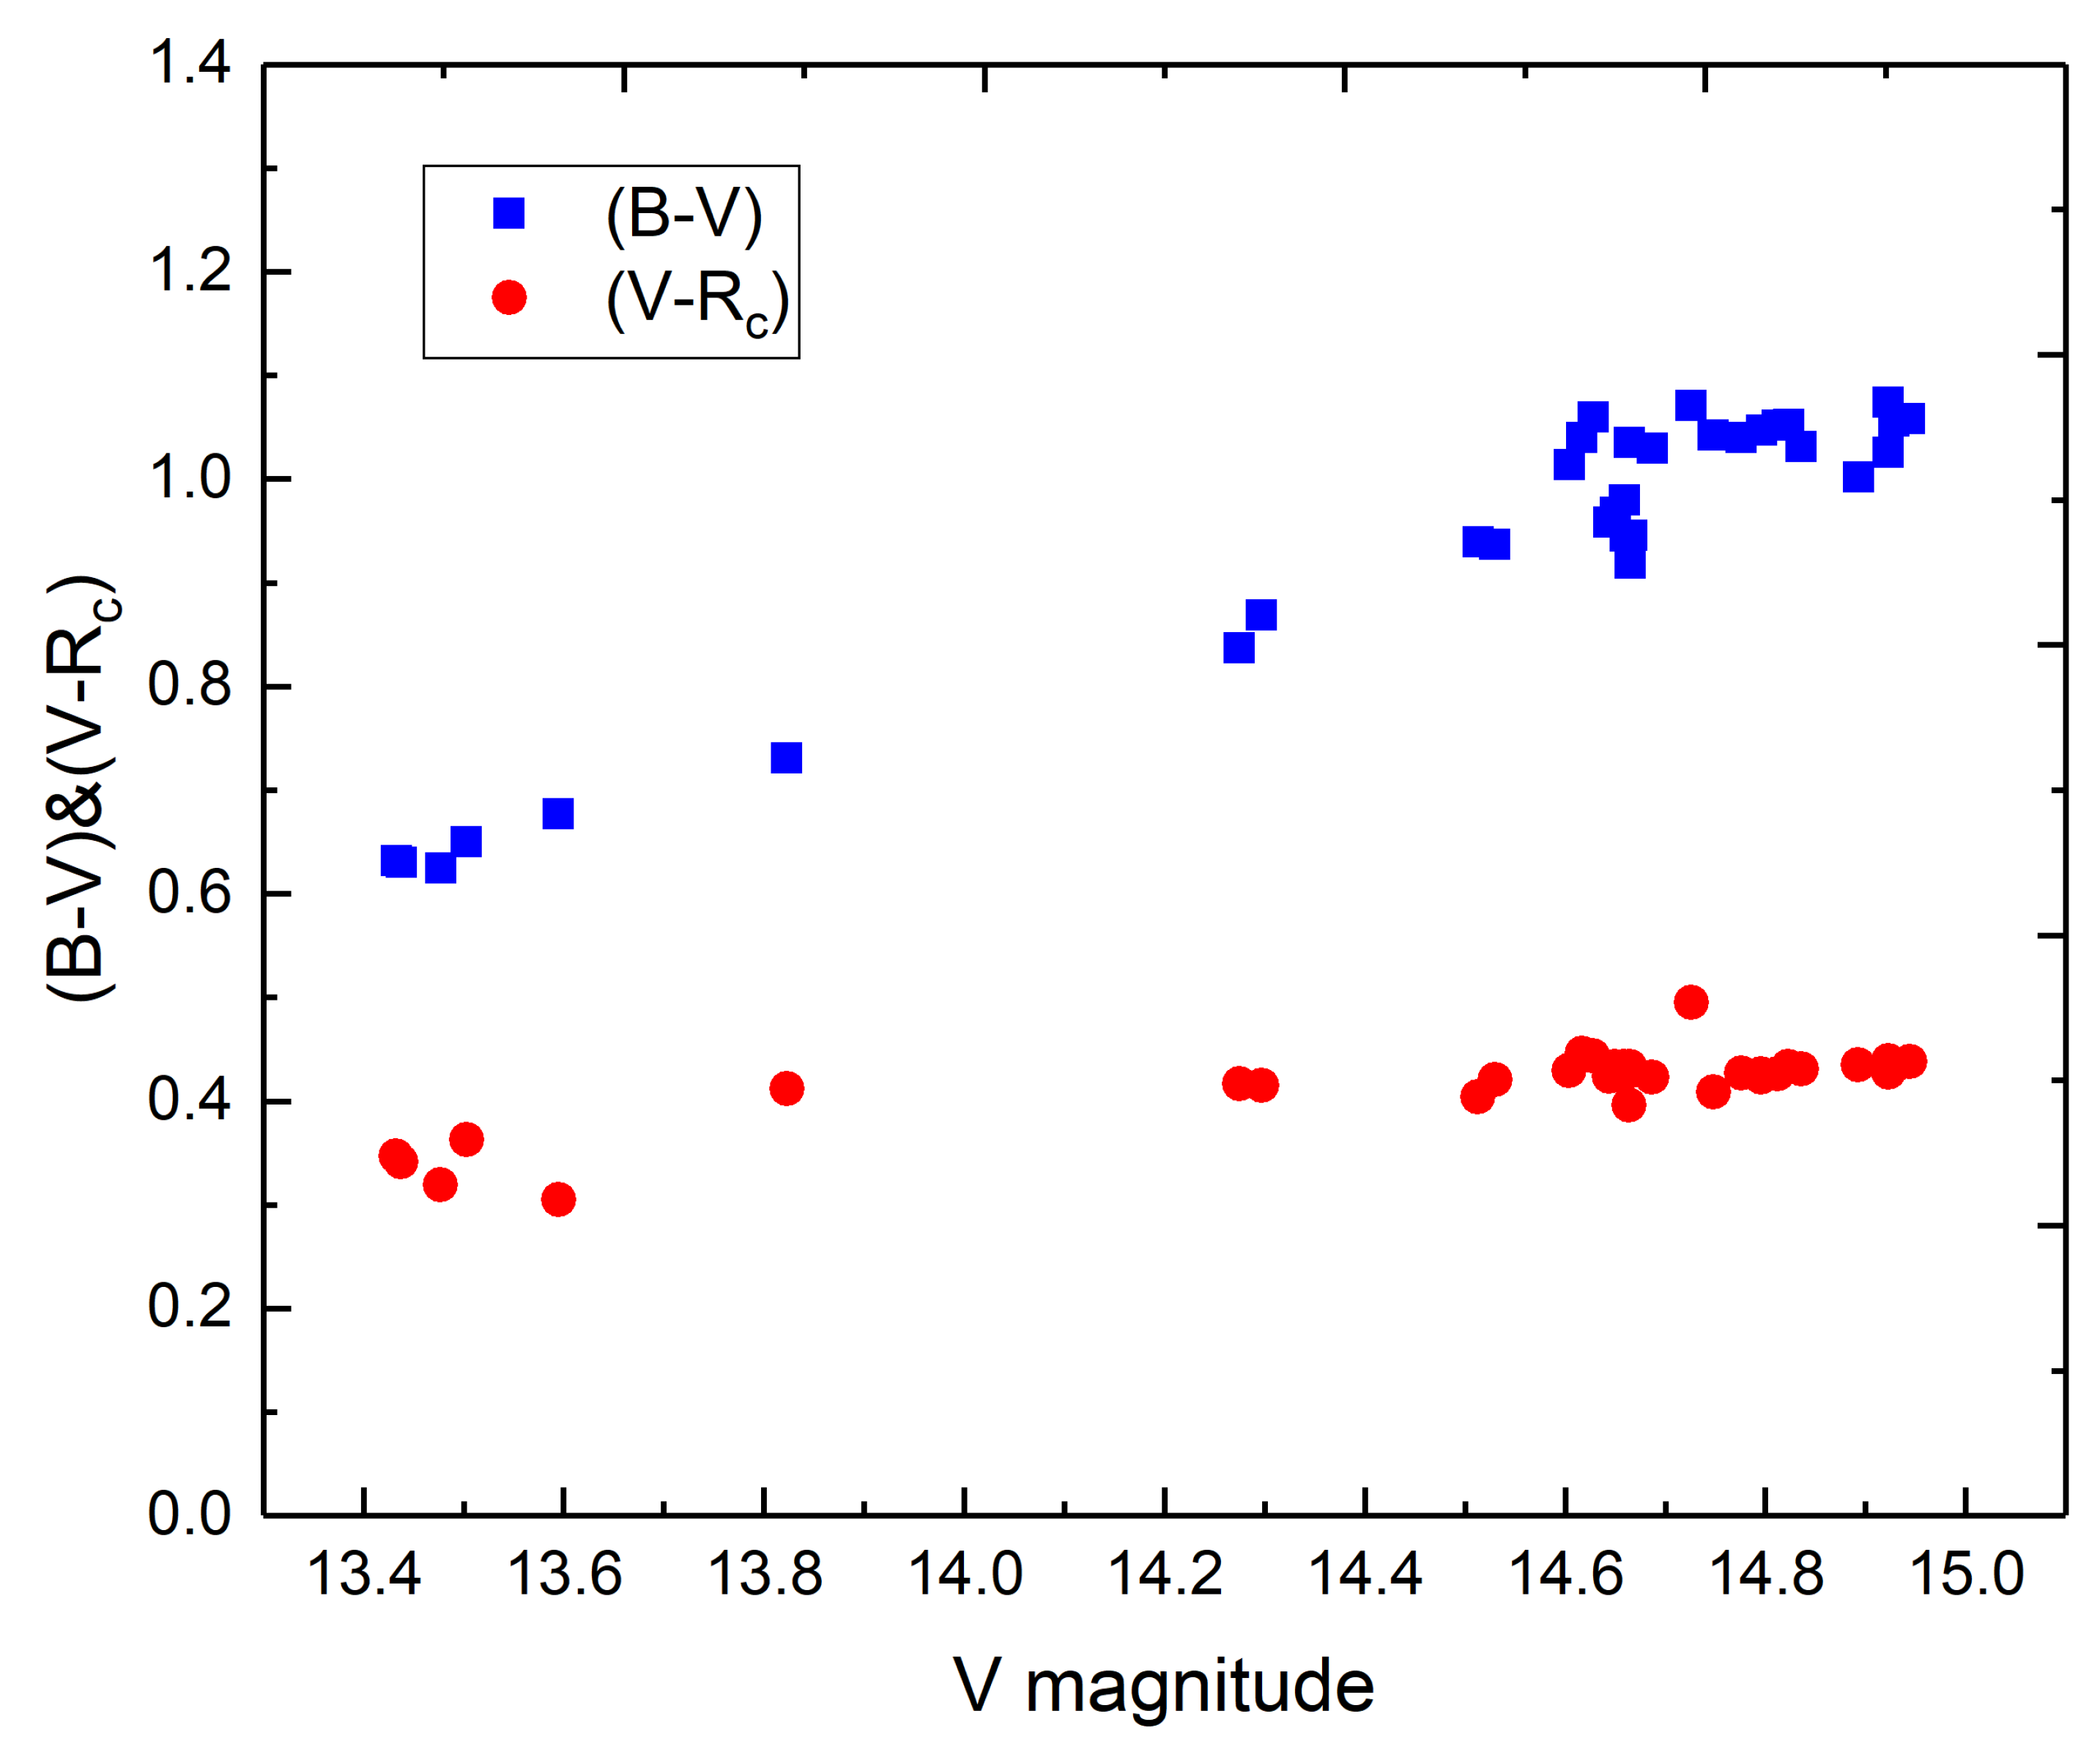
Figure 3 presents the color indices and . The mean color indices are and . All values are given without correction for interstellar reddening.
Figure 3.
Color–magnitude relation of Mrk 6 in and .
Results of Spectroscopic Observations
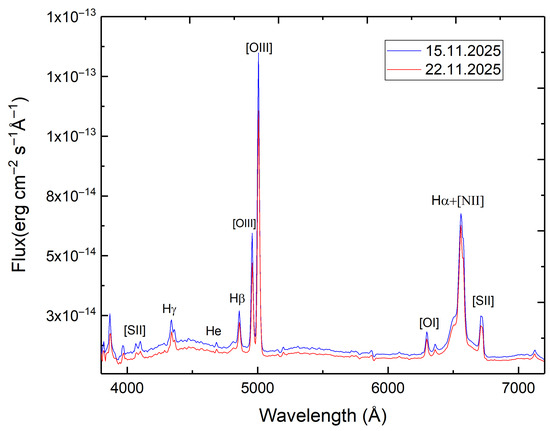
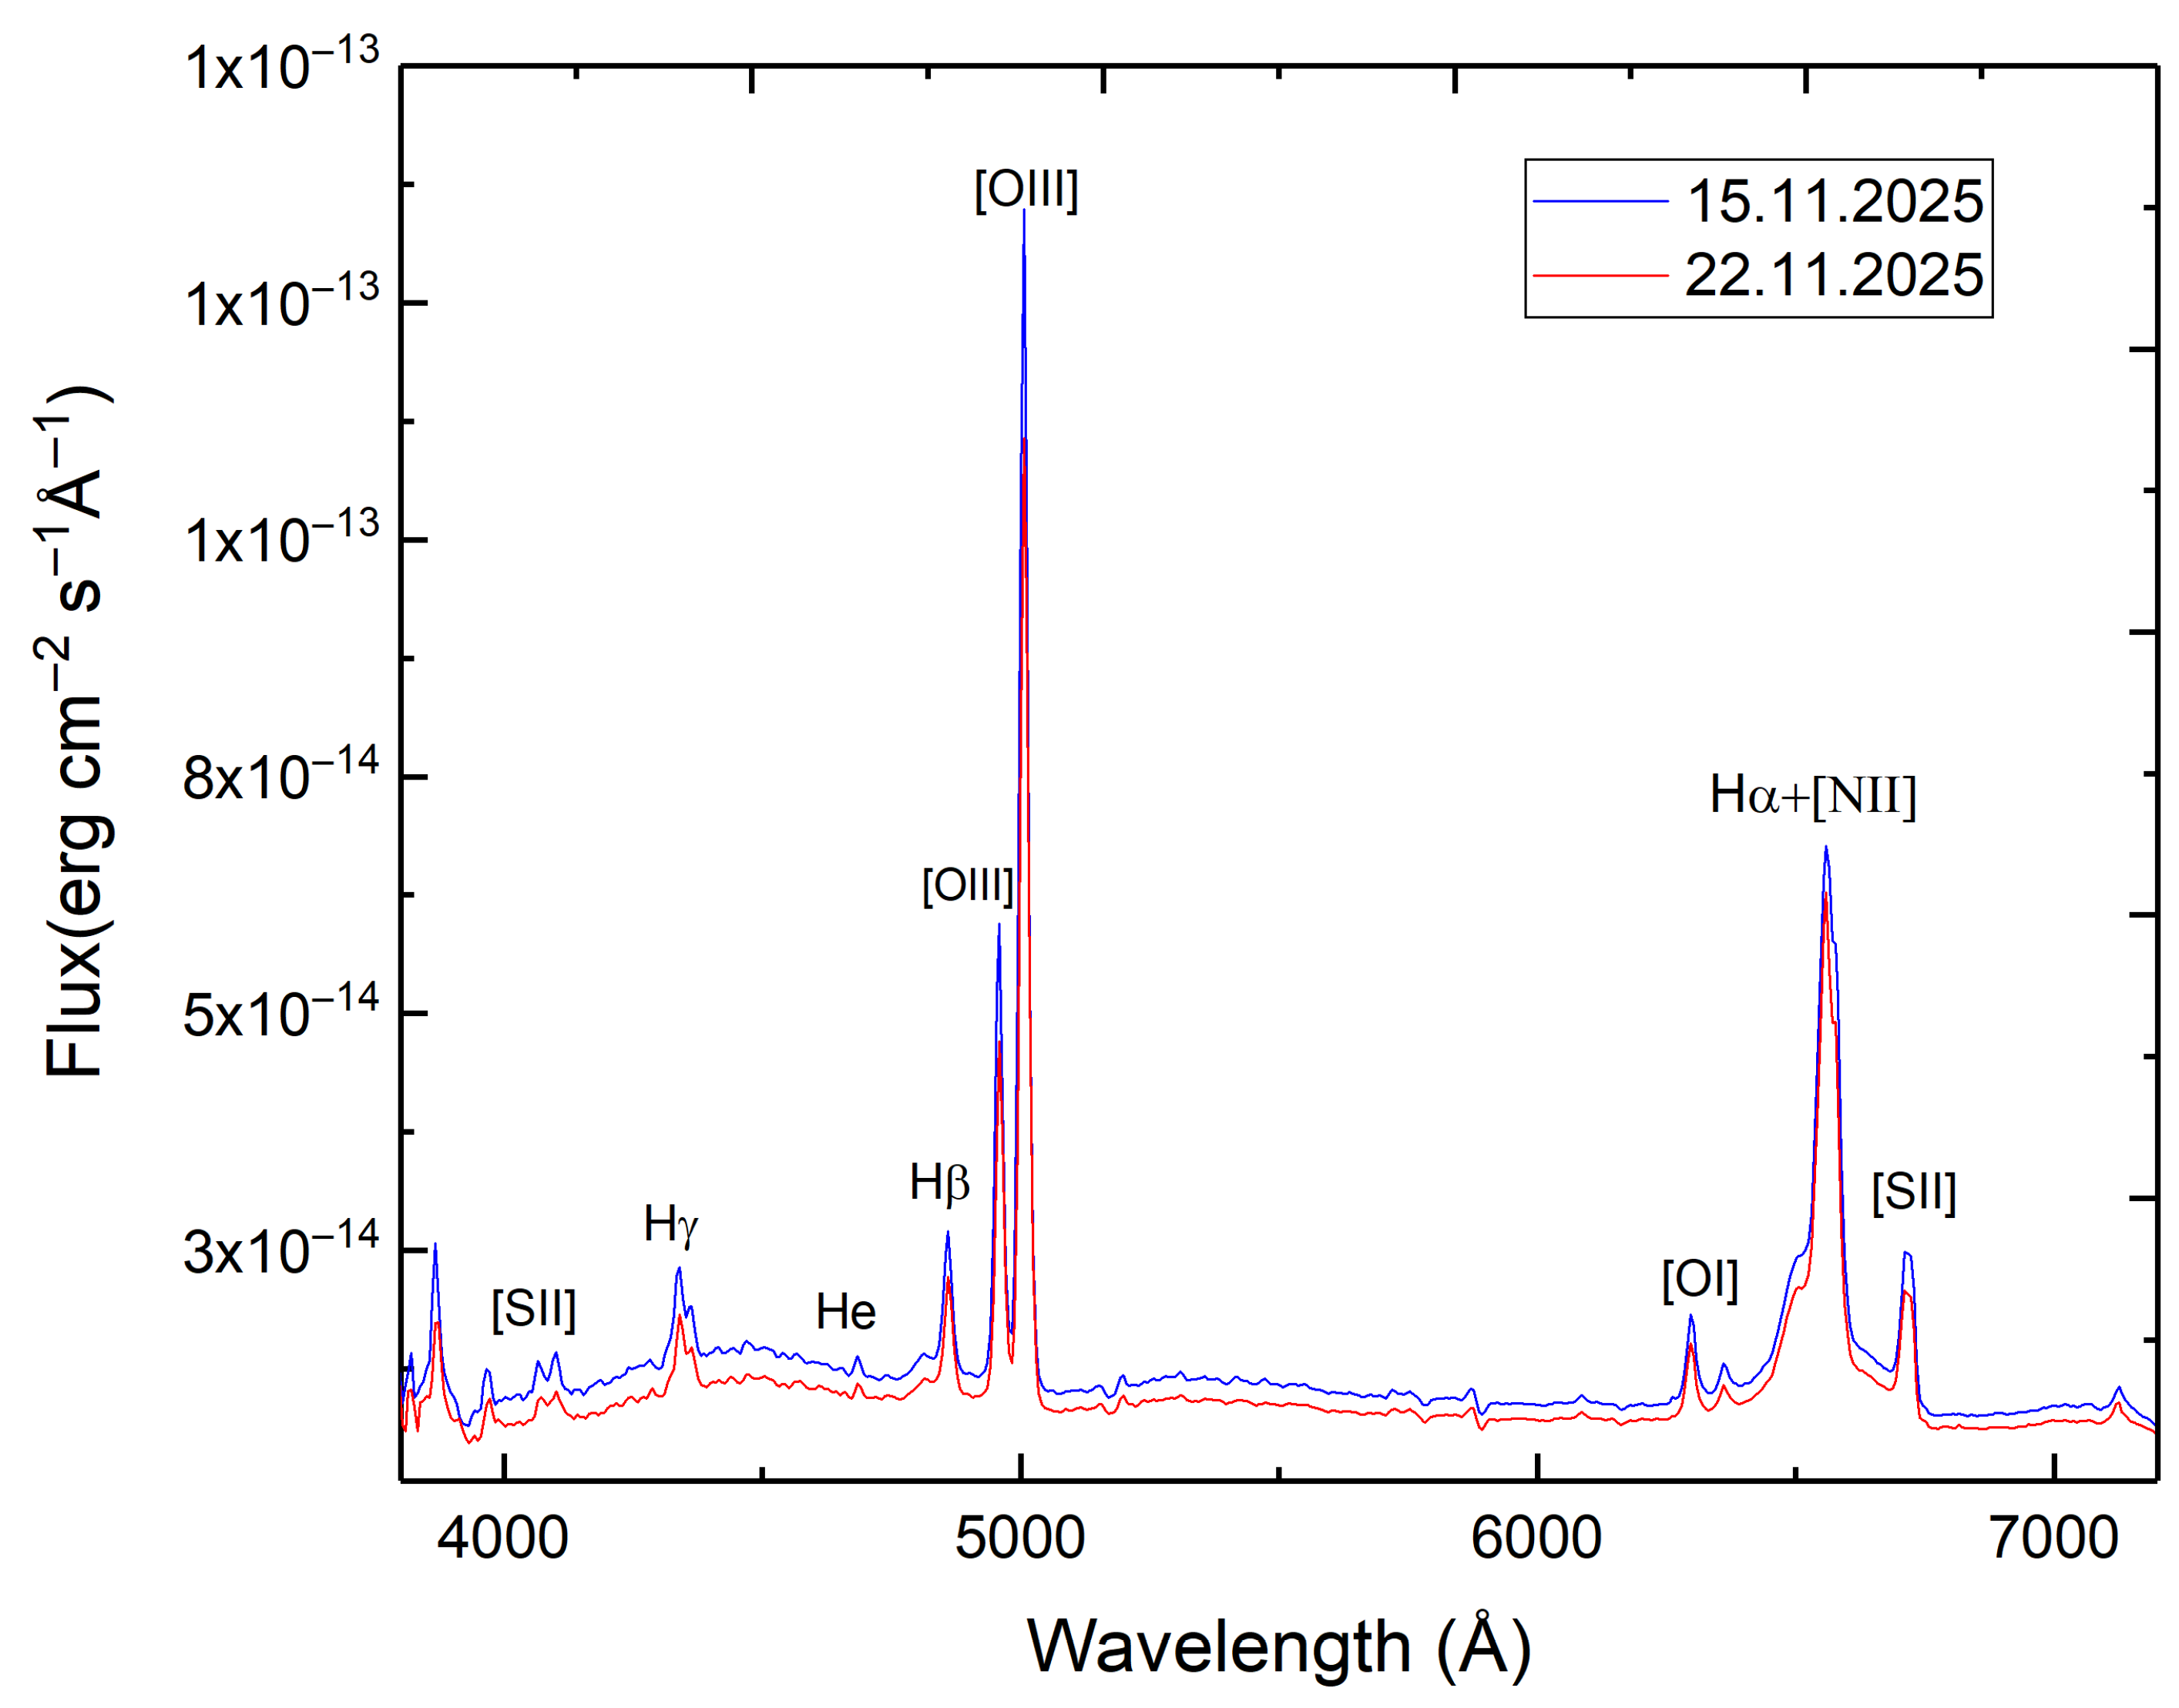
Spectroscopic observations were carried out at the Shamakhy Astrophysical Observatory (ShAO) on 15 November 2025 (exposure time 2400 s) and 22 November 2025 (exposure time 3600 s). The spectra were obtained in the wavelength range –7000 Å with a spectral resolution of . The dispersion was 5.6 Å mm−1 with binning. The spectrum of the Mrk6 is shown in Figure 4.
Figure 4.
Optical spectrum of Mrk 6 in the wavelength range 4000–7000 Å, obtained with the 2 m telescope at the Shamakhy Astrophysical Observatory (Azerbaijan).
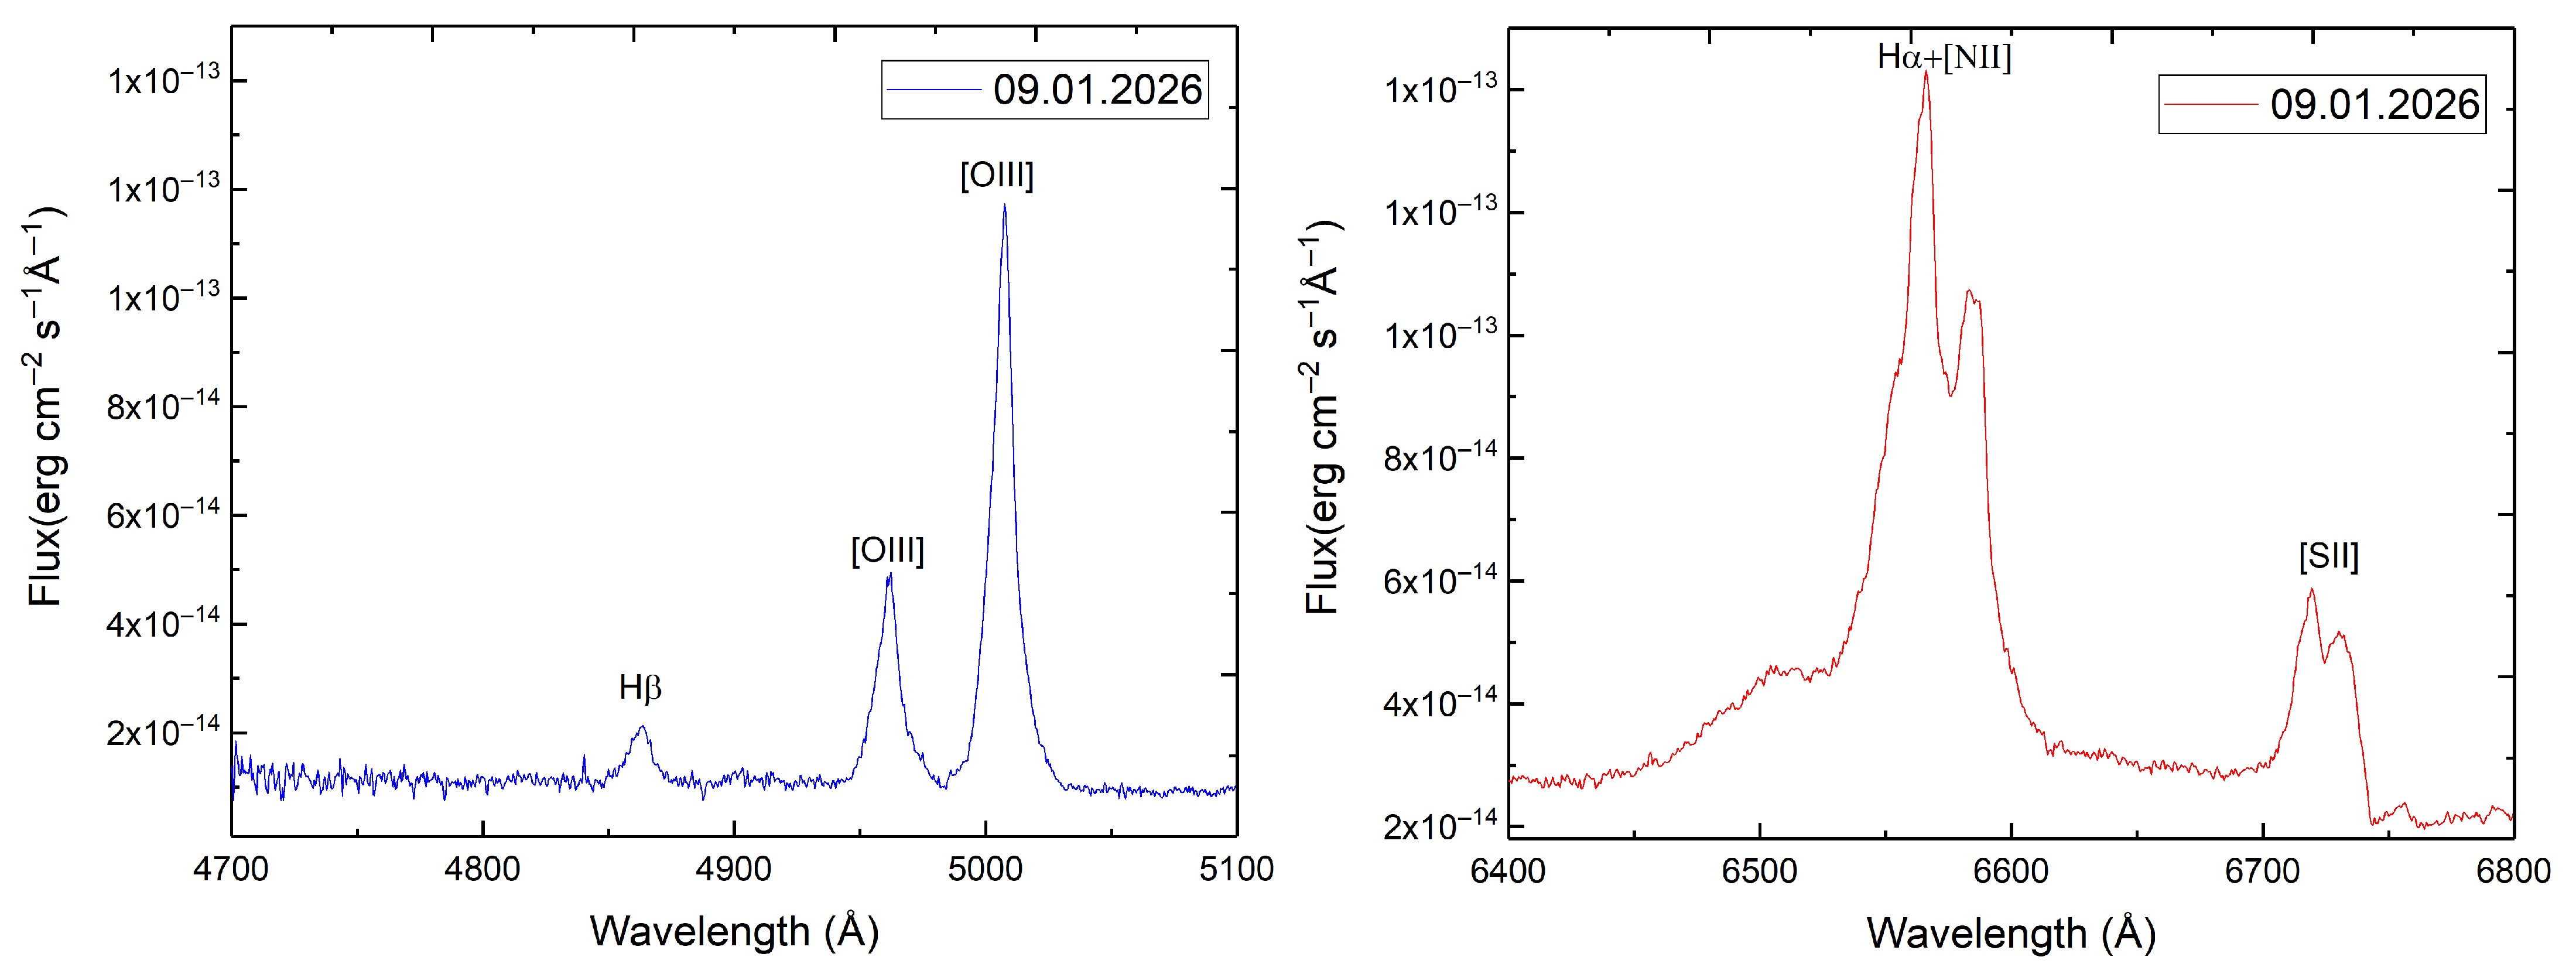
Additional spectroscopic observations were performed on 9 January 2026 at the Assy-Turgen Observatory. In the H region, a diffraction grating of 2400 lines mm−1 was used, providing a spectral resolution of with binning and an exposure time of 600 s. In the H region, a grating of 1800 lines mm−1 was used, yielding a spectral resolution of with an exposure time of 600 s. The spectral profiles are presented in Figure 5.
Figure 5.
Optical spectra of Mrk 6 obtained with the 1.5 m telescope of the Fesenkov Astrophysical Institute. The left panel shows the H spectral region covering the wavelength range –5100 Å, while the right panel presents the H region in the range –6800 Å.
For each observation, three spectra of the standard star were recorded with short exposures (4–10 s). The spectrophotometric standard HD 33541 was observed at approximately the same zenith distance as the target galaxy to minimize atmospheric extinction effects. The energy distribution of the standard star spectrum was taken from the Gaia DR3 catalog [18].
All spectra used to determine the fluxes in the broad emission lines were processed following standard reduction procedures, including correction for atmospheric absorption, Galactic interstellar extinction, redshift correction, and absolute flux calibration using spectrophotometric standards within the IRAF software package. The full width at half maximum (FWHM) of the emission lines was determined by Gaussian fitting using the splot task in IRAF. The results are presented in Table 2.
Table 2.
Measured parameters of emission lines in the spectrum of Mrk 6.
In Table 2, the flux in the [O III] line was used as an internal calibrator in the analysis of the H line variability, while in the red spectral region the fluxes in the [S II] lines were used to normalize the fluxes in the H+[N II] complex. We find that the total H flux decreases by a factor of ∼2–3 between November 2025 and January 2026 (see Table 3). The spectra show that the broad component of H becomes significantly weakened and nearly disappears in January 2026, while the narrow component and the [O III] lines remain relatively stable.
Table 3.
Fluxes in the H line and their normalization using the [O III] internal calibrator.
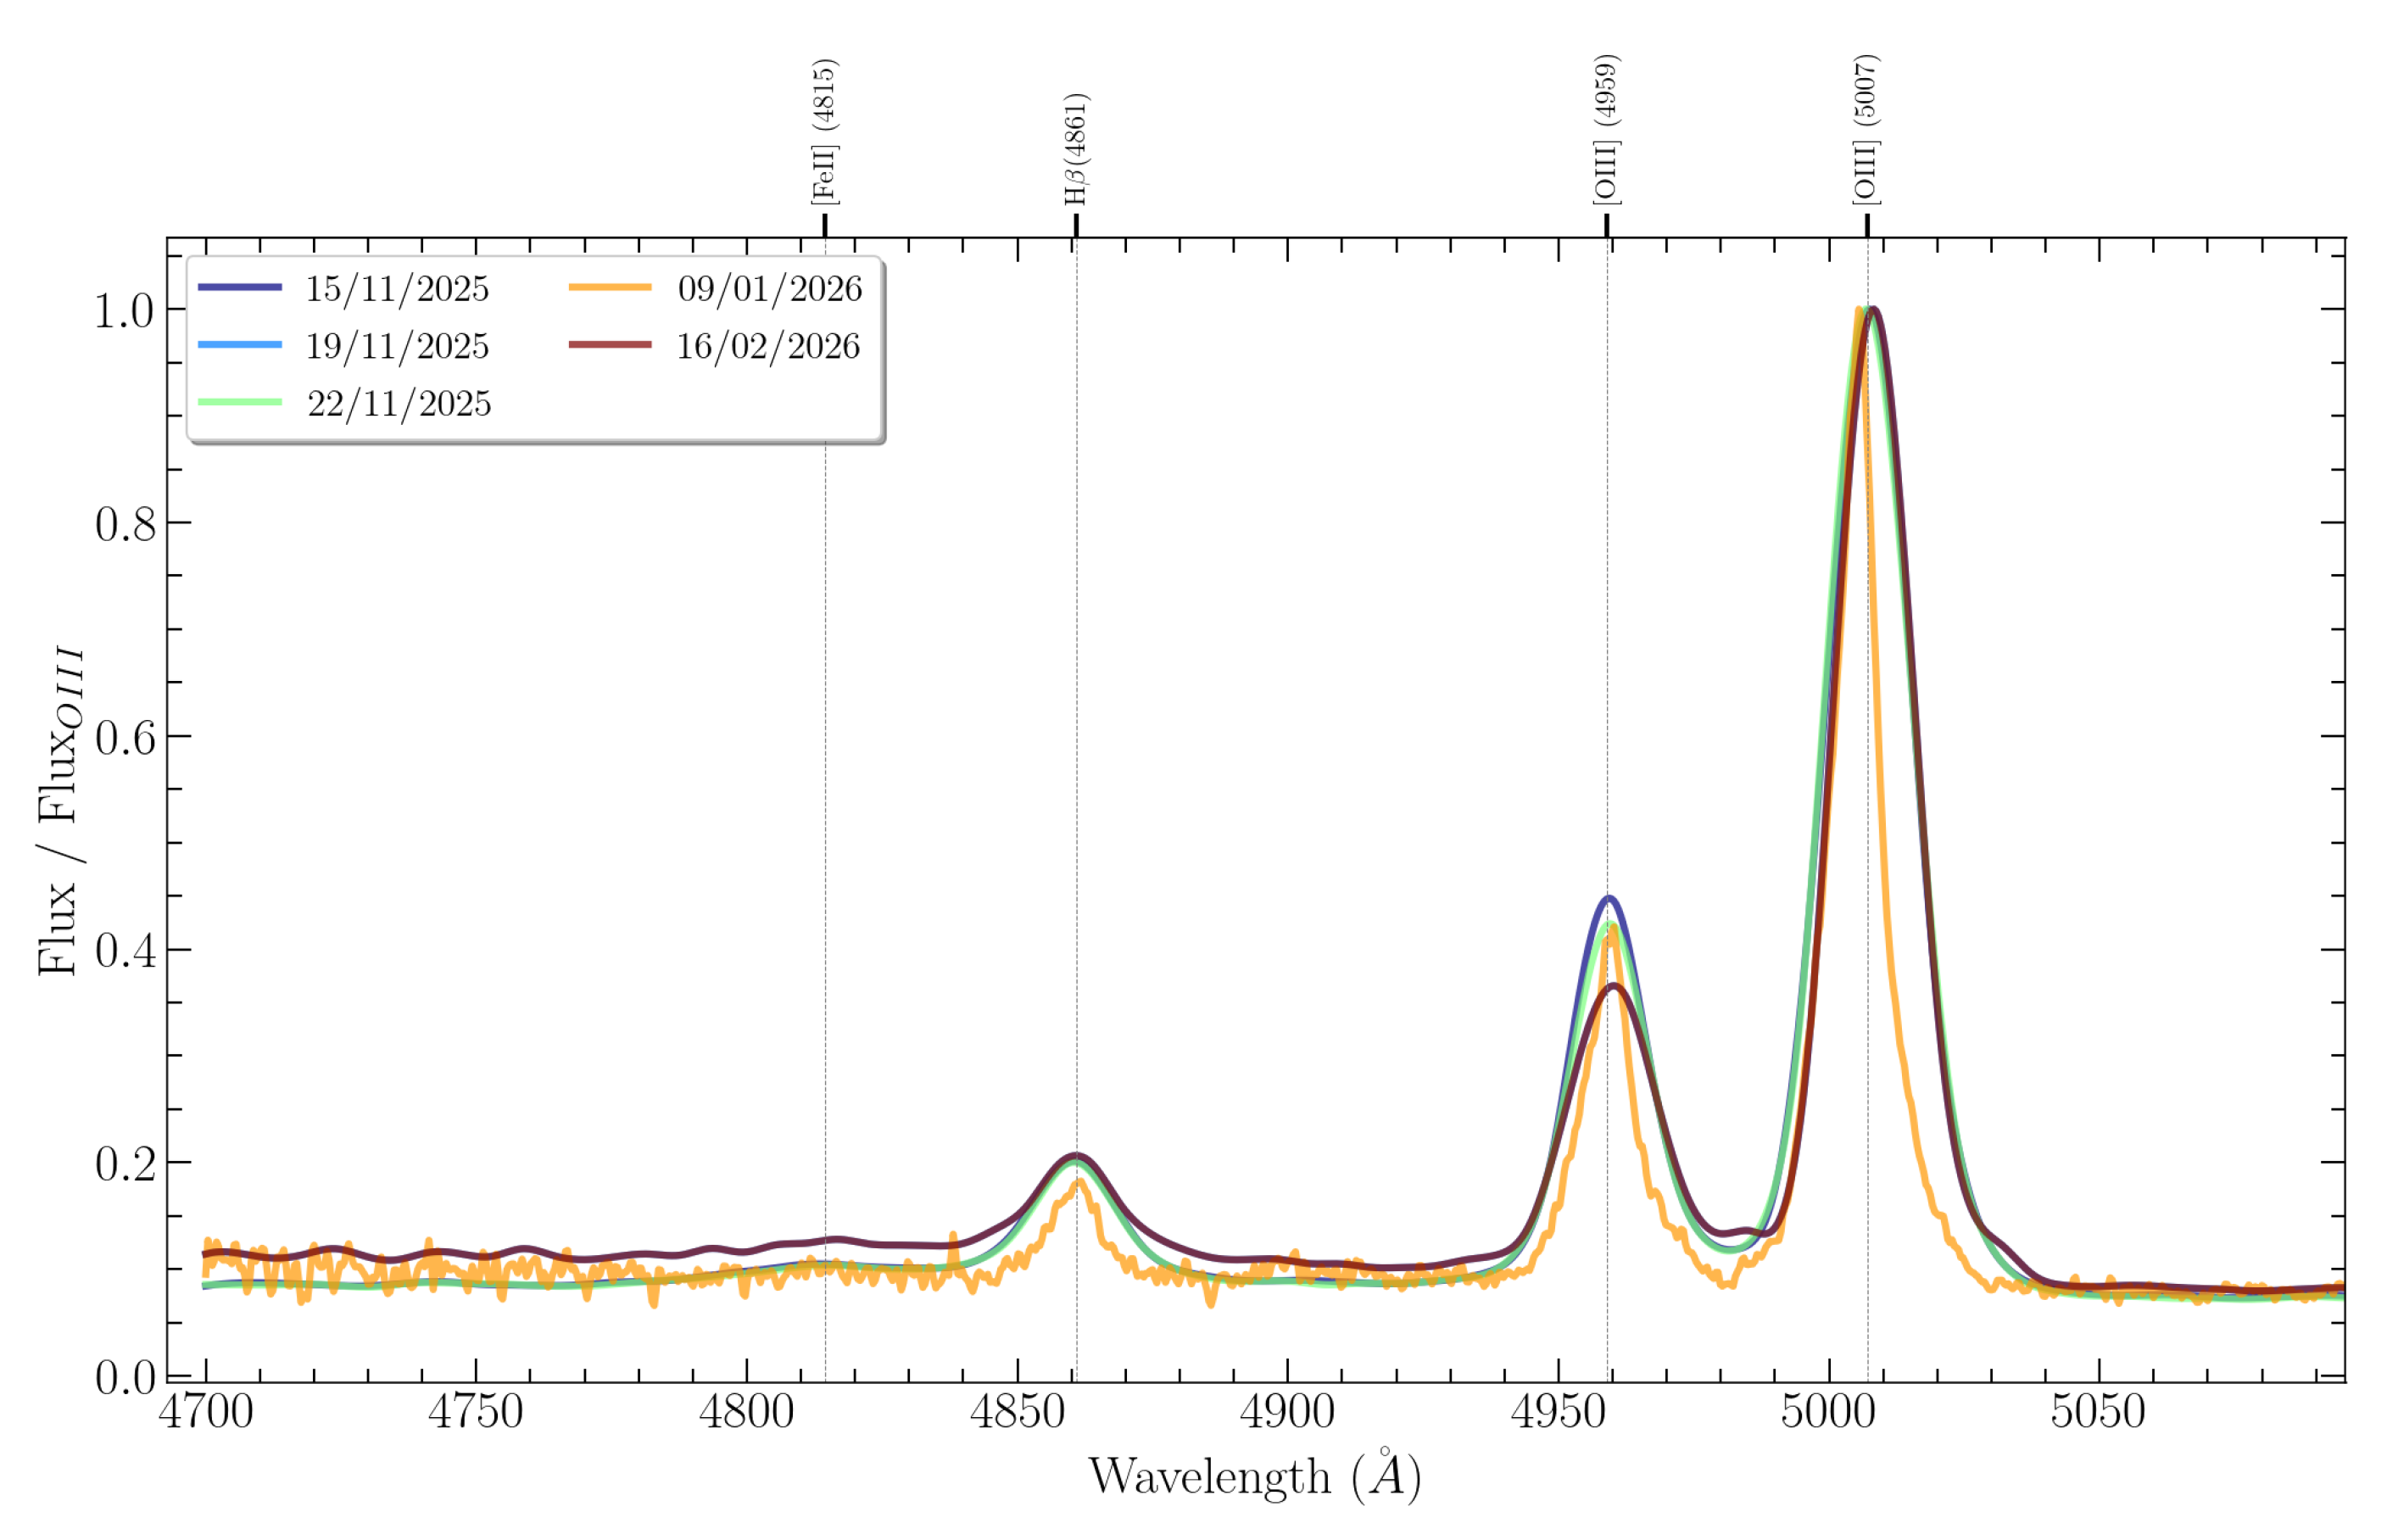
As shown in Figure 6, where the spectra are normalized to the [O III] flux, the broad H component reaches a minimum in January 2026 and then partially recovers by mid-February. Thus, the observed variability is non-monotonic and is primarily manifested as changes in the amplitude of the broad H component, without a significant change in the spectral type (the object remains close to type 1.5). This behavior may resemble that of changing-look AGN. However, the absence of a complete disappearance of the H line and the presence of a partial recovery suggest that this event is more appropriately described as CL-like variability rather than a classical changing-look transition. In terms of the classification by Komossa et al. (2026) [19], it is most consistent with category V (recurrent brightenings and dimmings on timescales from weeks to years), although the observed event occurs on a relatively short timescale. Similar episodes of the temporary weakening of broad emission lines have been reported in a number of objects [19,20,21,22,23,24].
Figure 6.
Optical spectra of Mrk 6 (4800–5100 Å) obtained at multiple epochs between November 2025 and February 2026. The H emission line exhibits notable profile variability, with the broad component significantly weakened in January 2026 and partially recovered by February 2026.
To quantitatively estimate the size of the broad-line region (BLR) at different epochs, we calculated the monochromatic continuum luminosity at Å () using the luminosity distance to Mrk 6 of Mpc and applied the empirical R–L relation from the referenced study. The results are summarized in Table 4. The characteristic BLR size varies approximately from 16 to 22 light days at different observing epochs.
Table 4.
Continuum flux at 5100 Å, monochromatic luminosity, and BLR size estimates for Mrk 6.
4. Discussion
The light curve of the galaxy Mrk 6 for the period 2016–2026 is presented and discussed. Based on Figure 1, an estimate of the host-galaxy contribution was performed. As an approximate estimate of the host contribution at the minimum activity state of the active galactic nucleus (AGN), the minimum brightness values in each filter on the light curves were adopted. The minimum brightness was observed on 17 January 2017, when the magnitudes were , , and .
The observed color indices in Figure 2 show that varies in the range of approximately 0.63–1.07, whereas the index remains significantly more stable and is concentrated around ∼0.43. This indicates that the variability is stronger in the blue part of the spectrum, while the red region varies more weakly.
To account for the host-galaxy contribution, its flux was estimated from the minimum brightness levels on the light curves in each filter, assuming minimal AGN activity at these epochs. The magnitudes were converted to fluxes using the standard zero-points of the Johnson–Cousins photometric system [25].
As a result, the following host-galaxy fluxes were obtained: , , Å−1.
In this study, we employed a Bayesian statistical approach for the approximation of observed spectra. Unlike the least squares method, this approach allows not only for finding the optimal parameters of emission lines but also for evaluating the adequacy of the spectral description model itself by calculating the ‘Bayesian evidence’. To identify the global maximum of the likelihood function and construct posterior parameter distributions, we utilized the Dynamic Nested Sampling method implemented in the Dynesty package [26]. Non-informative priors were defined over broad ranges of physically grounded values. Optimal parameter values were determined based on the median of the distribution (50th percentile), with uncertainties estimated at the 16th and 84th percentile levels. The total model spectrum included a power-law continuum and a set of emission lines from both the Narrow Line Region (NLR) and the Broad Line Region (BLR). The central wavelengths for the [NII], [SII], [OI], and [OIII] doublets, as well as the Balmer series lines and fixed doublet amplitude ratios, were set according to standard values. Seven model types (M0–M6) were tested, differing in their profiles and number of components: the NLR was modeled using Voigt (M0, M3), Gaussian (M1), or asymmetric Gaussian profiles with an error function (M2, M4, M5, M6). The BLR was represented by either three components (central, ‘blue’, and ‘red’) to account for complex BLR dynamics (M0, M1, M2), two components (M3, M4), or a single broad component (M5, M6). More details can be found in [27].
Spectral analysis indicates that the characteristic gas cloud velocities—estimated from the Full Width at Half Maximum (FWHM) of the Narrow Line Region (NLR) H and H emission lines—are approximately 1093 ± 40 km s−1. The mean FWHM values for the Broad Line Region (BLR) were determined to be 4630 ± 230 km s−1 for H and 4530 ± 12 km s−1 for H; these were adopted as proxies for the virial velocity of the BLR gas. Based on average time delays (lags) of ≈20 light days for H and ≈28 light days for H, we defined the BLR radius (). Adopting a redshift of z = 0.01904 and H0 = 70 km s−1 Mpc−1, the distance to Mrk 6 is estimated at D ≈ 81 Mpc. Applying a virial calibration factor of f ≈ 1.1 [28,29], the central supermassive black hole mass is calculated as 0.92 × 10⁸ (from H) and 1.24 × 10⁸ (from H). These results for time delays and velocity dispersions are in good agreement with previously reported values [3,30]. The value of and is approximately two times lower than that reported in [3].
5. Conclusions
New photometric observations obtained between 14 November 2024 and 28 January 2026 are presented, demonstrating the synchronous variability of the galaxy in the B, V, and filters, with an amplitude of about 0.3 mag in all bands. The galaxy light curve over an 11-year monitoring period was also analyzed. For an independent verification of the variability amplitude, data from the ASAS-SN and ZTF survey programs in the V filter were used.
The radius of the broad-line region was taken to be equal to the average time delays (lags), amounting to ≈20 light days for the H line and ≈28 light days for the H line. The obtained results are in good agreement with those reported by other authors.
Author Contributions
Conceptualization, methodology and visualization, S.S., A.S. and G.A.; formal analysis, A.S. and S.S.; validation, A.T., G.A. and S.S.; investigation, S.S., A.S. and D.N.; resources, I.R., N.H. and D.A.; data curation, G.A., S.S. and A.T.; writing—original draft preparation, review and editing, S.S., A.S. and D.N.; project administration and funding acquisition, S.S. All authors have read and agreed to the published version of the manuscript.
Funding
This work was carried out within the framework of Project No. BR31714731 “Fundamental Research in Observational and Theoretical Astrophysics”, funded by the Ministry of Science and Higher Education of the Republic of Kazakhstan.
Data Availability Statement
The original contributions presented in this study are included in the article. Further inquiries can be directed to the corresponding author.
Acknowledgments
The authors would like to express their sincere gratitude to the reviewers for their valuable comments and suggestions, which have significantly improved the quality of this manuscript.
Conflicts of Interest
The authors declare no conflicts of interest.
References
- Sergeev, S.G.; Doroshenko, V.T. Spectral activities of the Seyfert galaxy Mkn 6 in 1970–1990. ASP Conf. Ser. 2003, 290, 553–556. [Google Scholar]
- Doroshenko, V.T.; Sergeev, S.G. Spectral activity of the Seyfert galaxy Markarian 6 in 1970–1991. Astron. Astrophys. 2003, 405, 909–915. [Google Scholar] [CrossRef] [Scilit]
- Doroshenko, V.T.; Sergeev, S.G.; Klimanov, S.A.; Pronik, V.I.; Efimov, Y.S. Broad-line region kinematics and black hole mass in Markarian 6. Mon. Not. R. Astron. Soc. 2012, 426, 416–426. [Google Scholar] [CrossRef] [Scilit]
- Immler, S.; Brandt, W.N.; Vignali, C.; Bauer, F.E.; Crenshaw, D.M.; Feldmeier, J.J.; Kraemer, S.B. Probing the complex and variable X-ray absorption of Markarian 6 with XMM-Newton. Bull. Am. Astron. Soc. 2003, 35, 636. [Google Scholar]
- Schurch, N.J.; Griffiths, R.E.; Warwick, R.S. The messy environment of Mrk 6. Mon. Not. R. Astron. Soc. 2006, 371, 211–220. [Google Scholar] [CrossRef] [Scilit]
- Kayanoki, T.; Mao, J.; Fukazawa, Y. Ionized X-ray winds in the radio galaxy Mrk 6. Mon. Not. R. Astron. Soc. 2024, 528, 4504–4512. Available online: https://ui.adsabs.harvard.edu/abs/2024MNRAS.528.4504K (accessed on 1 March 2024).
- Layek, N.; Nandi, P.; Naik, S.; Kumari, N.; Jana, A.; Chhotaray, B. Long-term X-ray temporal and spectral study of a Seyfert galaxy Mrk 6. Mon. Not. R. Astron. Soc. 2024, 528, 5269–5285. Available online: https://ui.adsabs.harvard.edu/abs/2024MNRAS.528.5269L (accessed on 1 March 2024).
- Afanasiev, V.L.; Popović, L.Č; Shapovalova, A.I.; Borisov, N.V.; Ilić, D. Variability in spectropolarimetric properties of Sy 1.5 galaxy Mrk 6. Mon. Not. R. Astron. Soc. 2014, 440, 519–529. [Google Scholar] [CrossRef] [Scilit]
- Kharb, P.; O’Dea, C.P.; Baum, S.A.; Hardcastle, M.J.; Dicken, D.; Croston, J.H.; Mingo, B.; Noel-Storr, J. VLBA observations of Mrk 6: Probing the jet–lobe connection. arXiv 2014, arXiv:1402.7174. [Google Scholar] [CrossRef] [Scilit]
- Smirnova, A.A.; Moiseev, A.V.; Dodonov, S.N. A close look at the well-known Seyfert galaxy: Extended emission filaments in Mrk 6. Mon. Not. R. Astron. Soc. 2018, 481, 4542–4547. [Google Scholar] [CrossRef] [Scilit]
- Asatrian, N.S. Hour-timescale profile variations in the broad Balmer lines of the Seyfert galaxy Markarian 6. IAU Symp. 2014, 304, 407–408. [Google Scholar] [CrossRef] [Scilit]
- Asatrian, N.S. Simultaneous hour-timescale variations in the profiles of the broad Balmer lines of the Seyfert galaxy Markarian 6. In Proceedings of the Armenian-Iranian Astronomical Workshop (AIAW), Byurakan, Armenia, 13–16 October 2015; pp. 218–222. [Google Scholar]
- Shomshekova, S.; Denissyuk, E.; Valiullin, R.; Kusakin, A.; Reva, I.; Omarov, C. Photometric research of Seyfert galaxies MRK 766, MRK 6, MRK 1040, MRK 1513. News Natl. Acad. Sci. Repub. Kazakhstan Phys.-Math. Ser. 2019, 3, 64–70. [Google Scholar] [CrossRef] [Scilit]
- Shomshekova, S.A.; Denissyuk, E.K.; Kondratyeva, L.N.; Serebryanskiy, A.V.; Aimanova, G.K.; Aktay, L. Spectral and photometric studies of MRK 6 and MRK 1040 in the optical range. Eurasian Phys. Tech. J. 2025, 22, 115–126. [Google Scholar] [CrossRef] [Scilit]
- Fitzpatrick, M.; Placco, V.; Bolton, A.; Merino, B.; Ridgway, S.; Stanghellini, L. Modernizing IRAF to Support Gemini Data Reduction. arXiv 2024, arXiv:2401.01982. [Google Scholar] [CrossRef] [Scilit]
- Diffraction Limited. MaxIm DL Astronomical Imaging Software, version 7; Diffraction Limited: Ottawa, ON, Canada. Available online: https://diffractionlimited.com/product/maxim-dl/ (accessed on 1 March 2024).
- Shomshekova, S.A.; Reva, I.V. Standardization of the photometric system of the 1-meter telescope on TSHAO. News Natl. Acad. Sci. Repub. Kazakhstan Phys.-Math. Ser. 2017, 4, 155–161. [Google Scholar]
- Vallenari, A.; Brown, A.G.A.; Prusti, T.; de Bruijne, J.H.J.; Arenou, F.; Babusiaux, C.; Biermann, M.; Creevey, O.L.; Ducourant, C.; Evans, D.W.; et al. Gaia Data Release 3: Summary of the content and survey properties. Astron. Astrophys. 2023, 674, A1. [Google Scholar] [CrossRef] [Scilit]
- Komossa, S.; Grupe, D.; Marziani, P.; Popović, L.C.; Marčeta-Mandić, S.; Bon, E.; Ilić, D.; Kovačević, A.; Kraus, A.; Haiman, Z. The extremes of AGN variability: Outbursts, deep fades, changing looks, exceptional spectral states, and semi-periodicities. Adv. Space Res. 2026, 77, 4041–4058. [Google Scholar] [CrossRef] [Scilit]
- MacLeod, C.L.; Green, P.J.; Anderson, S.F.; Bruce, A.; Eracleous, M.; Graham, M.; Homan, D.; Lawrence, A.; LeBleu, A.; Ross, N.P.; et al. Changing-look quasar candidates: First results from follow-up spectroscopy of highly optically variable quasars. Astrophys. J. 2019, 874, 8. [Google Scholar] [CrossRef] [Scilit]
- Oknyansky, V.L.; Winkler, H.; Tsygankov, S.S.; Lipunov, V.M.; Gorbovskoy, E.S.; van Wyk, F.; Buckley, D.A.H.; Tyurina, N.V. Changing-look active galactic nuclei: Optical and infrared variability. Mon. Not. R. Astron. Soc. 2019, 483, 558–568. [Google Scholar] [CrossRef] [Scilit]
- Sniegowska, M.; Czerny, B.; Bon, E.; Bon, N. Possible mechanism for multiple changing-look phenomena in active galactic nuclei. Astron. Astrophys. 2020, 641, A167. [Google Scholar] [CrossRef] [Scilit]
- Wang, J.-M.; Bon, E. Changing-look active galactic nuclei: Close binaries of supermassive black holes in action. Astron. Astrophys. 2020, 643, L9. [Google Scholar] [CrossRef] [Scilit]
- Popović, L.C.; Ilić, D.; Burenkov, A.; Alvarez, V.M.P.; Marčeta-Mandić, S.; Kovačević-Dojčinović, J.; Shablovinskaya, E.; Kovačević, A.B.; Marziani, P.; Chavushyan, V.; et al. Long-term optical spectral monitoring of a changing-look active galactic nucleus NGC 3516 II. Broad-line profile variability. Astron. Astrophys. 2023, 675, A178. [Google Scholar] [CrossRef] [Scilit]
- Bessell, M.S.; Castelli, F.; Plez, B. Model atmospheres broad-band colors, bolometric corrections and temperature calibrations for O–M stars. Astron. Astrophys. 1998, 333, 231–250. [Google Scholar]
- Speagle, J.S. DYNESTY: A dynamic nested sampling package for estimating Bayesian posteriors and evidence. Mon. Not. R. Astron. Soc. 2020, 493, 3132–3158. [Google Scholar] [CrossRef] [Scilit]
- Shomshekova, S.; Serebryanskiy, A.; Kondratyeva, L.; Huseynov, N.; Rahimli, S.; Kim, V.; Aktay, L.; Aimuratov, Y. Spectral and Photometric Studies of NGC 3516 in the Optical Range. Galaxies 2025, 13, 60. [Google Scholar] [CrossRef] [Scilit]
- Onken, C.A.; Ferrarese, L.; Merritt, D.; Peterson, B.M.; Pogge, R.W.; Vestergaard, M.; Wandel, A. Supermassive black holes in active galactic nuclei. II. Calibration of the black hole mass–velocity dispersion relationship for reverberation-mapped AGNs. Astrophys. J. 2004, 615, 645–651. [Google Scholar] [CrossRef] [Scilit]
- Shen, Y. The mass of quasars. Bull. Astron. Soc. India 2013, 41, 61–115. [Google Scholar]
- Grier, C.J.; Peterson, B.M.; Pogge, R.W.; Denney, K.D.; Bentz, M.C.; Martini, P.; Sergeev, S.G.; Kaspi, S.; Minezaki, T.; Zu, Y.; et al. Reverberation mapping results for five Seyfert 1 galaxies. Astrophys. J. 2012, 755, 60. [Google Scholar] [CrossRef] [Scilit]

Disclaimer/Publisher’s Note: The statements, opinions and data contained in all publications are solely those of the individual author(s) and contributor(s) and not of MDPI and/or the editor(s). MDPI and/or the editor(s) disclaim responsibility for any injury to people or property resulting from any ideas, methods, instructions or products referred to in the content. |
© 2026 by the authors. Licensee MDPI, Basel, Switzerland. This article is an open access article distributed under the terms and conditions of the Creative Commons Attribution (CC BY) license.