Article

Harmonizing Sunspot Datasets Consistency: Focusing on SOHO/MDI and SDO/HMI Data

by
Barbara Góra-Gálik
1,
Emese Forgács-Dajka
1,2,* and
Istvan Ballai
3
1
Department of Astronomy, Institute of Physics and Astronomy, ELTE Eötvös Loránd University, Pázmány Péter sétány 1/A, H-1117 Budapest, Hungary
2
HUN-REN-SZTE Stellar Astrophysics Research Group, Szegedi út, Kt. 766, H-6500 Baja, Hungary
3
Plasma Dynamics Group, School of Mathematical and Physical Sciences, The University of Sheffield, Hicks Building, Hounsfield Road, Sheffield S3 7RH, UK
*
Author to whom correspondence should be addressed.
Universe 2025, 11(6), 176; https://doi.org/10.3390/universe11060176
Submission received: 24 April 2025 / Revised: 21 May 2025 / Accepted: 28 May 2025 / Published: 31 May 2025
(This article belongs to the Special Issue Solar and Stellar Activity: Exploring the Cosmic Nexus)

Abstract

To ensure the long-term consistency of sunspot group data, it is essential to harmonize measurements from SOHO/MDI and SDO/HMI, two major solar observatories with overlapping coverage. In our analysis, we use two complementary sets of data: SOHO/MDI–Debrecen Sunspot Data (SDD) and SDO/HMI–Debrecen Sunspot Data (HMIDD). Our objective is to identify systematic differences between their recorded parameters and to assess whether their data can be combined into a coherent time series. While the overlap between the datasets spans only about one year, this period allows for a direct statistical comparison without the need for additional image processing. Though the two instruments do not measure identical area values, our results reveal a strong linear relationship between them, which is in line with earlier studies. On the other hand, a systematic discrepancy in their magnetic field strength measurements was observed. Contrary to previous findings, SDO/HMI magnetic field values tend to be higher than those from SOHO/MDI. These differences may arise from the use of different calibration procedures and measurement techniques, or from the physical characteristics of the sunspot groups themselves. These results highlight the challenges involved in unifying data from multiple solar instruments that have been captured over extended time periods. While broad consistencies are observable, the differences between sunspot groups and measurement parameters demonstrate the importance of using careful, instrument-aware calibration approaches when combining such datasets.

1. Introduction

Comprehensive, long-term records of sunspot activity spanning centuries are essential for advancing our understanding of solar dynamics, enhancing space weather forecasting, and evaluating the Sun’s influence on Earth. Due to historical reasons, these records originate from multiple measurement techniques, each with distinct resolutions and sensitivities, with careful cross-calibration necessary to construct homogeneous datasets suitable for long-term analyses.
Systematic telescopic solar observations began in 1610, leading to Schwabe’s discovery of the 11-year solar cycle in 1844 and Hale’s identification of sunspot magnetic fields in 1908 [1,2]. Continuous magnetic polarity drawings generated since 1917 at the Mount Wilson Observatory and the ongoing relative sunspot number series from the Sunspot Index and Long-term Solar Observations (SILSO) database have further enriched this dataset [3,4]. However, instrumental differences—ranging from hand-drawn sketches to modern space-borne imagers—introduce inhomogeneities that must be corrected (e.g., the 2015 sunspot number revision) [5].
Sunspots arise when buoyant magnetic flux tubes rise through the convection zone and fragment near the photosphere, forming spot groups whose number, location, area, and magnetic properties reflect underlying dynamo processes [6,7]. To trace their spatial and magnetic evolution accurately, we must integrate data from high-resolution instruments like SDO/HMI with earlier records such as SOHO/MDI and findings from ground-based telescopes. Sunspots and pores are also locations of intense wave and flow dynamics, see, e.g., [8,9].
Recent cross-calibration efforts have led to important conversion relationships and methodological improvements. Győri (2012) [10] analyzed 2200 nearly simultaneous full-disk solar images and derived linear regression formulae to align MDI and HMI measurements of sunspot and facular areas, accounting for a systematic 0 . 22 northward-pointing offset and resolution-induced discrepancies. Their study found that SDO/HMI data detect significantly more umbra, penumbra, and pores than SOHO/MDI, primarily due to their higher spatial resolution. This difference leads to systematic variations in measured areas: while individual umbra appear larger in HMI data, the total areas of sunspots (i.e., umbra plus penumbra) tend to be larger in MDI data. This discrepancy stems from MDI’s lower resolution, which causes adjacent sunspots to blend together, artificially increasing measurements of their total area. In general, HMI recorded smaller areas than MDI for all features except for the total umbral area, where HMI’s measurements as slightly larger. Moreover, the residuals of the transformed MDI umbral areas fluctuate randomly around zero, with their amplitude decreasing as the true area increases [10].
Liu et al. (2012) [11] demonstrated that calibrated MDI magnetograms measure line-of-sight magnetic signals as being approximately 1.40 times stronger than those measured by HMI, with HMI providing more accurate values due to its superior noise characteristics and the absence of significant p-mode leakage. Suleymanova (2024) [12] established transition coefficients of 1.46 for regions near the central meridian and 1.29 for other longitudes between MDI and HMI magnetic fluxes, while also benchmarking ground-based BST-2 measurements against HMI data.
In addition to comparing disk images, a number of studies have also examined synoptic maps. For instance, Riley et al. (2014) [13] compared synoptic maps from seven solar observatories, including SOHO/MDI and SDO/HMI, and derived several conversion factors to obtain the best approximation of the general photospheric magnetic field. While synoptic maps are useful, they do not allow for the detailed tracking of the temporal evolution of active regions (ARs). Nonetheless, these investigations underscore the importance of homogeneous and well-calibrated datasets. More recently, Luo et al. (2023) [14] calibrated and analyzed the magnetic power spectra of SOHO/MDI and SDO/HMI synoptic maps using spherical harmonic decomposition. Their analysis identified the supergranular scale used and led to valuable insights for future studies on the solar cycle dependence of magnetic power spectra.
Other research efforts by Wang et al. (2023) and Wang et al. (2024) [15,16] aimed to construct a live, homogeneous AR database from SOHO/MDI and SDO/HMI synoptic magnetograms. Their work highlighted the need for consistent long-term datasets to gain deeper insights into solar activity, study cycle-phase dependencies, and improve solar activity forecasting. In their first study, the authors presented a method for automated AR detection and the calibration of MDI and HMI synoptic magnetograms and identified a calibration factor of 1.36 (with MDI producing higher flux values), which is consistent with the earlier results found by Liu et al. (2012) [11]. In their second paper, the authors refined their database further by including dipole field parameters and removing repeated ARs, which are known to skew polar field reconstructions. To estimate the long-term impact of individual ARs on the polar field, they calculated the so-called final dipole field ( D f ) for each region and included this in their published database. This parameter quantifies the dipole contribution of an active region after surface flux transport has occurred. The theoretical basis of D f originates from earlier works (e.g., Cameron et al., 2013 [17], Petrovay et al., 2020 [18]), which emphasize that the redistribution of magnetic flux—through processes such as supergranular diffusion and meridional flow—can significantly alter an AR’s initial dipole moment. Active regions emerging near the solar equator, especially those violating Hale’s or Joy’s law, can, therefore, have a disproportionate influence on the polar field. These exceptional regions are referred to as rogue active regions. The concept was further elaborated by Nagy et al. (2017) [19], who showed that some rogue ARs may even suppress the solar dynamo, potentially triggering grand minima. The D f parameter thus serves as a useful tool for identifying and studying anomalous regions.
These findings underscore the necessity of careful calibration and a thorough understanding of instrument-specific characteristics when combining SOHO/MDI and SDO/HMI datasets. Our overarching goal is to build a consistent, long-term database that enables detailed investigations into the spatial and magnetic evolution of sunspot groups. By resolving discrepancies in measured areas, magnetic field strengths, and polarity classifications, we aim to provide a reliable basis for distinguishing between positive and negative sunspot polarities across solar cycles. Constructing extended, homogeneous data series will not only allow us to track the development of individual sunspot groups, but also to explore how their evolution varies throughout different phases of the solar cycle. To achieve this, harmonizing the structure and physical parameters of the SOHO/MDI and SDO/HMI databases is essential.

2. Data and Processing

To investigate the spatial and magnetic evolution of sunspot groups, we use two complementary sets of data: SOHO/MDI–Debrecen Sunspot Data (SDD), which covers the entire 23rd solar cycle (1996–2011), and SDO/HMI–Debrecen Sunspot Data (HMIDD), available for the period 2010–2014 [20,21]. In our study, we analyze and compare the overlapping data series from SOHO/MDI and SDO/HMI, which cover 1 May 2010 to 11 April 2011, as our aim is to standardize the observations from these different instruments in the future. Before describing the construction and processing of these datasets, we provide a concise overview of sunspots and sunspot groups to establish the necessary context for understanding our methodology.
Sunspots are dark features on the solar surface associated with strong magnetic fields [2]. These fields inhibit the transport of convective energy, resulting in cooler and thus darker regions compared to the surrounding photosphere [22]. Larger sunspots typically exhibit a two-part structure: a dark central umbra, where the magnetic field strength can exceed 3000 Gauss, and a surrounding penumbra with a filamentary structure and lower field strengths, typically between 700 and 2000 Gauss [23]. Smaller, penumbra-less spots are referred to as pores [24].
Sunspots rarely appear in isolation; they usually form in groups whose development, structure, and polarity patterns reflect the dynamics of the emerging magnetic flux [25]. Most sunspot groups follow a bipolar configuration: they consist of two magnetic polarities, with the leading (preceding) spots being more compact and coherent and the following spots appearing more fragmented and diffuse. These groups are typically aligned roughly parallel to the solar equator. The life cycle of a group varies widely, from hours to several months, with individual sunspots often persisting for about a week.
In the early phase of sunspot group formation, magnetic fields emerge in a disordered manner, often showing mixed polarities. Over time, the configuration usually evolves into a more distinct bipolar pattern as opposite polarities separate. However, the actual magnetic topology of these groups can be significantly more complex than this idealized picture suggests. In particular, some sunspot groups exhibit opposite magnetic polarities within a shared penumbra—known as δ -type configurations [26,27]. These complex structures introduce substantial uncertainty in assigning unambiguous polarities to individual spots and pose challenges for both visual classification and automated data analysis. As we will discuss later, special care must be taken when handling these cases in order to avoid the misinterpretation of polarity measurements.
In this study, we aim to refine and process the SDD and HMIDD databases to facilitate a detailed analysis of sunspot group evolution. Our objectives are twofold. First, we seek to track the complete temporal evolution of sunspot groups by analyzing changes in total group area, the number of individual sunspots, and the development of their magnetic field strength, focusing especially on the entire emerging flux. Second, we examine the evolution of polarity by identifying the magnetic characteristics of individual sunspots. To accomplish these goals, we constructed two tailored datasets: one containing sunspot group areas and their total unsigned magnetic flux, and another including polarity information for distinguishing between positive and negative regions. These datasets form the foundation for the filtering and comparison methods described in the following subsections.

2.1. Features and Differences Between Instruments

The databases derived from two different solar instruments—SOHO/MDI and SDO/HMI—contain both white-light images and line-of-sight magnetic field information. It is important to emphasize that we did not use the raw data directly, nor did we perform image-level calibration or post-processing ourselves. Instead, we relied on the curated databases provided by the Debrecen Heliophysical Observatory: the SDD (SOHO/MDI-based Debrecen Data) and HMIDD (SDO/HMI-based Debrecen Data) catalogs [21]. Throughout this paper, references to SOHO/MDI and SDO/HMI refer specifically to these processed versions unless otherwise noted.
While both instruments have similar observational goals, they differ in several key respects that must be taken into account. Most notably, SDO/HMI offers a significantly higher spatial and temporal resolution compared to SOHO/MDI. The pixel scale of MDI is approximately 2 , pixel 1 , while that of HMI is about 0.5″, pixel 1 . This difference enables HMI to capture finer sunspot structures, such as small umbrae and pores, which often remain undetected or appear merged in MDI observations.
Beyond differences in spatial resolution, there are also significant variations in the measurement techniques employed by the two instruments to assess the magnetic field strength of sunspot groups. SOHO/MDI determines the magnetic field using the Ni I 6768 Å absorption line [28], whereas SDO/HMI utilizes the Fe I 6173 Å line [29]. These two absorption lines originate from slightly different heights in the solar atmosphere, with the Fe I 6173 Å line enabling more precise measurements by providing magnetic field strength data closer to the solar surface. A detailed comparison of the two spectral lines can be found in Norton et al.’s study (2006) [29], where they conclude that the Fe I line can measure the magnetic field strength, as well as longitudinal and transverse flux, with four times greater precision than the Ni I line in active regions. Differences in these measurement techniques can result in systematic discrepancies between the two datasets, which are further influenced by additional effects introduced during data processing.
Systematic differences between SOHO/MDI and SDO/HMI measurements—both in terms of magnetic field strength and area detection—have been extensively analyzed in previous studies. As noted in the Introduction, these include scaling discrepancies in their magnetic field measurements [11,12] and differences in feature detection due to spatial resolution, particularly as reported by Győri (2012) [10].
Before turning to the structure of the databases themselves, it is important to clarify the level at which we analyze the data. While the Debrecen databases provide both individual sunspot and sunspot group-level measurements, we found that magnetic field values associated with sunspot groups were prone to significant processing errors. Specifically, group-level magnetic field strengths were calculated based on the averaged or aggregated values from individual spots, sometimes leading to incorrect or inconsistent results. Therefore, our analysis focuses on sunspot groups, but it is based entirely on data derived from individual sunspots. Group properties—such as total area or total emerging flux—are computed by aggregating data from their constituent spots, ensuring greater accuracy and consistency. To validate this approach, we compared the group-level umbral areas and total areas directly available in the database with the values obtained by summing the corresponding areas of individual sunspot. This comparison allowed us to assess whether the pre-calculated group-level area data could reliably be used in further analyses. The results of these comparisons are presented in Appendix A. Our findings suggest that while the group-level area values are sufficiently accurate for studies that do not require detailed spot-level analysis, the corresponding magnetic field data at the group level are often unreliable and should be used with caution or avoided altogether.

2.2. Structure of the Databases

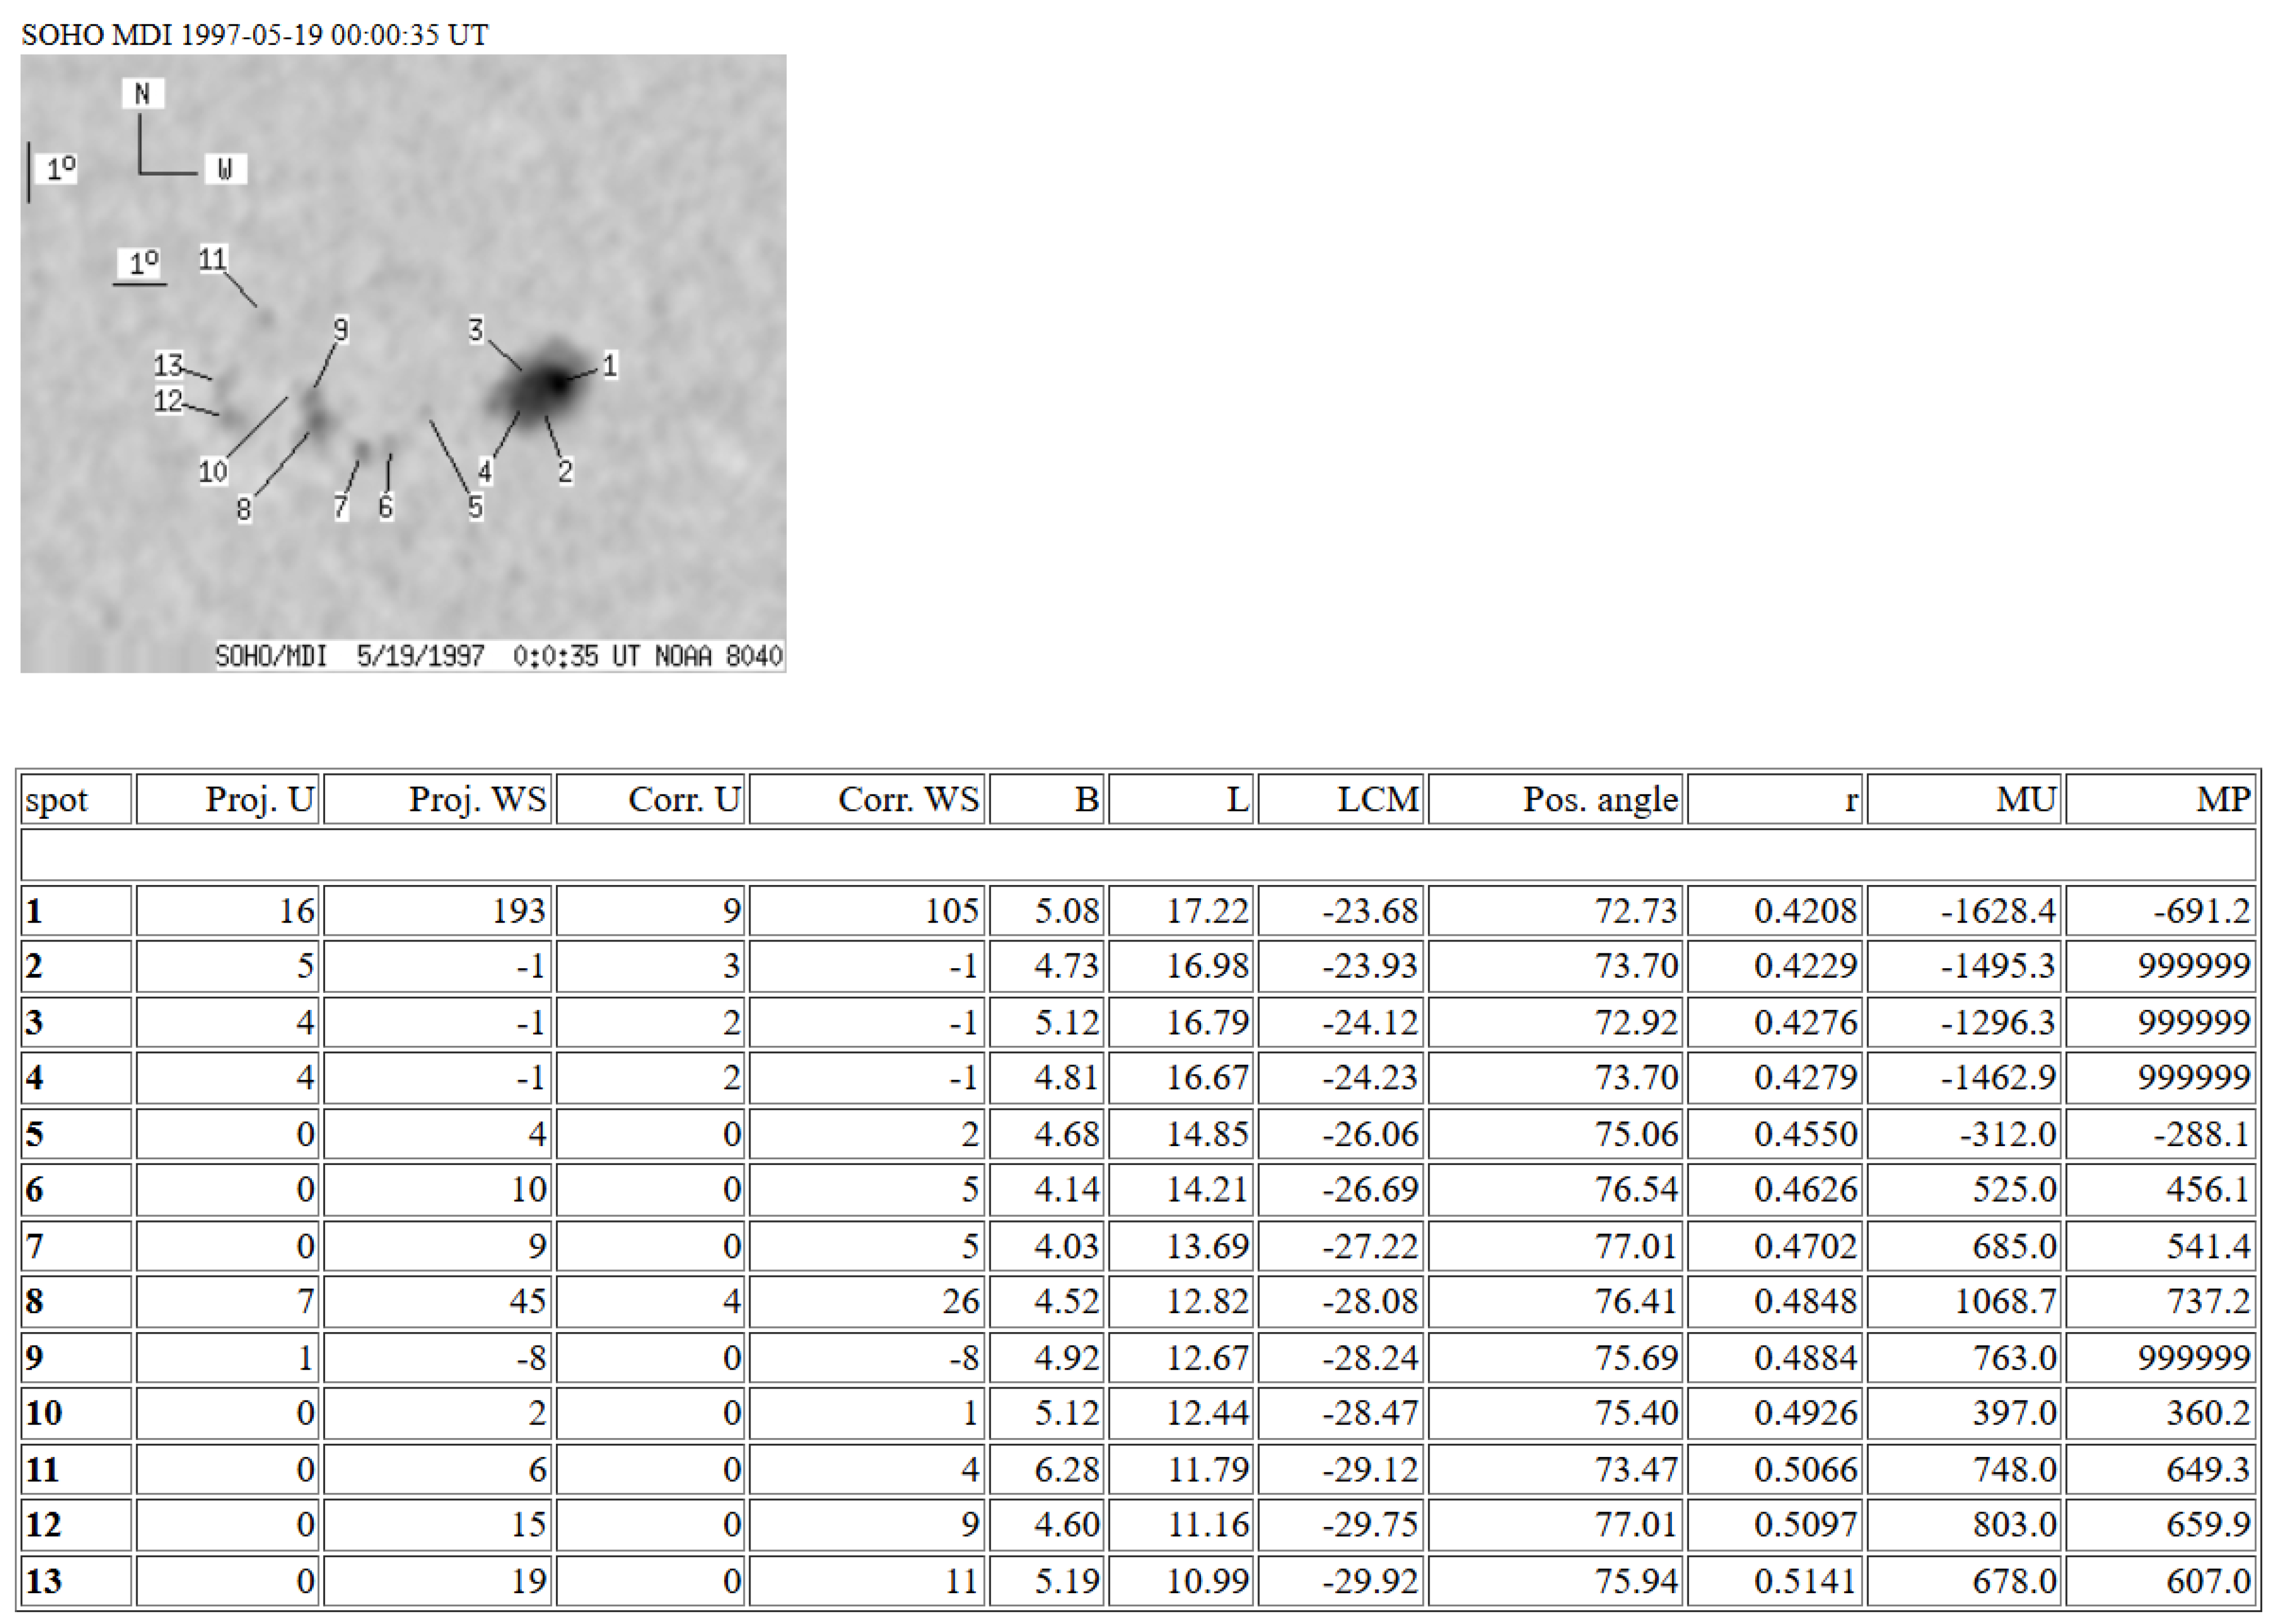
The two databases contain numerous physical parameters with a temporal resolution of 1 to 1.5 h, enabling the high-resolution tracking of sunspot evolution. Figure 1 and Figure 2 demonstrate the internal structure of the datasets, using observations of sunspot group NOAA 8040 at two different times for illustration. In addition to illustrating the group’s temporal development, these figures highlight how individual sunspots are recorded and sometimes merged in the databases.
Each dataset entry has a fixed column structure, which includes (left to right in Figure 1 and Figure 2) sunspot ID, projected umbral area (Proj. U), projected total area (Proj. WS), corrected umbral and total areas (Corr. U and Corr. WS), heliographic latitude (B) and longitude (L), longitudinal distance from the central meridian (LCM), position angle, radial distance from the disk center (r), and the mean magnetic field strength of the umbra (MU) and penumbra (MP). The NOAA number of the sunspot group is also provided. If a group does not appear in the official NOAA database, a modified identifier with an appended letter is used. However, since these groups are typically small and short-lived, we restrict our analysis to the original, unlettered groups.
A key feature of the database is that individual sunspots cannot be tracked over time, as their IDs are reassigned during each observation. This makes it impossible to follow the evolution of a single sunspot across multiple images. Moreover, sunspots that are spatially close may be “merged” during image processing. In such cases, while their magnetic field strengths and coordinates are recorded separately, their area values may be shared. When merging occurs, the area columns (2–5) may contain negative values. These indicate that the area measurement is assigned to another sunspot, which can be identified by the absolute value of the entry. For instance, a Corr. WS value of 1 means the total area is added to sunspot 1. The same logic applies to magnetic field strength values: if they are missing or assigned to another spot, the column contains the placeholder value 999,999.
This reassignment process works correctly when merged sunspots share the same magnetic polarity. Figure 1 shows such a case, where sunspots 1–4 are merged under consistent polarity. In contrast, Figure 2 presents a problematic example where spots with opposing polarities (sunspots 9–12) are grouped, causing misrepresentation in the dataset. These inconsistencies not only affect individual spot data but also introduce errors at the group level. Merged sunspots without their own area values can distort the area-weighted center of the group, impacting derived parameters like group structure and polarity distribution. In Section 2.3, we detail how we addressed these issues to improve data reliability.

2.3. The Group Datasets

Having established the structure of the sunspot data, we now describe how we derived the key parameters at the sunspot group level. Since our analysis focuses on group properties, individual sunspot data had to be aggregated in a consistent and physically meaningful way. The total area of a sunspot group was calculated as the sum of the areas of its constituent sunspots. To determine the group’s position, we used area-weighted averages for heliographic latitude (B) and longitude (L):
B group = i = 1 n b i · a i i = 1 n a i ,
L group = i = 1 n l i · a i i = 1 n a i ,
where b i and l i denote the latitude and longitude of each sunspot and a i is the total area.
To characterize the group’s location on the solar disc, we assigned the minimum r value (distance from the disk center in solar radius units) to a point among its spots. For magnetic field parameters—umbra (MU) and penumbra (MP) strengths—we initially considered area-weighted averages. However, many sunspots have magnetic field values but no recorded area, which would exclude them from a weighted approach. To avoid data loss, we opted instead to sum the absolute MU and MP values across the group. When summing the absolute magnetic field strength values of all sunspots within a group at a given observation time—without weighting by area—the resulting totals can be significantly higher than the magnetic field strength of individual sunspots. For reference, Livingston et al. (2006) [30] reported that the strongest magnetic field measured in a sunspot umbra was about 6.1 kG. In contrast, our summed group-level values often exceed this by a factor of up to ten. This is not due to a single strong sunspot, but rather reflects the aggregation of multiple spots’ contributions to the group. While this method sacrifices some physical specificity, it preserves the data’s completeness and allows for consistent group-level comparisons across the datasets. Nonetheless, area-weighted versions remain available for specific analyses. To ensure consistency, the number of sunspots per group was determined independently of the original database logic, i.e., we only counted sunspots with valid area entries, as only these spots contribute meaningfully to area and position calculations.
One key limitation of the datasets is their lack of error estimates. Although the documentation suggests that magnetic field measurements are accurate within a few tens of Gauss, this is a general approximation rather than a quantified uncertainty per observation. No formal error margins are provided for individual parameters—for magnetic field strength or sunspot area. While some studies, such as Forgács-Dajka et al. [31], have introduced statistical uncertainty into area values using normally distributed noise, in our case the sources of uncertainty are broader. Besides area, both magnetic field strength and sunspot counts may vary due to instrumental limits and resolution-based detection thresholds. These effects are especially important for smaller sunspots, which are more easily missed or inconsistently identified. A detailed error assessment would require the direct analysis of the original magnetograms. However, as our study is based entirely on preprocessed, tabulated data, and not on image-level analyses, systematic error estimation is beyond our scope. Additionally, image processing itself introduces complexities that we cannot fully reconstruct.
Given these limitations, we acknowledge that our analysis proceeds without quantified uncertainties. While this is a constraint, the high temporal resolution and consistent methodology of the Debrecen Sunspot Data provide a solid and valuable foundation for investigating sunspot group evolution. Future studies with direct magnetogram access or cross-calibration with other datasets may offer a way forward in addressing these open questions.

3. Methods Used to Compare Sunspot Area, Number, and Magnetic Field

In order to investigate the long-term evolution of sunspot groups, it is essential to construct a unified dataset that integrates measurements from both SOHO/MDI and SDO/HMI. Achieving this requires harmonizing the structure of the two databases and ensuring that key physical parameters—such as area and magnetic field strength—are directly comparable. As a foundational step in this process, we focused on identifying and characterizing potential discrepancies between the datasets.
To ensure consistency and comparability between the datasets, we used several methods to identify and quantify potential discrepancies in sunspot area, number, and magnetic field strength. Due to differences in instrumentation, measurement techniques, and temporal coverage, these comparisons required careful methodological consideration. The following subsections detail the approaches employed in our study.

3.1. Comparison of Measurements Taken at Almost the Same Time

Within the overlapping period between the SOHO/MDI and SDO/HMI datasets (from 1 May 2010 to 11 April 2011), we identified 116 sunspot groups for which both instruments provided observations. We then searched for cases where measurements were taken within one minute of each other. This method, inspired by the approach used by Győri (2012) [10], differs in that our focus is on sunspot group properties rather than on individual sunspots. In the approximately hourly observation data on the 116 sunspot groups, we identified 982 nearly simultaneous observation pairs, allowing for direct comparisons of their umbral and total areas, sunspot counts, and magnetic field strengths. Since the datasets provide magnetic field data separately for umbra and penumbra, we analyzed these components individually.
Although this approach offers precise comparisons at specific moments, it is less suitable for studying the continuous evolution of sunspot groups over time. In such analyses, each data point contributes to reconstructing the groups’ temporal development. Because exact time matches are relatively rare, we also used broader statistical methods to explore systematic differences between the datasets. The results of these analyses are presented in Section 4.1.

3.2. Comparison of Averaged Values over Different Time Intervals

To mitigate the limitations in comparing measurements taken at nearly the same moment, we also analyzed sunspot groups over extended time intervals by averaging their key parameters. This allowed us to identify systematic trends beyond short-term fluctuations. Of the 116 overlapping sunspot groups, 113 were observed by both instruments over a sufficiently long common time period. Since the measurements were not always taken at identical times, a point-by-point comparison was not feasible in every case. To address this, we computed average values over time windows ranging from several hours to a few days.
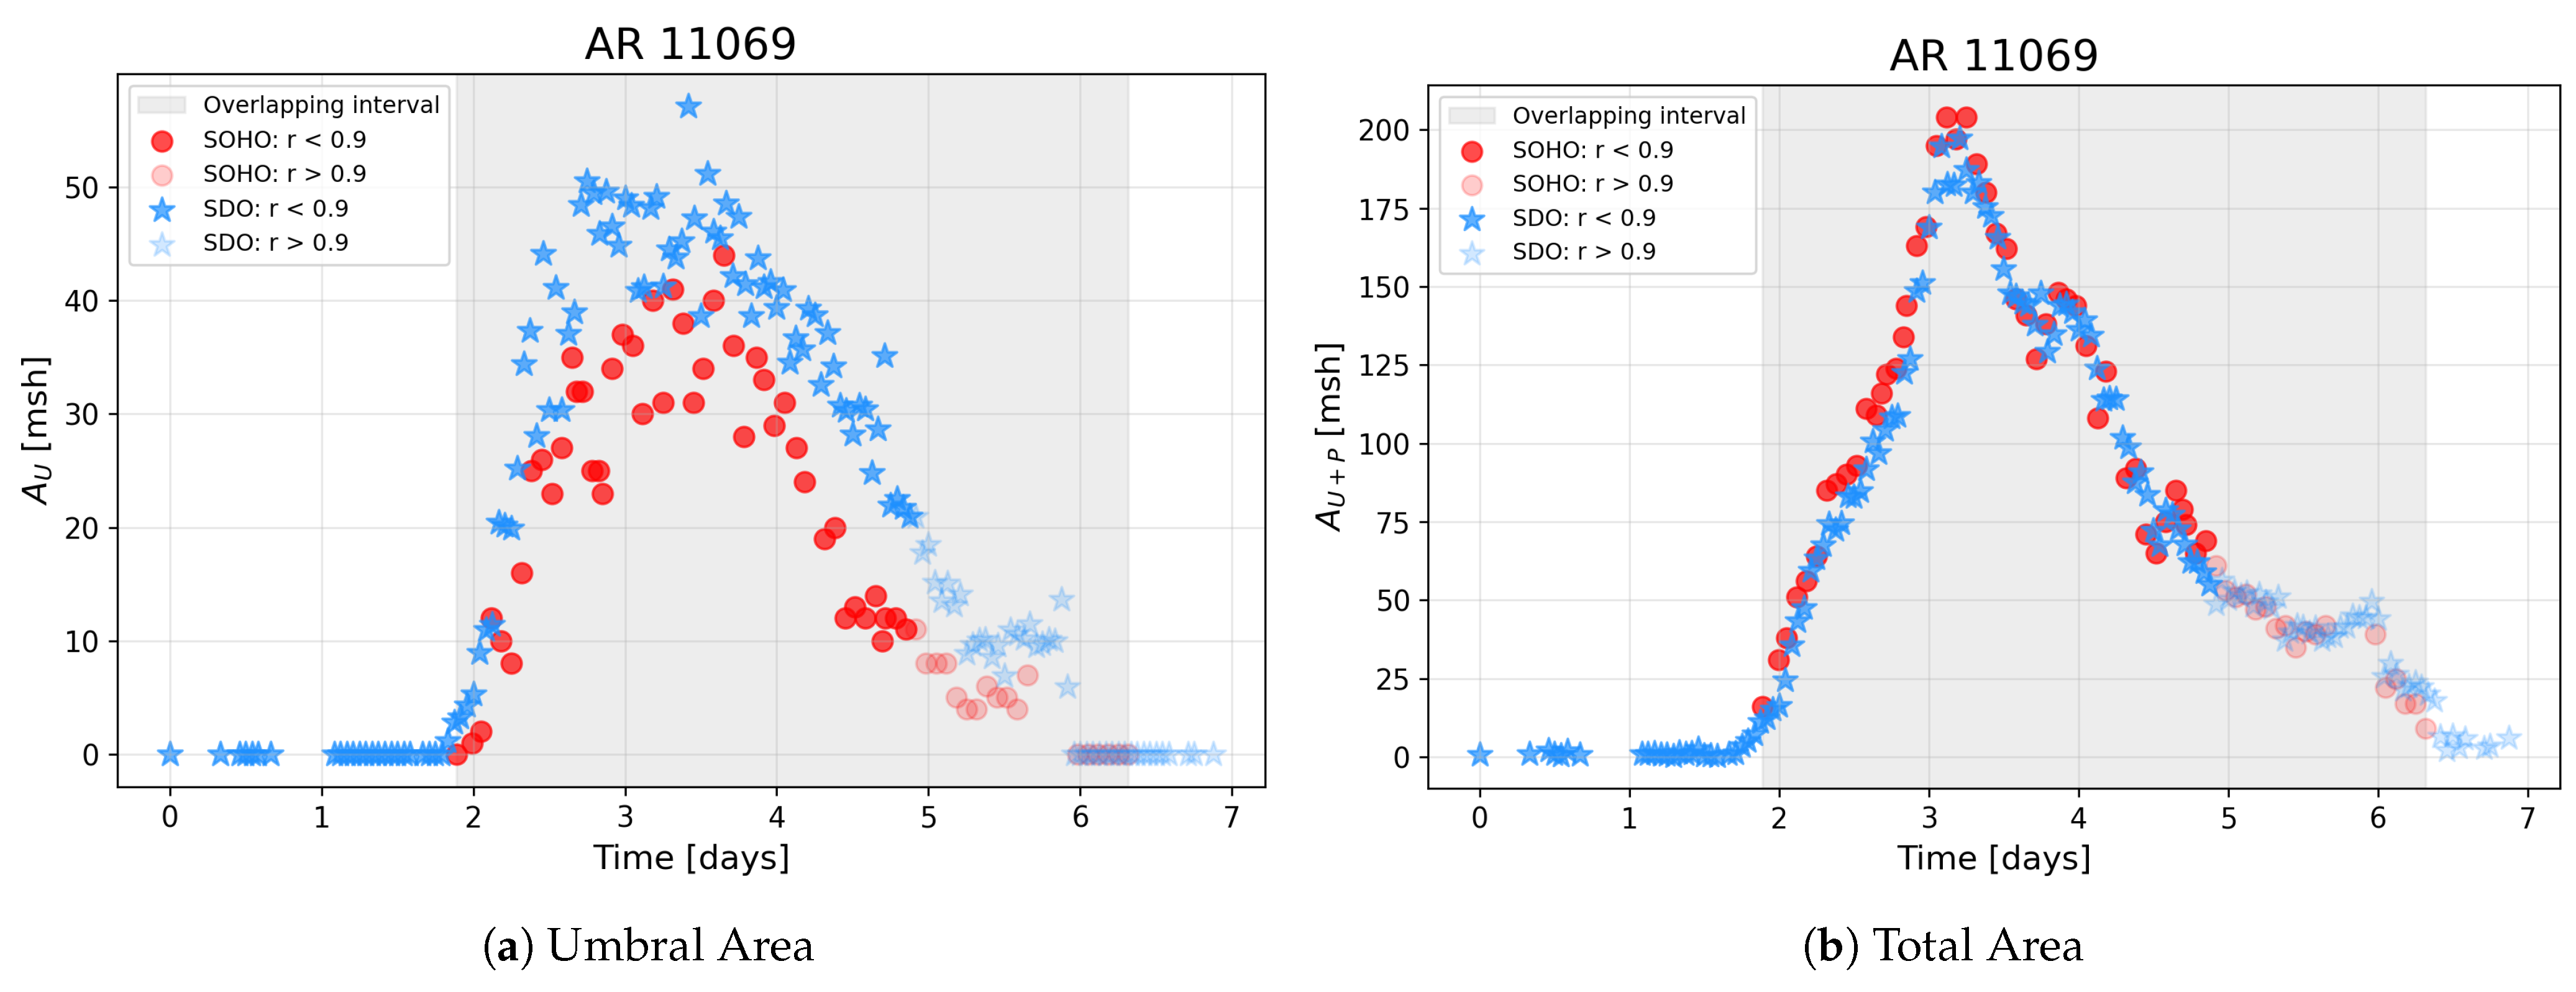
The data selection process involved several key steps that are illustrated in Figure 3, which shows the temporal variations of the umbral area (panel (a)) and total area (panel (b)) of sunspot group AR 11069. First, we determined the overlapping observation intervals for each sunspot group, as the start and end times of measurements often differed between the two instruments. To minimize the influence of projection effects near the solar limb, we excluded data points where r > 0.9 , with r being the normalized distance from the center of the solar disc. These excluded points are shown as lighter-colored markers in the figure, while the data used for averaging are indicated by darker markers. Averages were computed over 12 h, 24 h, and 48 h intervals for umbral and total areas, sunspot counts, and magnetic field strengths. Specifically, 13 sunspot groups were suitable for 12 h averaging, 25 for 24 h intervals, and 54 for 48 h averaging.
Despite these efforts, certain biases must be acknowledged. Ideally, averaging should be performed over the shortest possible time window, as the evolution of sunspots can be quite significant at short timescales. Furthermore, when comparing data averaged over 24 or 48 h periods, it is possible that the two instruments recorded observations at opposite ends of the interval. In such cases, ongoing sunspot development may introduce discrepancies into the comparison. The results of these averaged comparisons are discussed in Section 4.2.

3.3. Separation of Sunspot Groups by Magnetic Polarity

A key component of our analysis involves distinguishing between regions of opposite magnetic polarity within sunspot groups. Both the SOHO/MDI and SDO/HMI datasets include measurements of magnetic field strength and polarity, enabling a polarity-based decomposition of sunspot group areas. As a natural continuation of this work, we plan to investigate the leading and following parts of the sunspot groups separately. While this is traditionally carried out based on spatial location, we rely primarily on magnetic polarity to achieve this separation.
As mentioned in Section 2, the magnetic configuration of sunspot groups can be complex, and reliable separation is not always possible. In particular, δ configurations often pose a significant challenge due to their mixed polarity structures. These configurations can introduce ambiguity into magnetic classifications, making it unclear whether the observed opposite polarities represent real physical structures or measurement artifacts. For all remaining sunspots, we assigned each to either the positive- or negative-polarity category based on the measured field polarity.
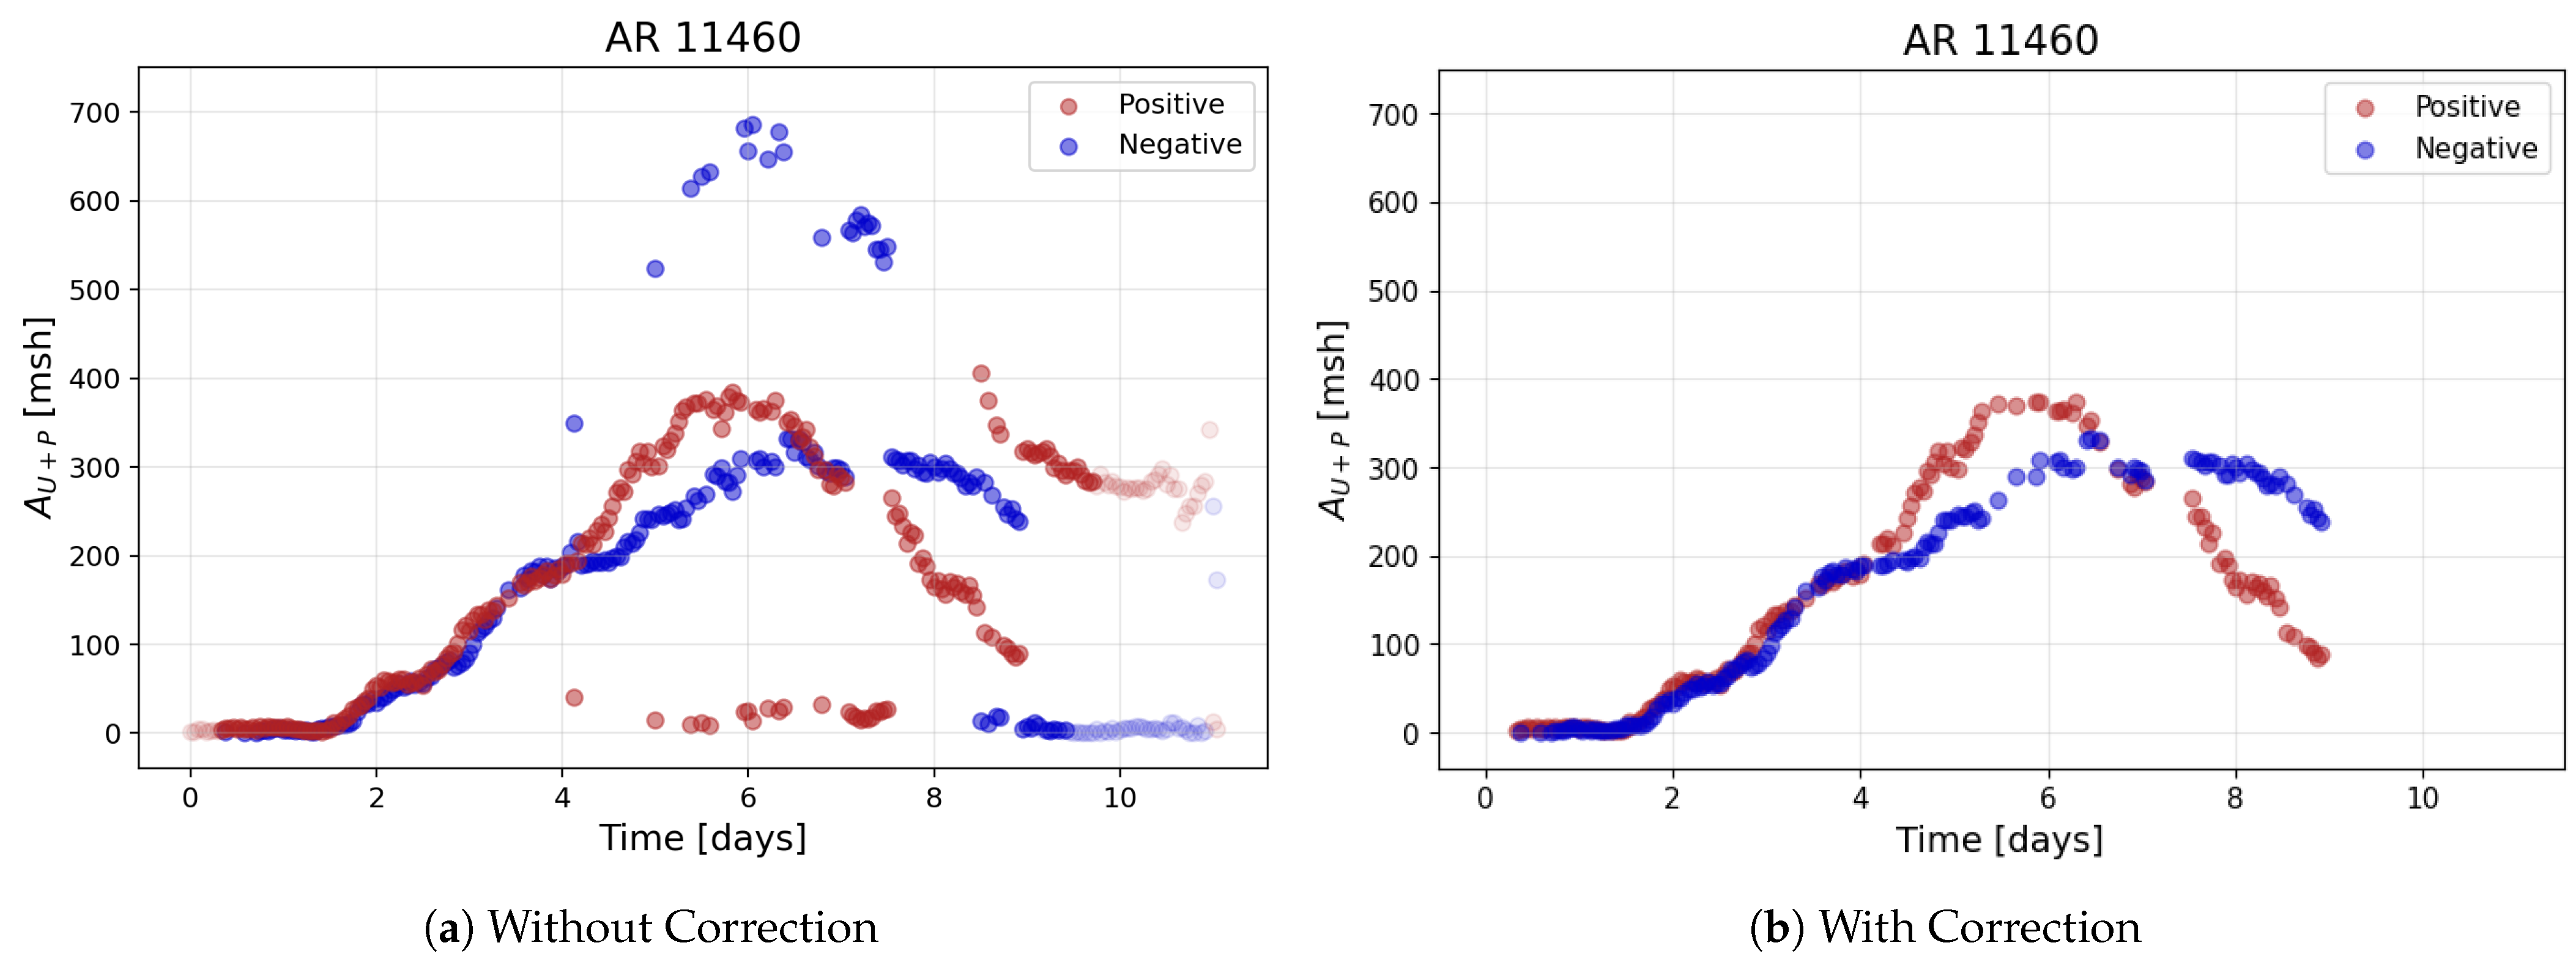
Despite these refinements, polarity-based separation remains challenging due to occasional misclassification and the merging of sunspots with opposite polarities. This issue can lead to incorrect area assignments and introduce outliers that distort the true temporal evolution of a group. An illustrative case is presented in Figure 4, which shows area variations for AR 11460. In panel (a), we observe abrupt transitions, where one polarity area drops to nearly zero while the other spikes dramatically, indicating instances where incorrect merging occurred. Around day 8, the trend reverses, suggesting that positive-polarity areas were incorrectly added to negative-polarity data.
Our initial attempt to correct these errors involved filtering out only the incorrectly merged sunspots at each individual time step. However, this strategy proved insufficient, as it often introduced further inconsistencies, particularly when entire sunspot areas were wrongly attributed to one polarity. As a more robust solution, we opted to completely exclude time steps in which such erroneous mergers were detected. The resulting cleaner separation is shown in panel (b) of Figure 4. Although this approach reduced the total number of usable observations, it greatly enhanced the reliability of polarity-based analyses by minimizing contamination from misclassified regions.

4. Results

In the previous sections, we described the construction and harmonization of sunspot group datasets derived from SOHO/MDI and SDO/HMI observations, along with the methodologies developed to ensure their compatibility. We now turn to the analysis of the results obtained using these harmonized data. This section presents the outcomes of our comparative study, focusing on the consistency of measured sunspot group properties—such as area, number, and magnetic field strength—across the period in which the two datasets overlap. In addition, we examine how separating the polarities within sunspot groups influences our understanding of their magnetic evolution.

4.1. Comparison of Simultaneous Measurements

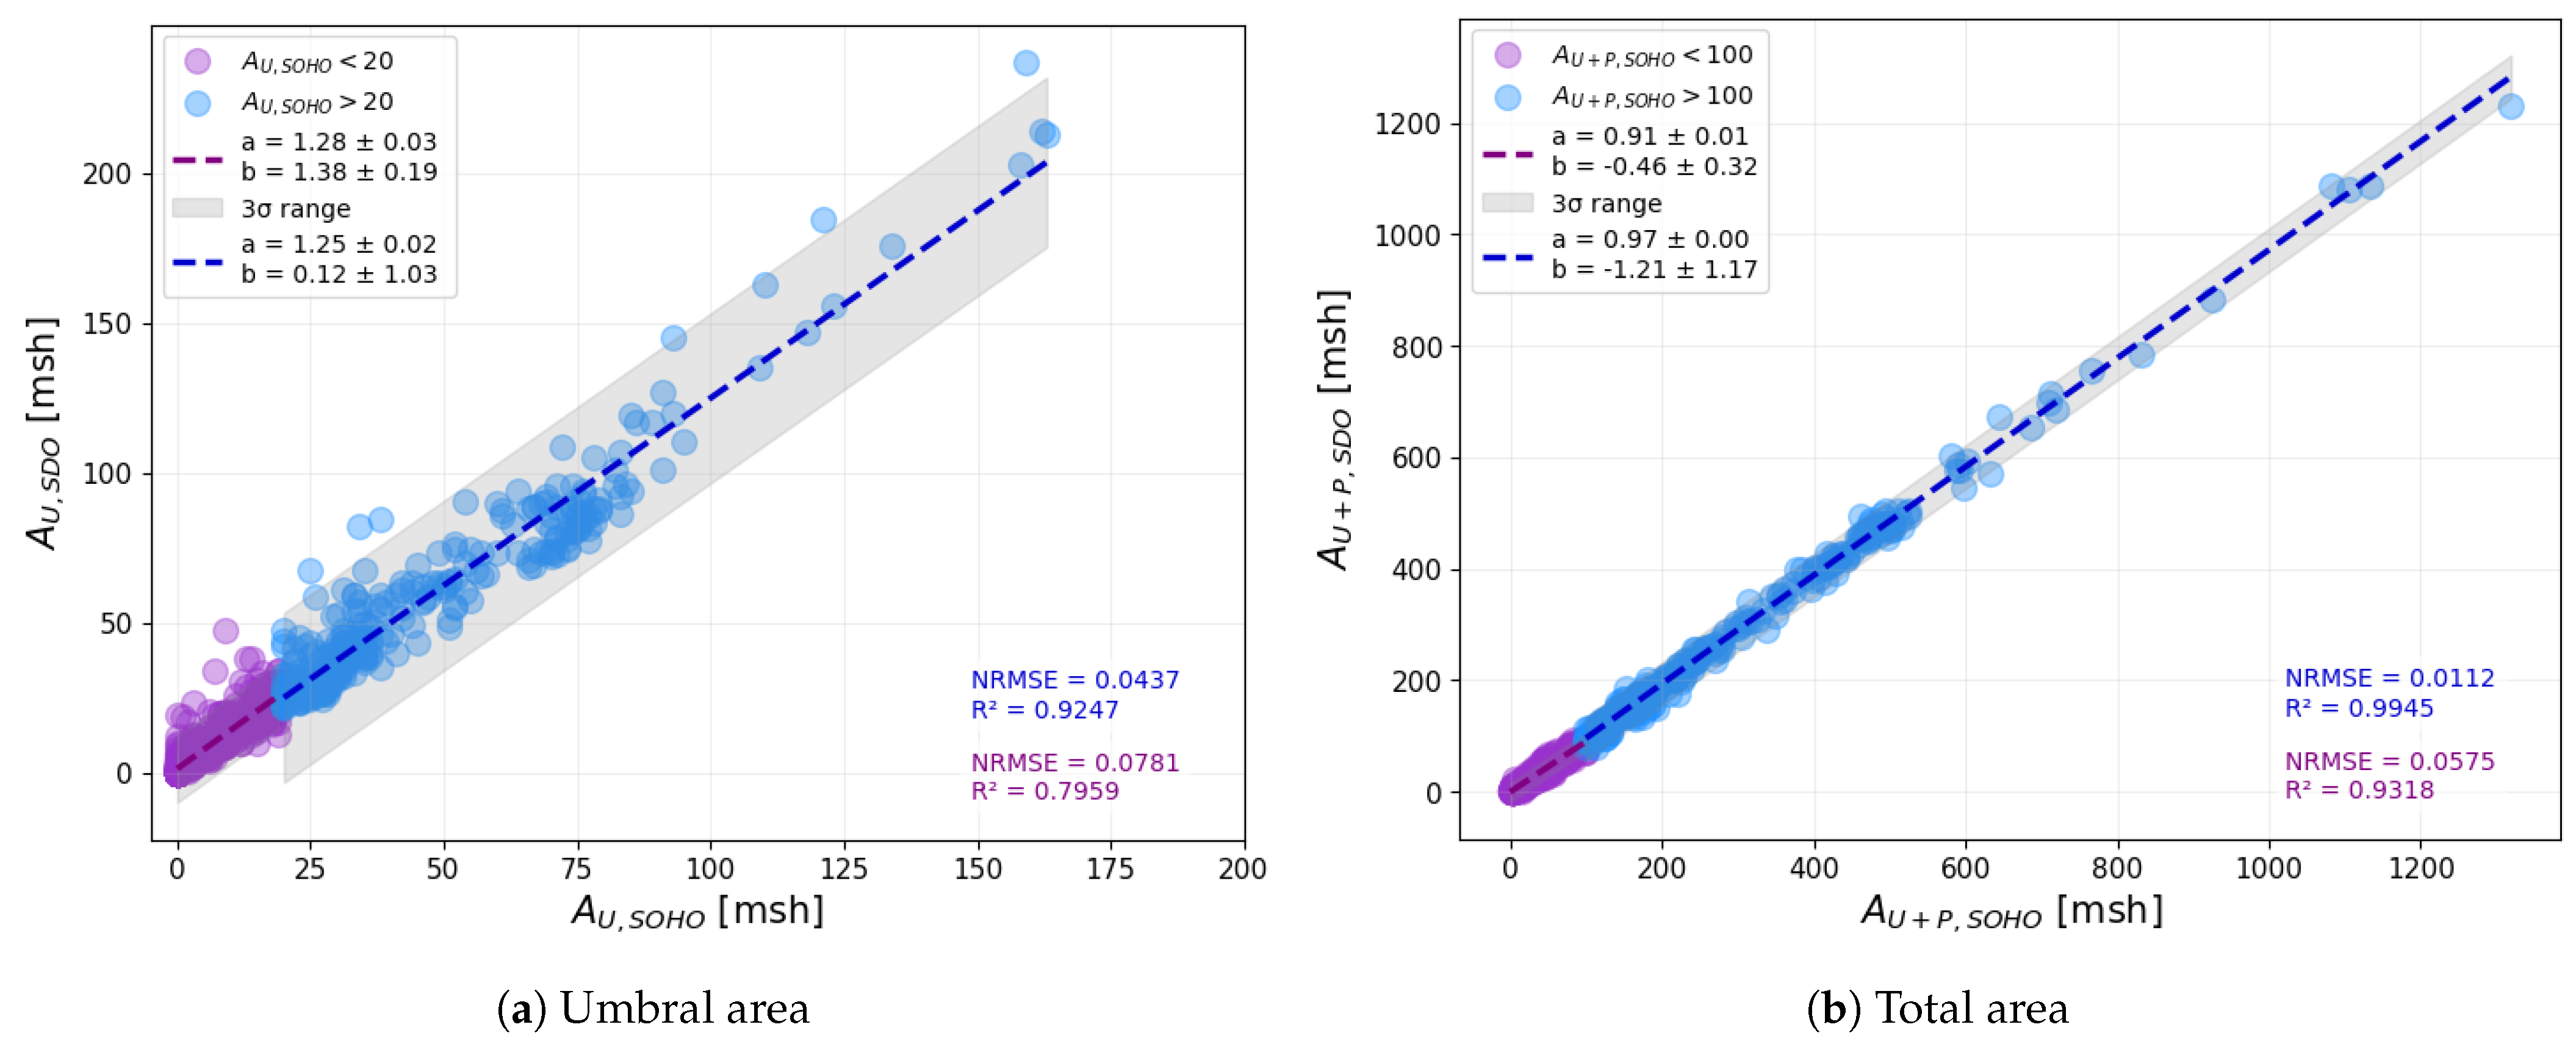
In this section, we compare sunspot properties measured by SOHO/MDI and SDO/HMI within 1 min intervals. To evaluate the similarity between the two datasets, we applied linear regression fits and computed two key statistical metrics: the Normalized Root Mean Squared Error (NRMSE) and the coefficient of determination ( R 2 ). The NRMSE quantifies the average deviation of the predicted values from the actual measurements, normalized by the range of the dataset, providing a scale-independent measure of error. On the other hand, R 2 indicates the proportion of variance explained by the model, with values closer to 1 suggesting a strong linear correlation. It is important to note that R 2 specifically reflects the goodness-of-fit under the assumption of linearity and does not characterize general or non-linear associations between variables.
We first analyzed the correlation between the umbral and total (umbra + penumbra) areas measured by the two instruments (Figure 5). Since SOHO/MDI has a lower spatial resolution, the area values were categorized as either small or large based on SOHO/MDI data. We used separation thresholds of 20 msh for umbral areas and 100 msh for total areas, following the method used in a study by Tlatov and Pevtsov (2014) [32]. Linear fits were applied separately for the two categories. The results suggest that the correlation differs for small and large areas. The differences in the slope (parameters ‘a’ in Figure 5) of the linear fits indicate that umbral areas deviate by approximately 3% between the two datasets, while for total areas, the deviation is nearly 6%. A notable trend is that SOHO/MDI generally underestimates umbral areas but overestimates total areas compared to SDO/HMI. Although large sunspot groups exhibit a strong linear relationship ( R 2 = 0.9945 ), the significant scatter seen wtih small sunspots suggests that no universal correction factor can be reliably applied.
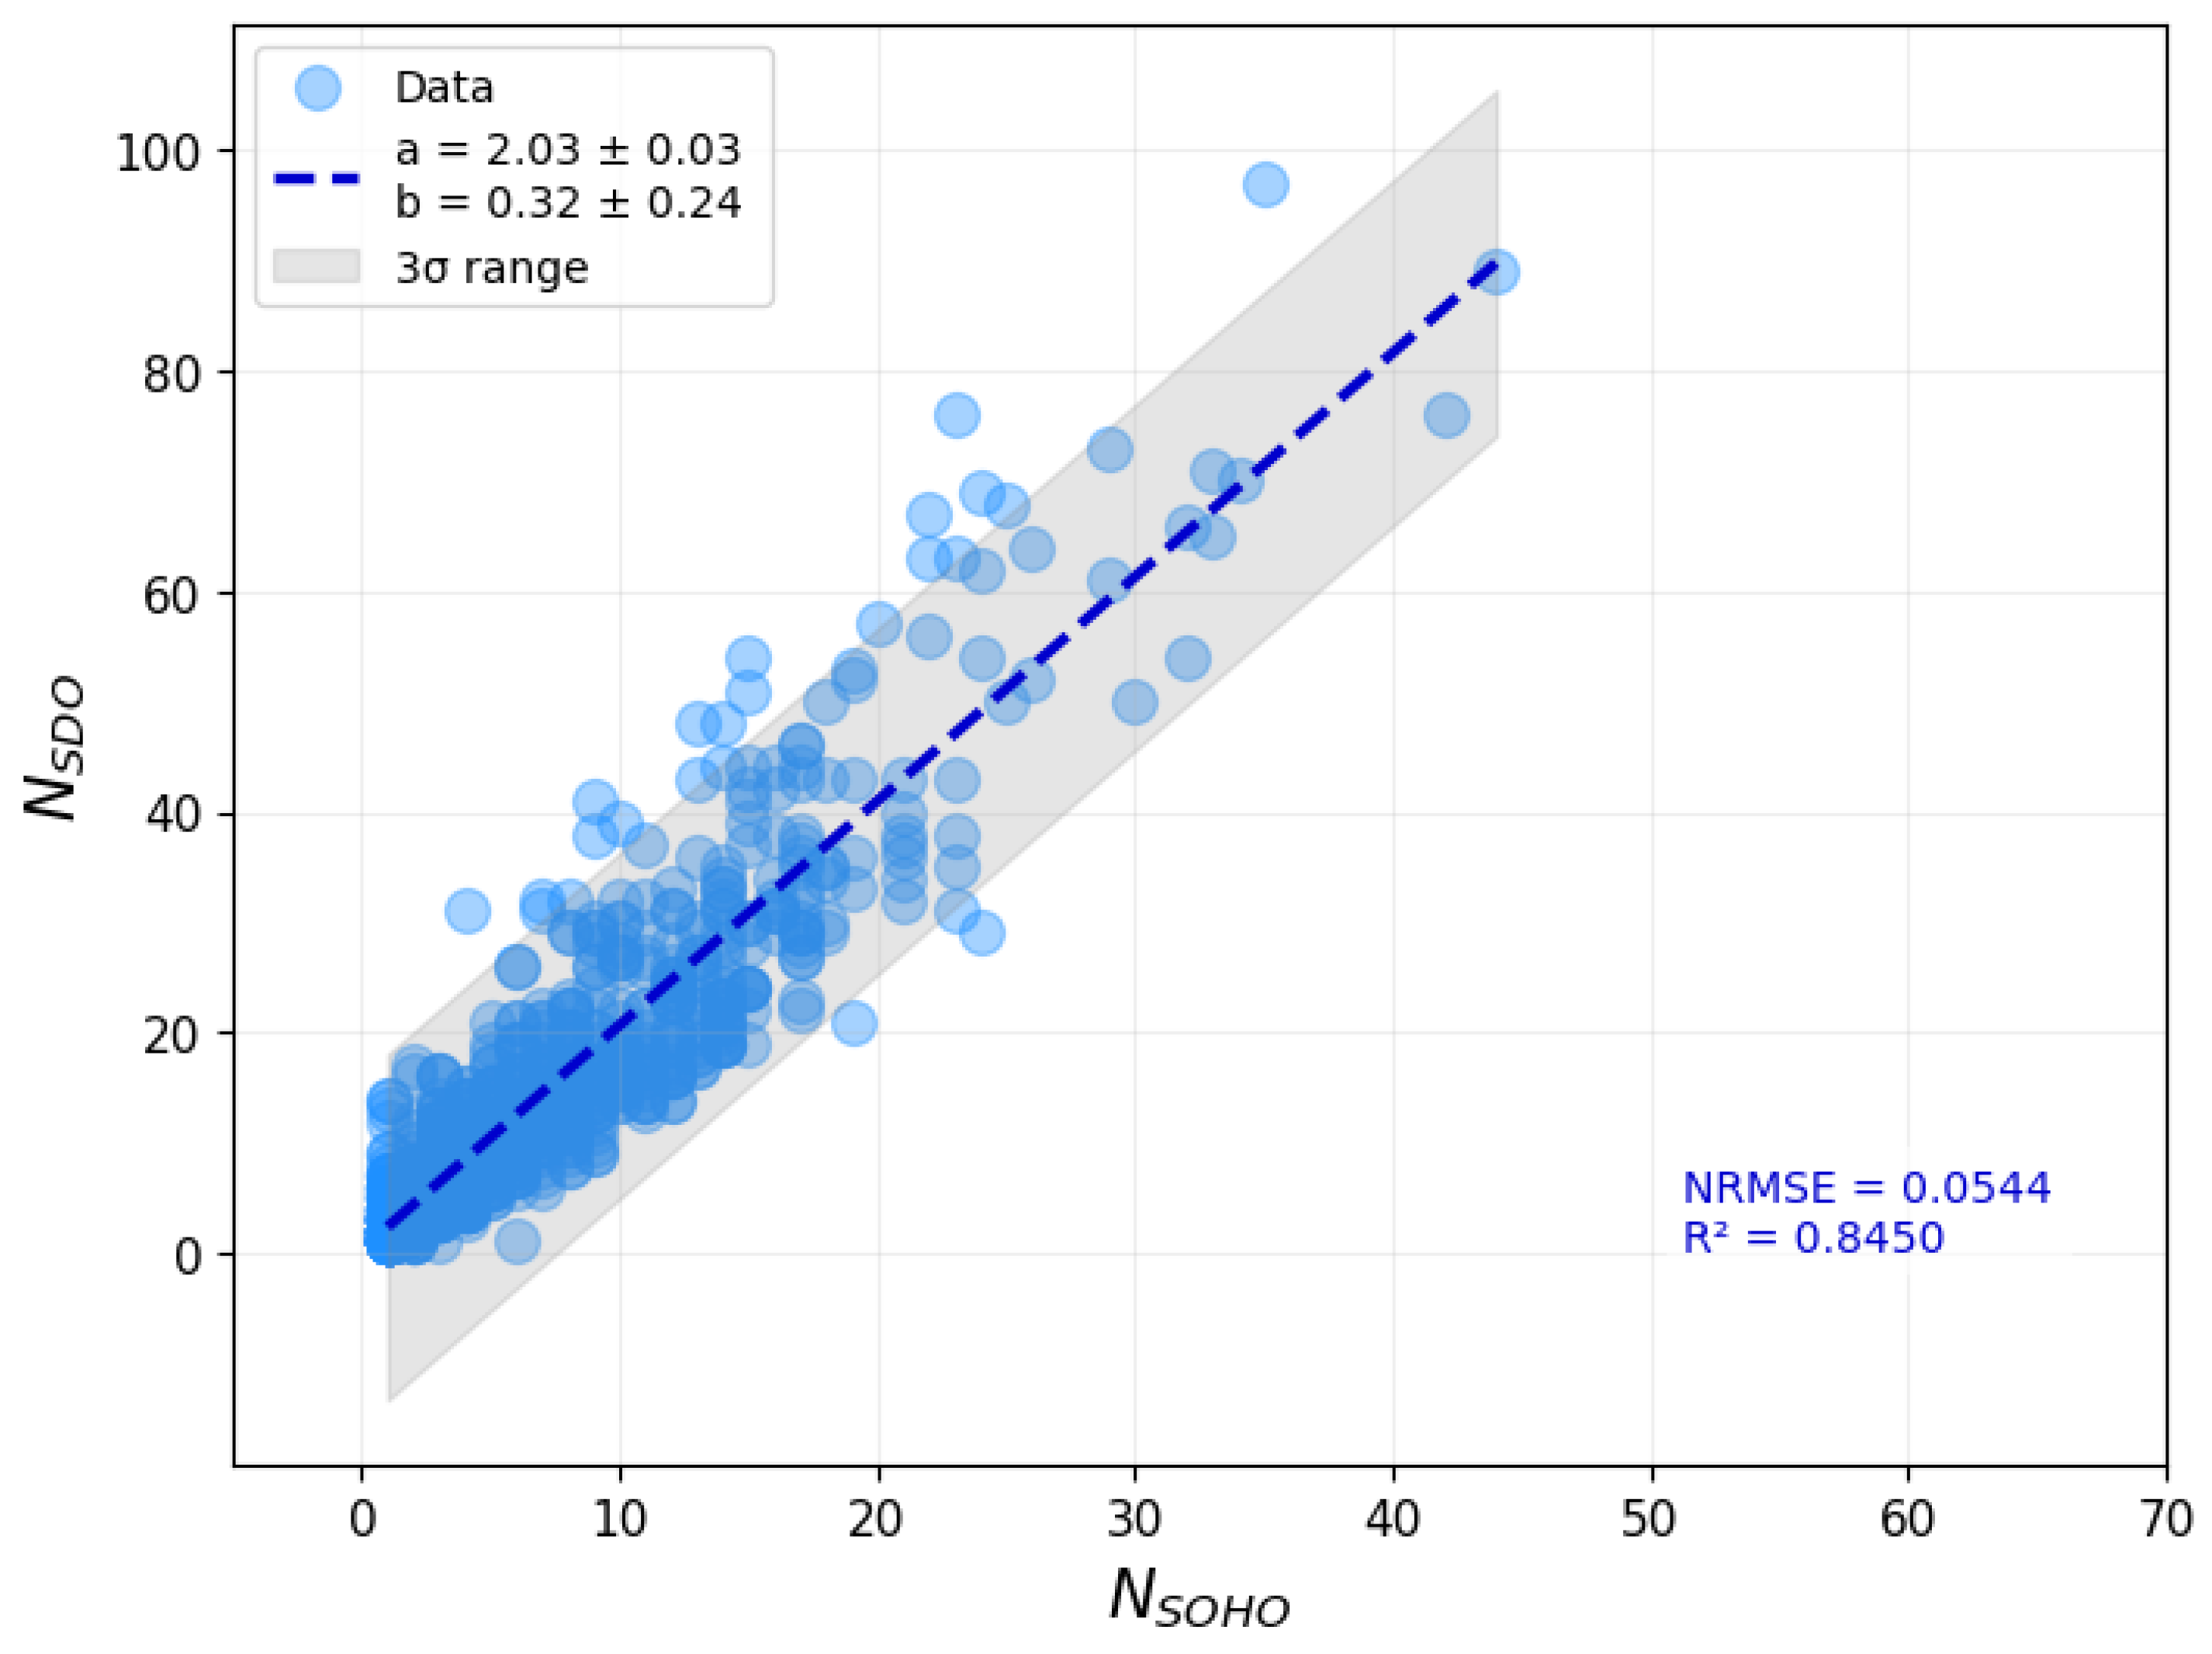
We then examined the correlation between the number of identified sunspots ( N S O H O and N S D O ), as shown in Figure 6. No clear threshold was identified as separating the small and large groups in this case. The regression line reveals that SDO/HMI typically detects roughly twice as many individual sunspots as SOHO/MDI, although this ratio varies significantly. The wide range of the data limits the predictive power of a single linear model.
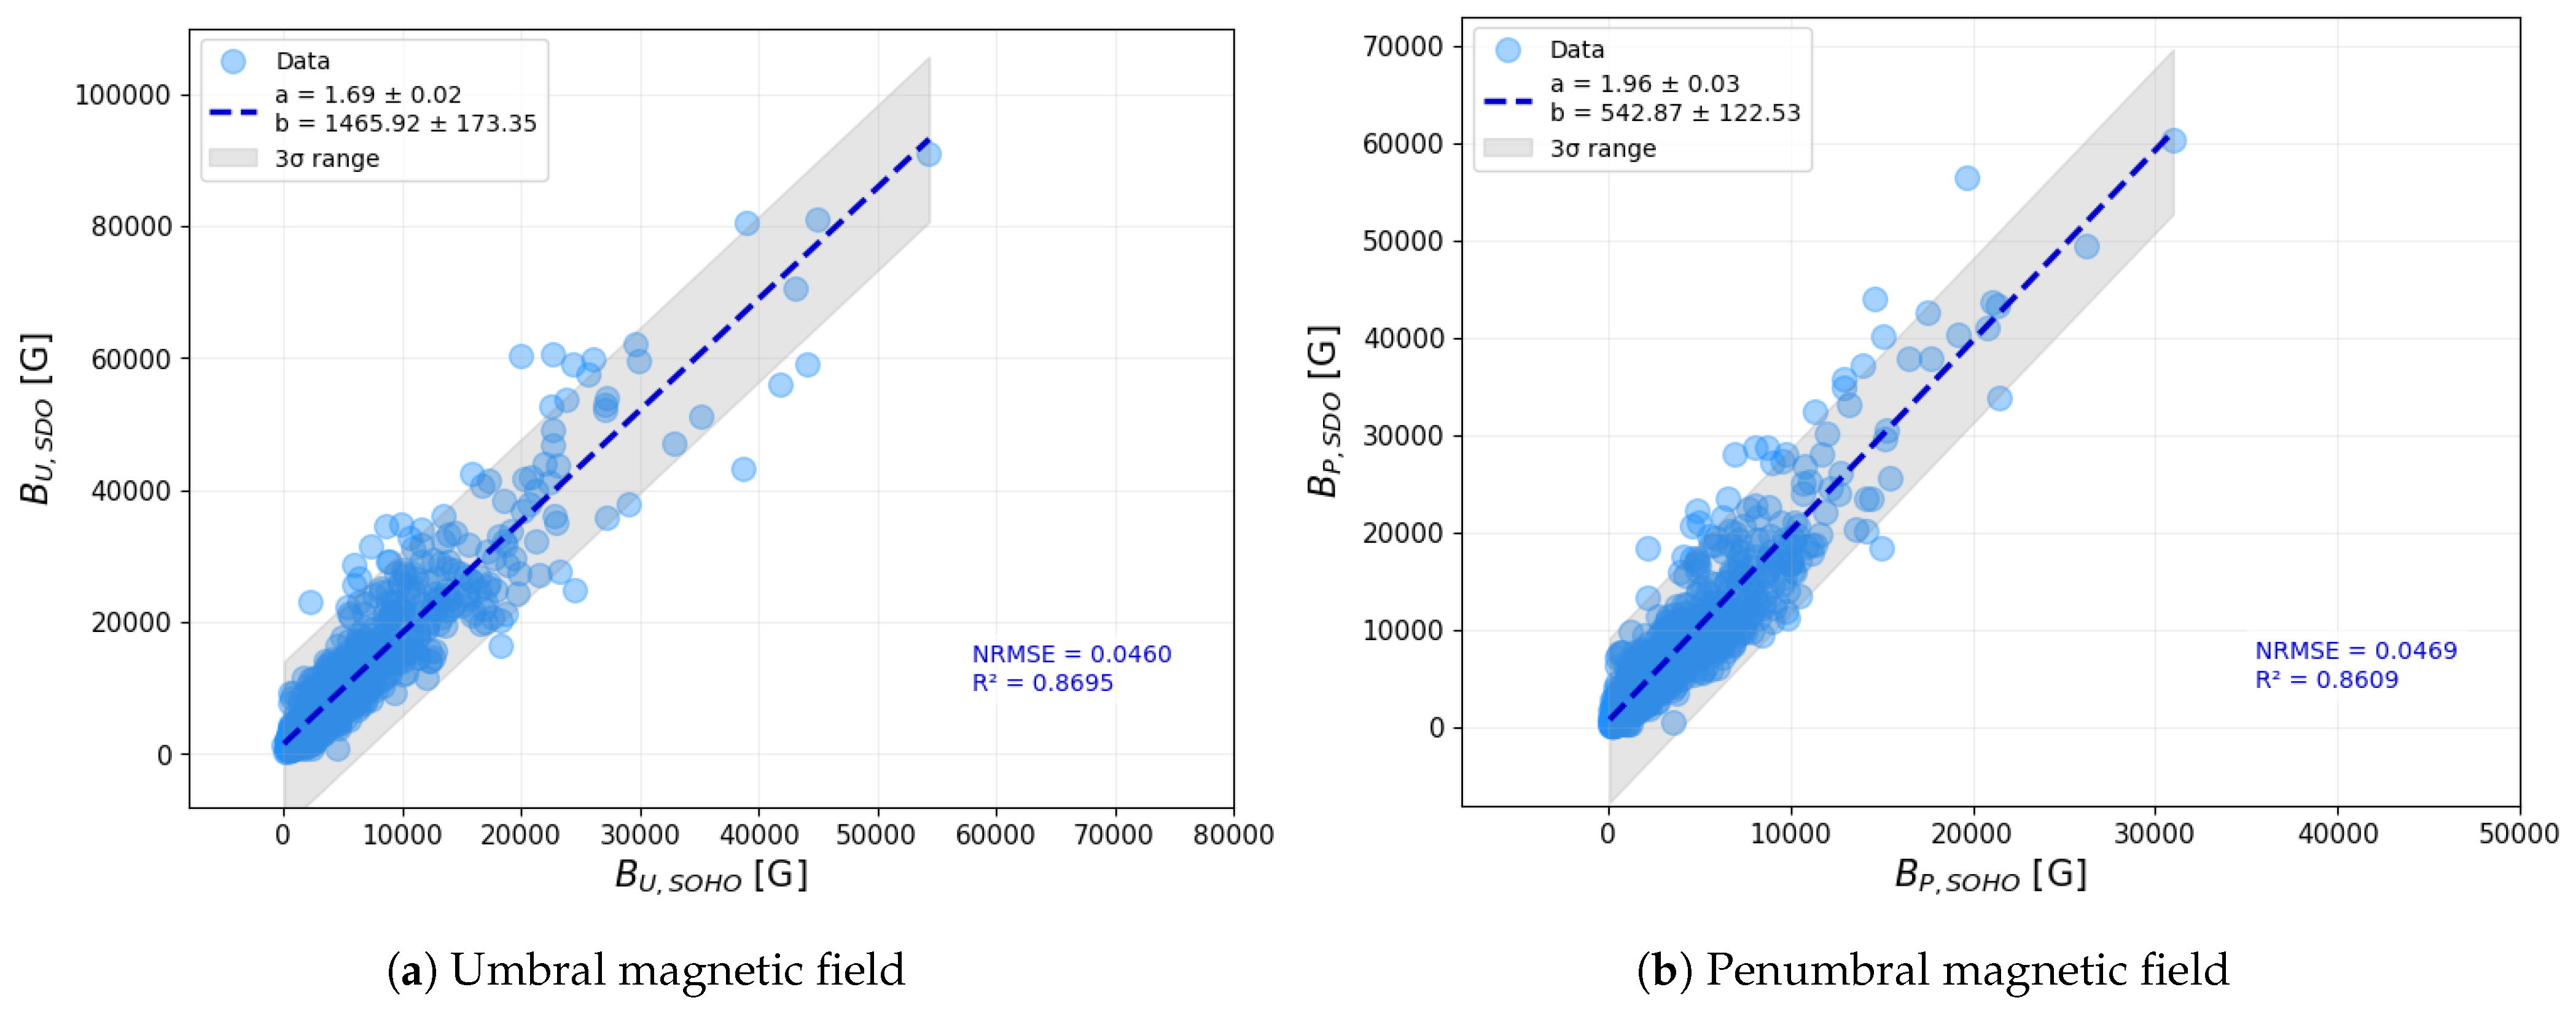
Finally, we compared the magnetic field strengths in the umbra and penumbra (Figure 7). Here, again, no separation into small and large categories was applied. The scatter in the penumbral field strengths is particularly large, likely reflecting the challenges of accurate measurement in those regions. The low R 2 values and the presence of numerous outliers reinforce the conclusion that a single correction factor cannot be applied consistently across different sunspot regions or datasets.

4.2. Comparison of Averages Across Different Time Intervals

While the previous section focused on measurements taken within a 1 min interval, direct comparisons were often complicated by observational differences between SOHO/MDI and SDO/HMI. To address these challenges and identify systematic trends, we extended our analysis to longer time intervals, averaging key parameters over periods ranging from a few hours to several days. This approach mitigates short-term fluctuations and enables the examination of broader discrepancies between the two datasets.
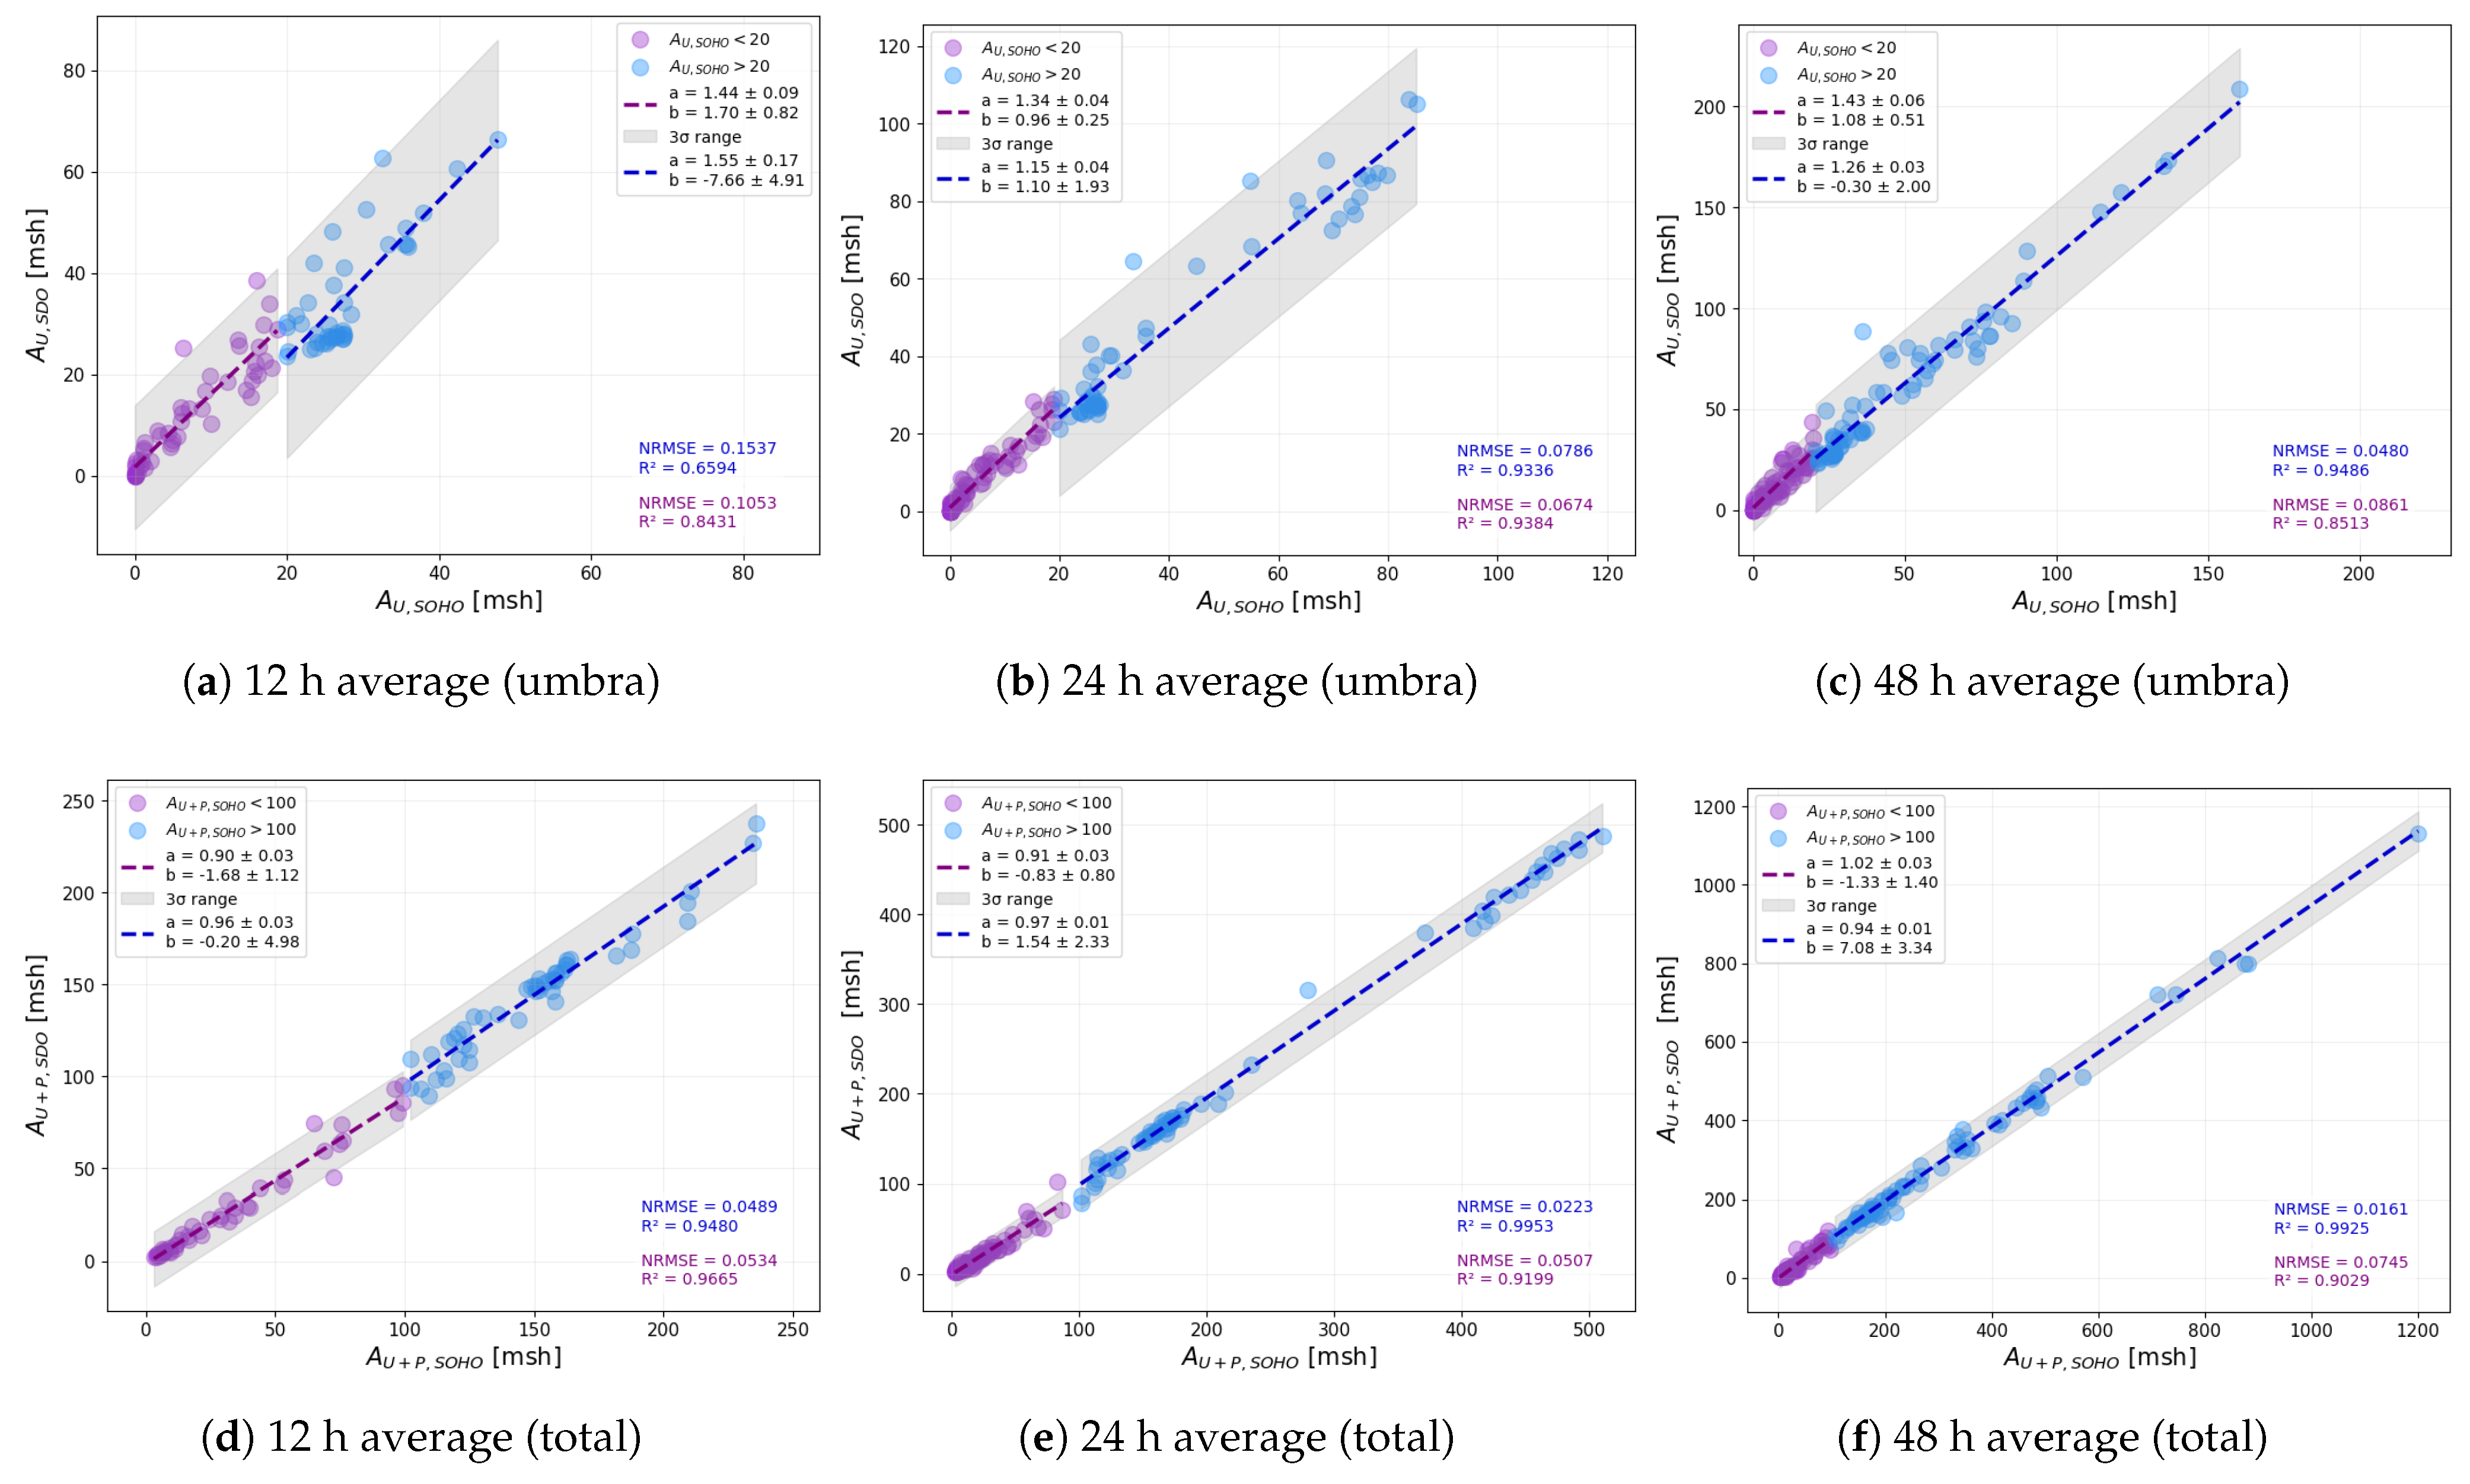
Figure 8 presents the results of our comparison of averaged area values. The top row displays data for umbral areas, while the bottom row corresponds to total sunspot areas. Panels (a) and (d) show values averaged over 12 h intervals, panels (b) and (e) represent 24 h averages, and panels (c) and (f) illustrate results based on 48 h averaging.
As in our previous analysis, we separated small and large values using the thresholds of 20 msh for umbral areas and 100 msh for total areas. The slopes of the fitted lines confirm the trend observed earlier: SOHO/MDI systematically records smaller umbral areas, whereas its total area measurements tend to be larger compared to thsoe of SDO/HMI. In panel (f), which displays the 48 h averaged values, the small-area group (purple dots) shows nearly identical values for the two instruments. This likely reflects the smoothing effect of longer averaging, which reduces the influence of short-term discrepancies and measurement noise. The R 2 values further support these findings. With the exception of the large total areas in panels (e) and (f), the data do not exhibit perfect linear correlations. The notable scatter suggests that a universal correction factor cannot be reliably applied, as different sunspot groups may follow different patterns across instruments.
Similarly to the area analysis, we also examined the average number of sunspots identified over different time intervals. Figure 9 displays the results for 12 h (panel (a)), 24 h (panel (b)), and 48 h (panel (c)) averaging windows. Interestingly, the slope of the fitted regression lines increases with the length of the averaging interval. The slope for the 48 h case is closest to that observed in the 1-minute comparison shown in Figure 6. This outcome is somewhat counterintuitive, as one might expect the 12 h average to be more similar to the short-timescale result. The fact that longer intervals yield a better match suggests that averaging does not necessarily reduce discrepancies uniformly—it can suppress certain fluctuations while accentuating others. These findings highlight a critical issue: the apparent strength of correlations can be highly dependent on the chosen methodology. If not carefully considered, this can lead to misleading interpretations, particularly in studies comparing datasets with different temporal resolutions.
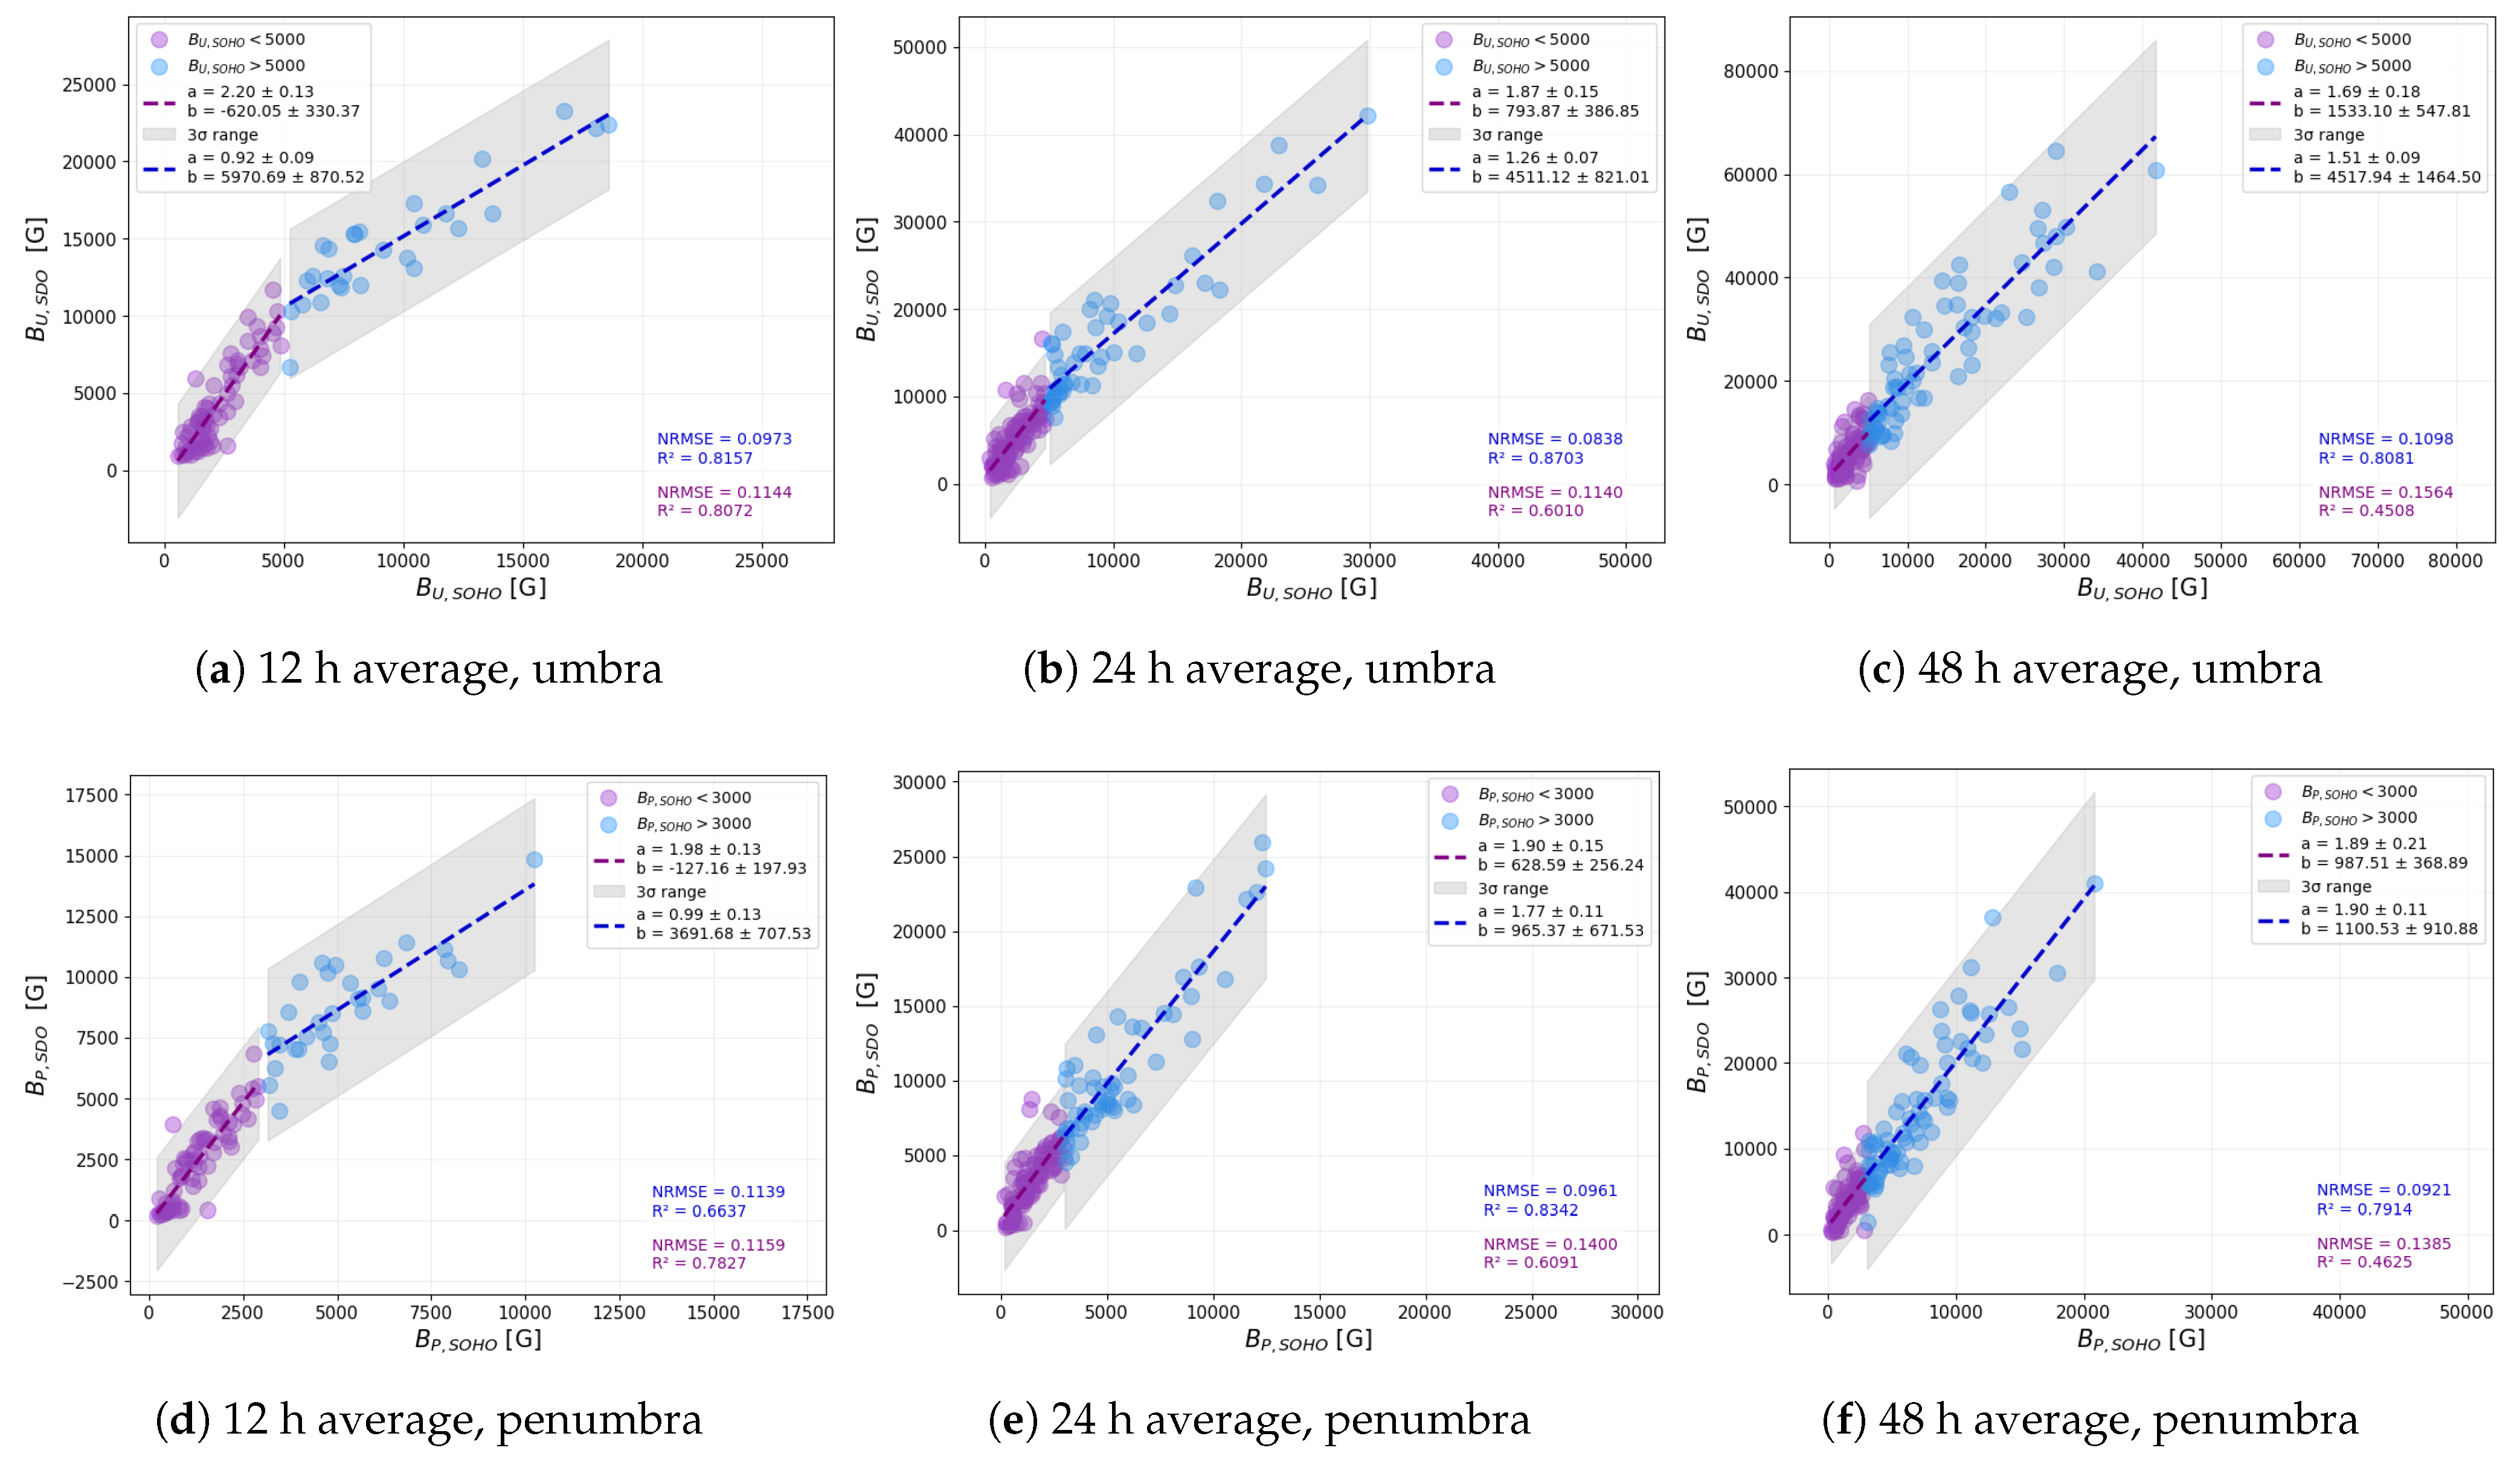
Figure 10 presents a comparison of the average magnetic field strength values recorded in the SOHO/MDI and SDO/HMI datasets, with the umbra shown in the top row and the penumbra in the bottom row. A clear correlation is visible in all panels, but a distinct break can be observed in the data’s distribution—most notably in the 12 h panels. This break appears as a deviation from a single linear trend and reflects the fact that the data are split into two regimes: one for lower and one for higher magnetic field values. More specifically, this break occurs at approximately 5000 G in the umbral magnetic field strengths and around 3000 G in the penumbral magnetic field strengths. These thresholds are used to differentiate the data points, with purple dots representing smaller values (below the thresholds) and blue dots representing larger values (above the thresholds).
Interestingly, the break becomes less pronounced as the averaging interval increases. The smoothing effect of longer time intervals appears to reduce the variability and minimize discrepancies between the two datasets. However, even with this averaging, the fitted regression lines differ between small and large values, indicating again that no universal correction factor can be applied that would work equally well across the entire range of sunspot magnetic field strengths.
Given the pronounced break in magnetic field strength values observed in Figure 10, we conducted further analyses to identify its underlying causes. One of the possible factors we considered was the area of the sunspot groups, as this can influence the stability and morphology of magnetic structures and potentially affect measurements. In this part of the analysis, we focused specifically on the 12 h averaged data, as the discontinuity is most prominent at this temporal resolution. Figure 11 presents the 12 h averaged magnetic field strengths, where the data points are color-coded by the average area of the sunspot groups. The left panel corresponds to umbral regions, while the right panel shows the penumbral values. These plots are identical to panels (a) and (d) of Figure 10, except that here the color coding allows us to visually assess the influence of sunspot group area on the observed discontinuity. In our analysis, we applied an area threshold of 20 msh for umbrae and 80 msh for penumbrae to separate the small and large sunspot groups, which were based on the 100 msh threshold for total area that was used as an initial reference point. In the case of the umbral field strengths, we observed a slight change in the slope of the fitted regression lines between the two categories, suggesting that larger sunspots may exhibit somewhat different scaling between MDI and HMI measurements. However, this difference is not sufficiently large to account for the break observed in the overall distribution. For the penumbrae, the difference between small and large groups is even less pronounced, with both populations following a nearly identical trend. These findings suggest that the sunspot group area, while contributing slightly to the scatter and possibly to the slope in specific regimes, is not the primary factor responsible for the observed discontinuity in the magnetic field strength correlations.
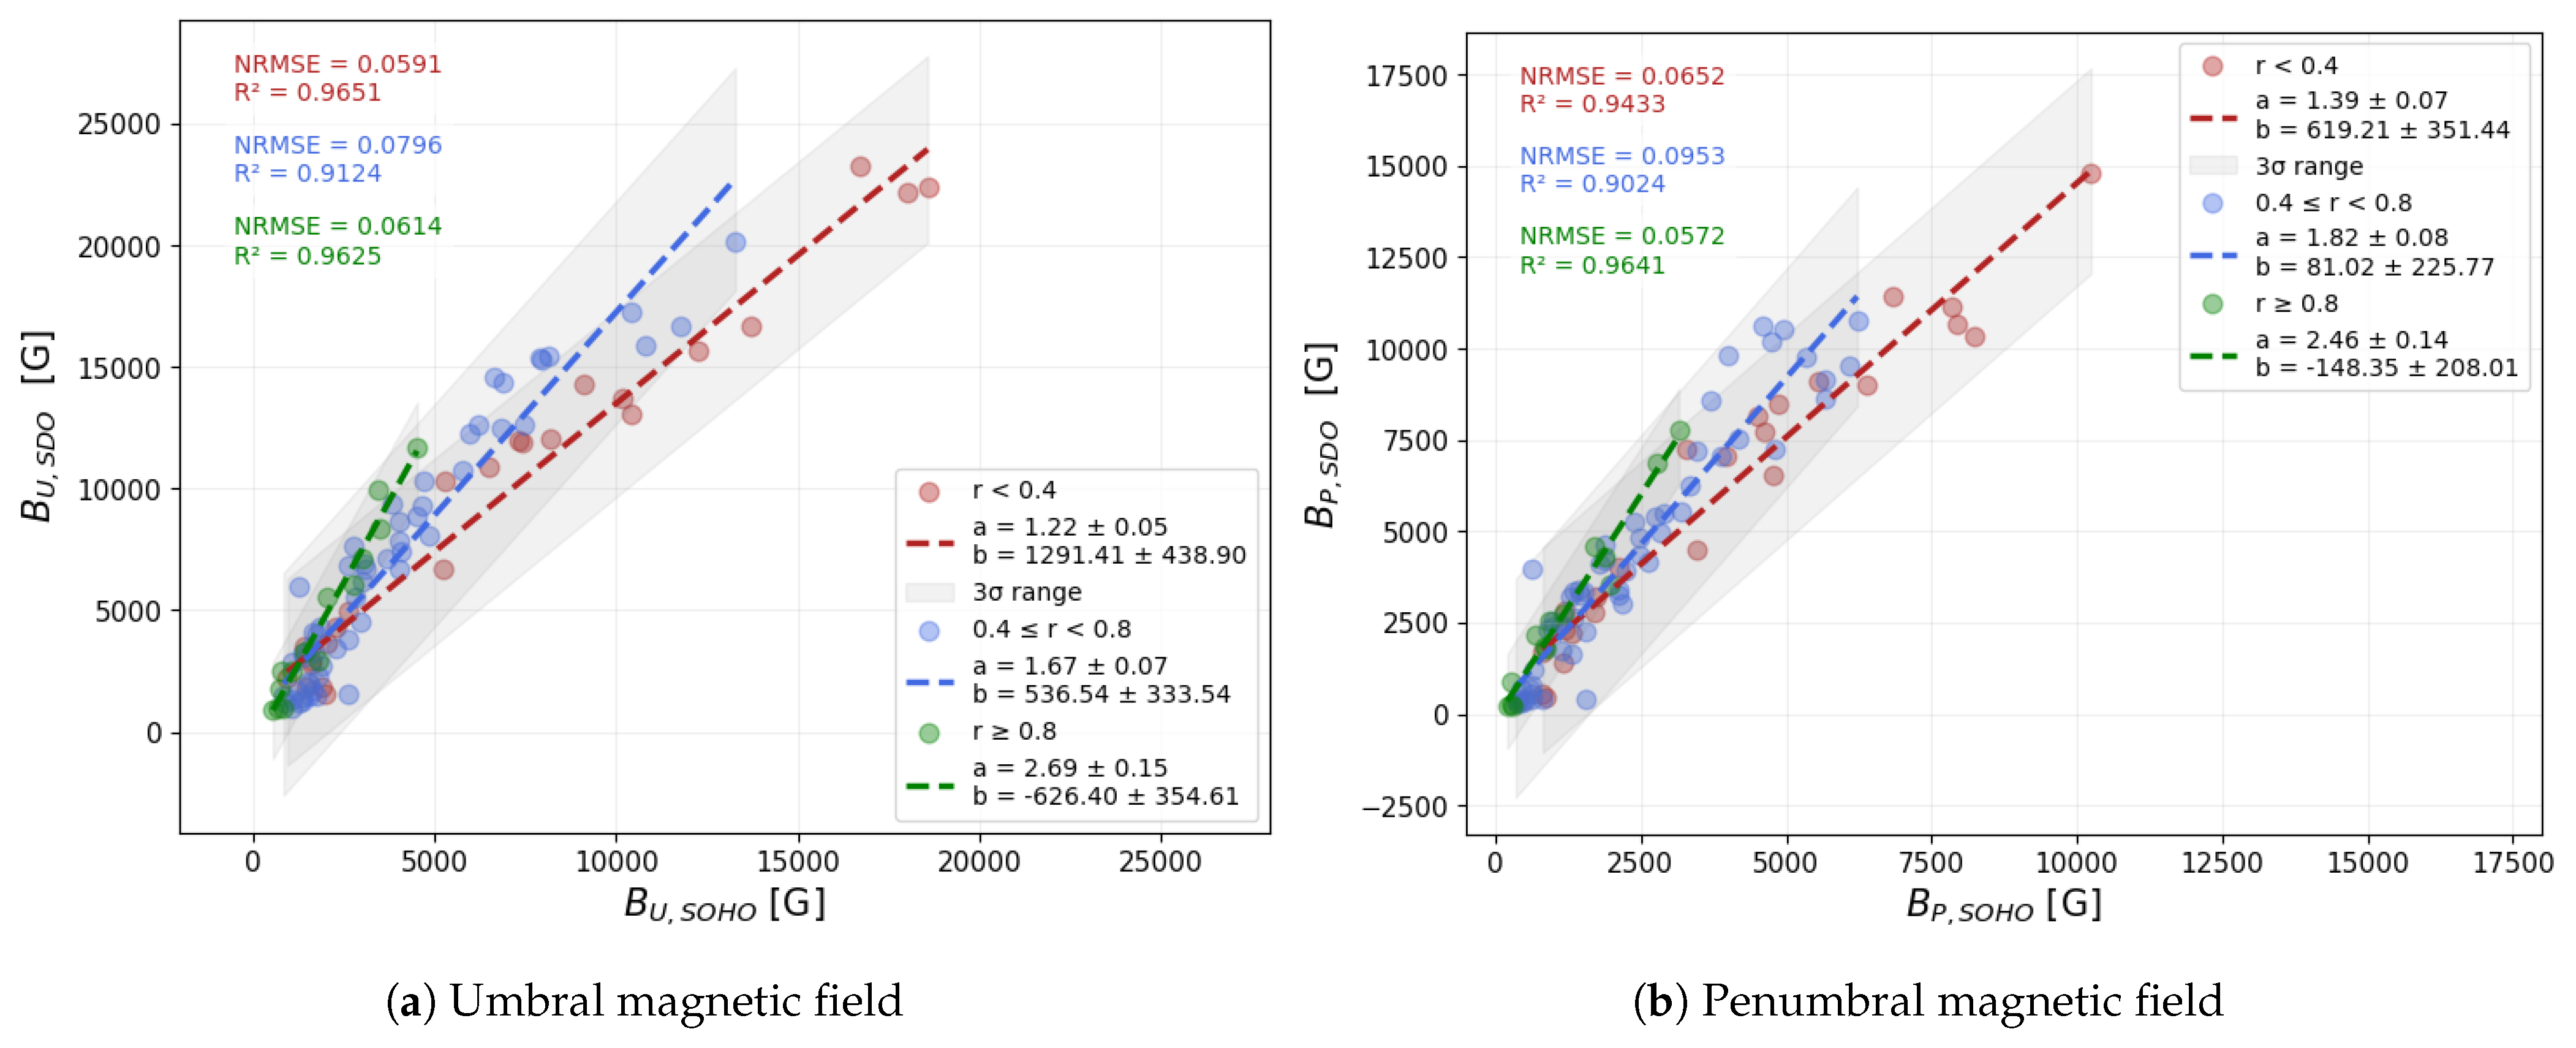
To further explore the source of the observed discontinuity in the magnetic field strength comparisons, we examined whether the position of the sunspot groups on the solar disk influences the measurements. Due to projection effects and variations in line-of-sight geometry, sunspot groups located closer to the solar limb are more likely to exhibit systematic differences in their measured magnetic field strength values. Figure 12 shows the umbral and penumbral magnetic field strength values. These plots are identical to panels (a) and (d) of Figure 10, except that here we colored the data points according to the radial position of the sunspot groups on the solar disc. We divided the sunspots into three distance-based categories: (1) those within 0.4 R (red), (2) those between 0.4 and 0.8 R (blue), and (3) those beyond 0.8 R (green). The fitted lines indicate a clear trend: the slope increases with increasing distance from the center of the disc. This pattern holds for both umbral and penumbral fields, suggesting that the discrepancy between the SOHO/MDI and SDO/HMI magnetic field strength measurements is significantly affected by the sunspot groups’ position on the solar disc. In particular, sunspot groups closer to the limb show systematically larger differences between the instruments, which may be a key factor contributing to the observed discontinuity.
To further explore the observed discrepancies, we performed a detailed analysis of individual sunspot groups. For each group, we applied a linear regression to compare the averaged magnetic field strength values obtained from SOHO/MDI and SDO/HMI observations. While previous results clearly revealed that the systematic break in field strength values is primarily associated with the position of sunspot groups on the solar disc, the linear fits across the entire dataset exhibited significant scatter. To better understand the origin of this scatter and evaluate whether it stems from group-specific characteristics or measurement uncertainties, we investigated the distribution of the fit parameters across individual sunspot groups. By examining the regression slopes, intercepts, and associated statistical metrics separately for each group, we aimed to identify potential patterns or outliers that may remain hidden in the aggregated data and thus refine our understanding of the overall discrepancies in the instruments.
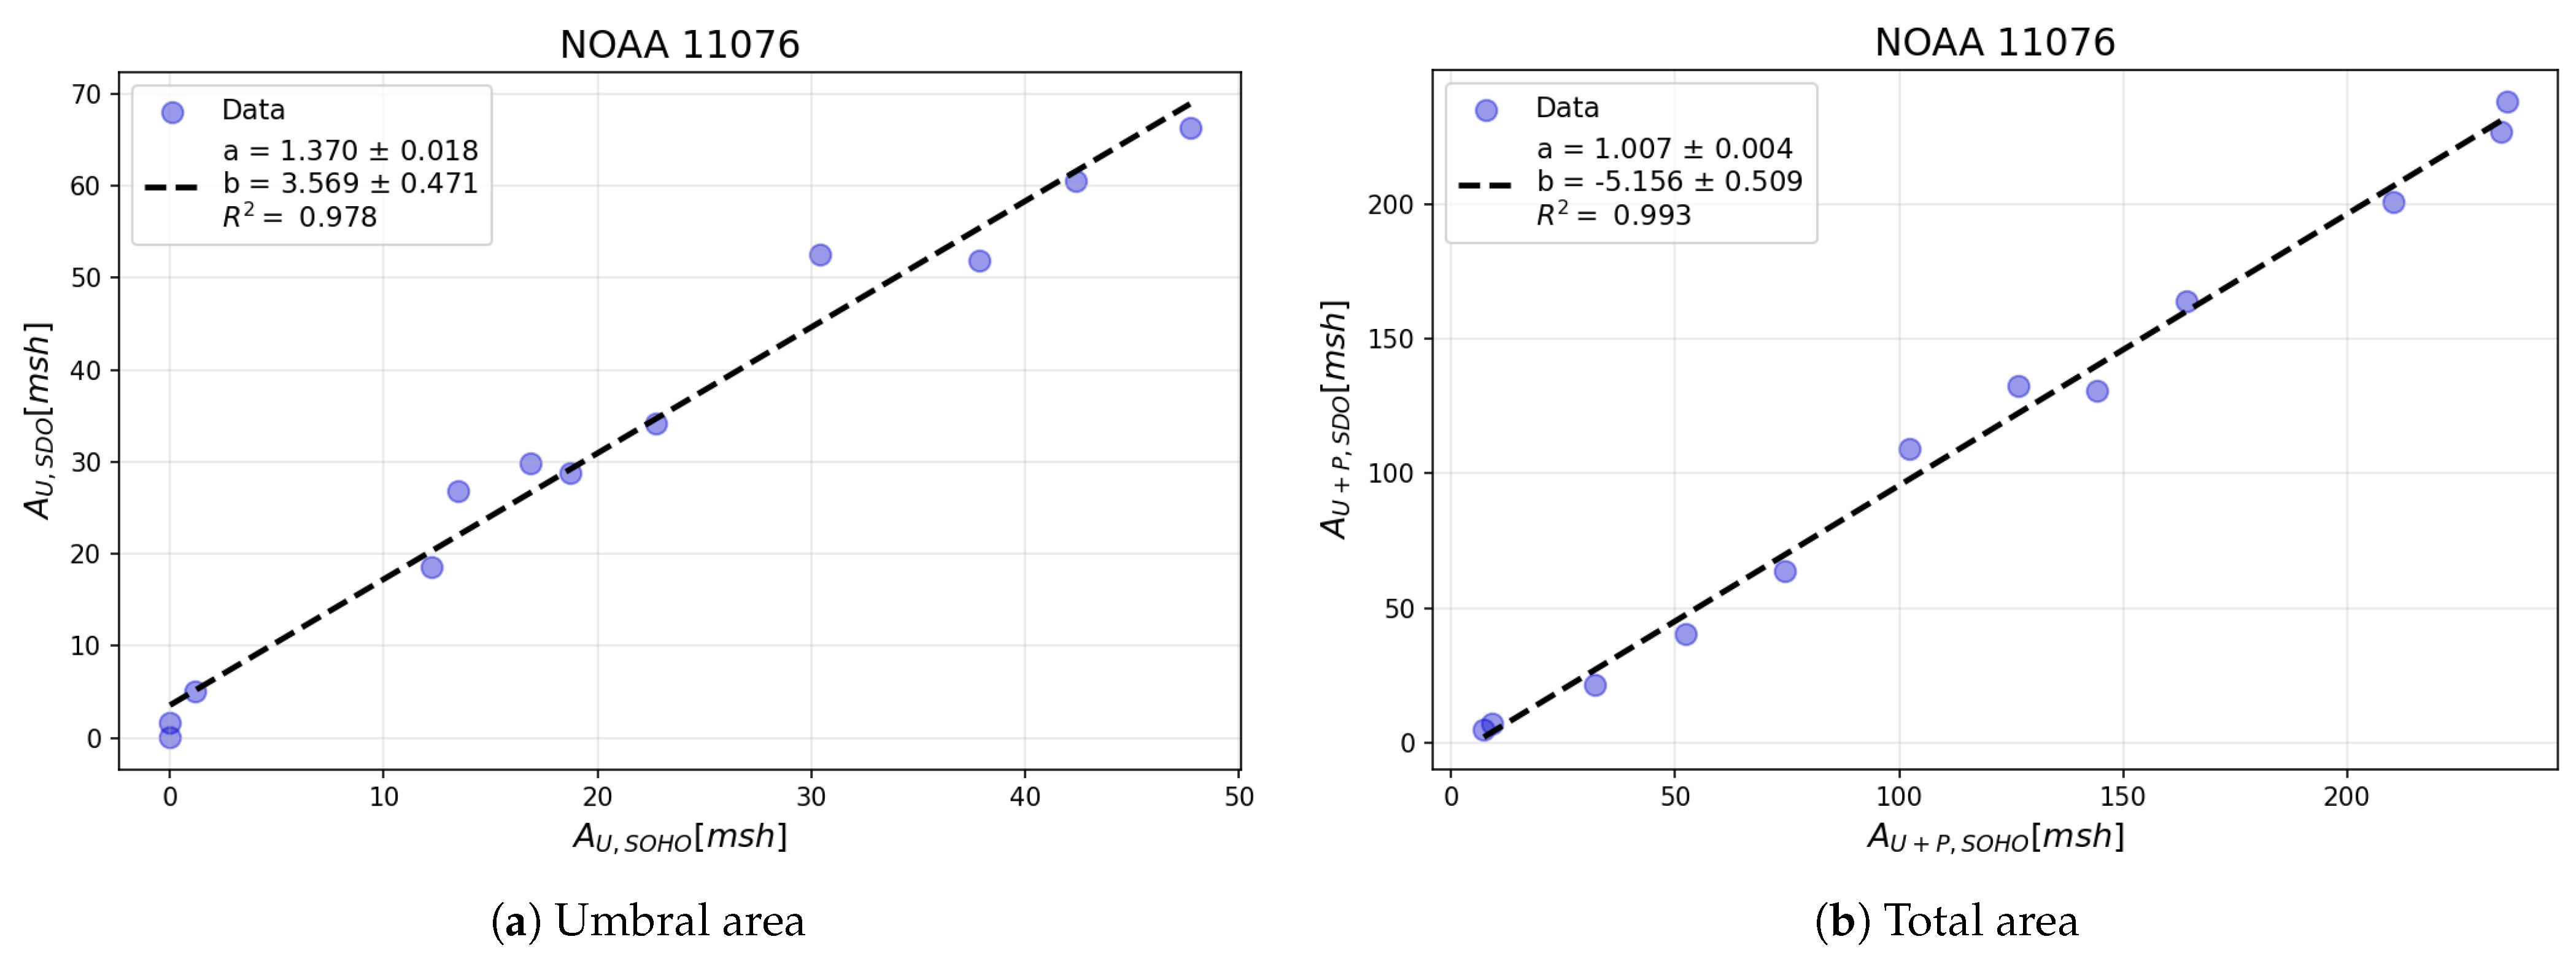
An illustrative example is shown in Figure 13, where the 12 h averaged SOHO/MDI values are plotted on the x-axis and the corresponding SDO/HMI values on the y-axis. The left-hand panel presents the results for umbral area, and the right-hand panel shows the results for the total area. Each blue dot represents an averaged data point, with the black dashed line indicating the linear fit. This procedure was repeated for all individual sunspot groups across each integrated time interval, allowing us to analyze the distribution of regression parameters and assess the variability in the results from different groups.
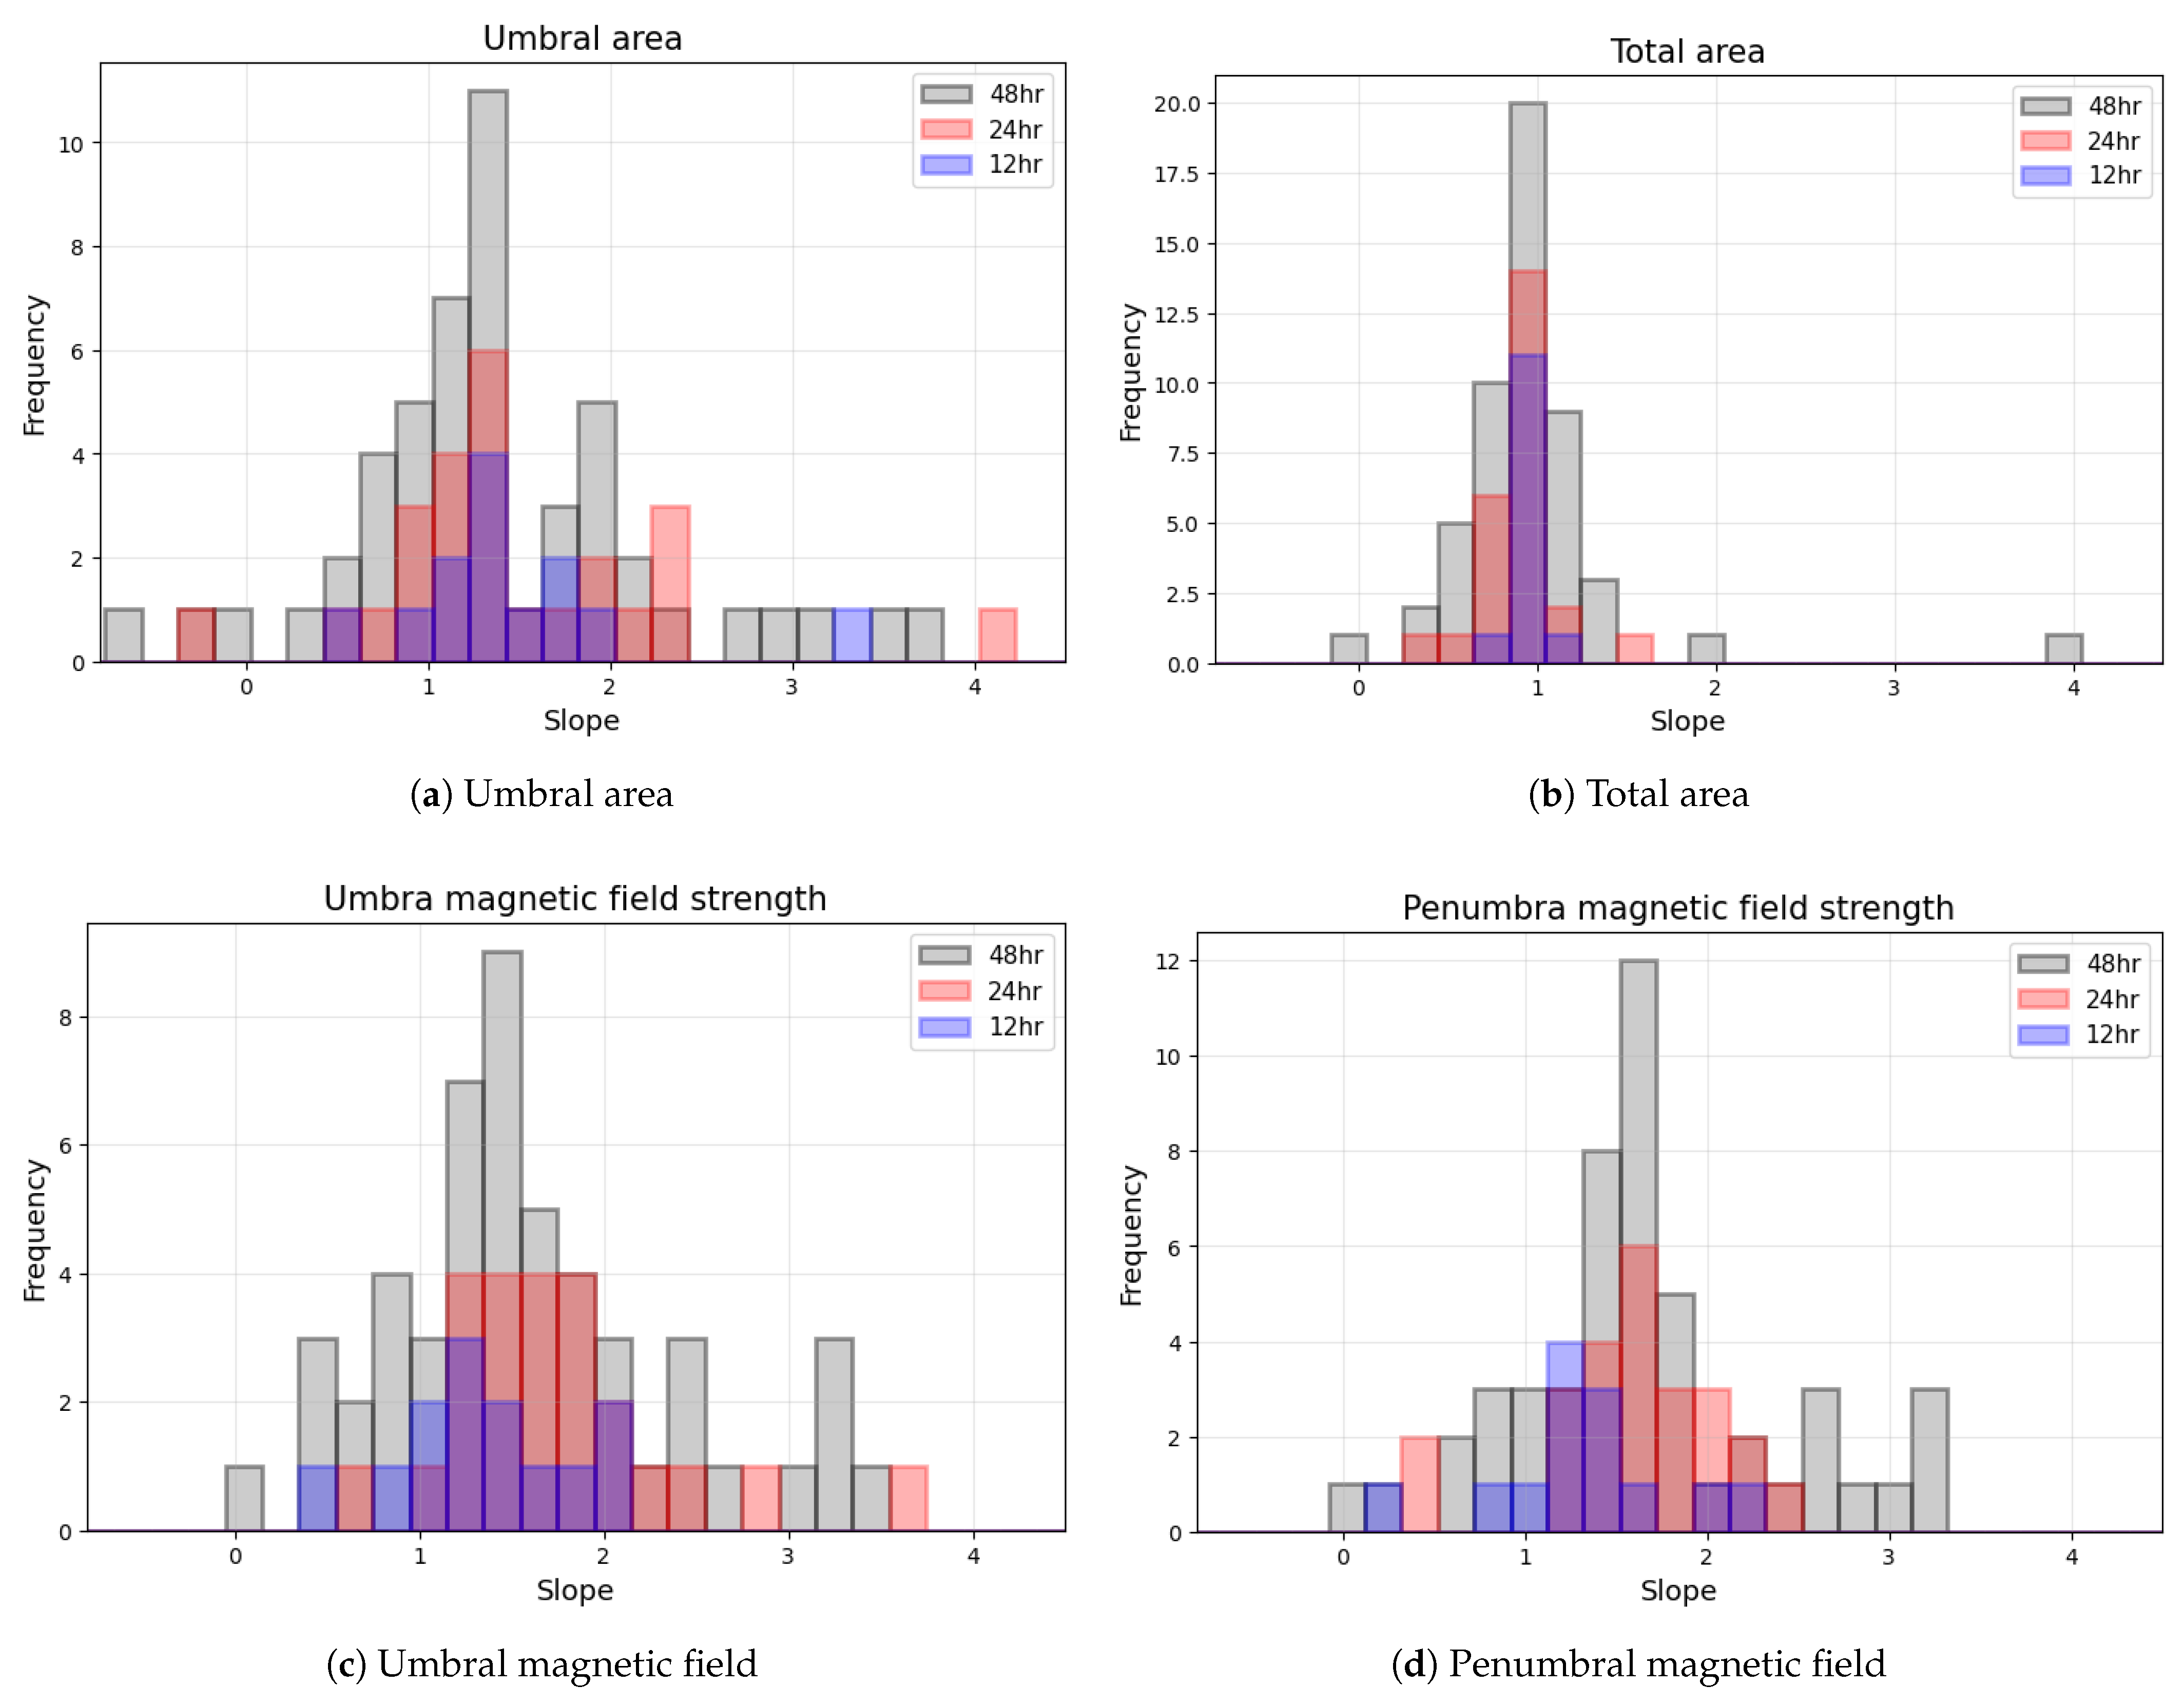
Next, we examined the distribution of slopes derived from both area-based and magnetic field strength-based fits. Figure 14 presents a combined view of these distributions, integrating the results from umbral and total area fits (panels (a) and (b)), as well as umbral and penumbral magnetic field strength fits (panels (c) and (d)). Slopes for the three averaging intervals are shown in different colors: blue for 12 h, red for 24 h, and gray for 48 h averages.
Across these histograms, several notable features emerge. First, the best agreement between instruments occurs for total sunspot area (panel (b)), which displays a sharp peak around a slope of 1.0, indicating that SOHO/MDI and SDO/HMI record very similar total areas on average. By contrast, the umbral areas’ distribution (panel (a)) shows a bimodal structure—which is most evident in the 48 h averages—with one higher peak near 1.2 and a second, lower peak around 2.0. This suggests that small and large umbral regions scale differently between the two instruments. In the case of magnetic field strengths, both umbral (panel (c)) and penumbral (panel (d)) slopes form broader, approximately Gaussian distributions, with each featuring a prominent peak in the 48 h data: around 1.4 for umbrae and 1.6 for penumbrae. Finally, although not shown here, the slope distribution for the number of identified sunspots likewise peaks near 1.4 and exhibits a similar broad scatter. Taken together, these results imply that while a rough multiplicative factor can align measurements from SOHO/MDI and SDO/HMI, the presence of outliers and the wide spread of slopes demonstrate the challenge in applying a single correction factor to all sunspot groups.

4.3. Comparison of Magnetic Field Strengths of Separated Polarities

To assess whether the agreement between SOHO/MDI and SDO/HMI varies with magnetic polarity, we divided the dataset into positive- and negative-polarity subsets and compared the simultaneously measured umbral and penumbral field strengths separately. The results are displayed in Figure 15, where the top row contains a comparison of positive-polarity umbral parts in panel (a), and negative-polarity umbral parts in panel (b), while the bottom row contains the same for penumbral magnetic field strengths. The negative-polarity magnetic field strengths are given as absolute values.
An interesting trend in the umbral magnetic field data is that within individual sunspot groups, the summed magnetic field strengths of positive-polarity umbrae are approximately twice as high as the summed absolute values of the negative-polarity umbrae. It is important to note that this summation refers to a direct sum of magnetic field strengths for all identified umbrae of a given polarity within a group, without weighting by sunspot area. In the case of penumbrae, this asymmetry is less pronounced, although the summed positive values still tend to exceed the negative ones.
This polarity imbalance in the distribution of measured field strengths may partially reflect or relate to the differences observed in the scatter of their HMI versus MDI comparisons. Specifically, based on the standard deviations of the differences between HMI and MDI magnetic field strengths, a modest asymmetry can be seen between the positive and negative polarities in the umbral regions: the standard deviation is approximately 14% higher for the negative polarities. In contrast, the penumbral values exhibit nearly identical scatter for both polarities. While this difference is not particularly large, it may point to subtle polarity-dependent effects in either the measurement process or from the underlying physical structures.
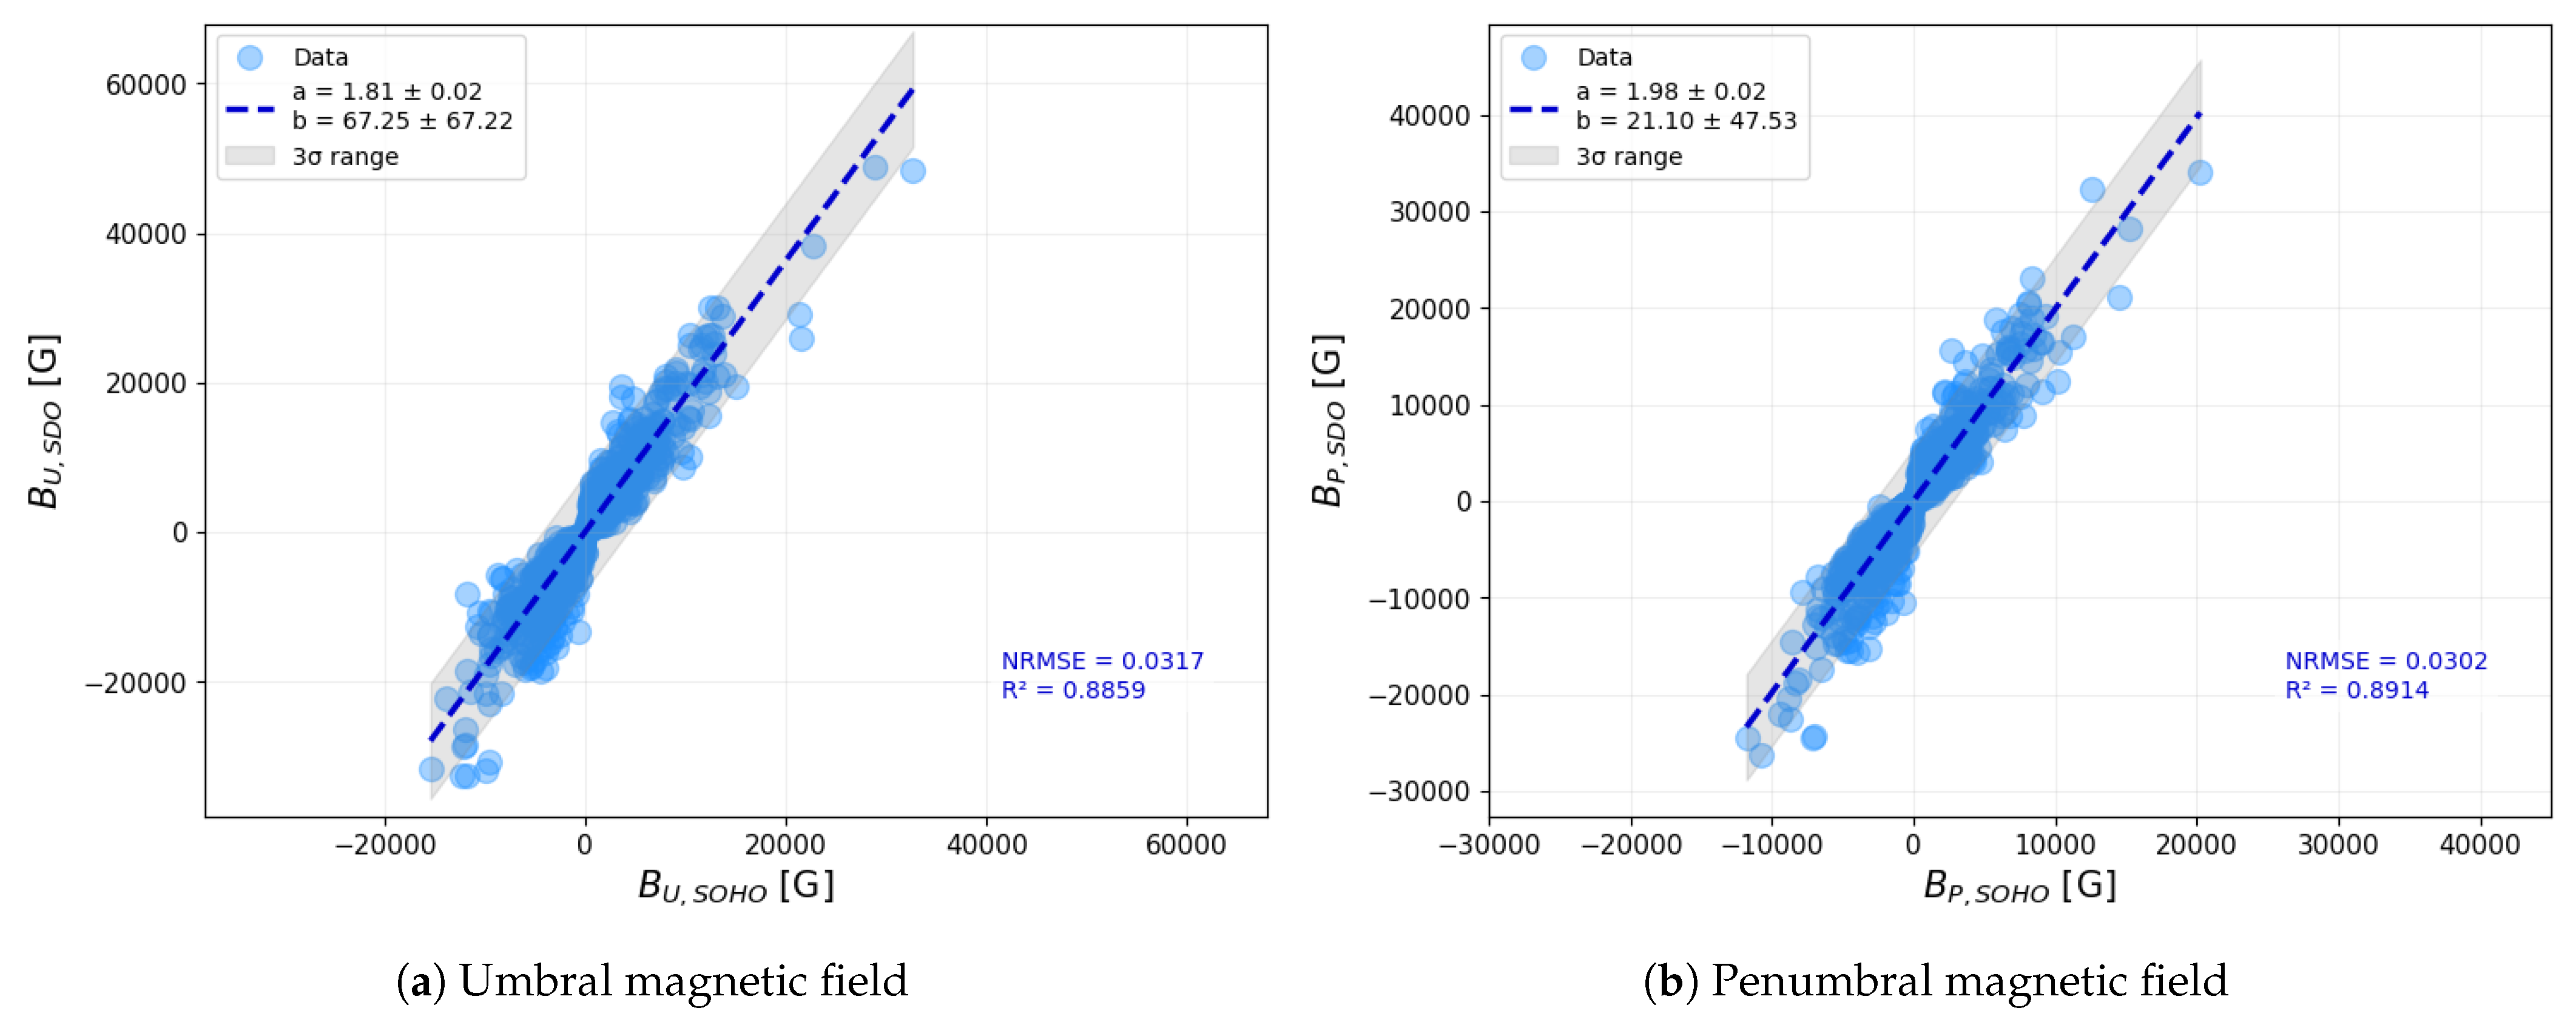
In a related study, Liu et al. (2012) [11] performed comparisons of magnetic field strengths across both polarities but did not analyze them separately. To provide a more direct comparison with their results, we also carried out an additional analysis where magnetic field values from both polarities were considered simultaneously, retaining their respective signs rather than taking absolute values. In this approach, positive- and negative-polarity measurements were combined into a single dataset, preserving the original polarity of each measurement. Linear fitting was then applied across the full range of signed data points. The outcome of this approach is shown in Figure 16, where umbral magnetic field values are presented in the left-hand-side panel, and penumbral values are shown on the right. The overall correlation structure seen here exhibits slight differences compared to the correlation obtained using unsigned values, as seen in Figure 7, providing additional insight into the asymmetry between the polarities.
This polarity-resolved analysis highlights the importance of considering magnetic field polarity explicitly in cross-calibration efforts and suggests that treating positive and negative polarities identically may obscure subtle but important systematic differences between the datasets.

5. Discussion and Conclusions

Long-term homogeneous sunspot records are indispensable for probing solar dynamics, assessing active-region evolution, and predicting solar activity and its terrestrial impacts. Merging observations from instruments with differing resolutions, sensitivities, and measurement techniques—such as SOHO/MDI and SDO/HMI—poses significant challenges that have been well documented (see Section 1 for details). Uniformly calibrating these datasets is essential to enhance statistical robustness, reveal subtle cycle-phase dependencies, and build a continuous record of solar activity. By harmonizing area, count, and magnetic field measurements, one can more reliably track active-region development and diagnose drivers of space weather.
In this study, we have carried out a detailed comparison of sunspot areas, numbers, and line-of-sight magnetic field strengths from the Debrecen-processed SOHO/MDI and SDO/HMI databases. Employing both near-simultaneous and time-averaged analyses, we quantified the scope and limits of simple linear corrections and demonstrated the importance of polarity- and position-specific calibration.
Our near-simultaneous comparison (within one minute) confirmed systematic offsets: SDO/HMI records larger umbral areas but smaller total (umbra plus penumbra) areas than SOHO/MDI, which identifies more individual sunspots and consistently measures magnetic fields as being stronger in both umbral and penumbral regions. Our analysis was extended to include averaged measurements over three temporal windows (12, 24, and 48 h). The general trends observed in the instantaneous comparisons were largely preserved in the averaged data. However, an unexpected non-linearity emerged in the magnetic field strength comparisons: we identified a distinct break-point at 3000 G for penumbrae and 5000 G for umbra, which was most pronounced in the 12 h averages. This analysis was based on summed (non-area-weighted) magnetic field strength values over entire sunspot groups, which can reach higher magnitudes than typical individual spot measurements due to the cumulative contribution of multiple sunspots (see Figure 10). This discontinuity weakened with increasing integration time. Further investigations revealed that this effect was primarily due to projection-related discrepancies, with larger differences observed for sunspot groups located near the solar limb compared to those near the disk center. Notably, we found no correlation between this break-point and sunspot areas, suggesting that the effect is geometric rather than size-dependent.
We have also explored the instrument-based differences at the level of individual sunspot groups. For each group, we performed a linear regression of SDO/HMI versus SOHO/MDI values and analyzed the distribution of the resulting slope parameters across all intervals. These fits confirmed the presence of substantial variability in the scaling between the two datasets. While the majority of slopes clustered around a central value, consistent with earlier global comparisons, the distributions showed a broad spread, indicating that a single universal correction factor is insufficient to harmonize these datasets. Instead, the relationship between the instruments appears to depend on the specific characteristics of each sunspot group, reaffirming the importance of group-by-group calibration in high-precision studies.
We extended our analysis by separating the magnetic field measurements according to their polarity. Specifically, we compared the magnetic field strengths of the positive- and negative-polarity regions independently for both umbra and penumbra. This polarity-resolved approach led to results consistent with our previous findings, particularly regarding the systematic differences observed between the two instruments. Additionally, to facilitate a comparison with previous studies such as Liu et al. (2012) [11], we also visualized all magnetic field measurements in a single figure, preserving their signs rather than taking absolute values. This approach also revealed trends similar to those observed in our earlier correlation analysis.
The results shown in Figure 15 reveal a persistent asymmetry between positive- and negative-polarity field measurements in both their mean values and their scatter: positive-polarity regions exhibit systematically higher average field strengths, whereas negative-polarity readings are more widely dispersed. One plausible interpretation is linked to the fragmentation of sunspot groups during their evolution. When a group breaks apart into many small fragments, the sum of their individual measured field strengths can exceed that of a more compact, fewer-spot configuration, even if their total magnetic flux is the same. This “fragmentation bias” would elevate the aggregate field strength in regions where numerous small spots prevail over a handful of larger ones. In principle, weighting each measurement by its associated spot area could mitigate this effect. However, incorporating area into the comparison between SOHO/MDI and SDO/HMI also adds uncertainty to the area measurements themselves—uncertainties that differ between the two instruments due to their distinct spatial resolutions and sensitivity thresholds. To preserve a purely instrument-to-instrument comparison, we have, therefore, refrained from area weighting in this study. A further contributing factor is the dominance of hemispheric polarity during the interval under study: on the northern hemisphere, negative polarity was the leading spot polarity, whereas on the southern hemisphere, positive polarity led. A simple count of sunspot groups during the examined period indicates that nearly twice as many appeared in the northern hemisphere (74) as those in the southern (42). Consequently, the smaller trailing fragments of the northern groups (with positive polarity) disproportionately dominate the sample, especially since these fragments are more numerous but individually smaller—and, thus, more prone to creating measurement differences between the instruments—than the relatively few larger leader spots. The combination of hemispheric emergence rates and instrument-dependent resolution effects can, therefore, explain much of the observed polarity asymmetry in our data. Taken together, these findings underscore that even polarity-resolved comparisons of SOHO/MDI and SDO/HMI measurements are subject to non-trivial biases arising from group fragmentation, hemispheric asymmetries, and instrument characteristics.
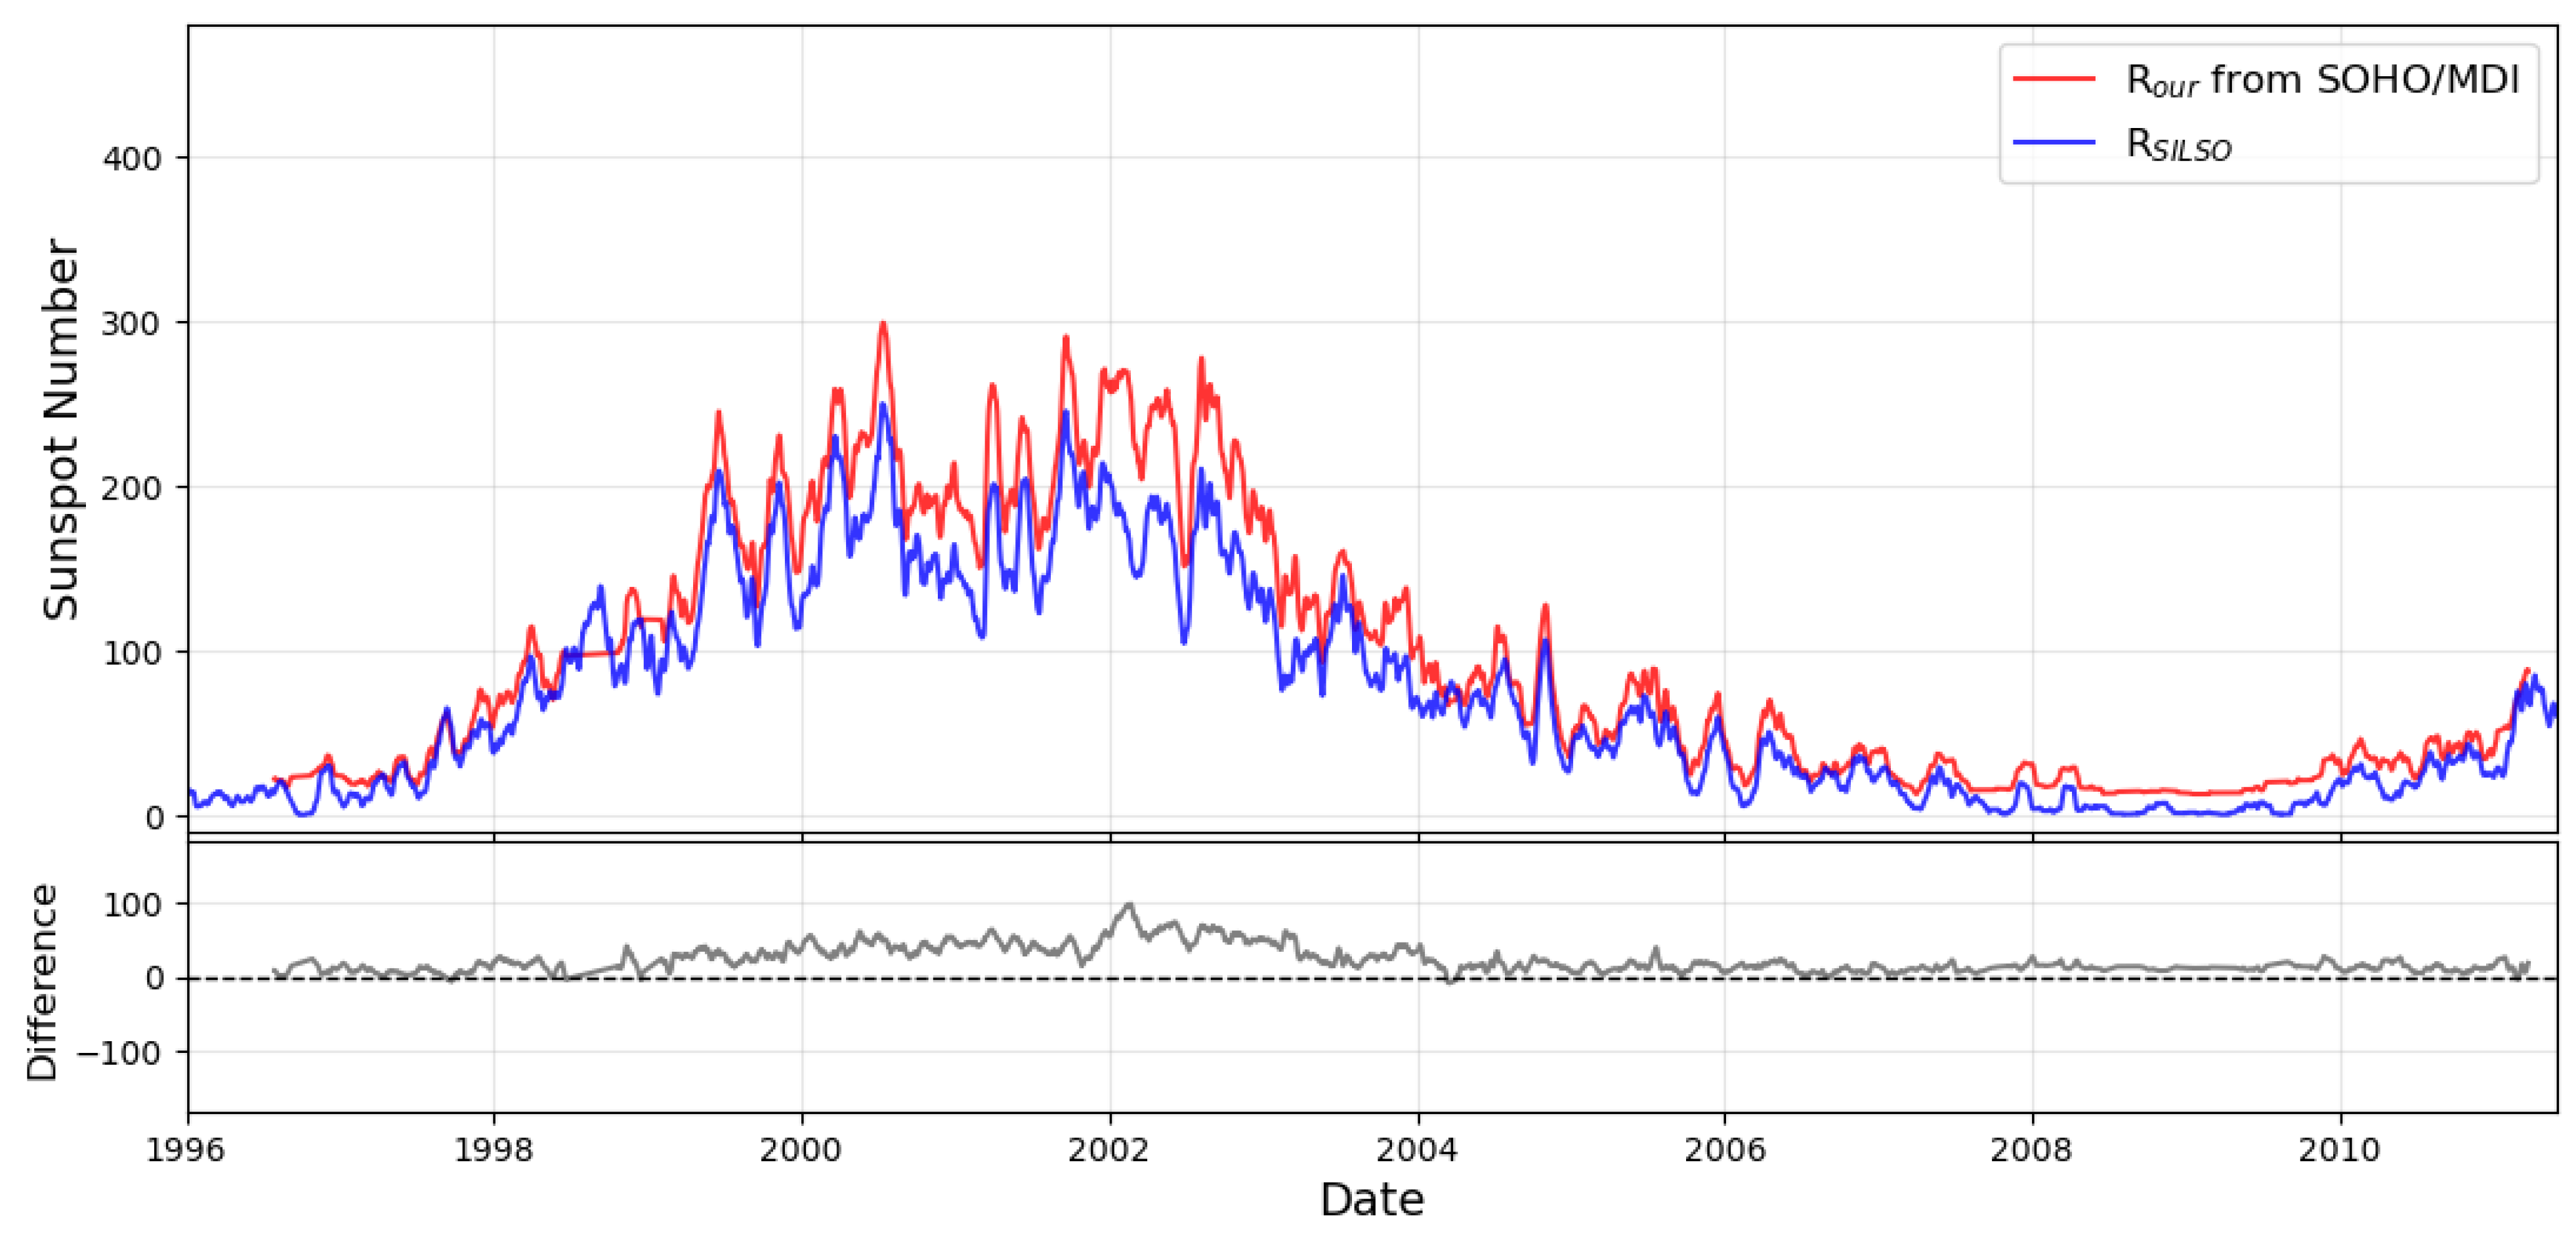
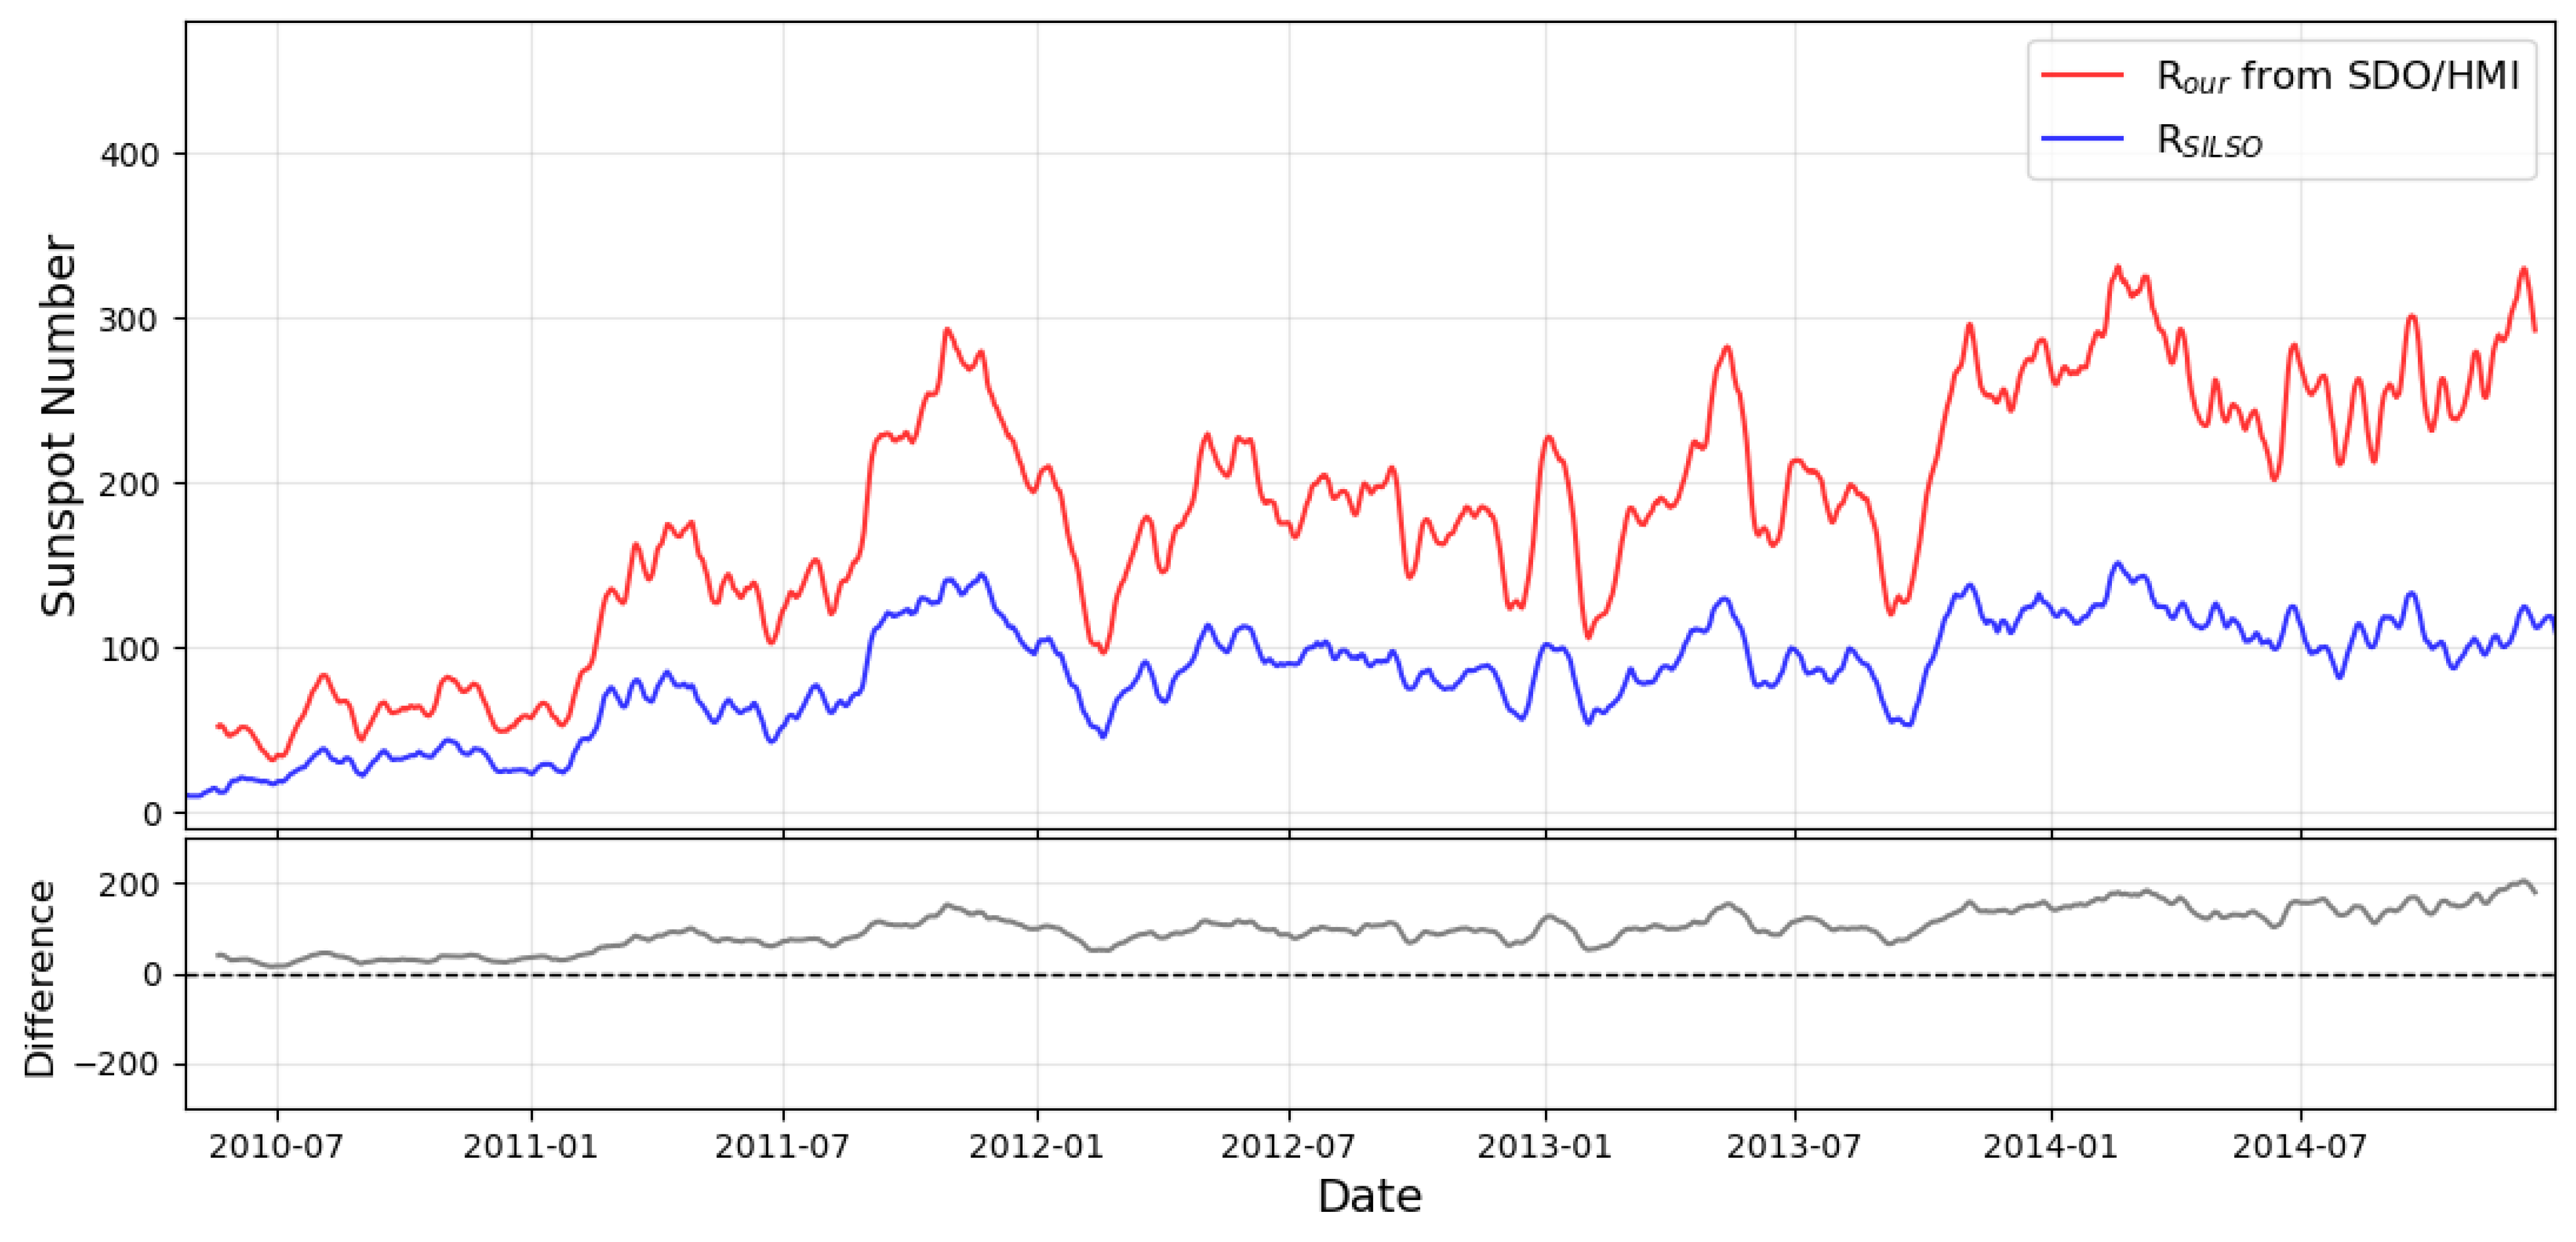
To further contextualize the characteristics and limitations of our sunspot detection approach, we constructed daily sunspot number estimates from both the SOHO/MDI and SDO/HMI datasets using the classical Wolf number formula, R = N s + 10 N g , where N s is the number of individual spots and N g the number of sunspot groups seen per day. These values were compared to the official daily total sunspot number published by SILSO.1 Our reconstructed sunspot numbers consistently exceed the SILSO values, particularly during solar maximum (see Figure 17 and Figure 18). This systematic overestimation reflects the higher number of small spots identified in our database—an effect especially pronounced in the SDO/HMI era, due to the instrument’s superior spatial resolution and sensitivity. This pattern is consistent with earlier findings by Lefèvre and Clette (2011) [33], who reported that the Debrecen catalog (DPD) tends to detect more small spots than other widely used datasets, such as USAF/NOAA or SOON, particularly during periods of elevated solar activity. These differences primarily stem from varying spot identification criteria, the resolution of the input data, and the degree of manual versus automated processing. Although our processing pipeline excludes individual sunspots with invalid area entries (e.g., negative values resulting from the merging of overlapping features), this filtering does not explain the observed discrepancy with the SILSO values. The number of such excluded spots is small and their contribution to the overall sunspot number is negligible. Importantly, even after removing these entries, our reconstructed sunspot numbers remain systematically higher than the official values. This confirms that the elevated R estimates are not artifacts of data cleaning, but are instead a direct consequence of the enhanced sensitivity of the detection method toward small sunspots. While this supports the internal consistency of our database, it also highlights a critical point: combining datasets with different detection thresholds and spatial resolutions requires careful calibration, particularly when interpreting long-term solar activity trends. We consider these issues of comparability and cross-validation vital topics for future investigation.
To place our database-driven findings in the broader context of the existing literature, we next compared our umbral area and magnetic field results with those reported by Győri (2012) [10], Liu et al. (2012) [11], and Suleymanova (2024) [12]. Our area comparison results align closely with those of Győri (2012) [10]. This strong, near-unity scaling confirms that despite the instruments’ differing resolutions, their umbral and total area measurements are highly consistent once appropriate linear corrections are applied. By contrast, our magnetic field comparisons diverge from the findings reported by Liu et al. (2012) [11] and Suleymanova (2024) [12]. Both of those studies concluded that calibrated MDI magnetograms yield higher magnetic-field-strength values than HMI (Liu et al. reported an MDI/HMI scaling of 1.40 across the disk, while Suleymanova found flux conversion coefficients of 1.46 centrally and 1.29 at other longitudes). In our group-level polarity-resolved analysis, based solely on catalogued database values without image processing, we observed the opposite: SDO/HMI registers systematically stronger fields than SOHO/MDI in both umbrae and penumbrae.
We attribute this inversion to differences in data processing rather than a physical effect. Most pixel-based magnetogram studies begin with raw images, applying custom alignments, noise filtering, and calibration before extracting active-region patches. In contrast, our analysis relies on precomputed sunspot group values from the Debrecen catalogs, which include each instrument’s proprietary algorithms, resolution thresholds, and noise suppression methods. Since we do not have access to these internal processing steps—such as the criteria for fragment detection, projection-angle corrections, or instrument-specific noise treatments—we cannot pinpoint or adjust their influence on our results. A full reconciliation of SOHO/MDI and SDO/HMI measurements would require reprocessing the original magnetograms through a single, unified pipeline, which lies outside the scope of this database-driven study.
Together, these findings emphasize the complexity of merging long-term datasets from different instruments. Although general trends can be identified, the variability across sunspot groups and measurement types underscores the need for nuanced, context-sensitive calibration methods.

Author Contributions

Conceptualization, B.G.-G., E.F.-D. and I.B.; methodology, B.G.-G. and E.F.-D.; software, B.G.-G. and E.F.-D.; validation, B.G.-G., E.F.-D. and I.B.; formal analysis, B.G.-G., E.F.-D. and I.B.; investigation, B.G.-G., E.F.-D. and I.B.; resources, B.G.-G., E.F.-D. and I.B.; data curation, B.G.-G. and E.F.-D.; writing—original draft preparation, B.G.-G. and E.F.-D.; writing—review and editing, B.G.-G., E.F.-D. and I.B.; visualization, B.G.-G.; supervision, E.F.-D. All authors have read and agreed to the published version of the manuscript.

Funding

B.G.-G. acknowledges the support of the EKÖP-24-3 University Excellence Scholarship Program of the Ministry for Culture and Innovation from the Source of the National Research, Development and Innovation Fund. This project has received funding from the HUN-REN Hungarian Research Network. E.F.-D. also received funding from the NKFIH excellence grant TKP2021-NKTA-64. I.B. thanks the Royal Society, International Exchanges Scheme, in collaboration with National Central University, Taiwan (IEC/R3/233017); Instituto de Astrofisica de Canarias, Spain (IES/R2/212183); and Institute for Astronomy, Astrophysics, Space Applications and Remote Sensing, National Observatory of Athens, Greece (IES/R1/221095), for the support provided. This research has also received financial support from the European Union’s Horizon 2020 research and innovation program under grant agreements No. 824135 (SOLARNET) and No. 955620 (SWATNet).

Data Availability Statement

The data supporting this article will be shared on reasonable request to the corresponding author(s).

Acknowledgments

The authors gratefully acknowledge all three anonymous reviewers for their insightful comments and constructive suggestions, which have significantly improved the clarity and overall quality of this manuscript.

Conflicts of Interest

The authors declare no conflicts of interest. The funders had no role in the design of the study; in the collection, analyses, or interpretation of data; in the writing of the manuscript; or in the decision to publish the results.

Appendix A

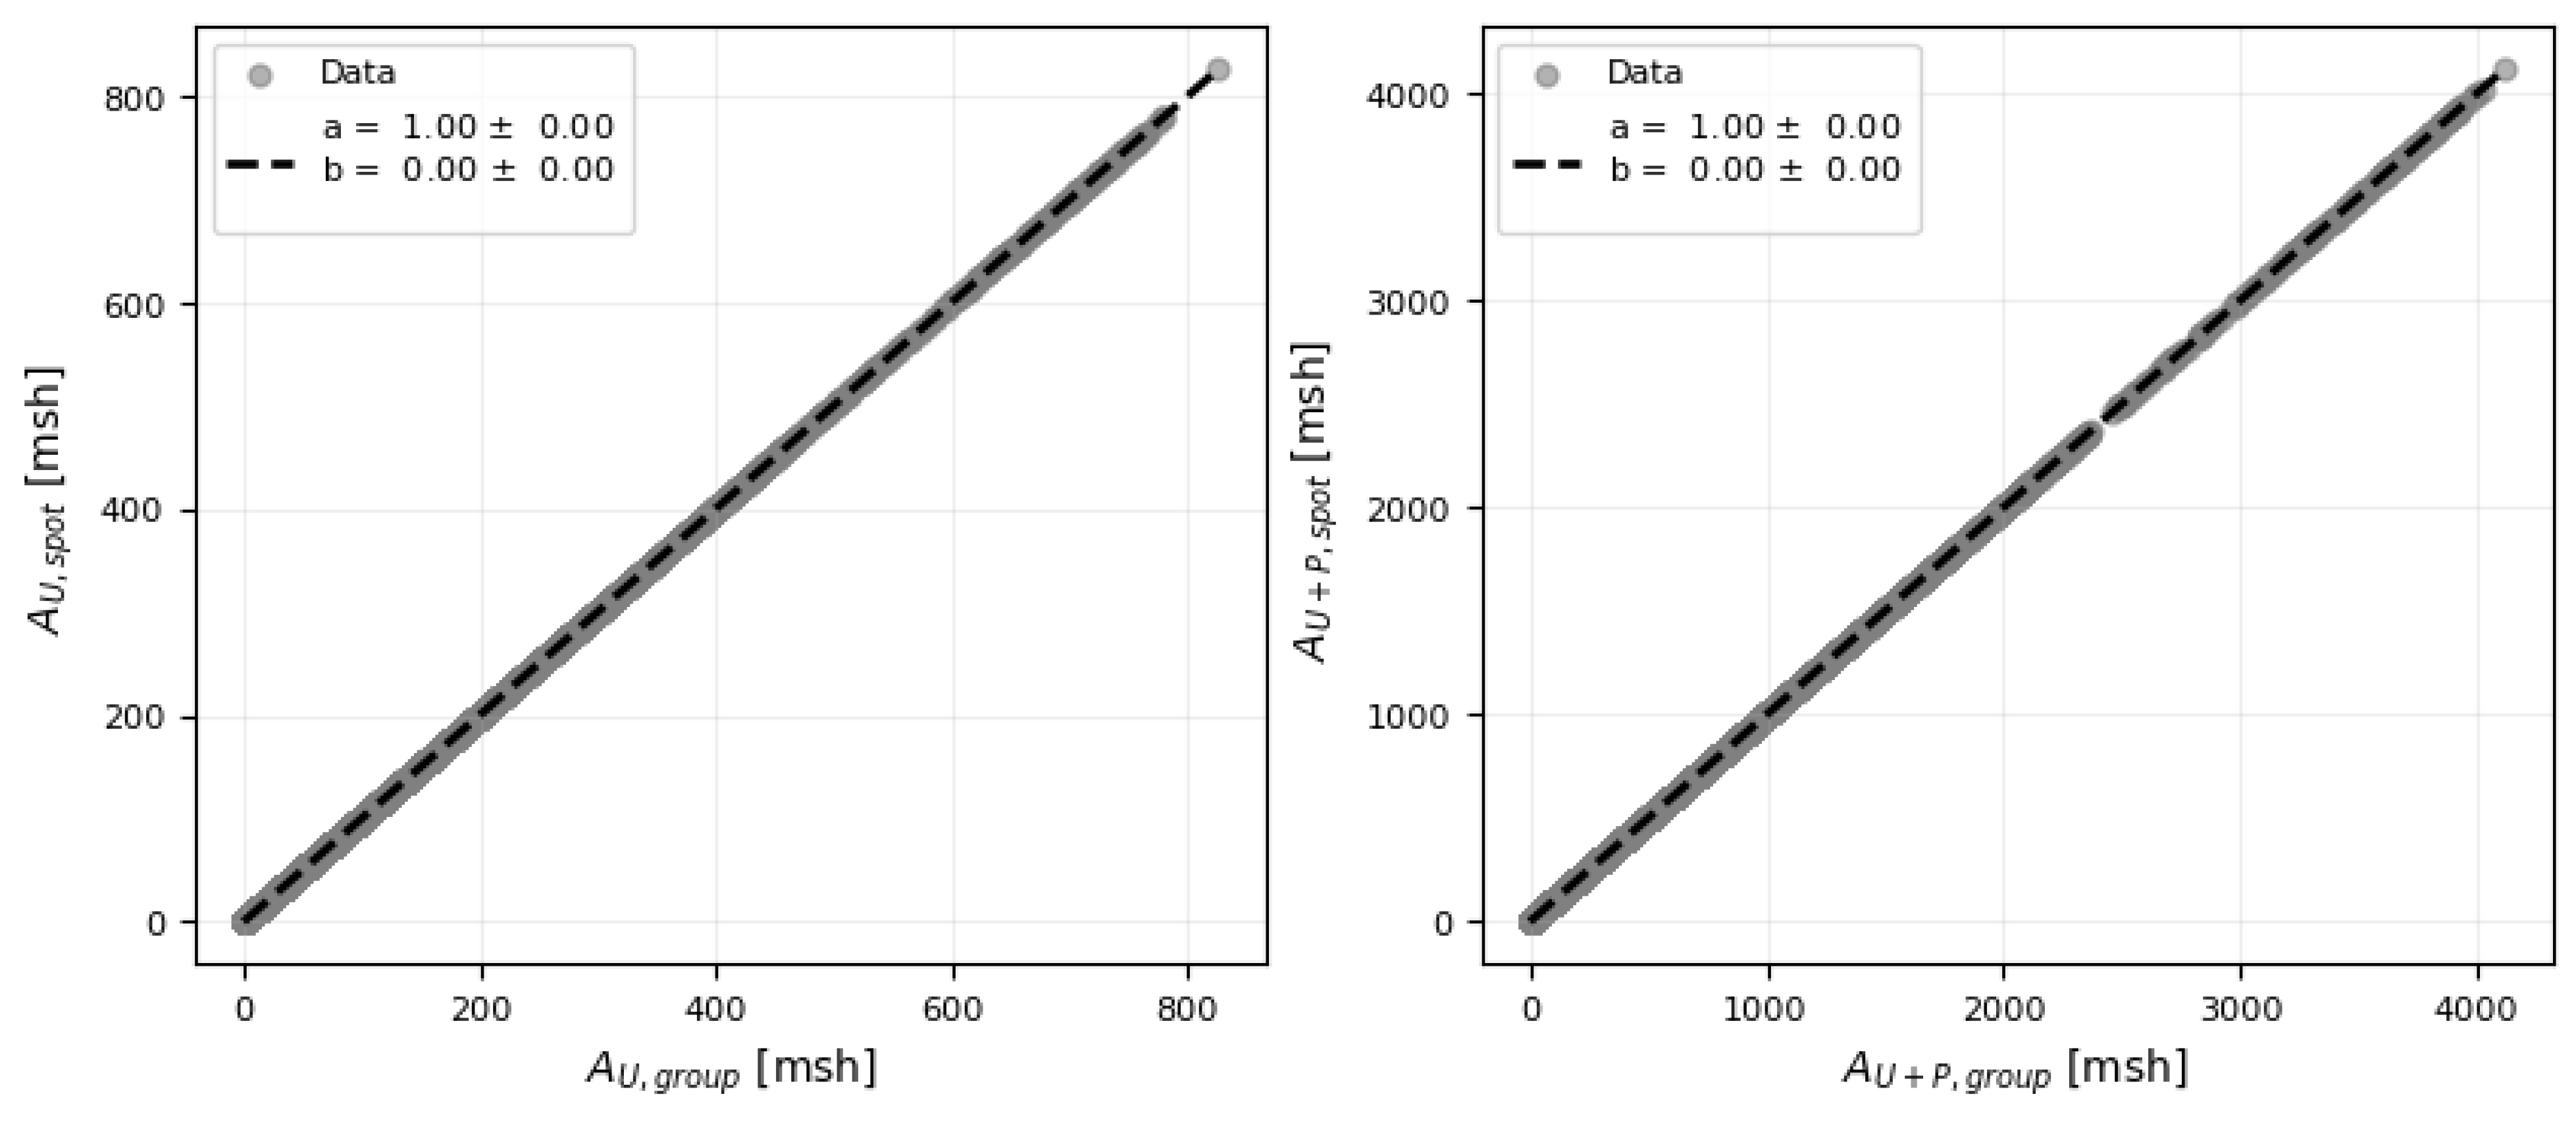
To validate our results and data processing methods, we examined whether the reported sunspot group areas were consistent with the total area obtained by summing the corresponding individual spot areas. During this verification, we identified inconsistencies in the SDO/HMIDD group dataset, where certain observational times and area values appeared duplicated in the database, complicating our direct comparison. The affected NOAA active regions were identified as 11,934, 11,935, 11,936, 11,937, 11,938, 11,939, 11,940, 11,941, 11,942, and 11,943. After excluding these regions from the analysis, we found full agreement between the group areas and the sum of the individual spot areas. The results of this comparison, which also include separate analyses for the SOHO/MDI and SDO/HMI datasets, are presented in Figure A1 and Figure A2, confirming that the group-level areas align with the summed areas of individual spots. Based on the good agreement between the group-level and summed sunspot areas, we can conclude that the group-level areas can be used directly for further analysis. However, as we already mentioned in Section 2.1, magnetic field strength data are only reliable for individual sunspots because sunspot group values are prone to significant processing errors.
Figure A1. Comparison of sunspot group areas (SOHO/MDI) with areas derived from individual sunspots. The left-hand panel shows the relationship for umbral areas, and the right-hand panel presents the relationship for total sunspot group areas (umbra plus penumbra). The fitted linear regression is shown as a dashed black line, with the fit parameters and their uncertainties displayed in the top-left corner.
Universe 11 00176 g0a1
Figure A2. Same as in Figure A1, but for SDO/HMI data.
Universe 11 00176 g0a2

Note

1
https://sidc.be/SILSO/infosndtot Accessed on 30 May 2025.

References

  1. Schwabe, H. Sonnen-Beobachtungen im Jahre 1843. In Proceedings of the Some Aspects of the Earlier History of Solar-Terrestrial Physics; Schröder, W., Ed.; Astronomische Nachrichten: Hoboken, NJ, USA, 1844; p. 124. [Google Scholar]
  2. Hale, G.E. On the Probable Existence of a Magnetic Field in Sun-Spots. Astrophys. J. 1908, 28, 315. [Google Scholar] [CrossRef]
  3. Howard, R. Eight Decades of Solar Research at Mount-Wilson. Sol. Phys. 1985, 100, 171. [Google Scholar] [CrossRef]
  4. SILSO World Data Center. The International Sunspot Number. International Sunspot Number Monthly Bulletin and Online Catalogue 1749–2024. Available online: https://www.sidc.be/SILSO/home (accessed on 30 May 2025).
  5. Clette, F.; Svalgaard, L.; Vaquero, J.M.; Cliver, E.W. Revisiting the Sunspot Number. A 400-Year Perspective on the Solar Cycle. Space Sci. Rev. 2014, 186, 35–103. [Google Scholar] [CrossRef]
  6. Zwaan, C. On the Appearance of Magnetic Flux in the Solar Photosphere. Sol. Phys. 1978, 60, 213–240. [Google Scholar] [CrossRef]
  7. Spiegel, E.A.; Weiss, N.O. Magnetic activity and variations in solar luminosity. Nature 1980, 287, 616–617. [Google Scholar] [CrossRef]
  8. Albidah, A.B.; Fedun, V.; Aldhafeeri, A.A.; Ballai, I.; Brevis, W.; Jess, D.B.; Higham, J.; Stangalini, M.; Silva, S.S.A.; Verth, G. Magnetohydrodynamic Wave Mode Identification in Circular and Elliptical Sunspot Umbrae: Evidence for High-order Modes. Astrophys. J. 2022, 927, 201. [Google Scholar] [CrossRef]
  9. Ballai, I.; Asiri, F.; Fedun, V.; Verth, G.; Forgács-Dajka, E.; Albidah, A.B. Slow Body MHD Waves in Inhomogeneous Photospheric Waveguides. Universe 2024, 10, 334. [Google Scholar] [CrossRef]
  10. Gyori, L. Study of Differences Between Sunspot and White Light Facular Area Data Determined from SDO/HMI and SOHO/MDI Observations. Sol. Phys. 2012, 280, 365–378. [Google Scholar] [CrossRef]
  11. Liu, Y.; Hoeksema, J.T.; Scherrer, P.H.; Schou, J.; Couvidat, S.; Bush, R.I.; Duvall, T.L.; Hayashi, K.; Sun, X.; Zhao, X. Comparison of Line-of-Sight Magnetograms Taken by the Solar Dynamics Observatory/Helioseismic and Magnetic Imager and Solar and Heliospheric Observatory/Michelson Doppler Imager. Sol. Phys. 2012, 279, 295–316. [Google Scholar] [CrossRef]
  12. Suleymanova, R. Comparison of the magnetic fields in solar active regions derived with different instruments. Acta Astrophys. Taurica 2024, 5, 1–5. [Google Scholar]
  13. Riley, P.; Ben-Nun, M.; Linker, J.A.; Mikic, Z.; Svalgaard, L.; Harvey, J.; Bertello, L.; Hoeksema, T.; Liu, Y.; Ulrich, R. A Multi-Observatory Inter-Comparison of Line-of-Sight Synoptic Solar Magnetograms. Sol. Phys. 2014, 289, 769–792. [Google Scholar] [CrossRef]
  14. Luo, Y.; Jiang, J.; Wang, R. The Sun’s Magnetic Power Spectra over Two Solar Cycles. I. Calibration between SDO/HMI and SOHO/MDI Magnetograms. Astrophys. J. 2023, 954, 199. [Google Scholar] [CrossRef]
  15. Wang, R.; Jiang, J.; Luo, Y. Toward a Live Homogeneous Database of Solar Active Regions Based on SOHO/MDI and SDO/HMI Synoptic Magnetograms. I. Automatic Detection and Calibration. Astrophys. J. Suppl. Ser. 2023, 268, 55. [Google Scholar] [CrossRef]
  16. Wang, R.; Jiang, J.; Luo, Y. Toward a Live Homogeneous Database of Solar Active Regions Based on SOHO/MDI and SDO/HMI Synoptic Magnetograms. II. Parameters for Solar Cycle Variability. Astrophys. J. 2024, 971, 110. [Google Scholar] [CrossRef]
  17. Cameron, R.H.; Dasi-Espuig, M.; Jiang, J.; Işık, E.; Schmitt, D.; Schüssler, M. Limits to solar cycle predictability: Cross-equatorial flux plumes. Astron. Astrophys. 2013, 557, A141. [Google Scholar] [CrossRef]
  18. Petrovay, K.; Nagy, M.; Yeates, A.R. Towards an algebraic method of solar cycle prediction. I. Calculating the ultimate dipole contributions of individual active regions. J. Space Weather Space Clim. 2020, 10, 50. [Google Scholar] [CrossRef]
  19. Nagy, M.; Lemerle, A.; Labonville, F.; Petrovay, K.; Charbonneau, P. The Effect of “Rogue” Active Regions on the Solar Cycle. Sol. Phys. 2017, 292, 167. [Google Scholar] [CrossRef]
  20. Baranyi, T.; Gyori, L.; Ludmány, A. On-line Tools for Solar Data Compiled at the Debrecen Observatory and Their Extensions with the Greenwich Sunspot Data. Sol. Phys. 2016, 291, 3081–3102. [Google Scholar] [CrossRef]
  21. Gyori, L.; Ludmány, A.; Baranyi, T. Comparative analysis of Debrecen sunspot catalogues. Mon. Not. R. Astron. Soc. 2017, 465, 1259–1273. [Google Scholar] [CrossRef]
  22. Biermann, L. Der gegenwärtige Stand der Theorie konvektiver Sonnenmodelle. Vierteljahresschr. Der Astron. Ges. 1941, 76, 194–200. [Google Scholar]
  23. Solanki, S.K. Sunspots: An overview. Astron. Astrophys. Rev. 2003, 11, 153–286. [Google Scholar] [CrossRef]
  24. Sobotka, M. Solar activity II: Sunspots and pores. Astron. Nachrichten 2003, 324, 369–373. [Google Scholar] [CrossRef]
  25. van Driel-Gesztelyi, L.; Green, L.M. Evolution of Active Regions. Living Rev. Sol. Phys. 2015, 12, 1. [Google Scholar] [CrossRef]
  26. Hale, G.E.; Ellerman, F.; Nicholson, S.B.; Joy, A.H. The Magnetic Polarity of Sun-Spots. Astrophys. J. 1919, 49, 153. [Google Scholar] [CrossRef]
  27. Künzel, H. Die Flare-Häufigkeit in Fleckengruppen unterschiedlicher Klasse und magnetischer Struktur. Astron. Nachrichten 1960, 285, 271. [Google Scholar] [CrossRef]
  28. Scherrer, P.H.; Bogart, R.S.; Bush, R.I.; Hoeksema, J.T.; Kosovichev, A.G.; Schou, J.; Rosenberg, W.; Springer, L.; Tarbell, T.D.; Title, A.; et al. The Solar Oscillations Investigation - Michelson Doppler Imager. Sol. Phys. 1995, 162, 129–188. [Google Scholar] [CrossRef]
  29. Norton, A.A.; Graham, J.P.; Ulrich, R.K.; Schou, J.; Tomczyk, S.; Liu, Y.; Lites, B.W.; Ariste, A.L.; Bush, R.I.; Socas-Navarro, H.; et al. Spectral Line Selection for HMI: A Comparison of Fe I 6173 Å and Ni I 6768 Å. Sol. Phys. 2006, 239, 69–91. [Google Scholar] [CrossRef]
  30. Livingston, W.; Harvey, J.W.; Malanushenko, O.V.; Webster, L. Sunspots with the Strongest Magnetic Fields. Sol. Phys. 2006, 239, 41–68. [Google Scholar] [CrossRef]
  31. Forgács-Dajka, E.; Dobos, L.; Ballai, I. Time-dependent properties of sunspot groups. I. Lifetime and asymmetric evolution. Astron. Astrophys. 2021, 653, A50. [Google Scholar] [CrossRef]
  32. Tlatov, A.G.; Pevtsov, A.A. Bimodal Distribution of Magnetic Fields and Areas of Sunspots. Sol. Phys. 2014, 289, 1143–1152. [Google Scholar] [CrossRef]
  33. Lefèvre, L.; Clette, F. A global small sunspot deficit at the base of the index anomalies of solar cycle 23. Astron. Astrophys. Astron. Astrophys. 2011, 536, L11. [Google Scholar] [CrossRef]
Figure 1. Example entry from the SOHO/MDI–Debrecen Sunspot Data (SDD) catalog for sunspot group NOAA 8040. Individual sunspots and their associated properties are listed, as described in the main text. This example demonstrates the proper merging of closely spaced sunspots (e.g., spots 1–4), where the combined area is assigned to spot 1, indicated by the correction code “ 1 ” in the “Corr. WS” column. The consistency of their umbral polarities, as shown in the “MU” (magnetic field strength) column, supports the validity of the merging process.
Universe 11 00176 g001
Figure 2. Similarly to Figure 1, this figure contains a catalog entry for sunspot group NOAA 8040, but from a different observational time. Although 19 sunspots are present, only 14 rows are shown due to space constraints. This example demonstrates an incorrect merging of spots 9–12: the “MU” (magnetic field strength) column reveals inconsistent umbral polarities, with spot 10 showing negative polarity while the others are positive, indicating a possible merging error.
Universe 11 00176 g002
Figure 3. Temporal evolution of the measured umbral area (panel (a)) and total sunspot group area (panel (b)) of NOAA 11069. SOHO/MDI measurements are shown as red dots and SDO/HMI data as blue stars. The gray shaded region marks the interval for which there are overlapping observations. Dark-colored symbols denote measurements taken within 0.9 solar radii of the disk center, while lighter symbols indicate data acquired closer to the limb.
Universe 11 00176 g003
Figure 4. The polarity-separated area measurements of NOAA 11460. Blue and red markers denote the negative- and positive-polarity components, respectively. Darker symbols correspond to observations within r < 0.9 , while lighter symbols indicate measurements taken closer to the limb ( r > 0.9 ). Panel (a) shows the result without correcting for misclassified sunspots, leading to significant outliers. Panel (b) displays the improved separation seen after removing affected entries, leading to a more consistent polarity distribution.
Universe 11 00176 g004
Figure 5. The correlation of umbral areas (panel (a)) and total sunspot areas (umbra plus penumbra; panel (b)) between SOHO/MDI and SDO/HMI measurements. In both panels, SOHO/MDI values are plotted along the x-axis and SDO/HMI values along the y-axis. Data points are color-coded by magnitude: purple for smaller areas, blue for larger ones. Separate linear fits are shown for each subset, with dashed lines in their corresponding colors. The slopes (parameters ‘a’) and intercepts (parameters ‘b’) of the fitted lines, along with their uncertainties, are displayed in the top-left corner of each panel. The gray shaded region indicates the 3 σ confidence interval around the fits, where σ is the standard deviation of the data points. Normalized Root Mean Squared Error (NRMSE) and coefficient of determination ( R 2 ) values are provided in the bottom-right corner, color-coded according to their respective regression line.
Universe 11 00176 g005
Figure 6. Same as in Figure 5, but here we show the correlation between the number of sunspots identified by SOHO/MDI ( N S O H O ) and SDO/HMI ( N S D O ). All data points are marked in blue.
Universe 11 00176 g006
Figure 7. Same as in Figure 5, but for the magnetic field strengths measured in the umbra (panel (a)) and penumbra (panel (b)).
Universe 11 00176 g007
Figure 8. Comparison of average umbral areas (top row) and total sunspot group areas (bottom row) between SOHO/MDI and SDO/HMI, computed over different temporal averaging intervals: 12 h (panels (a,d)), 24 h (panels (b,e)), and 48 h (panels (c,f)). Visual encoding, linear fits, and diagnostic metrics follow the same conventions as in Figure 5.
Universe 11 00176 g008
Figure 9. Comparison of the average number of sunspots identified by SOHO/MDI and SDO/HMI over three different temporal intervals: 12 h (panel (a)), 24 h (panel (b)), and 48 h (panel (c)). Visual elements and regression details follow the same conventions as in Figure 5.
Universe 11 00176 g009
Figure 10. The correlations between the averaged magnetic field strengths in the SOHO/MDI and SDO/HMI datasets, with umbra (top panels) and penumbra values (bottom panels) shown separately. The averaging intervals are 12 h (panels (a,d)), 24 h (panels (b,e)), and 48 h (panels (c,f)). Small and large values are distinguished by color: purple is used for values below the thresholds (5000 G for umbra, 3000 G for penumbra), and blue for values above these thresholds. Dashed lines represent the linear fits for each subset, and corresponding fit parameters, 3 σ intervals, and the NRMSE and R 2 values, are displayed as in Figure 7.
Universe 11 00176 g010
Figure 11. Correlation between 12 h averaged magnetic field strengths measured by SOHO/MDI and SDO/HMI for umbral regions (panel (a)) and penumbral regions (panel (b)). The data points are color-coded according to the sunspot group’s area: red represents small sunspot groups (with umbral area < 20 msh in panel (a) and penumbral area < 80 msh in panel (b)), while blue indicates larger groups (with areas above the respective thresholds). The dashed lines represent the linear fits for each subset and are in the same color as the data points. Corresponding fit parameters, 3 σ intervals, and the NRMSE and R 2 values are displayed as in Figure 7.
Universe 11 00176 g011
Figure 12. Same as in Figure 11, but here the data points are color-coded according to the distance of the sunspot group from the center of the solar disk: red is used for groups within 0.4 solar radii, blue for groups between 0.4 and 0.8 R , and green for groups near the solar limb ( r > 0.8 R ).
Universe 11 00176 g012
Figure 13. The correlation between the areas measured by SOHO/MDI and SDO/HMI for NOAA 11076, using 12 h averaged values. Panel (a) shows the relationship for its umbral area, while panel (b) illustrates the relationship for the total area of the sunspot group. The parameters of the fitted linear regression and the R 2 value are provided in the top-left corner of each panel.
Universe 11 00176 g013
Figure 14. Distributions of regression slopes when comparing SOHO/MDI and SDO/HMI measurements of four key parameters: (a) umbral area, (b) total area, (c) umbral magnetic field strength, and (d) penumbral magnetic field strength. In each panel, the values of the slopes are shown for three averaging intervals: blue = 12 h; red = 24 h; and gray = 48 h. All distributions exhibit a central peak (typically between 1 and 2) and a broad spread of values, indicating substantial group-specific variability and precluding the use of a single universal correction factor across all sunspot groups.
Universe 11 00176 g014
Figure 15. Same as Figure 7, but showing a comparison of the simultaneously measured magnetic field strengths of the positive- (left-hand panels) and negative-polarity (right-hand panels) parts of SOHO/MDI and SDO/HMI data, with umbral values in panels (a,b), and penumbral magnetic fields in panels (c,d).
Universe 11 00176 g015
Figure 16. Same as Figure 7, but for simultaneously measured magnetic field strengths with signs retained.
Universe 11 00176 g016
Figure 17. Comparison between the 30-day smoothed daily sunspot numbers derived from SOHO/MDI data ( R our , red) and the official SILSO record ( R SILSO , blue) over the period 1996–2011. The bottom panel shows the difference between the two time series ( R our R SILSO ). Our sunspot number estimates are consistently higher, particularly around the solar maximum, reflecting the increased sensitivity of our method toward small sunspots.
Universe 11 00176 g017
Figure 18. Same as Figure 17, but for the period 2010–2015 and using SDO/HMI data. The higher sunspot numbers derived from HMI images are especially prominent during the rising phase and maximum of Solar Cycle 24, which is consistent with the superior spatial and temporal resolution of the HMI instrument.
Universe 11 00176 g018
Disclaimer/Publisher’s Note: The statements, opinions and data contained in all publications are solely those of the individual author(s) and contributor(s) and not of MDPI and/or the editor(s). MDPI and/or the editor(s) disclaim responsibility for any injury to people or property resulting from any ideas, methods, instructions or products referred to in the content.