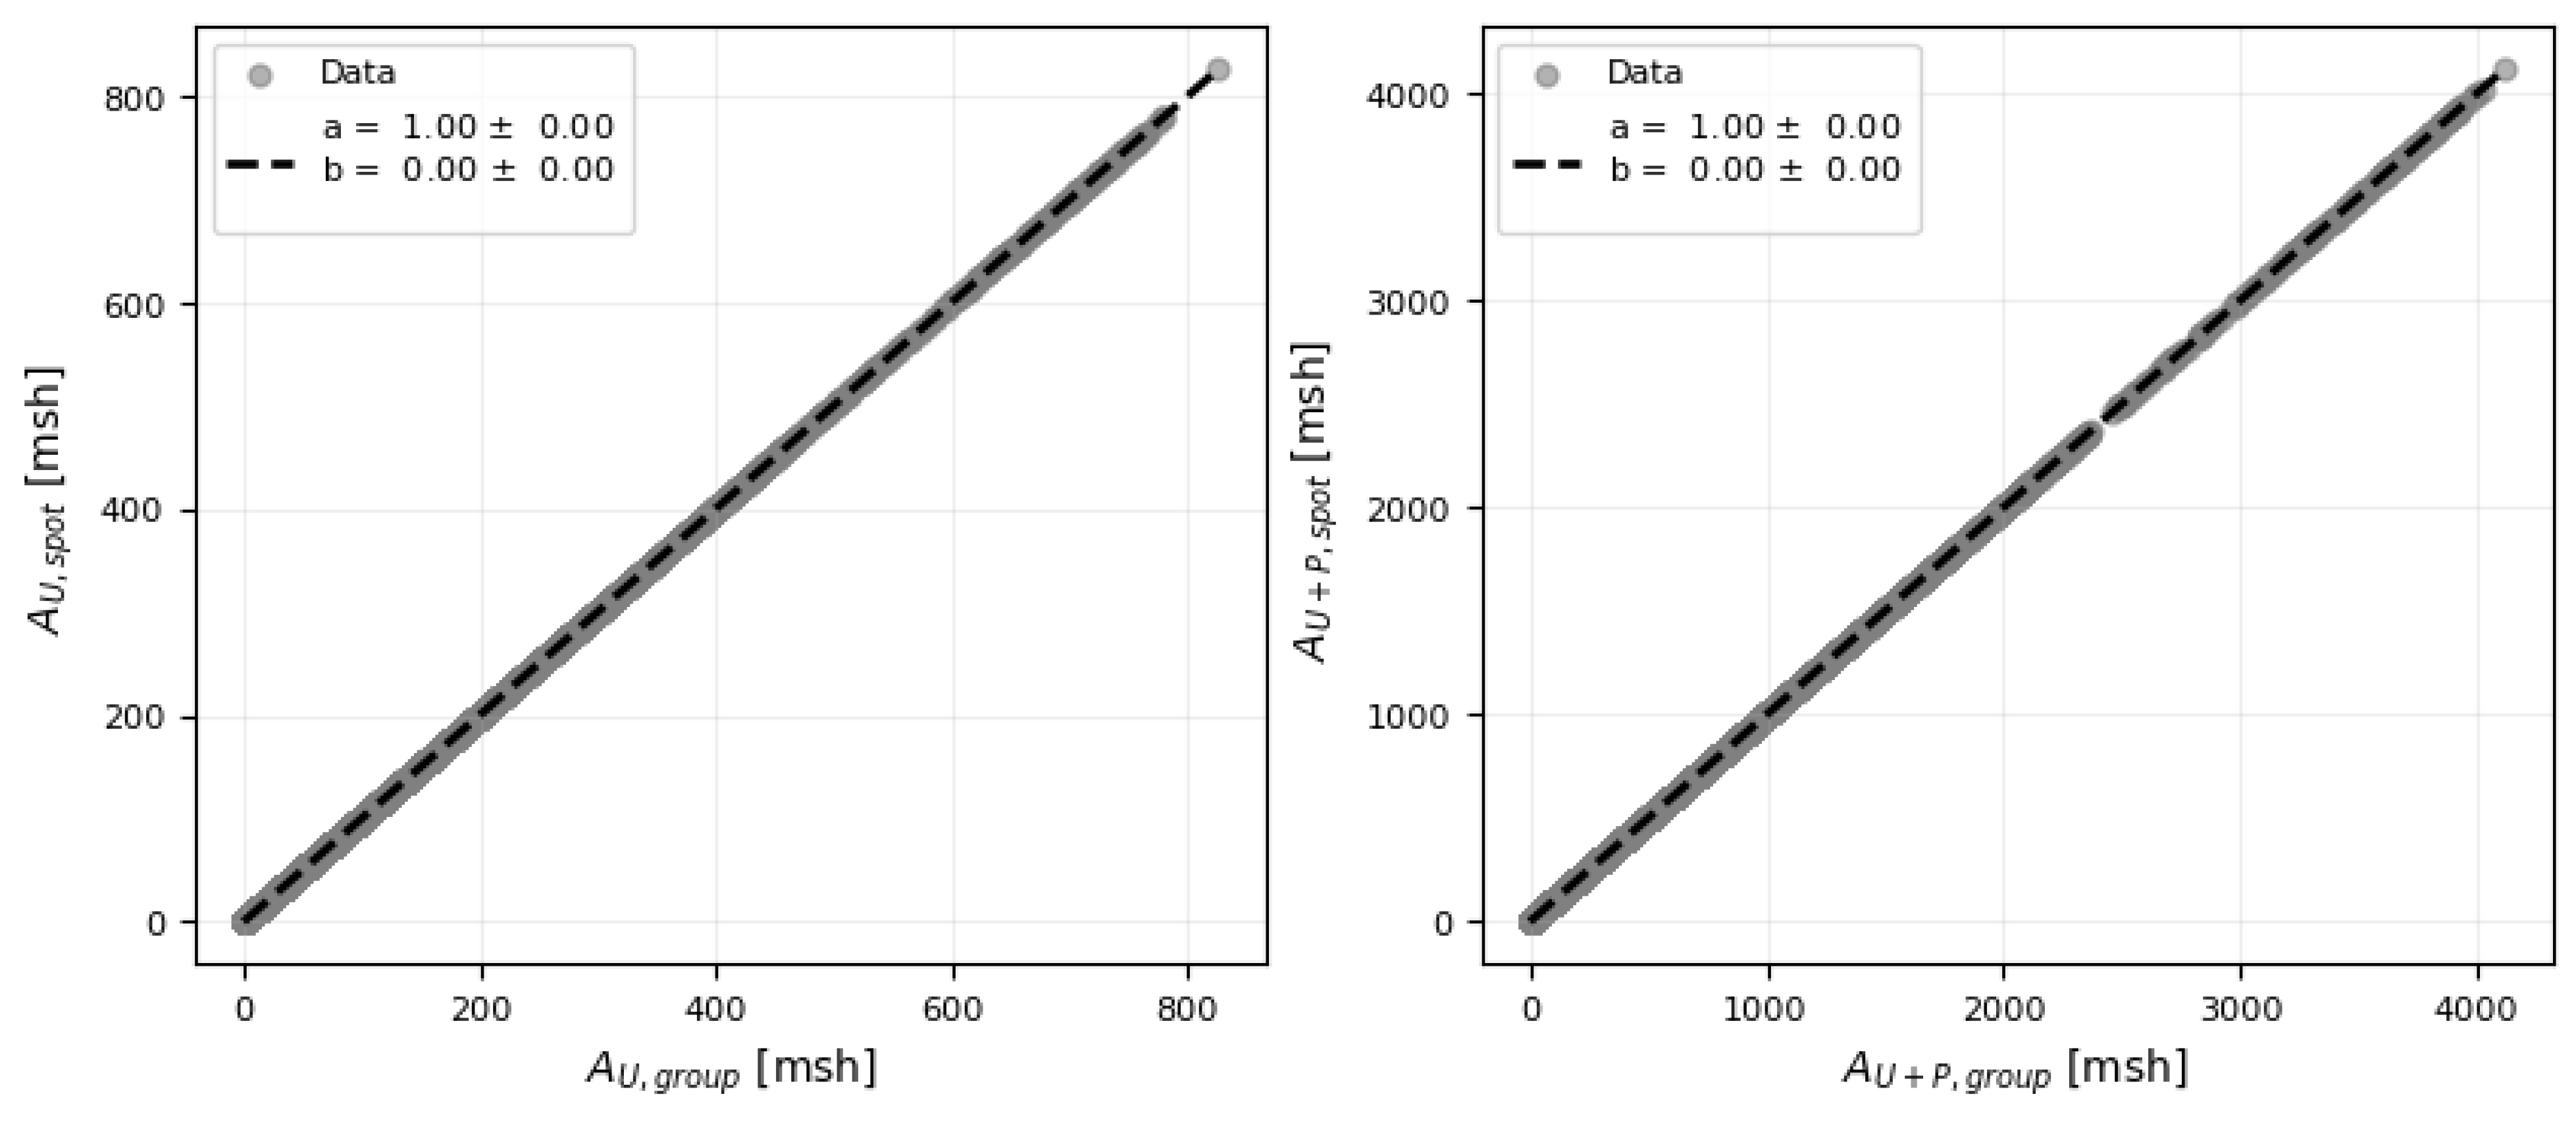
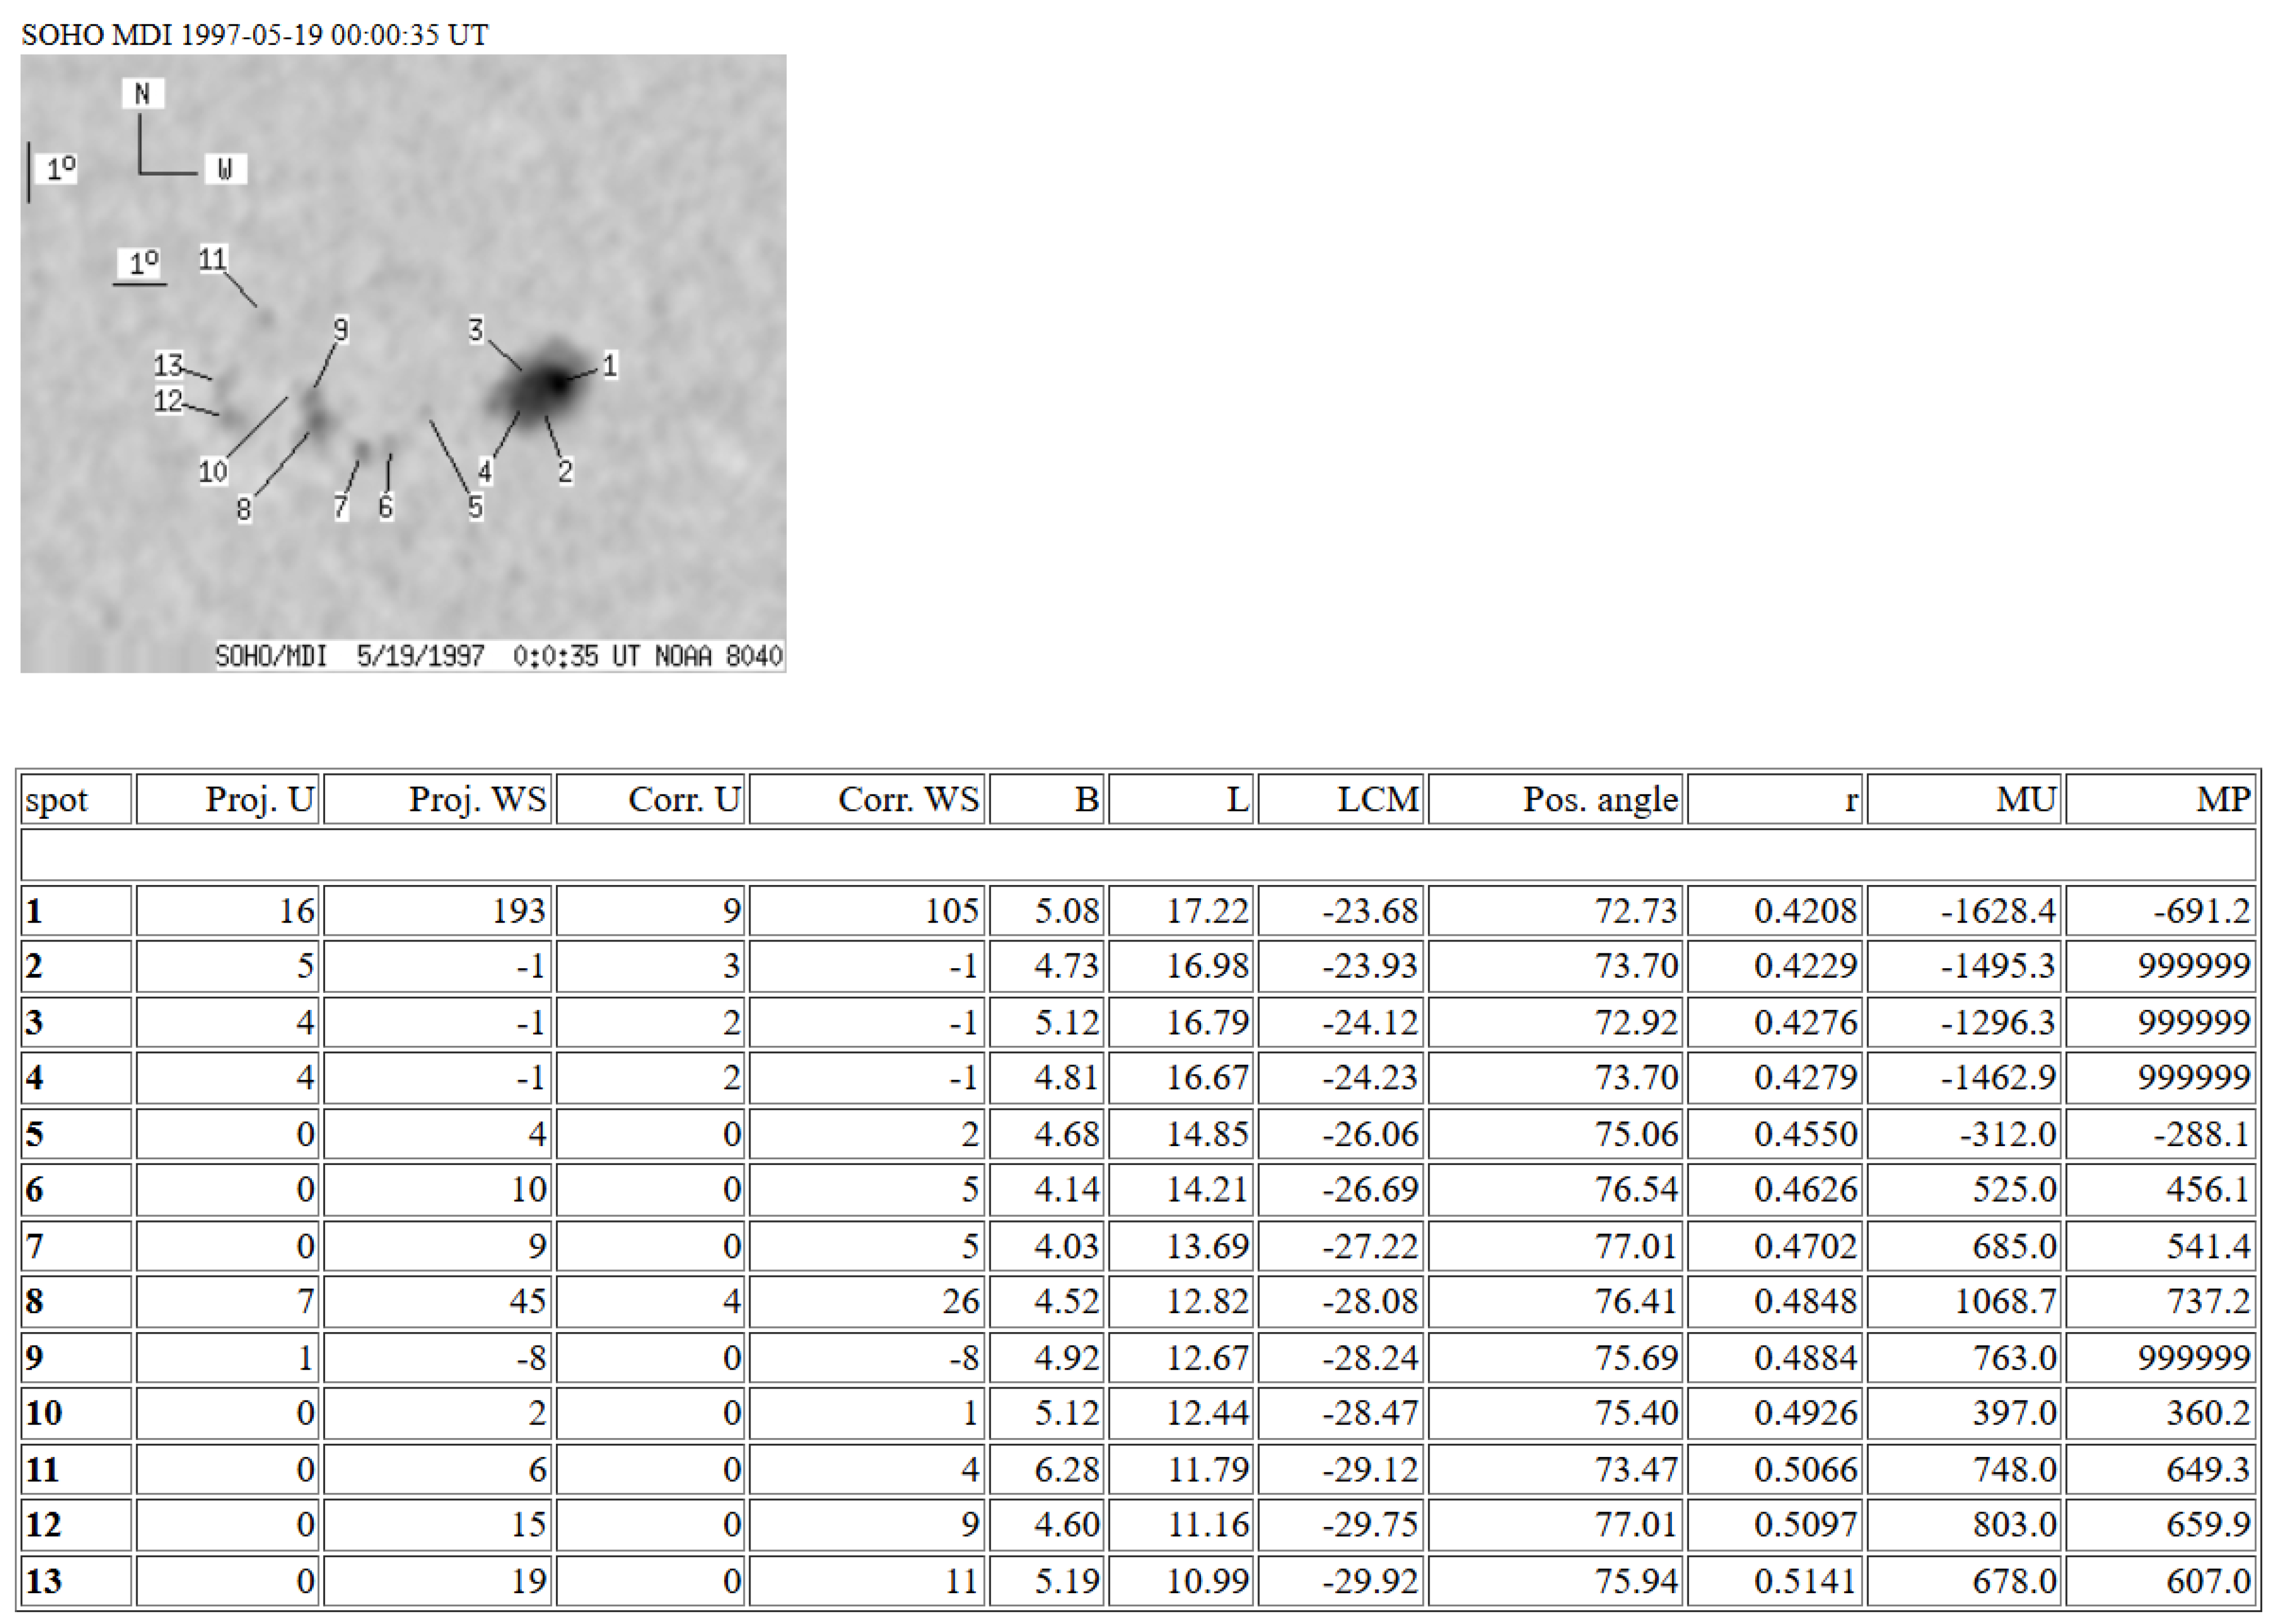
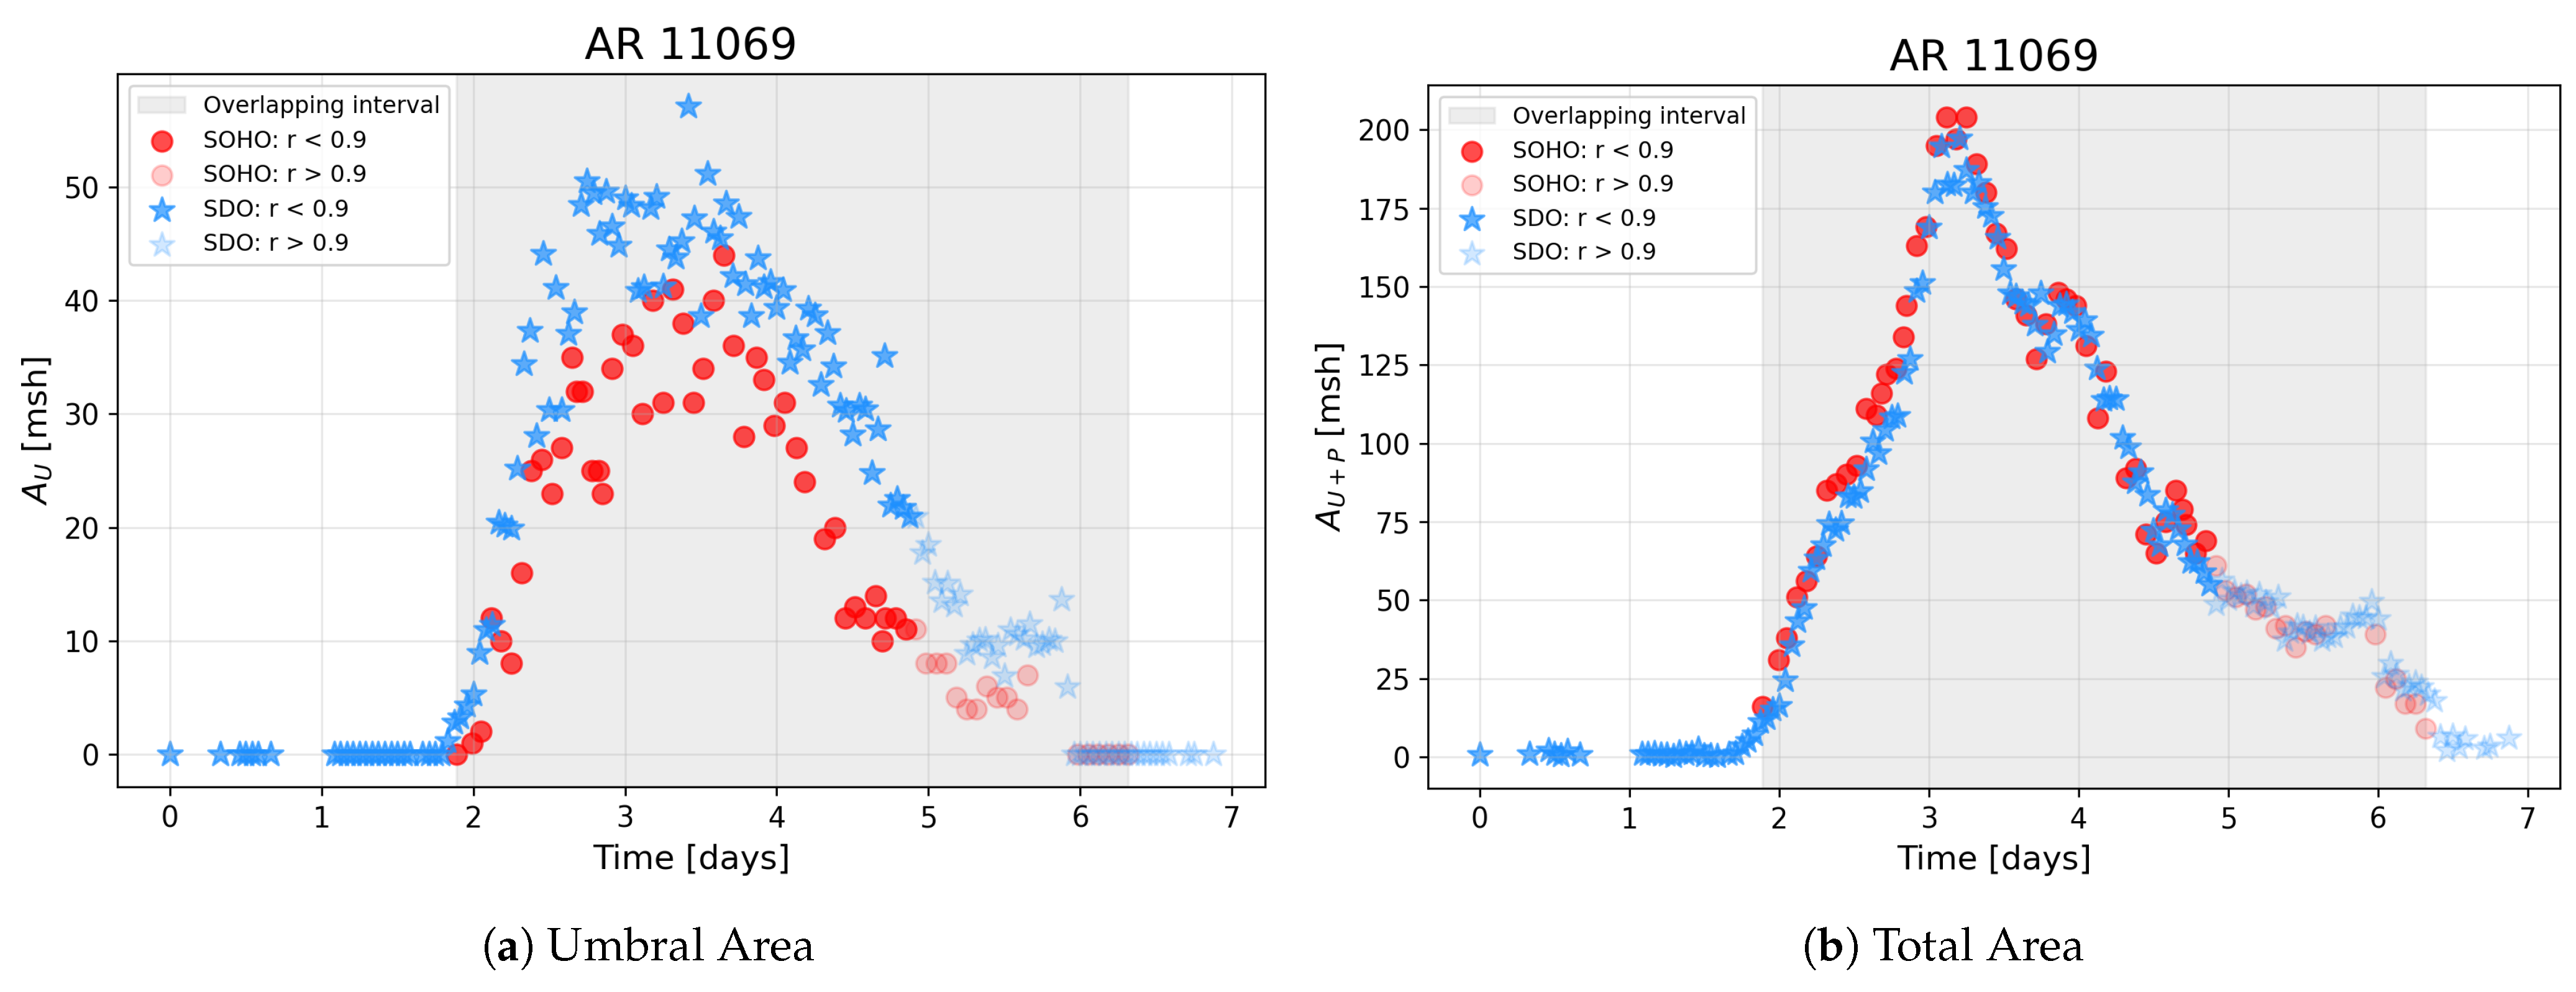
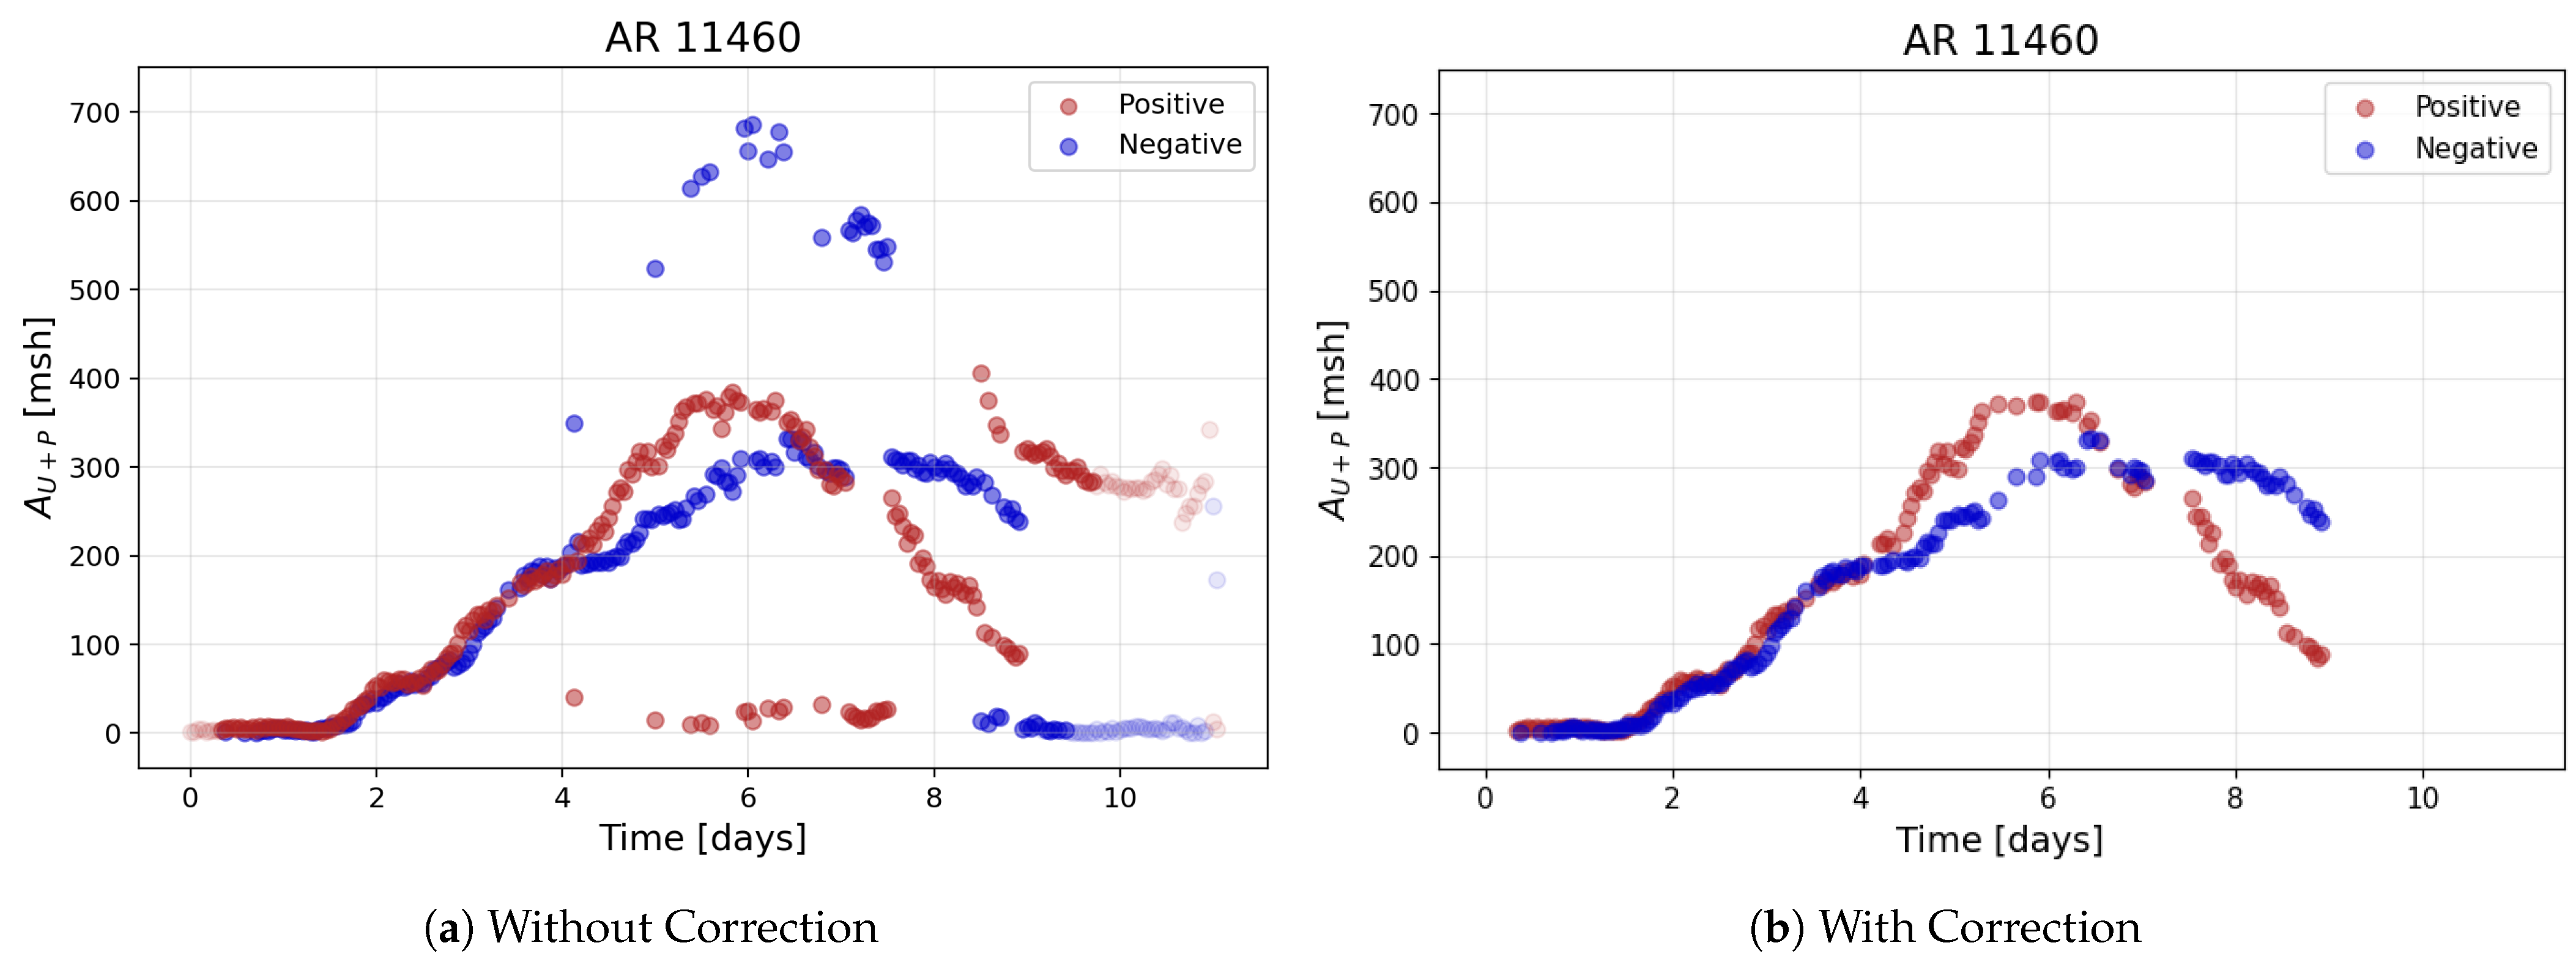
In the previous sections, we described the construction and harmonization of sunspot group datasets derived from SOHO/MDI and SDO/HMI observations, along with the methodologies developed to ensure their compatibility. We now turn to the analysis of the results obtained using these harmonized data. This section presents the outcomes of our comparative study, focusing on the consistency of measured sunspot group properties—such as area, number, and magnetic field strength—across the period in which the two datasets overlap. In addition, we examine how separating the polarities within sunspot groups influences our understanding of their magnetic evolution.
4.1. Comparison of Simultaneous Measurements
In this section, we compare sunspot properties measured by SOHO/MDI and SDO/HMI within 1 min intervals. To evaluate the similarity between the two datasets, we applied linear regression fits and computed two key statistical metrics: the Normalized Root Mean Squared Error (NRMSE) and the coefficient of determination (). The NRMSE quantifies the average deviation of the predicted values from the actual measurements, normalized by the range of the dataset, providing a scale-independent measure of error. On the other hand, indicates the proportion of variance explained by the model, with values closer to 1 suggesting a strong linear correlation. It is important to note that specifically reflects the goodness-of-fit under the assumption of linearity and does not characterize general or non-linear associations between variables.
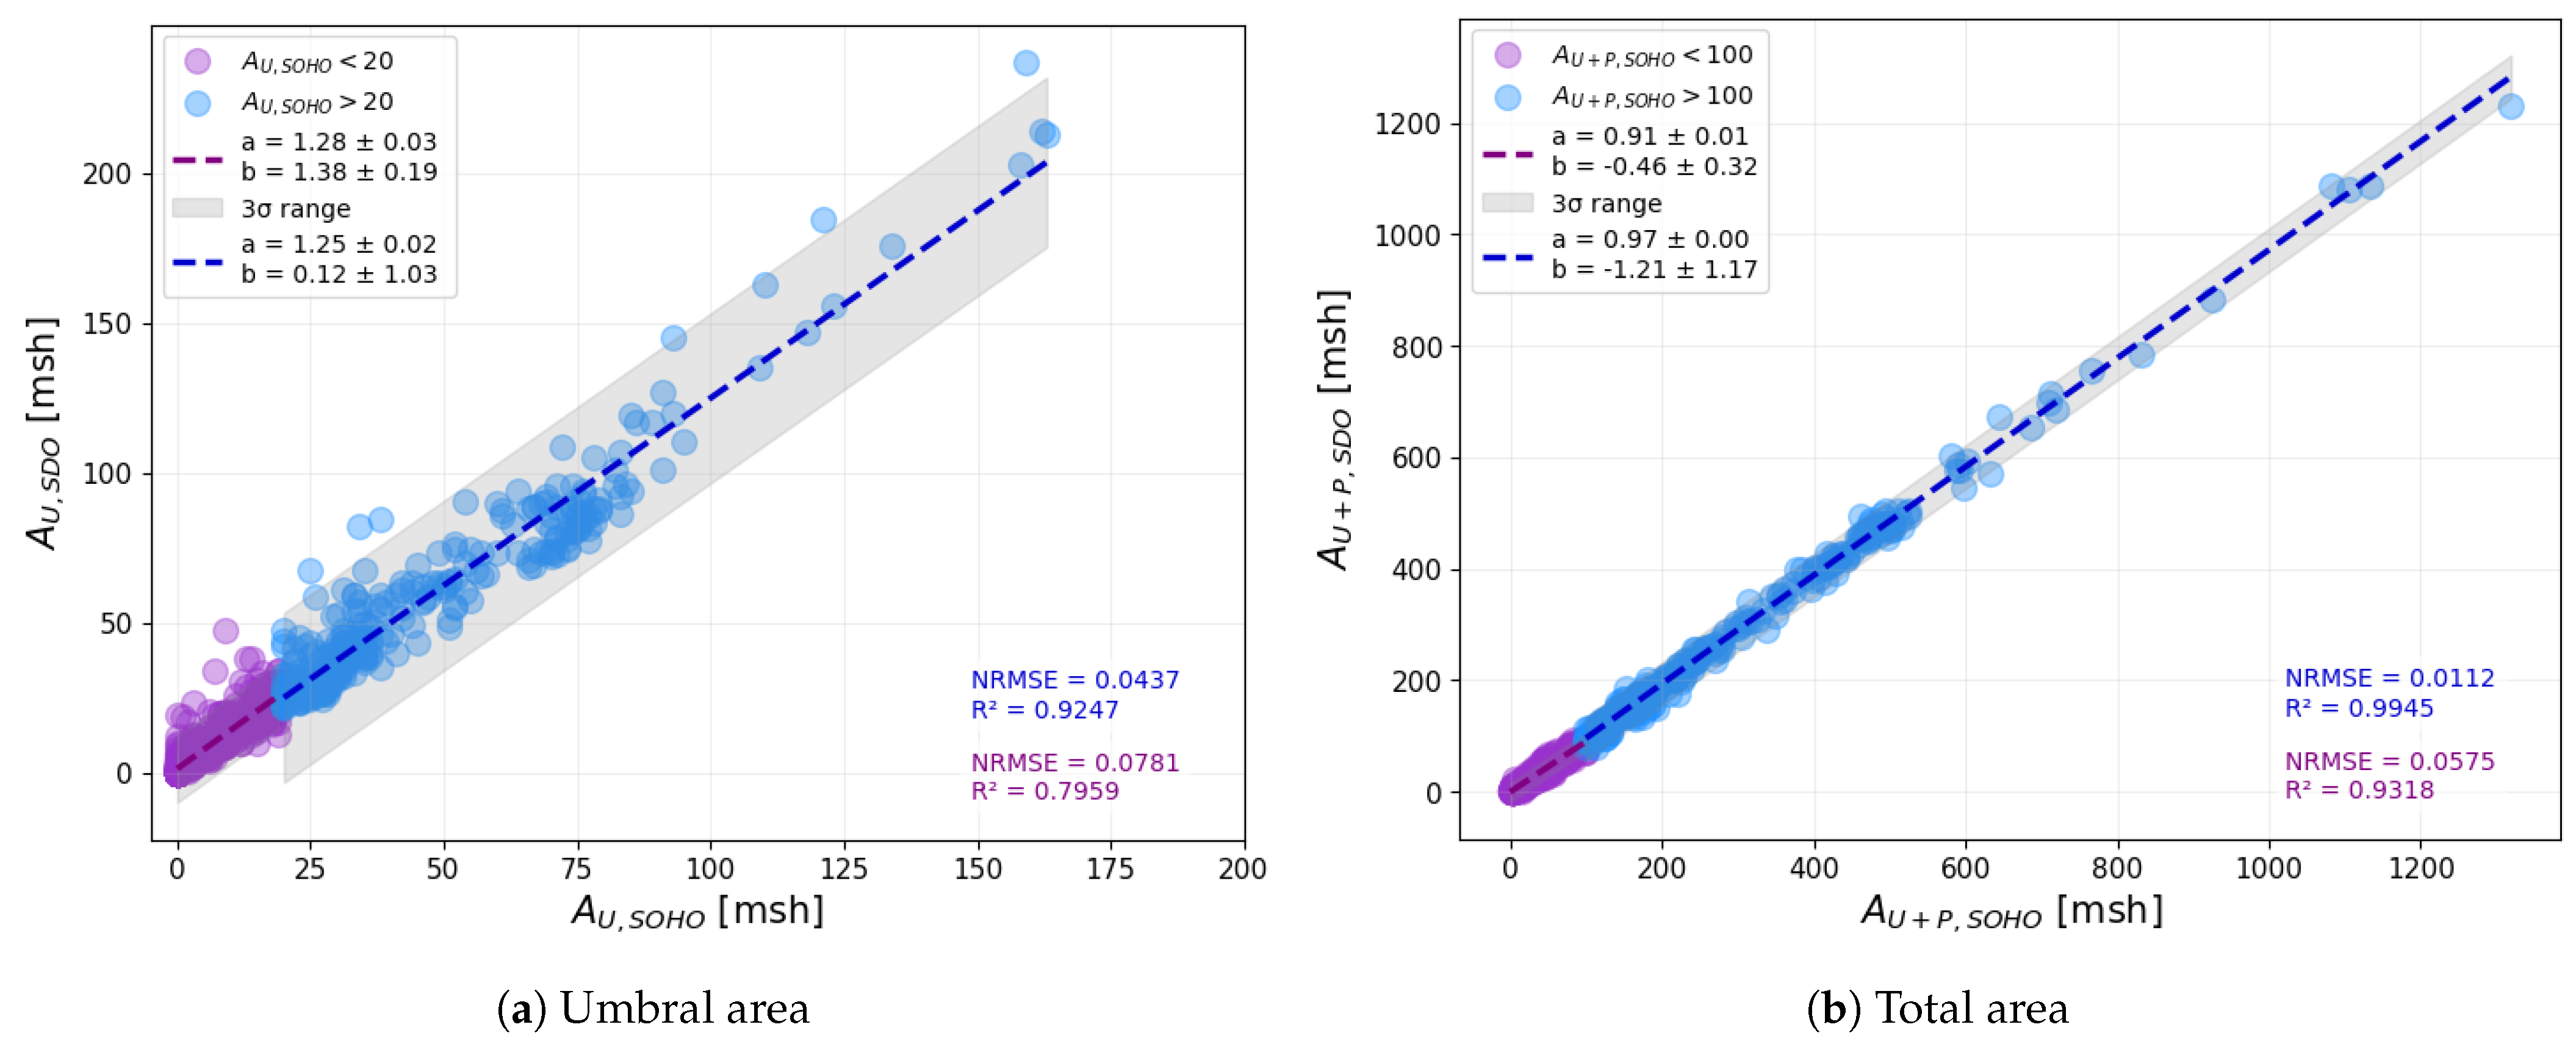
We first analyzed the correlation between the umbral and total (umbra + penumbra) areas measured by the two instruments (
Figure 5). Since SOHO/MDI has a lower spatial resolution, the area values were categorized as either small or large based on SOHO/MDI data. We used separation thresholds of 20
for umbral areas and 100
for total areas, following the method used in a study by Tlatov and Pevtsov (2014) [
32]. Linear fits were applied separately for the two categories. The results suggest that the correlation differs for small and large areas. The differences in the slope (parameters ‘a’ in
Figure 5) of the linear fits indicate that umbral areas deviate by approximately 3% between the two datasets, while for total areas, the deviation is nearly 6%. A notable trend is that SOHO/MDI generally underestimates umbral areas but overestimates total areas compared to SDO/HMI. Although large sunspot groups exhibit a strong linear relationship (
), the significant scatter seen wtih small sunspots suggests that no universal correction factor can be reliably applied.
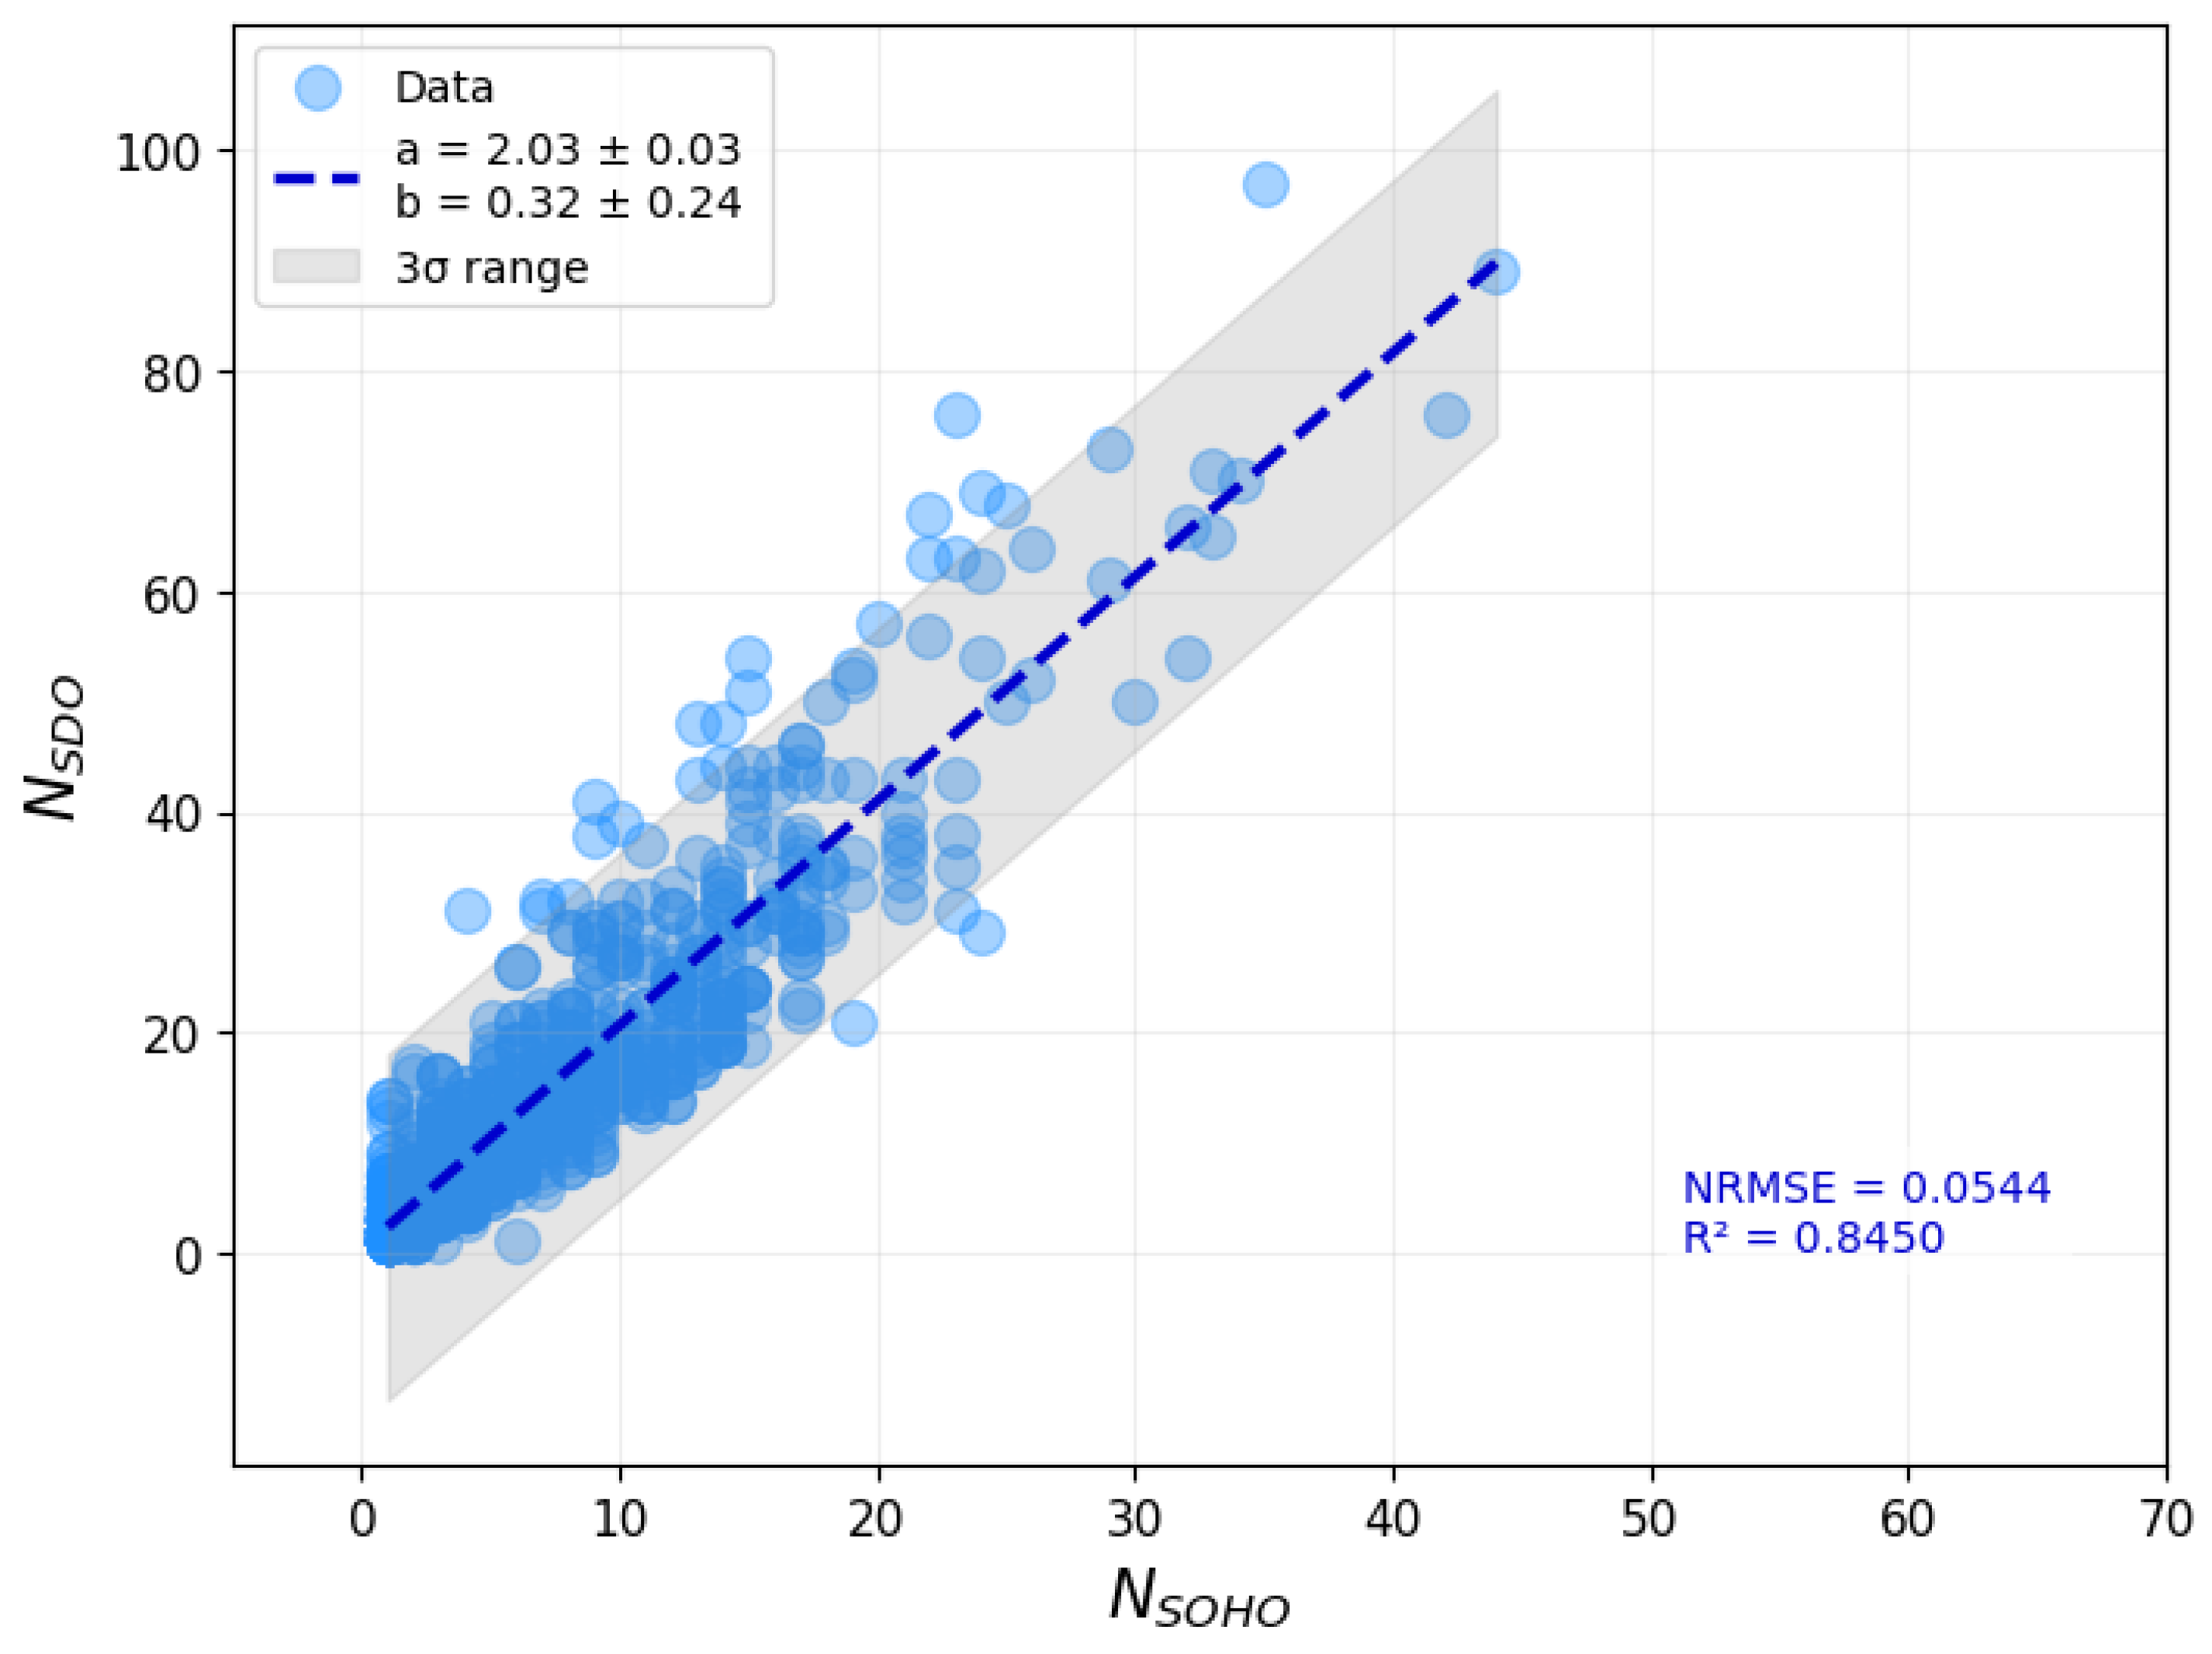
We then examined the correlation between the number of identified sunspots (
and
), as shown in
Figure 6. No clear threshold was identified as separating the small and large groups in this case. The regression line reveals that SDO/HMI typically detects roughly twice as many individual sunspots as SOHO/MDI, although this ratio varies significantly. The wide range of the data limits the predictive power of a single linear model.
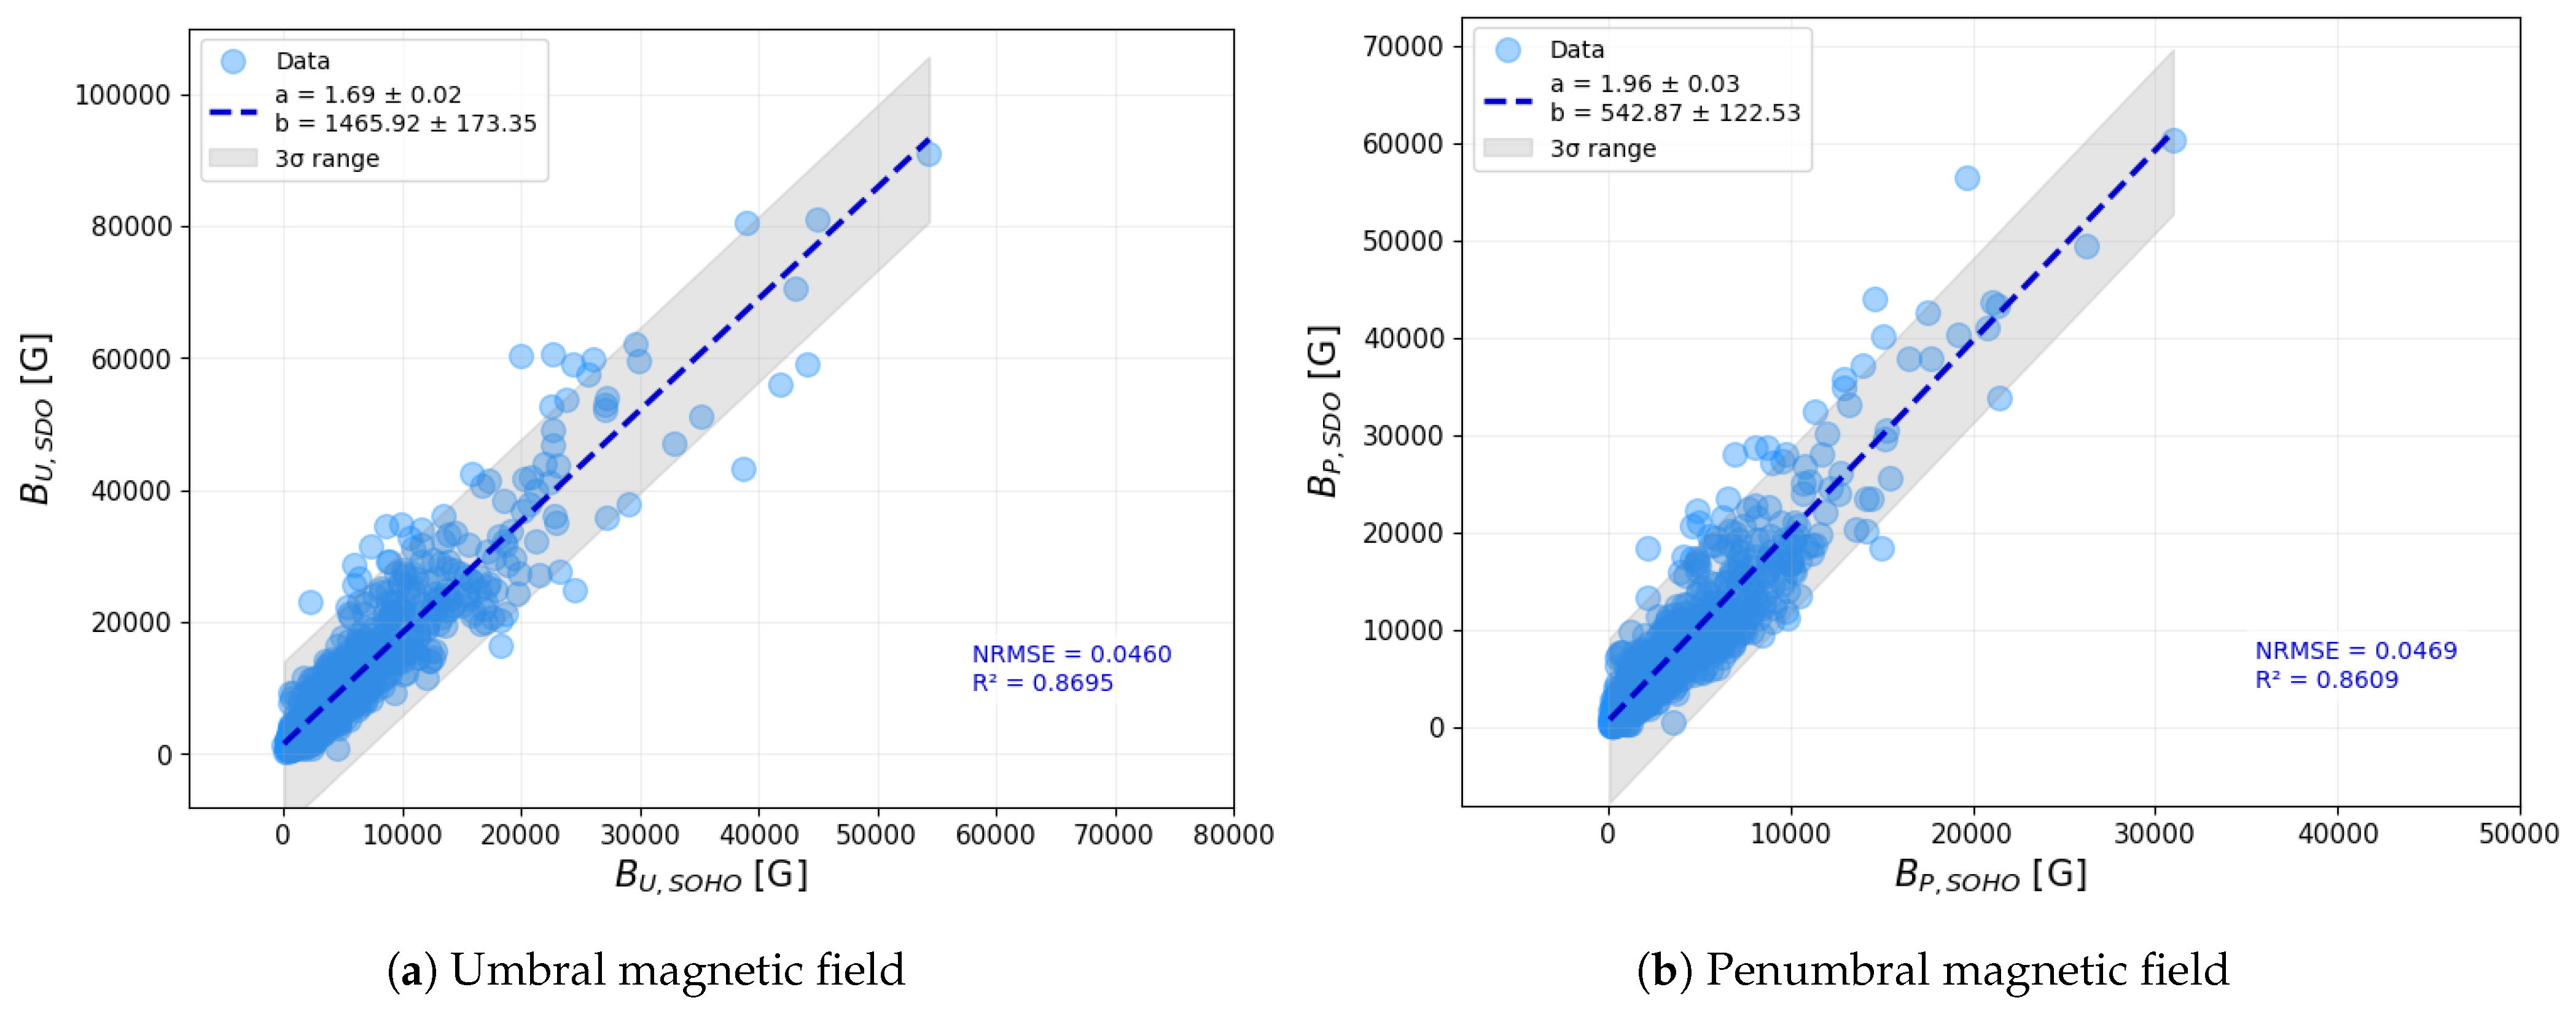
Finally, we compared the magnetic field strengths in the umbra and penumbra (
Figure 7). Here, again, no separation into small and large categories was applied. The scatter in the penumbral field strengths is particularly large, likely reflecting the challenges of accurate measurement in those regions. The low
values and the presence of numerous outliers reinforce the conclusion that a single correction factor cannot be applied consistently across different sunspot regions or datasets.
4.2. Comparison of Averages Across Different Time Intervals
While the previous section focused on measurements taken within a 1 min interval, direct comparisons were often complicated by observational differences between SOHO/MDI and SDO/HMI. To address these challenges and identify systematic trends, we extended our analysis to longer time intervals, averaging key parameters over periods ranging from a few hours to several days. This approach mitigates short-term fluctuations and enables the examination of broader discrepancies between the two datasets.
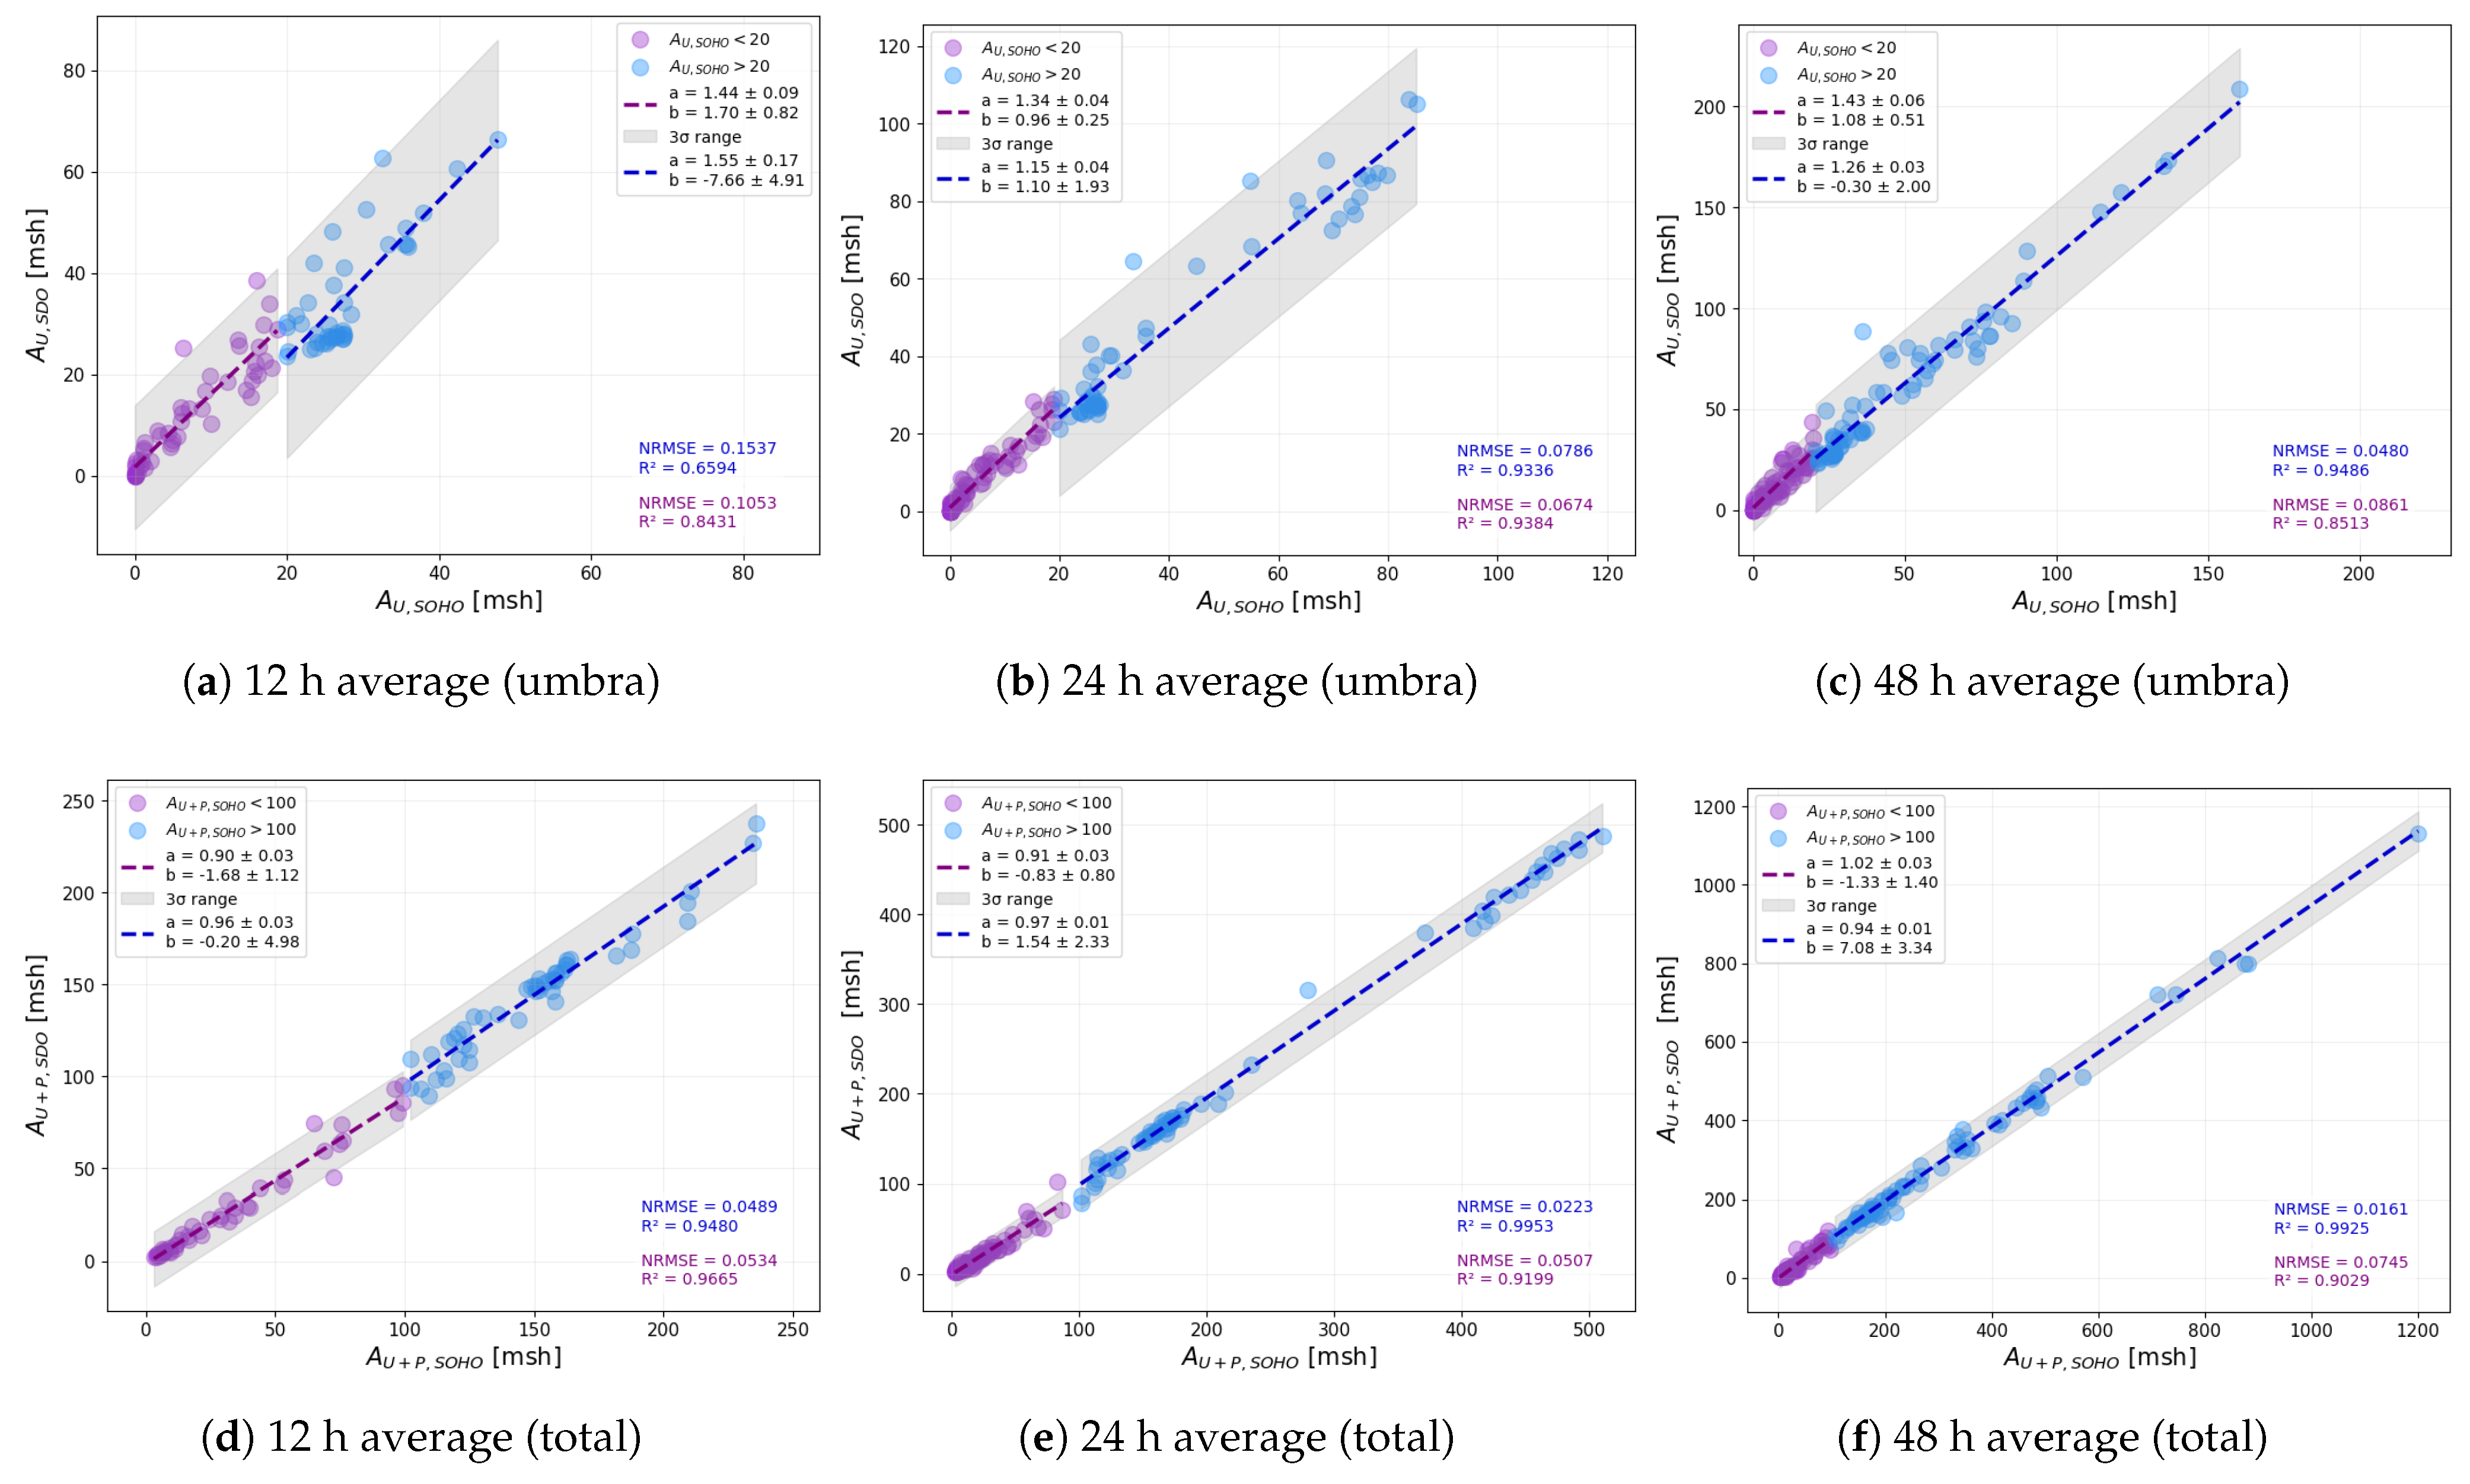
Figure 8 presents the results of our comparison of averaged area values. The top row displays data for umbral areas, while the bottom row corresponds to total sunspot areas. Panels (a) and (d) show values averaged over 12 h intervals, panels (b) and (e) represent 24 h averages, and panels (c) and (f) illustrate results based on 48 h averaging.
As in our previous analysis, we separated small and large values using the thresholds of 20 msh for umbral areas and 100 msh for total areas. The slopes of the fitted lines confirm the trend observed earlier: SOHO/MDI systematically records smaller umbral areas, whereas its total area measurements tend to be larger compared to thsoe of SDO/HMI. In panel (f), which displays the 48 h averaged values, the small-area group (purple dots) shows nearly identical values for the two instruments. This likely reflects the smoothing effect of longer averaging, which reduces the influence of short-term discrepancies and measurement noise. The values further support these findings. With the exception of the large total areas in panels (e) and (f), the data do not exhibit perfect linear correlations. The notable scatter suggests that a universal correction factor cannot be reliably applied, as different sunspot groups may follow different patterns across instruments.
Similarly to the area analysis, we also examined the average number of sunspots identified over different time intervals.
Figure 9 displays the results for 12 h (panel (a)), 24 h (panel (b)), and 48 h (panel (c)) averaging windows. Interestingly, the slope of the fitted regression lines increases with the length of the averaging interval. The slope for the 48 h case is closest to that observed in the 1-minute comparison shown in
Figure 6. This outcome is somewhat counterintuitive, as one might expect the 12 h average to be more similar to the short-timescale result. The fact that longer intervals yield a better match suggests that averaging does not necessarily reduce discrepancies uniformly—it can suppress certain fluctuations while accentuating others. These findings highlight a critical issue: the apparent strength of correlations can be highly dependent on the chosen methodology. If not carefully considered, this can lead to misleading interpretations, particularly in studies comparing datasets with different temporal resolutions.
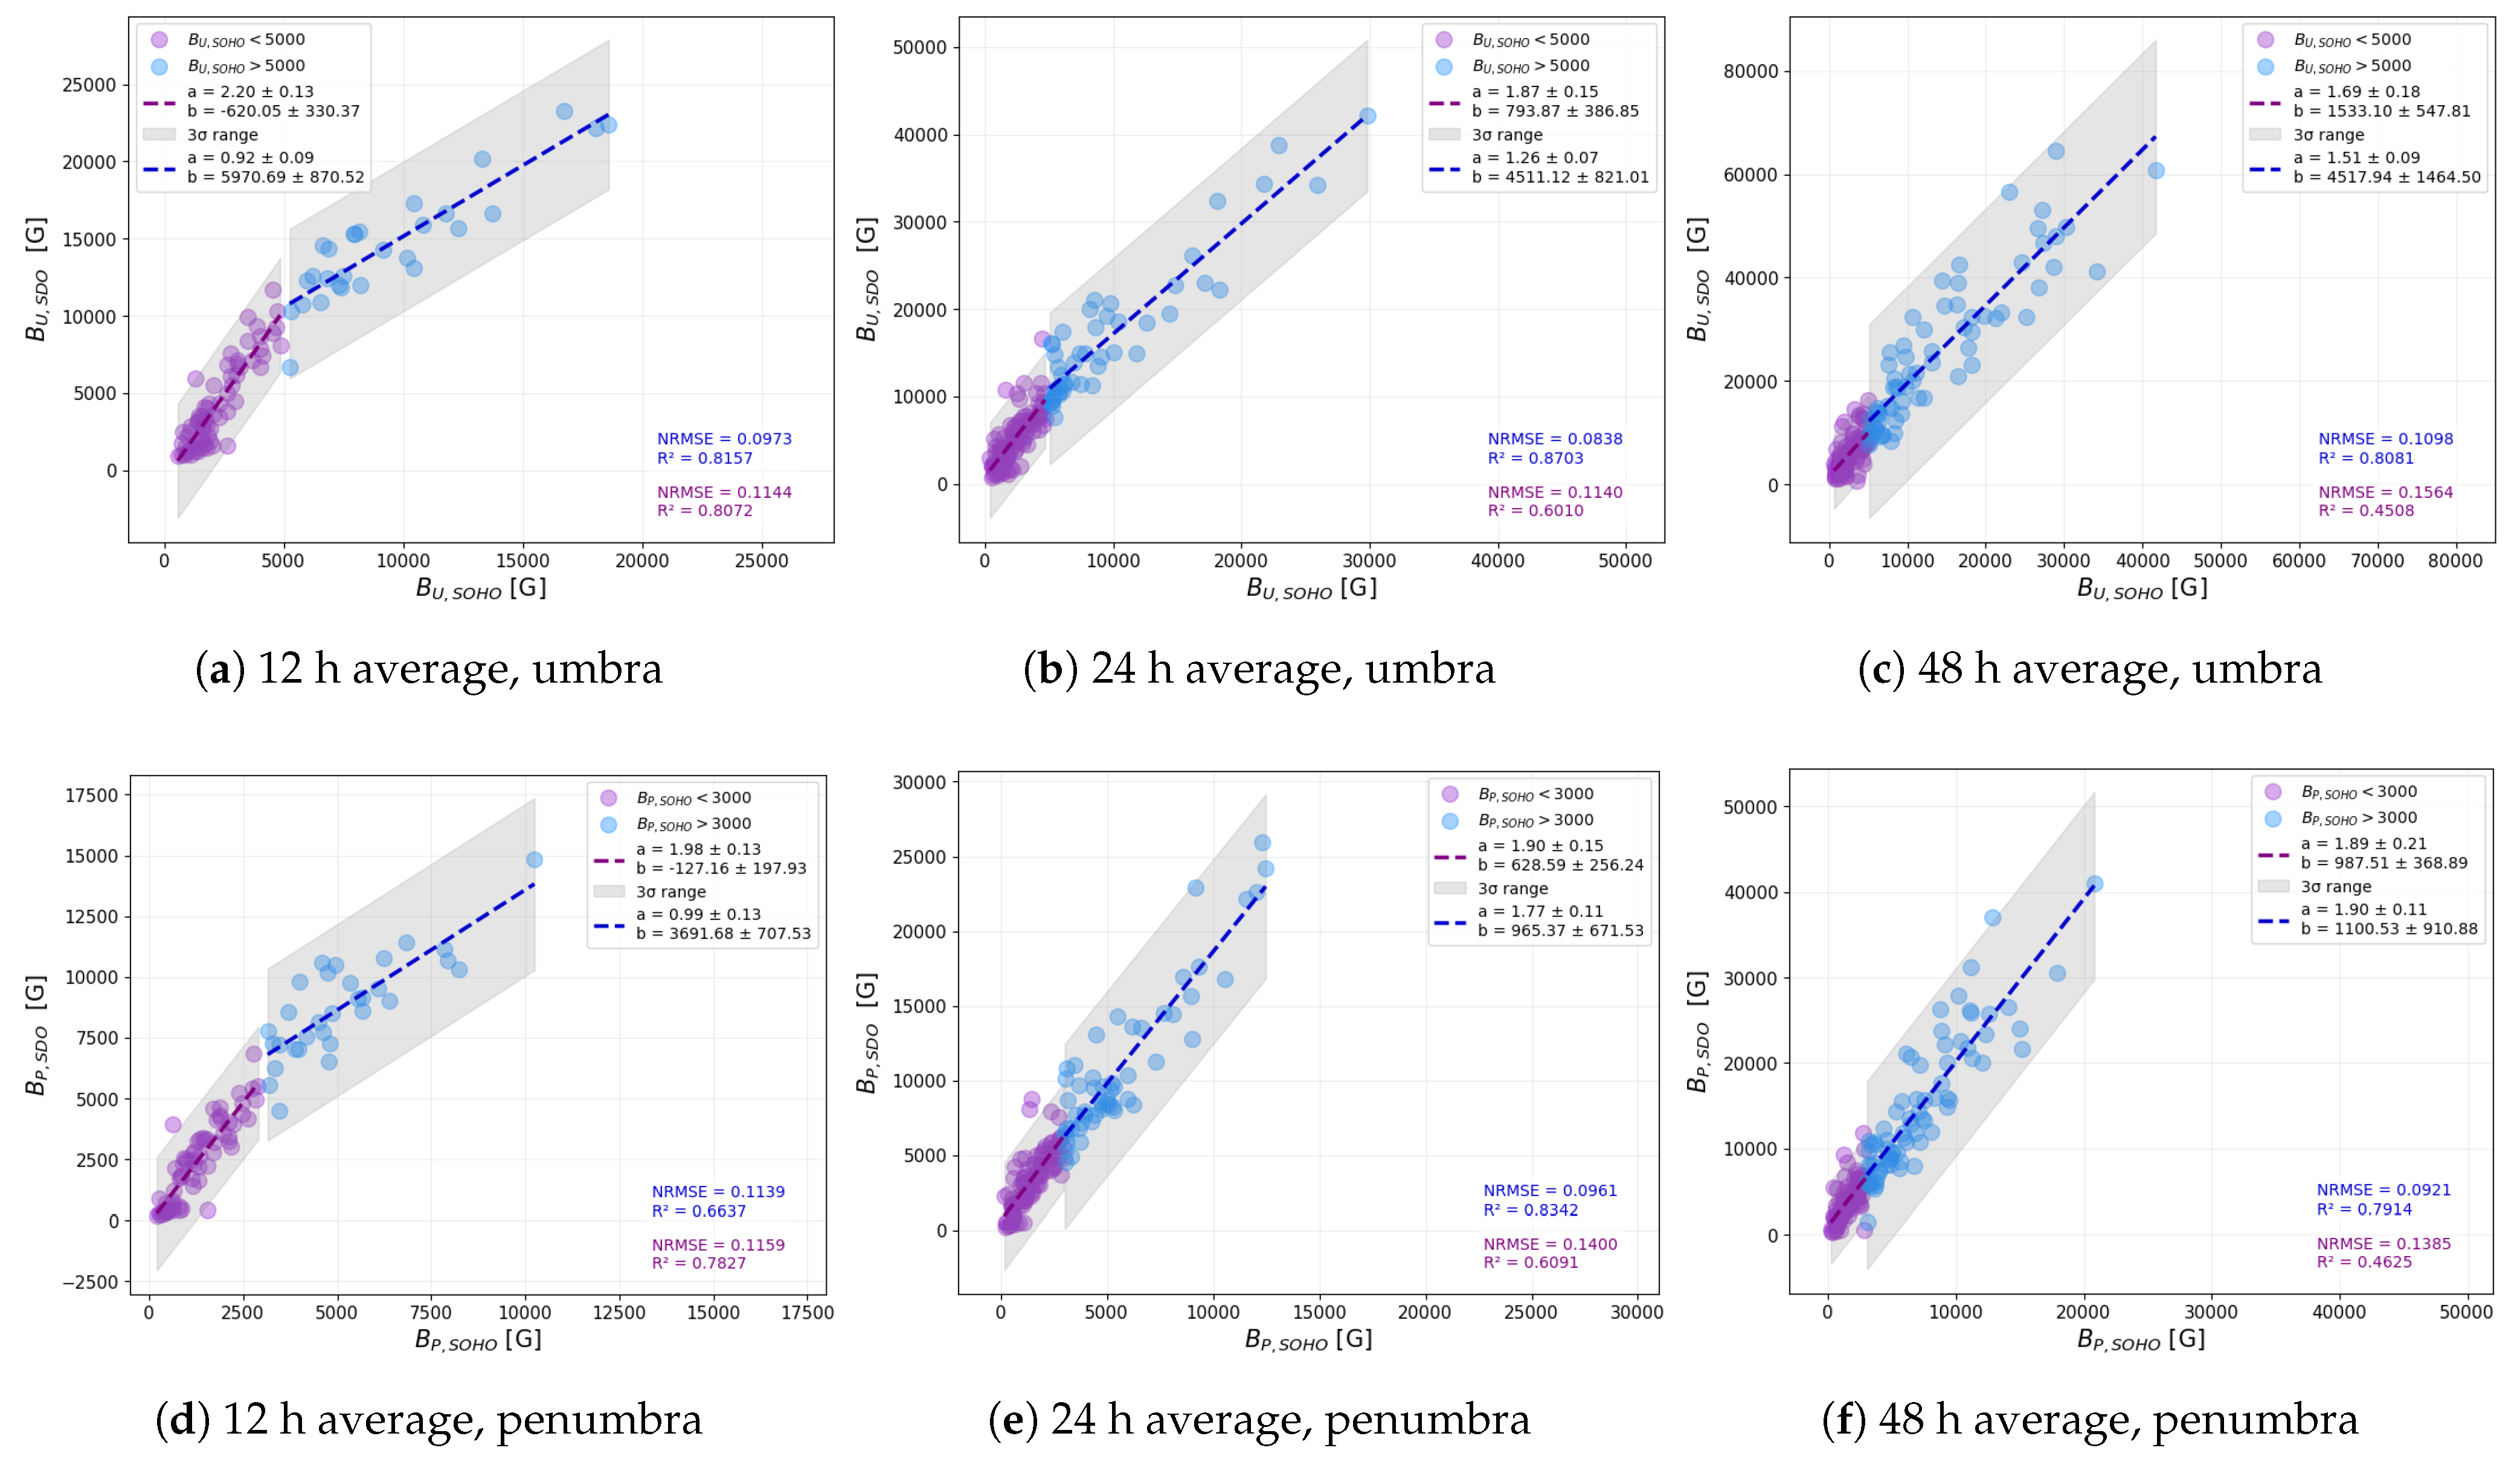
Figure 10 presents a comparison of the average magnetic field strength values recorded in the SOHO/MDI and SDO/HMI datasets, with the umbra shown in the top row and the penumbra in the bottom row. A clear correlation is visible in all panels, but a distinct break can be observed in the data’s distribution—most notably in the 12 h panels. This break appears as a deviation from a single linear trend and reflects the fact that the data are split into two regimes: one for lower and one for higher magnetic field values. More specifically, this break occurs at approximately 5000 G in the umbral magnetic field strengths and around 3000 G in the penumbral magnetic field strengths. These thresholds are used to differentiate the data points, with purple dots representing smaller values (below the thresholds) and blue dots representing larger values (above the thresholds).
Interestingly, the break becomes less pronounced as the averaging interval increases. The smoothing effect of longer time intervals appears to reduce the variability and minimize discrepancies between the two datasets. However, even with this averaging, the fitted regression lines differ between small and large values, indicating again that no universal correction factor can be applied that would work equally well across the entire range of sunspot magnetic field strengths.
Given the pronounced break in magnetic field strength values observed in
Figure 10, we conducted further analyses to identify its underlying causes. One of the possible factors we considered was the area of the sunspot groups, as this can influence the stability and morphology of magnetic structures and potentially affect measurements. In this part of the analysis, we focused specifically on the 12 h averaged data, as the discontinuity is most prominent at this temporal resolution.
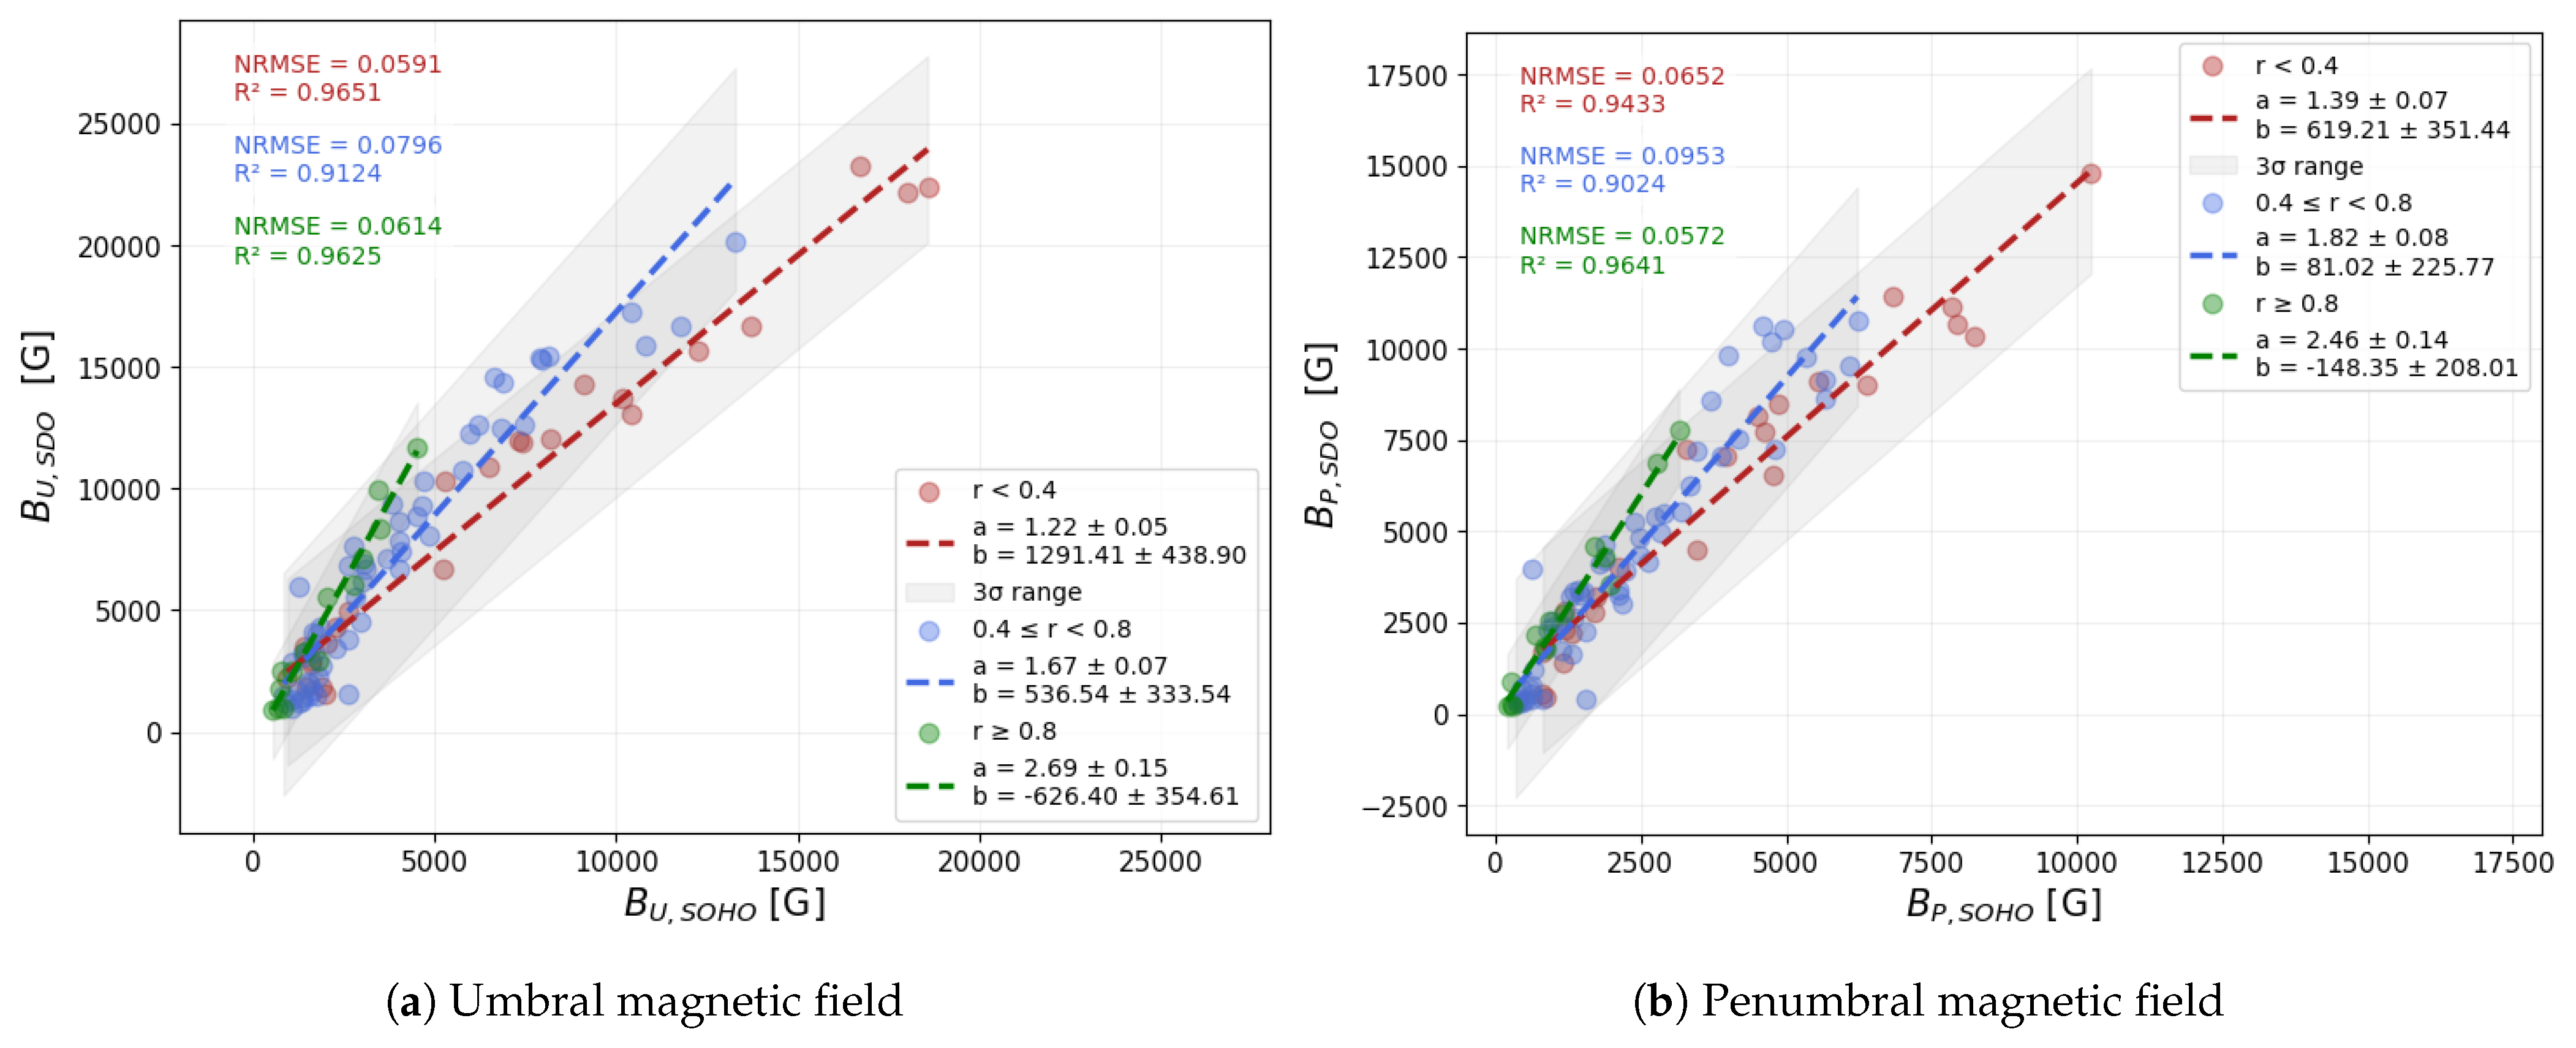
Figure 11 presents the 12 h averaged magnetic field strengths, where the data points are color-coded by the average area of the sunspot groups. The left panel corresponds to umbral regions, while the right panel shows the penumbral values. These plots are identical to panels (a) and (d) of
Figure 10, except that here the color coding allows us to visually assess the influence of sunspot group area on the observed discontinuity. In our analysis, we applied an area threshold of 20 msh for umbrae and 80 msh for penumbrae to separate the small and large sunspot groups, which were based on the 100 msh threshold for total area that was used as an initial reference point. In the case of the umbral field strengths, we observed a slight change in the slope of the fitted regression lines between the two categories, suggesting that larger sunspots may exhibit somewhat different scaling between MDI and HMI measurements. However, this difference is not sufficiently large to account for the break observed in the overall distribution. For the penumbrae, the difference between small and large groups is even less pronounced, with both populations following a nearly identical trend. These findings suggest that the sunspot group area, while contributing slightly to the scatter and possibly to the slope in specific regimes, is not the primary factor responsible for the observed discontinuity in the magnetic field strength correlations.
To further explore the source of the observed discontinuity in the magnetic field strength comparisons, we examined whether the position of the sunspot groups on the solar disk influences the measurements. Due to projection effects and variations in line-of-sight geometry, sunspot groups located closer to the solar limb are more likely to exhibit systematic differences in their measured magnetic field strength values.
Figure 12 shows the umbral and penumbral magnetic field strength values. These plots are identical to panels (a) and (d) of
Figure 10, except that here we colored the data points according to the radial position of the sunspot groups on the solar disc. We divided the sunspots into three distance-based categories: (1) those within
(red), (2) those between
and
(blue), and (3) those beyond
(green). The fitted lines indicate a clear trend: the slope increases with increasing distance from the center of the disc. This pattern holds for both umbral and penumbral fields, suggesting that the discrepancy between the SOHO/MDI and SDO/HMI magnetic field strength measurements is significantly affected by the sunspot groups’ position on the solar disc. In particular, sunspot groups closer to the limb show systematically larger differences between the instruments, which may be a key factor contributing to the observed discontinuity.
To further explore the observed discrepancies, we performed a detailed analysis of individual sunspot groups. For each group, we applied a linear regression to compare the averaged magnetic field strength values obtained from SOHO/MDI and SDO/HMI observations. While previous results clearly revealed that the systematic break in field strength values is primarily associated with the position of sunspot groups on the solar disc, the linear fits across the entire dataset exhibited significant scatter. To better understand the origin of this scatter and evaluate whether it stems from group-specific characteristics or measurement uncertainties, we investigated the distribution of the fit parameters across individual sunspot groups. By examining the regression slopes, intercepts, and associated statistical metrics separately for each group, we aimed to identify potential patterns or outliers that may remain hidden in the aggregated data and thus refine our understanding of the overall discrepancies in the instruments.
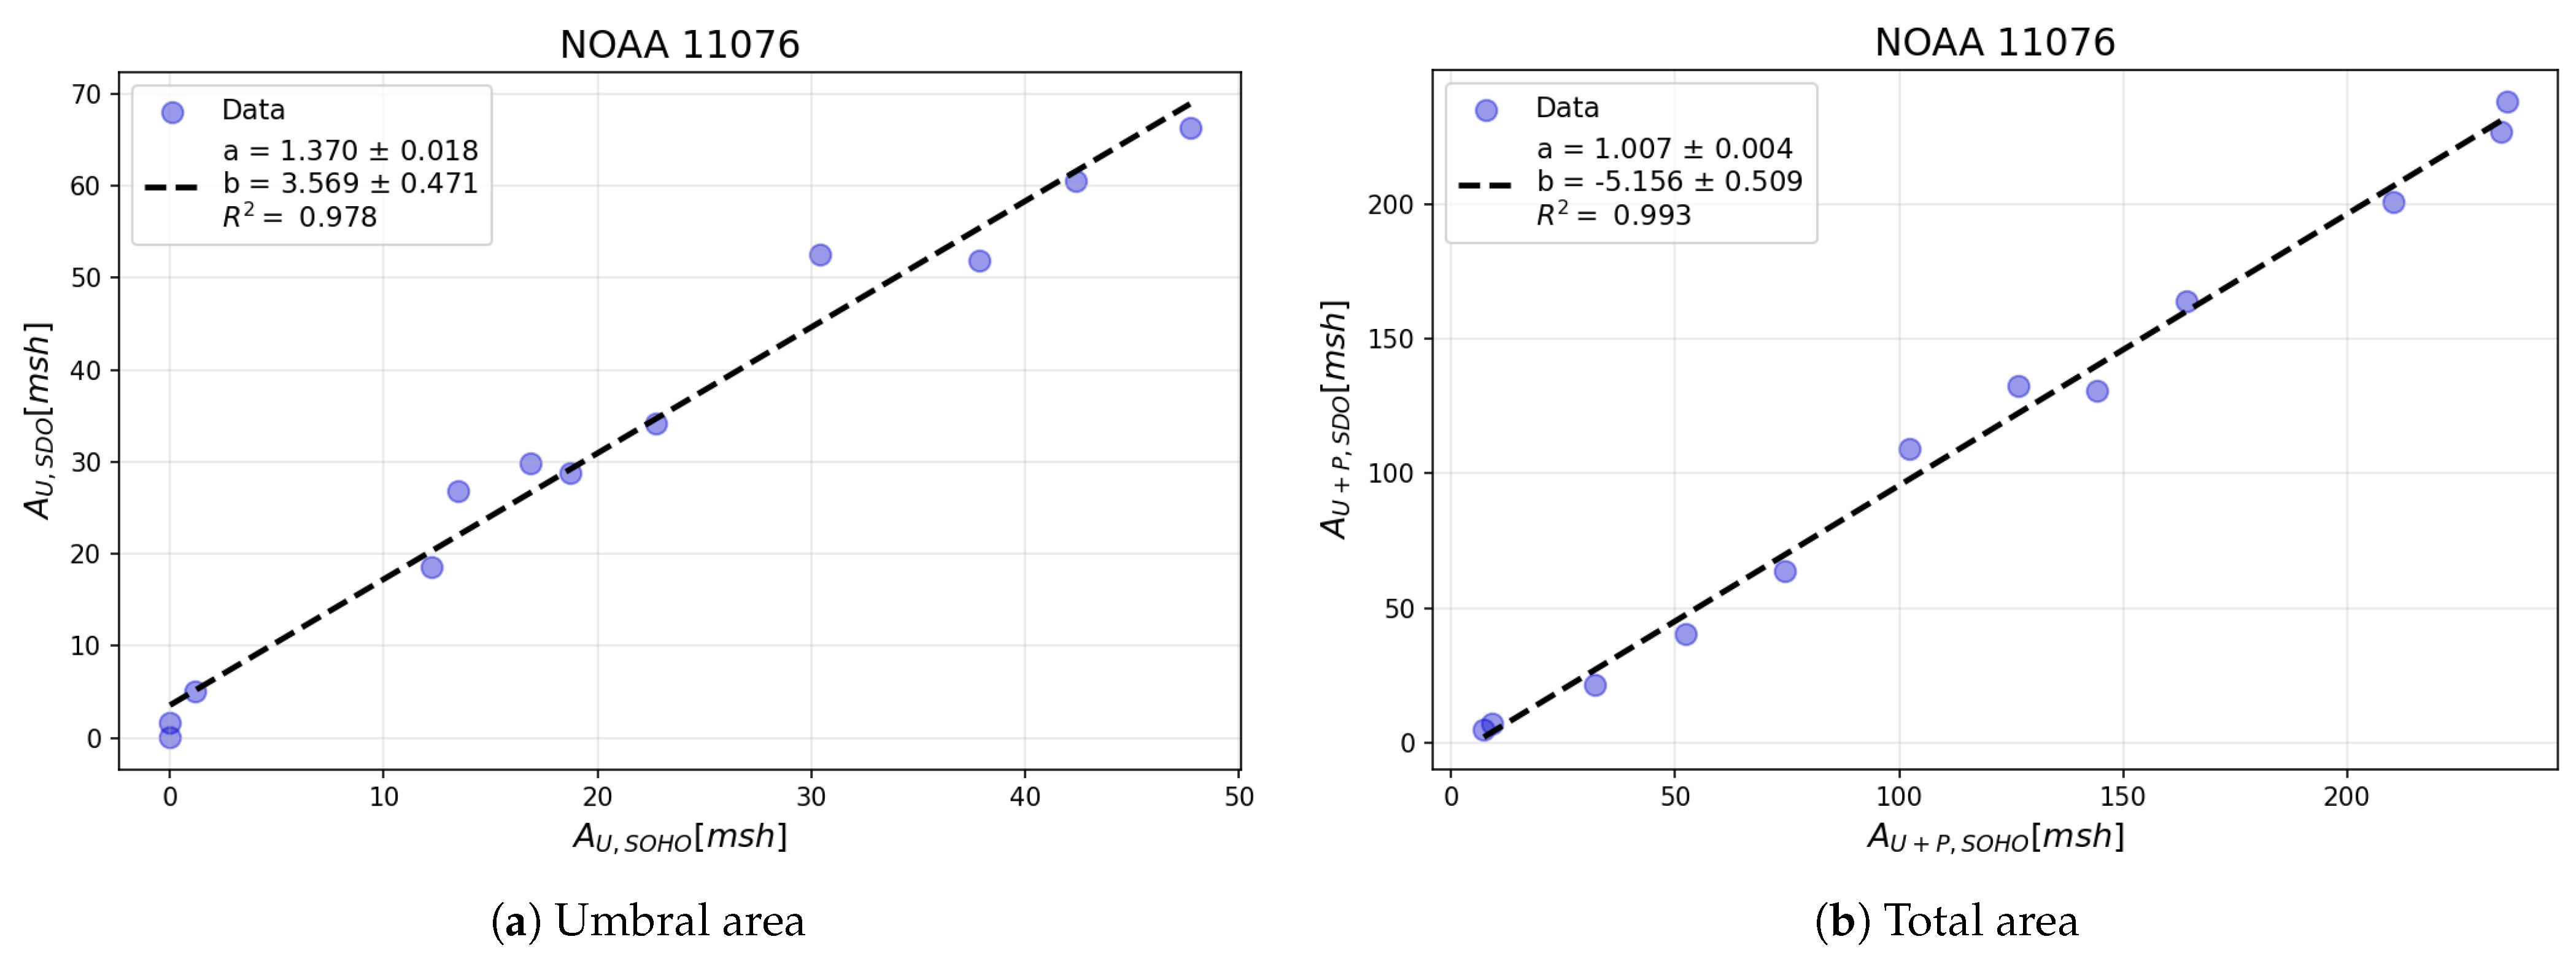
An illustrative example is shown in
Figure 13, where the 12 h averaged SOHO/MDI values are plotted on the
x-axis and the corresponding SDO/HMI values on the
y-axis. The left-hand panel presents the results for umbral area, and the right-hand panel shows the results for the total area. Each blue dot represents an averaged data point, with the black dashed line indicating the linear fit. This procedure was repeated for all individual sunspot groups across each integrated time interval, allowing us to analyze the distribution of regression parameters and assess the variability in the results from different groups.
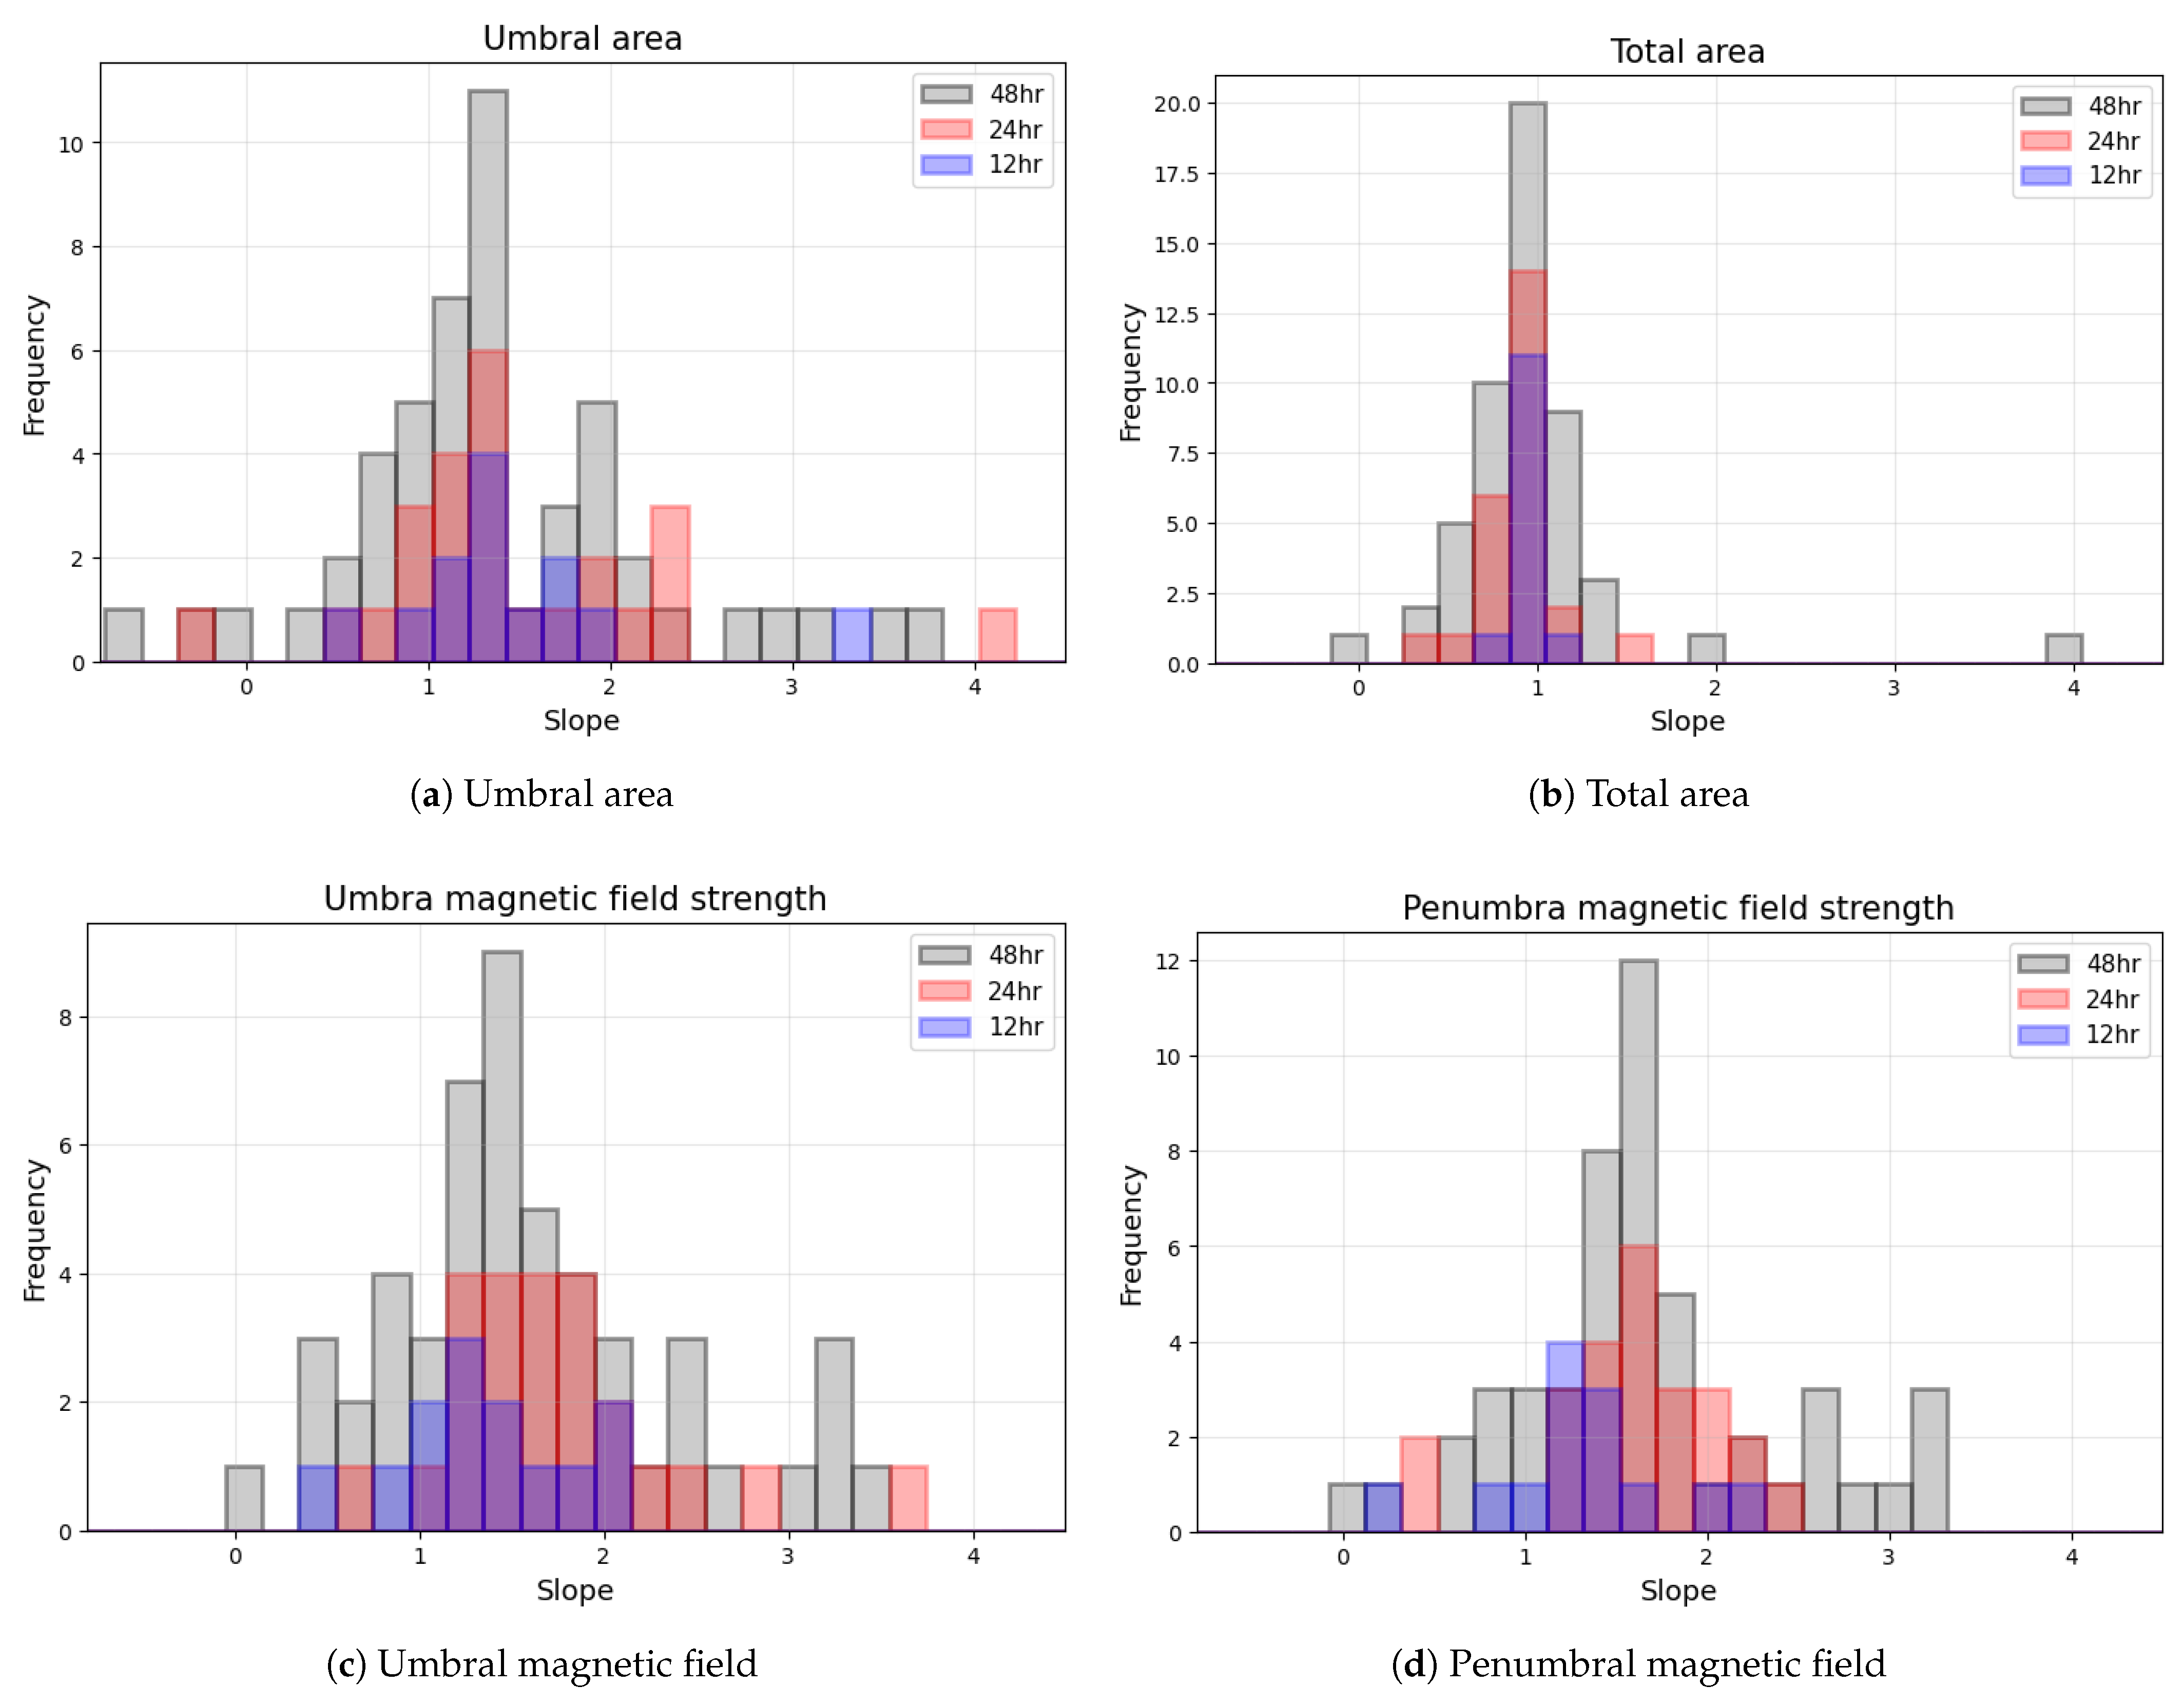
Next, we examined the distribution of slopes derived from both area-based and magnetic field strength-based fits.
Figure 14 presents a combined view of these distributions, integrating the results from umbral and total area fits (panels (a) and (b)), as well as umbral and penumbral magnetic field strength fits (panels (c) and (d)). Slopes for the three averaging intervals are shown in different colors: blue for 12 h, red for 24 h, and gray for 48 h averages.
Across these histograms, several notable features emerge. First, the best agreement between instruments occurs for total sunspot area (panel (b)), which displays a sharp peak around a slope of 1.0, indicating that SOHO/MDI and SDO/HMI record very similar total areas on average. By contrast, the umbral areas’ distribution (panel (a)) shows a bimodal structure—which is most evident in the 48 h averages—with one higher peak near 1.2 and a second, lower peak around 2.0. This suggests that small and large umbral regions scale differently between the two instruments. In the case of magnetic field strengths, both umbral (panel (c)) and penumbral (panel (d)) slopes form broader, approximately Gaussian distributions, with each featuring a prominent peak in the 48 h data: around 1.4 for umbrae and 1.6 for penumbrae. Finally, although not shown here, the slope distribution for the number of identified sunspots likewise peaks near 1.4 and exhibits a similar broad scatter. Taken together, these results imply that while a rough multiplicative factor can align measurements from SOHO/MDI and SDO/HMI, the presence of outliers and the wide spread of slopes demonstrate the challenge in applying a single correction factor to all sunspot groups.
4.3. Comparison of Magnetic Field Strengths of Separated Polarities
To assess whether the agreement between SOHO/MDI and SDO/HMI varies with magnetic polarity, we divided the dataset into positive- and negative-polarity subsets and compared the simultaneously measured umbral and penumbral field strengths separately. The results are displayed in
Figure 15, where the top row contains a comparison of positive-polarity umbral parts in panel (a), and negative-polarity umbral parts in panel (b), while the bottom row contains the same for penumbral magnetic field strengths. The negative-polarity magnetic field strengths are given as absolute values.
An interesting trend in the umbral magnetic field data is that within individual sunspot groups, the summed magnetic field strengths of positive-polarity umbrae are approximately twice as high as the summed absolute values of the negative-polarity umbrae. It is important to note that this summation refers to a direct sum of magnetic field strengths for all identified umbrae of a given polarity within a group, without weighting by sunspot area. In the case of penumbrae, this asymmetry is less pronounced, although the summed positive values still tend to exceed the negative ones.
This polarity imbalance in the distribution of measured field strengths may partially reflect or relate to the differences observed in the scatter of their HMI versus MDI comparisons. Specifically, based on the standard deviations of the differences between HMI and MDI magnetic field strengths, a modest asymmetry can be seen between the positive and negative polarities in the umbral regions: the standard deviation is approximately 14% higher for the negative polarities. In contrast, the penumbral values exhibit nearly identical scatter for both polarities. While this difference is not particularly large, it may point to subtle polarity-dependent effects in either the measurement process or from the underlying physical structures.
In a related study, Liu et al. (2012) [
11] performed comparisons of magnetic field strengths across both polarities but did not analyze them separately. To provide a more direct comparison with their results, we also carried out an additional analysis where magnetic field values from both polarities were considered simultaneously, retaining their respective signs rather than taking absolute values. In this approach, positive- and negative-polarity measurements were combined into a single dataset, preserving the original polarity of each measurement. Linear fitting was then applied across the full range of signed data points. The outcome of this approach is shown in
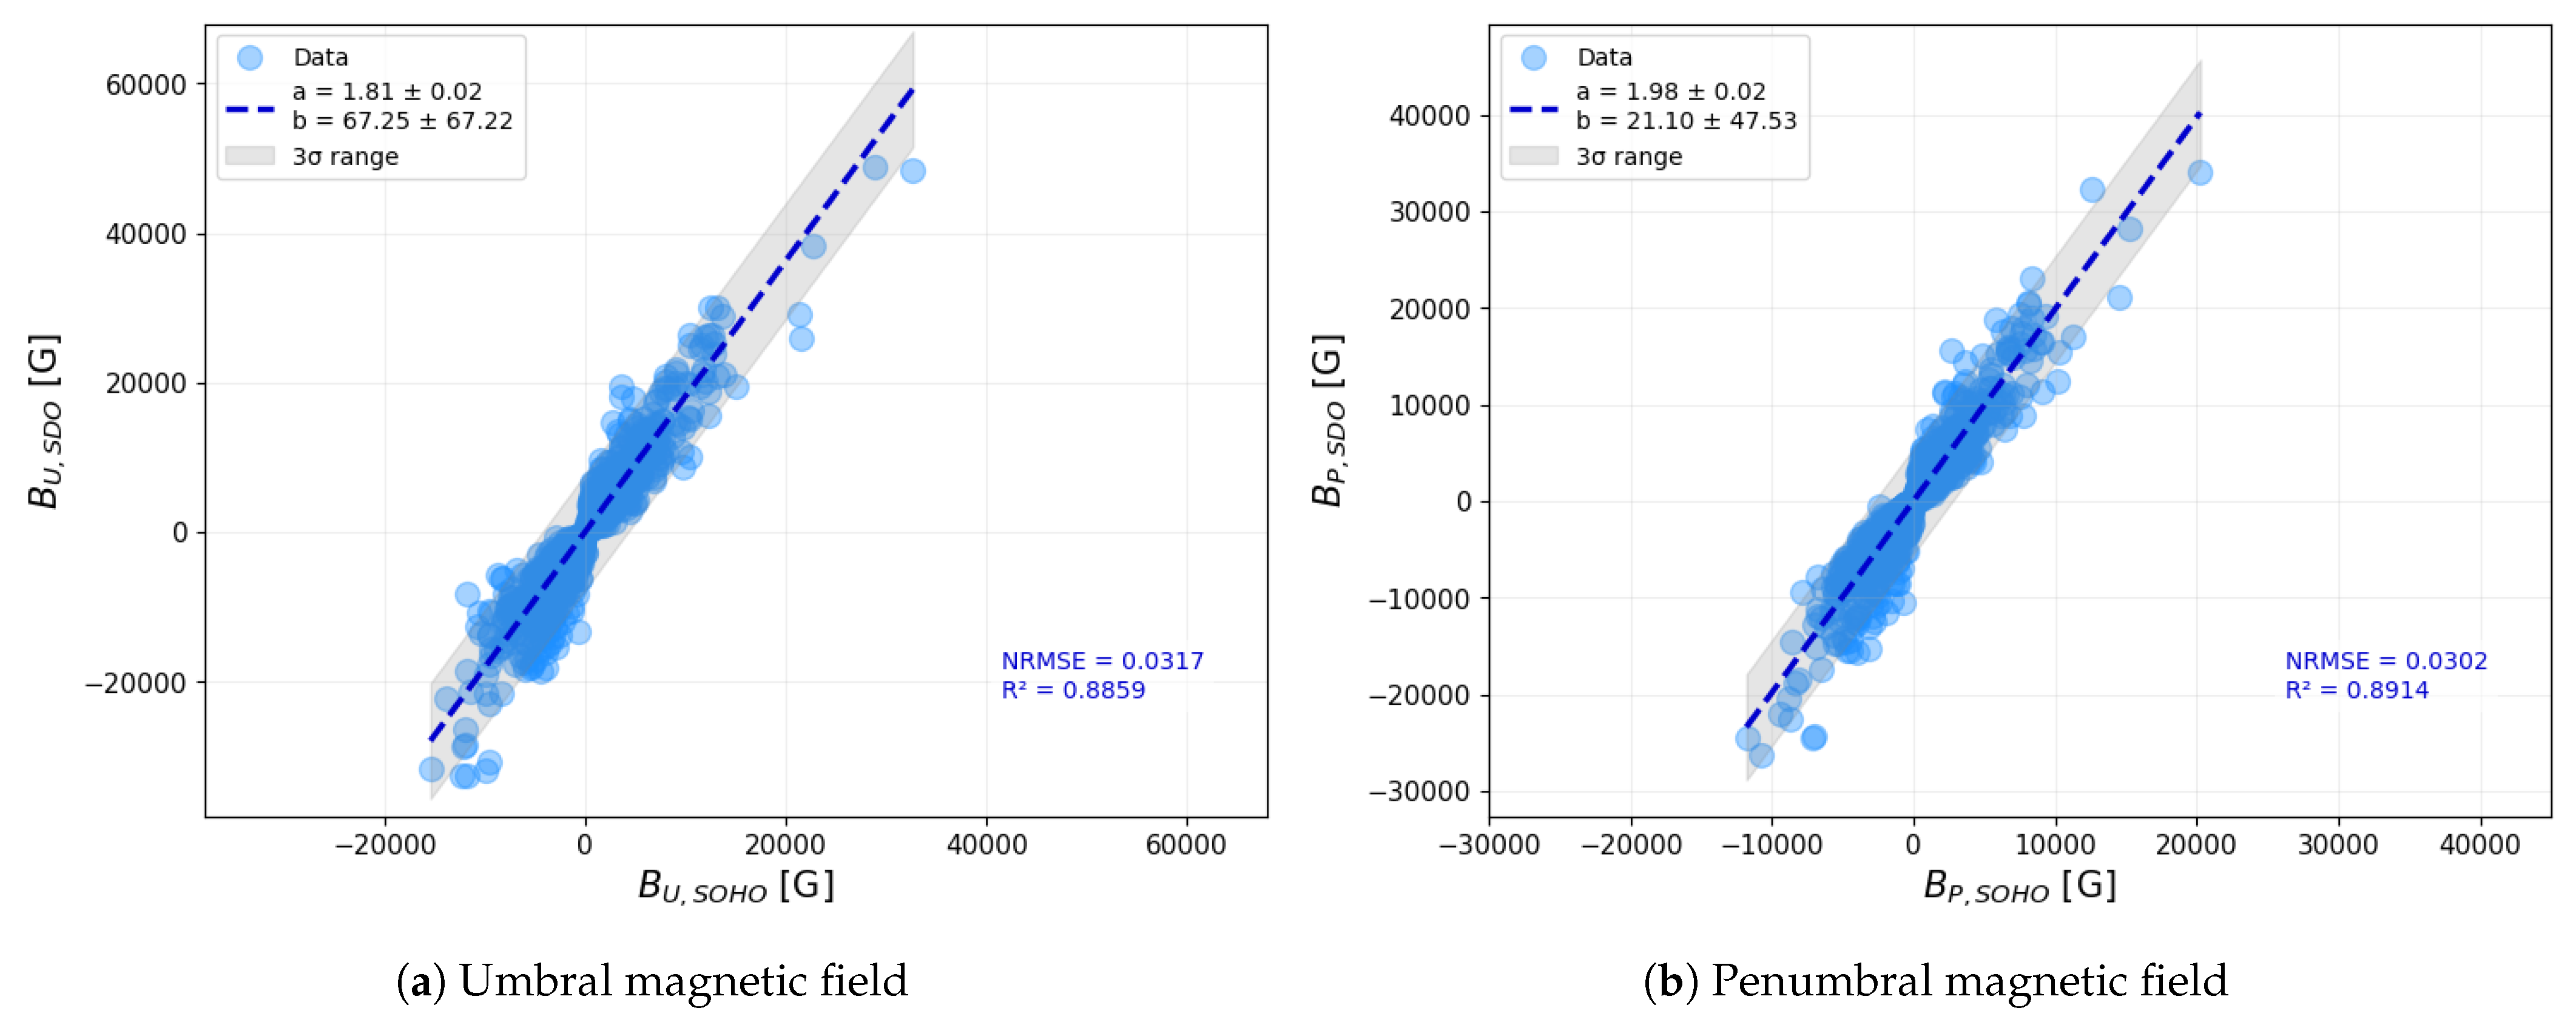
Figure 16, where umbral magnetic field values are presented in the left-hand-side panel, and penumbral values are shown on the right. The overall correlation structure seen here exhibits slight differences compared to the correlation obtained using unsigned values, as seen in
Figure 7, providing additional insight into the asymmetry between the polarities.
This polarity-resolved analysis highlights the importance of considering magnetic field polarity explicitly in cross-calibration efforts and suggests that treating positive and negative polarities identically may obscure subtle but important systematic differences between the datasets.

