
Neutron Decay Anomaly and Its Effects on Neutron Star Properties


Abstract
1. Introduction
2. Methodology
2.1. RMF Model Lagrangian
2.2. Neutron Decay DM Model
2.3. Macroscopic Properties of NS
3. Result and Discussion
3.1. Coupling Constants in RMF Models
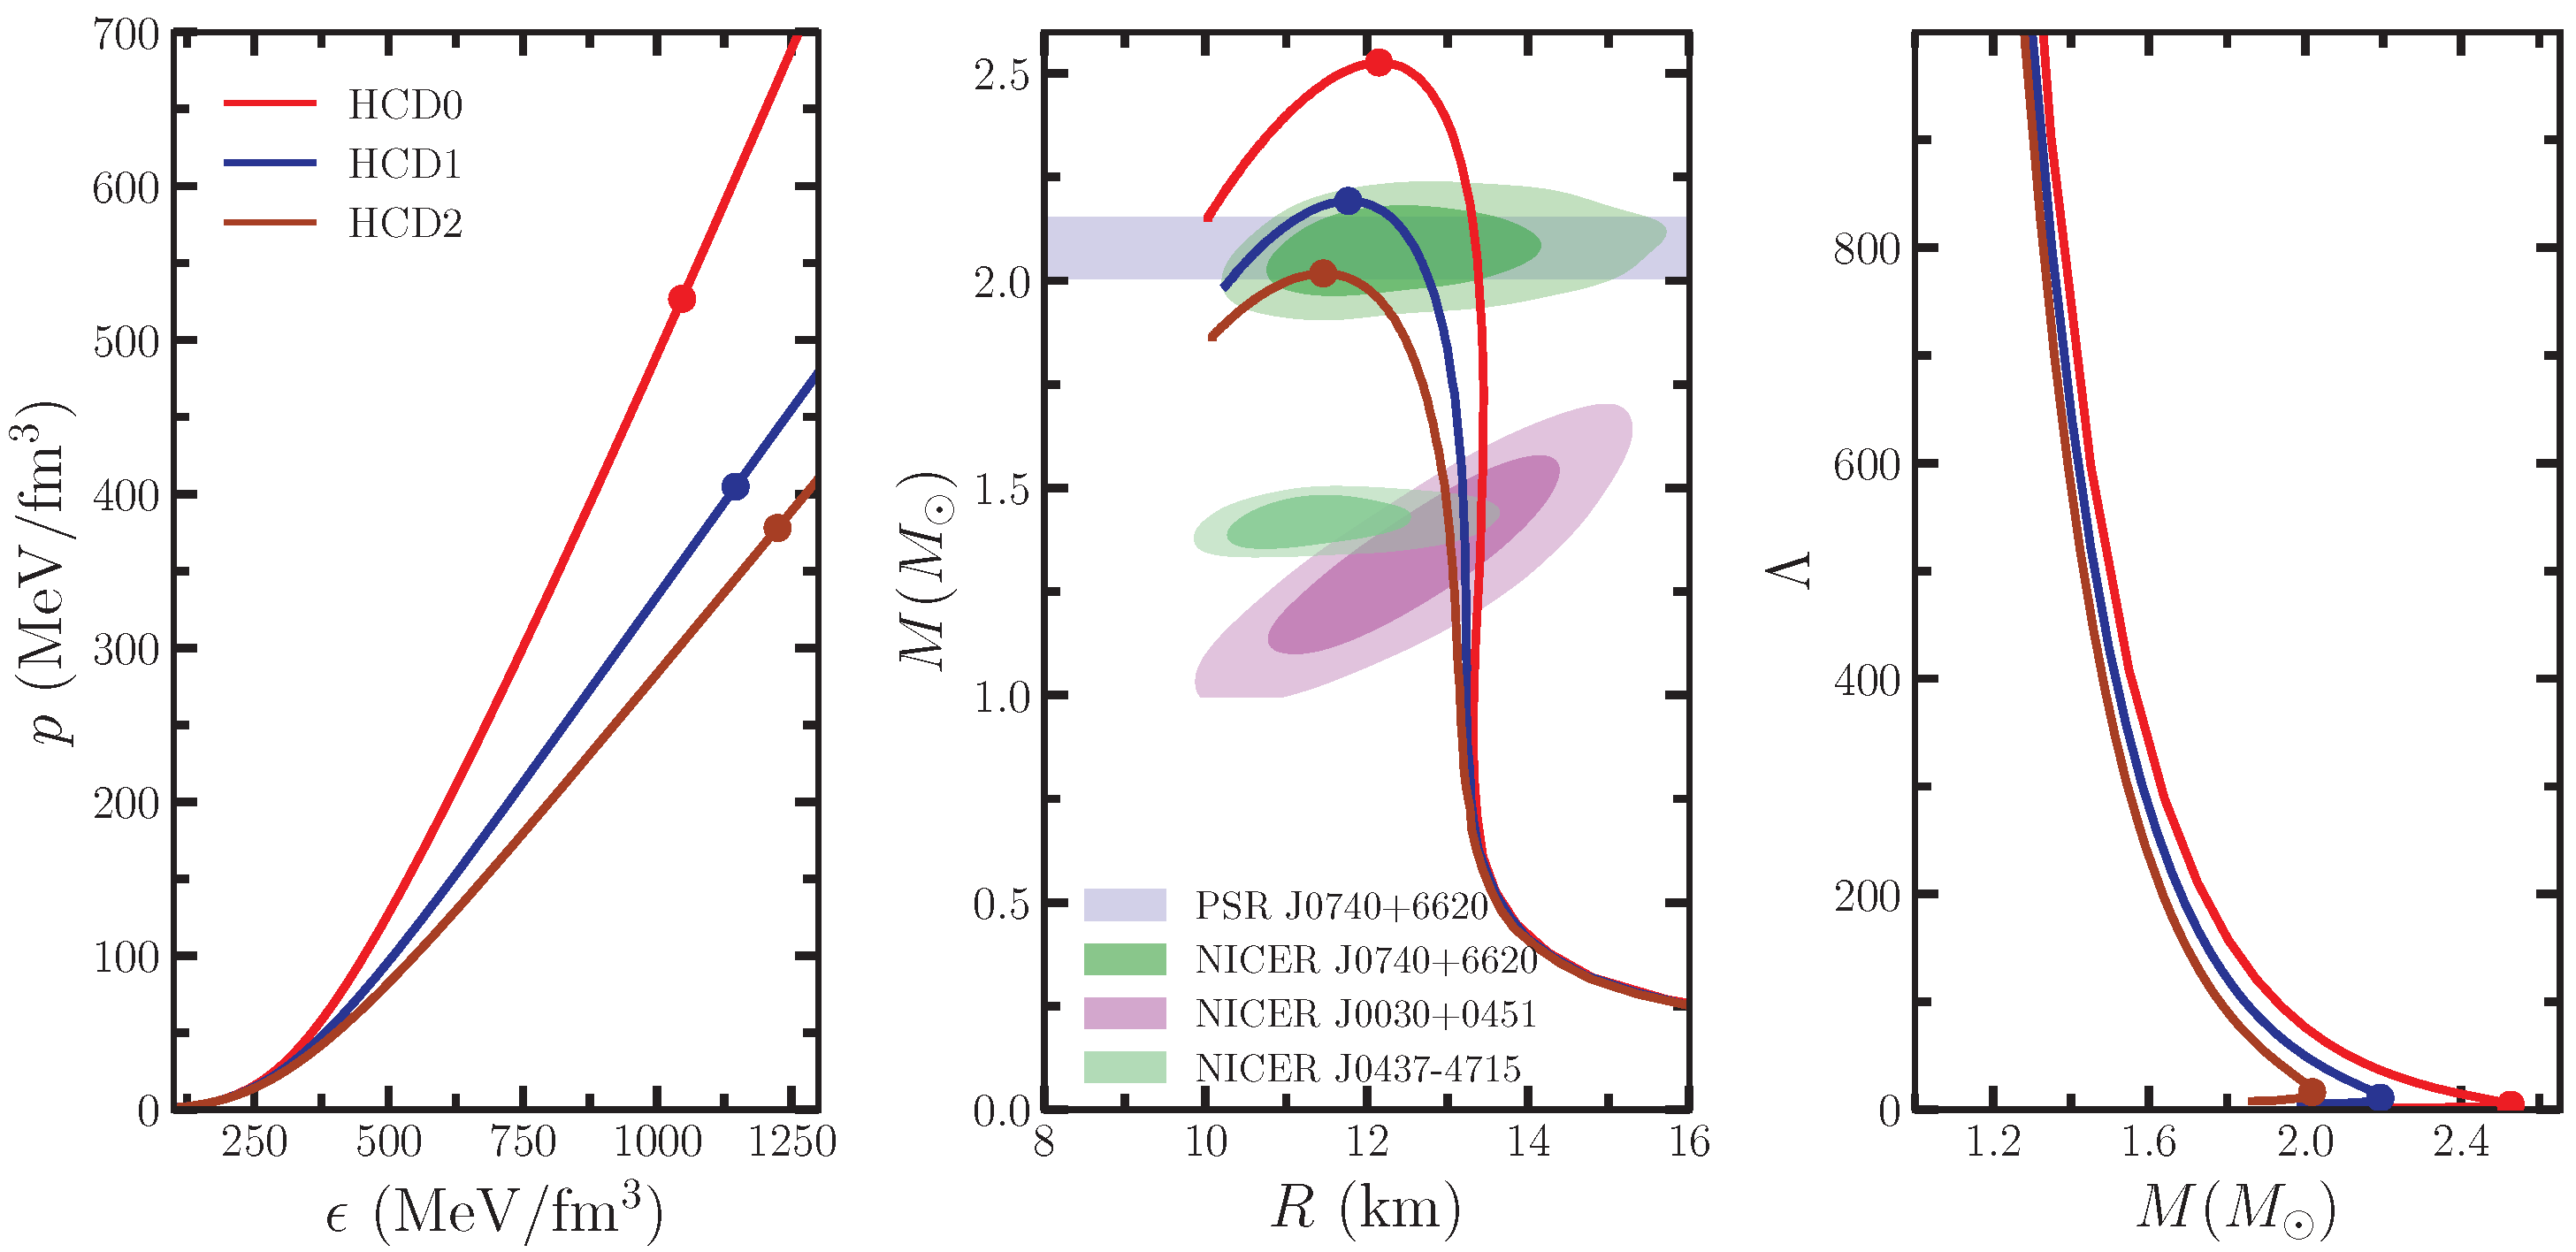
3.2. EOSs, Relations, and Tidal Deformability
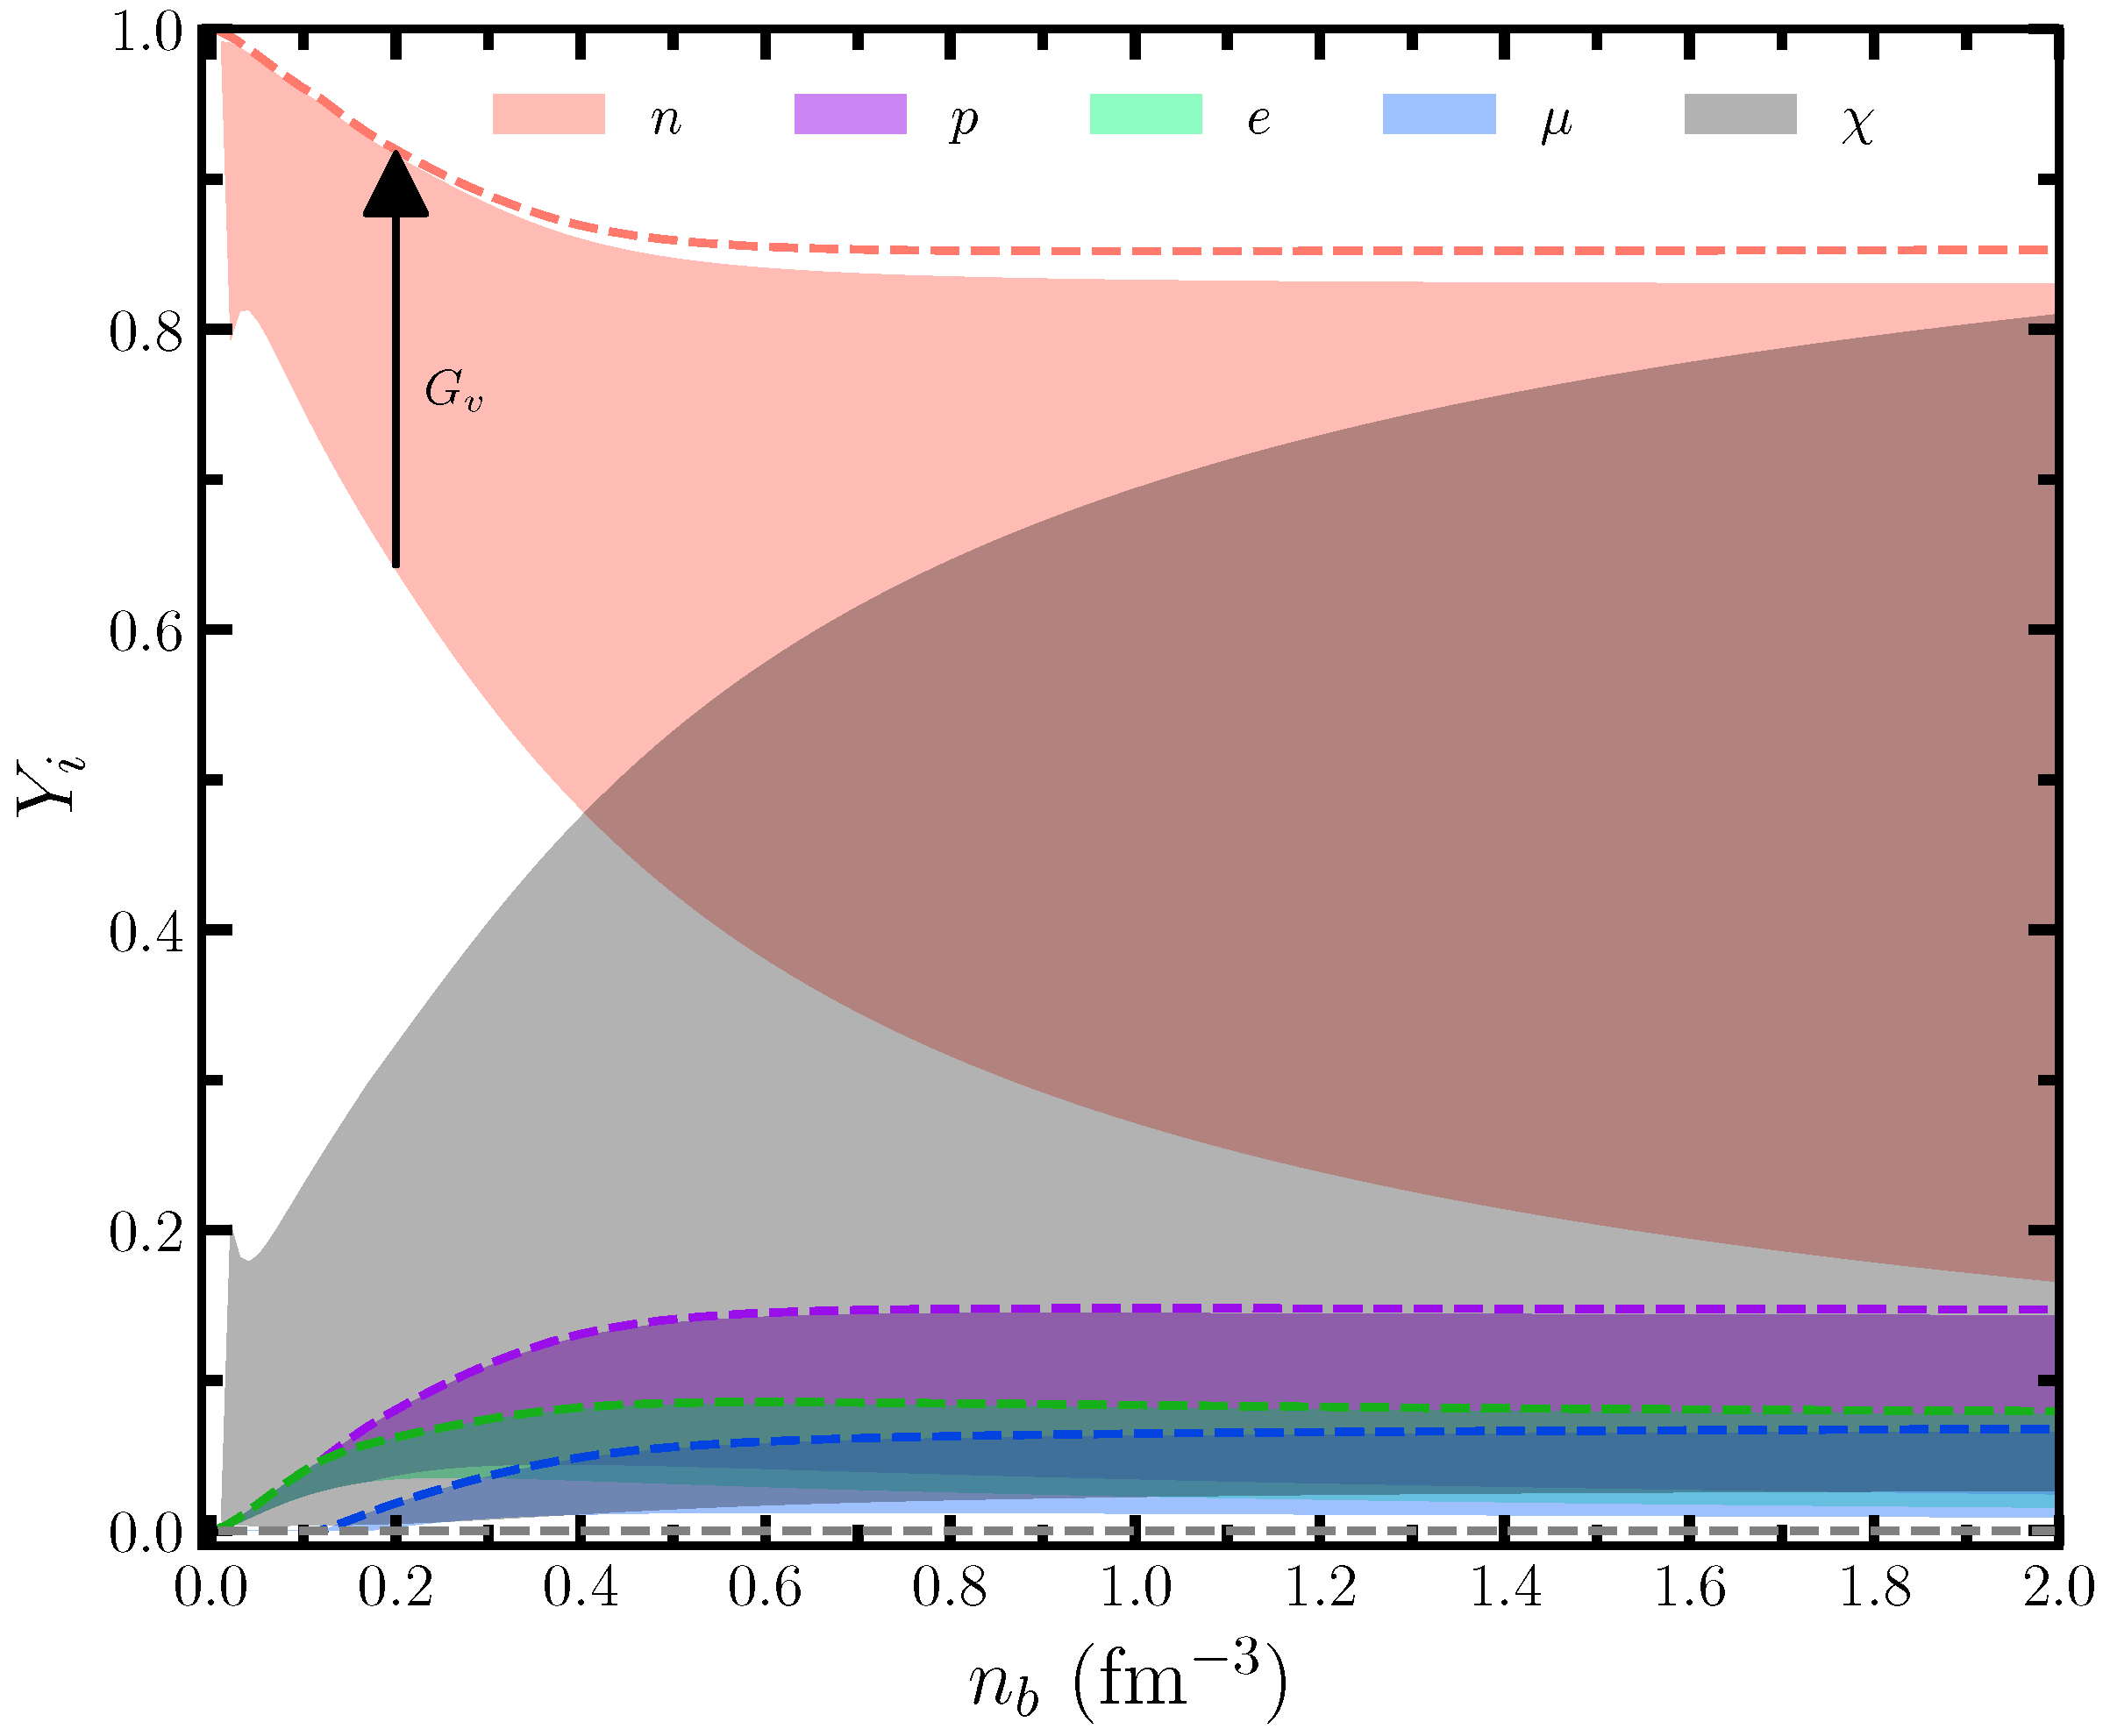
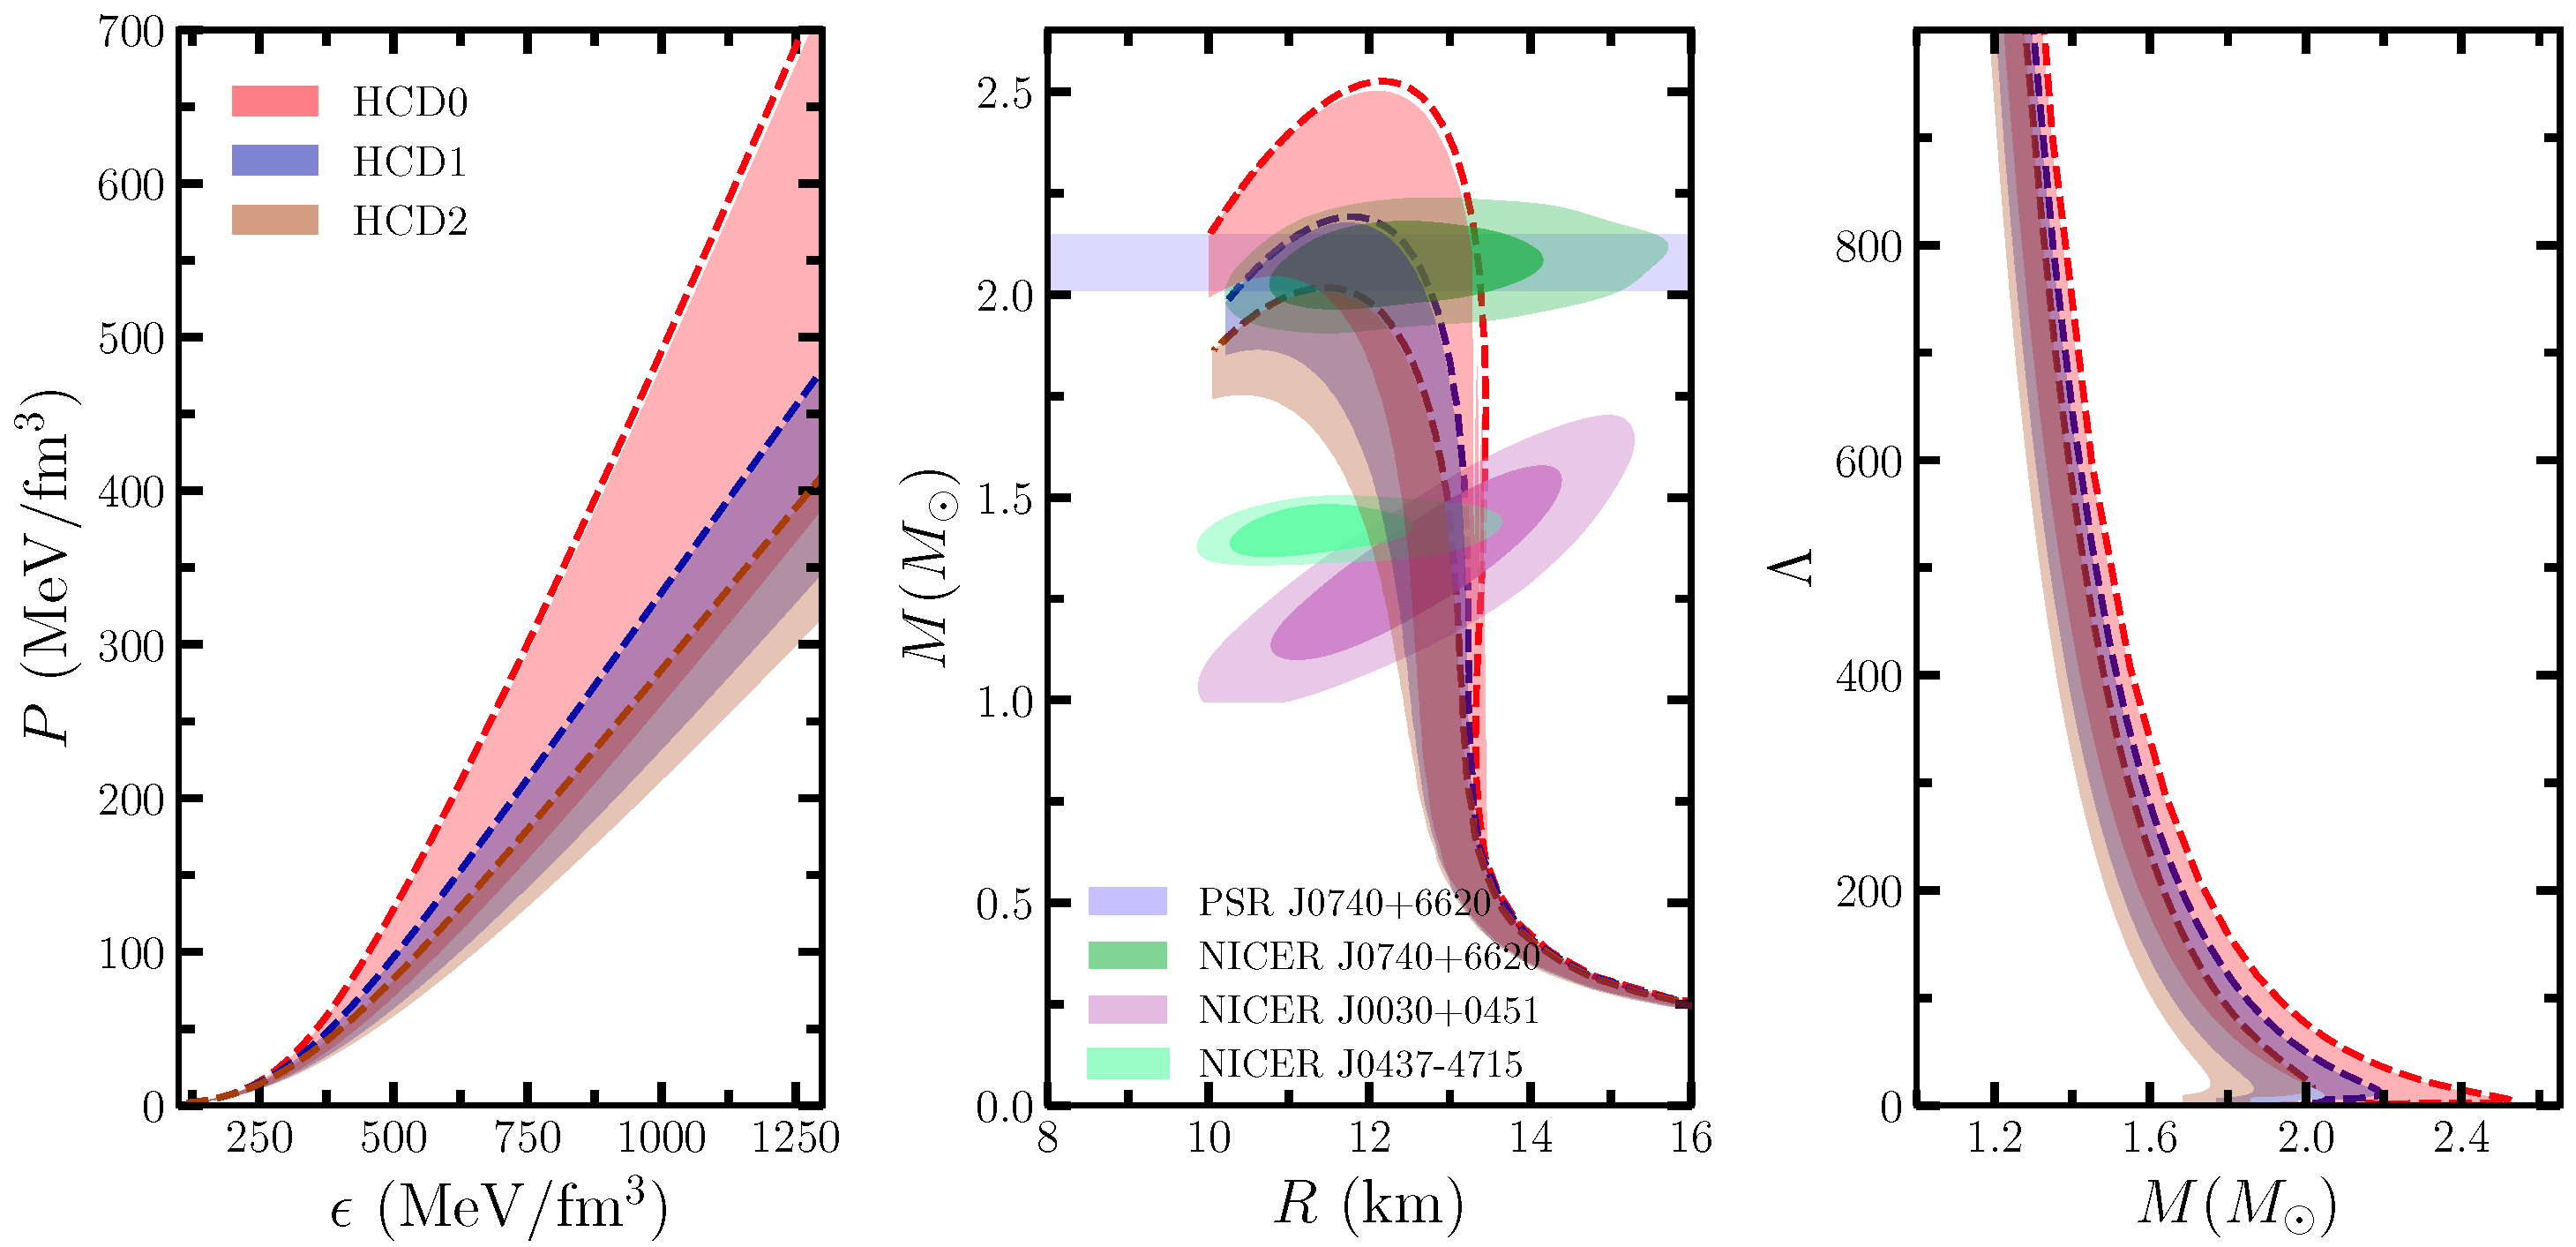
3.3. Effects of NDA on Properties of NSs
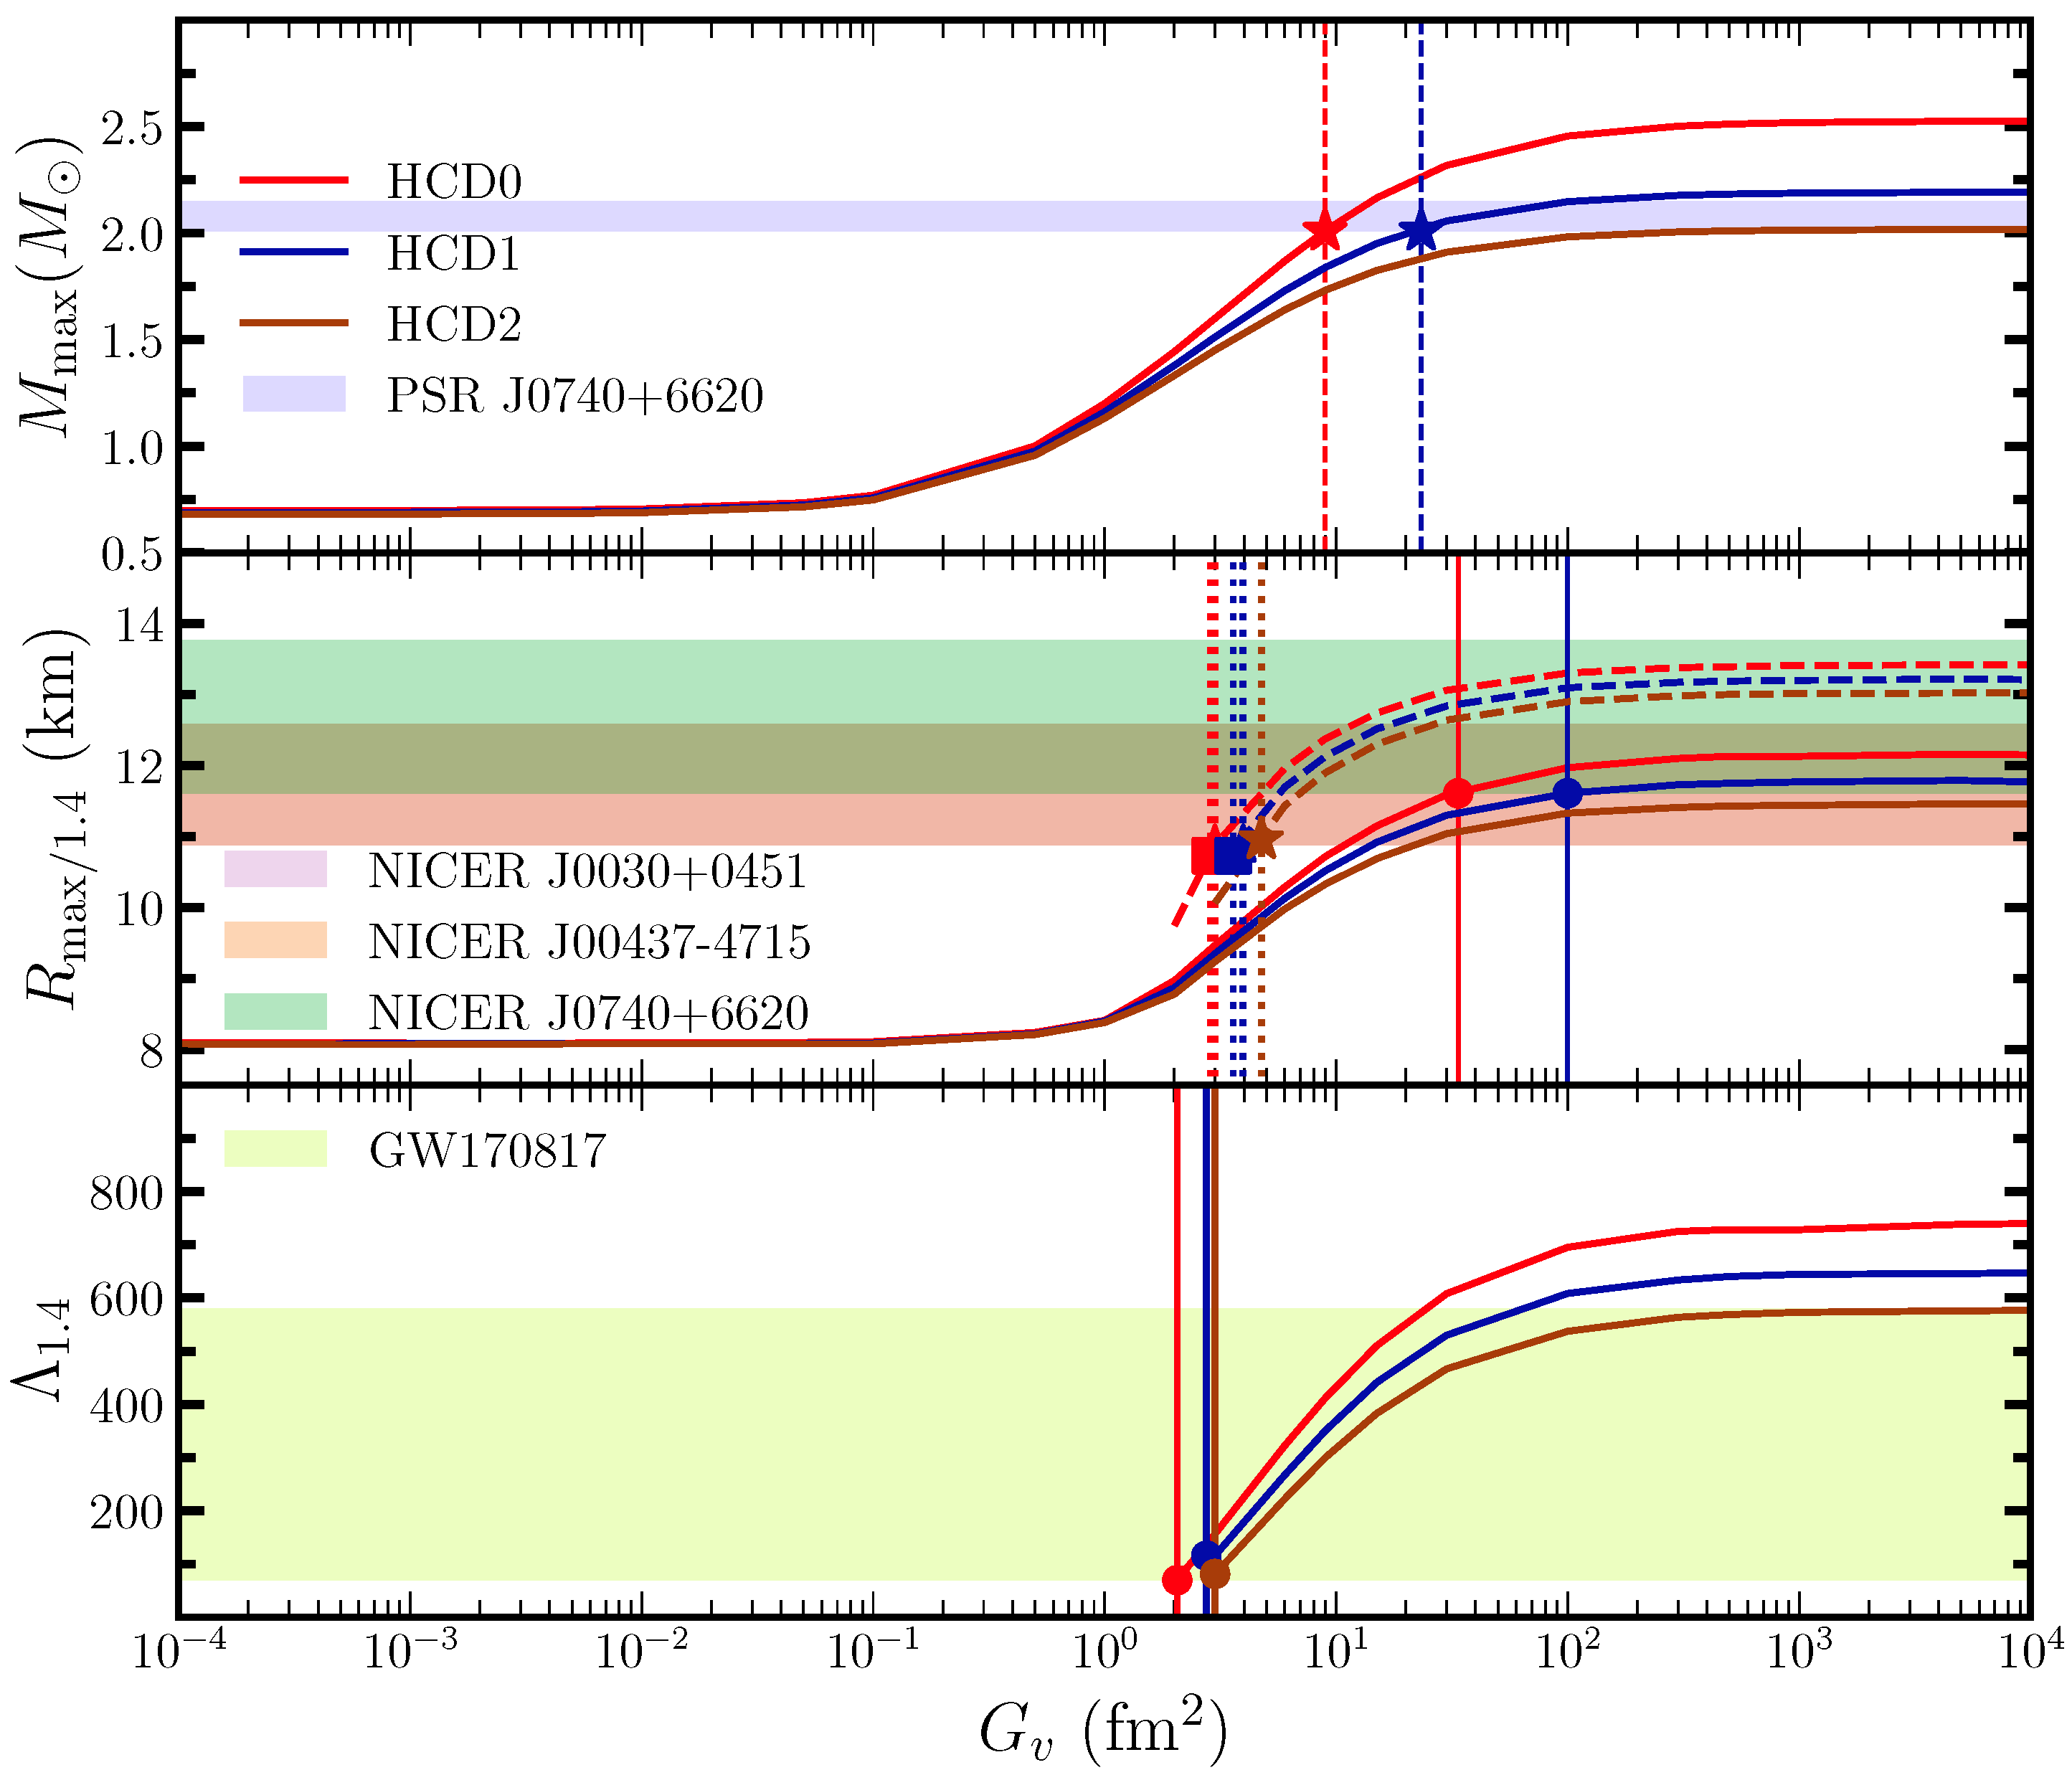
3.4. Constraints on from NS Observations
- 1.
- Maximum mass limit imposed by the PSR J0740+6620 having mass [46].
- 2.
- 3.
- Tidal deformability constraints by GW170817 event [50], .
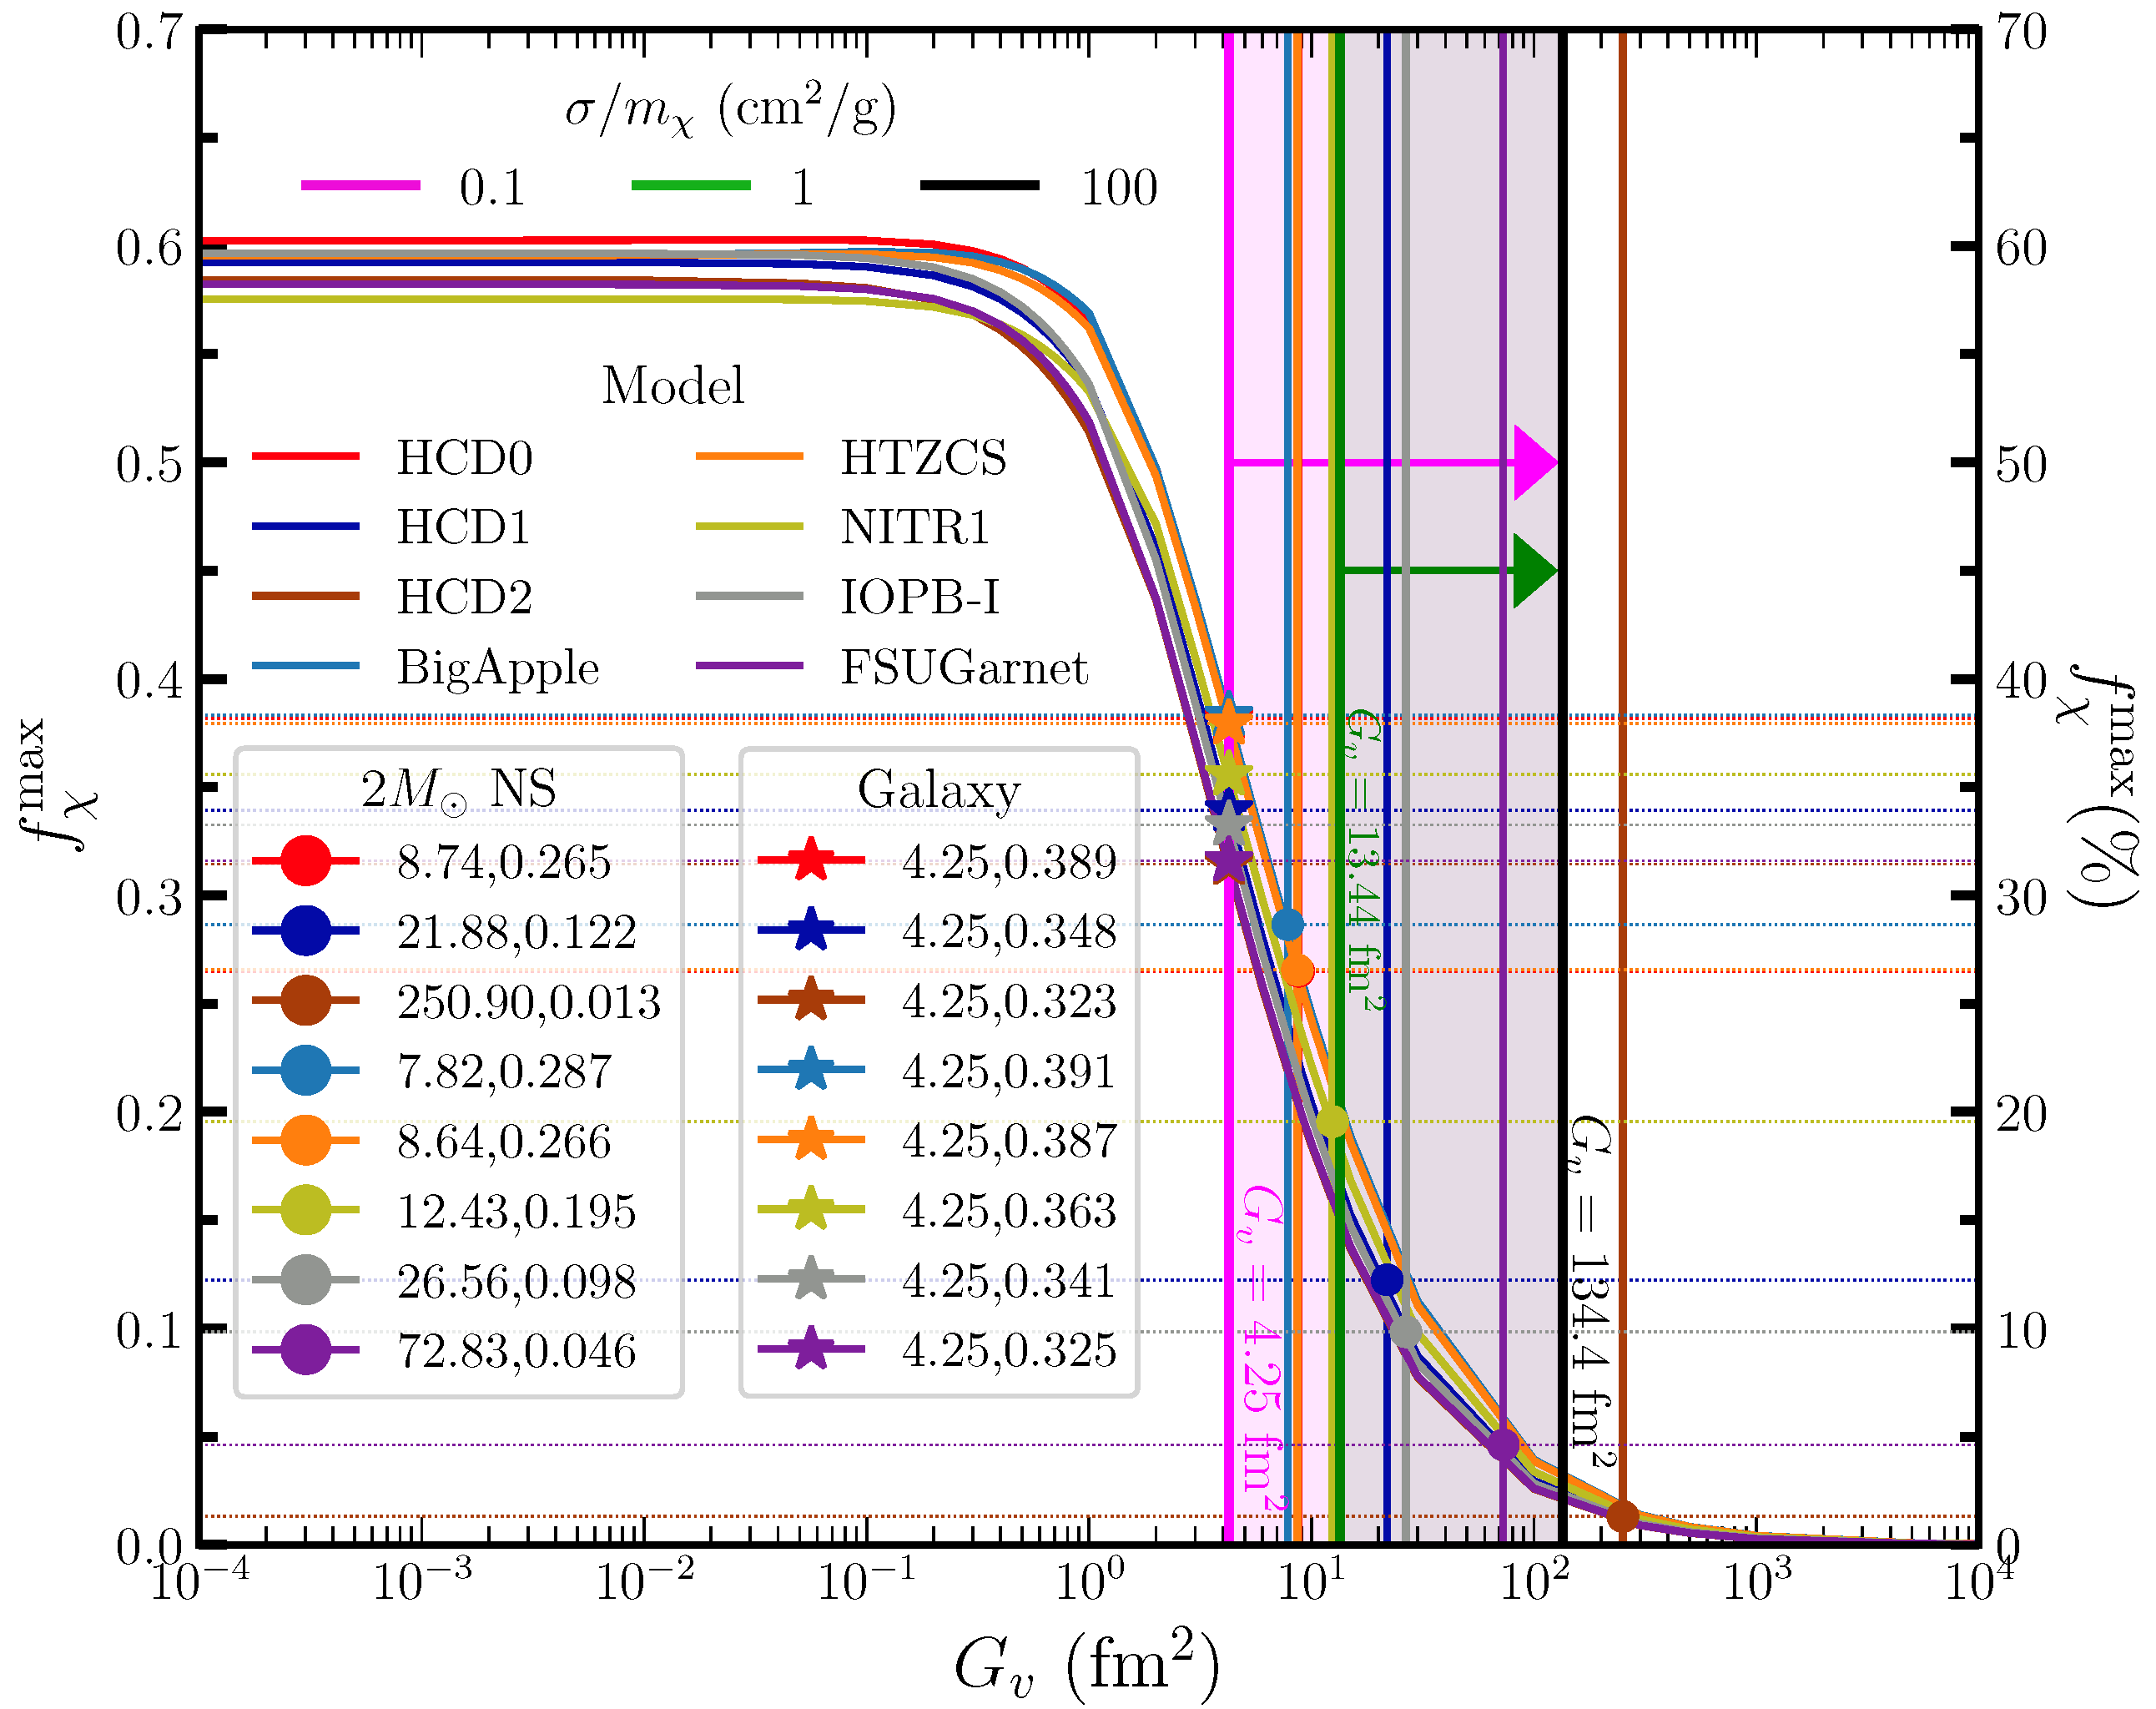
3.5. Constraints on and DM Fraction with Galaxy Cluster Data
4. Conclusions
Author Contributions
Funding
Data Availability Statement
Acknowledgments
Conflicts of Interest
| 1 |
References
- Navas, S.; Amsler, C.; Gutsche, T.; Hanhart, C.; Hernández-Rey, J.; Lourenço, C.; Masoni, A.; Mikhasenko, M.; Mitchell, E. Review of particle physics. Phys. Rev. D 2024, 110, 030001. [Google Scholar] [CrossRef]
- Czarnecki, A.; Marciano, W.J.; Sirlin, A. Neutron Lifetime and Axial Coupling Connection. Phys. Rev. Lett. 2018, 120, 202002. [Google Scholar] [CrossRef]
- Fornal, B.; Grinstein, B. Dark Matter Interpretation of the Neutron Decay Anomaly. Phys. Rev. Lett. 2018, 120, 191801. [Google Scholar] [CrossRef] [PubMed]
- Baym, G.; Beck, D.H.; Geltenbort, P.; Shelton, J. Testing Dark Decays of Baryons in Neutron Stars. Phys. Rev. Lett. 2018, 121, 061801. [Google Scholar] [CrossRef]
- McKeen, D.; Nelson, A.E.; Reddy, S.; Zhou, D. Neutron Stars Exclude Light Dark Baryons. Phys. Rev. Lett. 2018, 121, 061802. [Google Scholar] [CrossRef] [PubMed]
- Tang, Z.; Blatnik, M.; Broussard, L.J.; Choi, J.H.; Clayton, S.M.; Cude-Woods, C.; Currie, S.; Fellers, D.E.; Fries, E.M.; Geltenbort, P.; et al. Search for the Neutron Decay n→X + γ, Where X is a Dark Matter Particle. Phys. Rev. Lett. 2018, 121, 022505. [Google Scholar] [CrossRef]
- Sun, X.; Adamek, E.; Allgeier, B.; Blatnik, M.; Bowles, T.J.; Broussard, L.J.; Brown, M.A.P.; Carr, R.; Clayton, S.; Cude-Woods, C.; et al. Search for dark matter decay of the free neutron from the UCNA experiment: n→χ + e+e−. Phys. Rev. C 2018, 97, 052501. [Google Scholar] [CrossRef]
- Motta, T.F.; Guichon, P.A.M.; Thomas, A.W. Neutron to dark matter decay in neutron stars. Int. J. Mod. Phys. A 2018, 33, 1844020. [Google Scholar] [CrossRef]
- Grinstein, B.; Kouvaris, C.; Nielsen, N.G. Neutron Star Stability in Light of the Neutron Decay Anomaly. Phys. Rev. Lett. 2019, 123, 091601. [Google Scholar] [CrossRef]
- Husain, W.; Motta, T.F.; Thomas, A.W. Consequences of neutron decay inside neutron stars. J. Cosmol. Astropart. Phys. 2022, 2022, 028. [Google Scholar] [CrossRef]
- Strumia, A. Dark Matter interpretation of the neutron decay anomaly. J. High Energy Phys. 2022, 2022, 67. [Google Scholar] [CrossRef]
- Shirke, S.; Ghosh, S.; Chatterjee, D.; Sagunski, L.; Schaffner-Bielich, J. R-modes as a new probe of dark matter in neutron stars. J. Cosmol. Astropart. Phys. 2023, 2023, 008. [Google Scholar] [CrossRef]
- Routaray, P.; Chakrawarty, A.; Kumar, B. Impact of Dark Matter and Rotation on Neutron Star Properties. arXiv 2024, arXiv:2409.02131. [Google Scholar] [CrossRef]
- Bell, N.F.; Busoni, G.; Robles, S.; Virgato, M. Improved treatment of dark matter capture in neutron stars II: Leptonic targets. J. Cosmol. Astropart. Phys. 2021, 2021, 086. [Google Scholar] [CrossRef]
- Ciarcelluti, P.; Sandin, F. Have neutron stars a dark matter core? Phys. Lett. B 2011, 695, 19–21. [Google Scholar] [CrossRef]
- Das, H.C.; Kumar, A.; Kumar, B.; Kumar Biswal, S.; Nakatsukasa, T.; Li, A.; Patra, S.K. Effects of dark matter on the nuclear and neutron star matter. Mon. Not. Roy. Astron. Soc. 2020, 495, 4893–4903. [Google Scholar] [CrossRef]
- Das, H.C.; Kumar, A.; Kumar, B.; Biswal, S.K.; Patra, S.K. Impacts of dark matter on the curvature of the neutron star. J. Cosmol. Astropart. Phys. 2021, 01, 007. [Google Scholar] [CrossRef]
- Das, H.C.; Kumar, A.; Patra, S.K. Effects of dark matter on the in-spiral properties of the binary neutron stars. Mon. Not. Roy. Astron. Soc. 2021, 507, 4053–4060. [Google Scholar] [CrossRef]
- Das, H.C.; Kumar, A.; Biswal, S.K.; Patra, S.K. Impacts of dark matter on the f-mode oscillation of hyperon star. Phys. Rev. D 2021, 104, 123006. [Google Scholar] [CrossRef]
- Das, H.C.; Kumar, A.; Patra, S.K. Dark matter admixed neutron star as a possible compact component in the GW190814 merger event. Phys. Rev. D 2021, 104, 063028. [Google Scholar] [CrossRef]
- Das, H.C.; Kumar, A.; Kumar, B.; Patra, S.K. Dark Matter Effects on the Compact Star Properties. Galaxies 2022, 10, 14. [Google Scholar] [CrossRef]
- Kumar, A.; Das, H.C.; Patra, S.K. Thermal relaxation of dark matter admixed neutron star. Mon. Not. Roy. Astron. Soc. 2022, 513, 1820–1833. [Google Scholar] [CrossRef]
- Routaray, P.; Mohanty, S.R.; Das, H.C.; Ghosh, S.; Kalita, P.J.; Parmar, V.; Kumar, B. Investigating dark matter-admixed neutron stars with NITR equation of state in light of PSR J0952-0607. J. Cosmol. Astropart. Phys. 2023, 2023, 073. [Google Scholar] [CrossRef]
- Kumar, A.; Sotani, H. Impact of dark matter distribution on neutron star properties. Phys. Rev. D 2025, 111, 043016. [Google Scholar] [CrossRef]
- Mu, X.; Hong, B.; Zhou, X.; Feng, Z. The effects of dark matter and hyperons on the macroscopic properties of neutron star. Astrophys. Space Sci. 2023, 368, 67. [Google Scholar] [CrossRef]
- Sen, D.; Guha, A. Implications of feebly interacting dark sector on neutron star properties and constraints from GW170817. Mon. Not. R. Astron. Soc. 2021, 504, 3354–3363. [Google Scholar] [CrossRef]
- Dutra, M.; Lenzi, C.H.; Lourenço, O. Dark particle mass effects on neutron star properties from a short-range correlated hadronic model. Mon. Not. R. Astron. Soc. 2022, 517, 4265–4274. [Google Scholar] [CrossRef]
- Gresham, M.I.; Zurek, K.M. Asymmetric dark stars and neutron star stability. Phys. Rev. D 2019, 99, 083008. [Google Scholar] [CrossRef]
- Rafiei Karkevandi, D.; Shakeri, S.; Sagun, V.; Ivanytskyi, O. Bosonic dark matter in neutron stars and its effect on gravitational wave signal. Phys. Rev. D 2022, 105, 023001. [Google Scholar] [CrossRef]
- Rutherford, N.; Raaijmakers, G.; Prescod-Weinstein, C.; Watts, A. Constraining bosonic asymmetric dark matter with neutron star mass-radius measurements. Phys. Rev. D 2023, 107, 103051. [Google Scholar] [CrossRef]
- Caballero, D.A.; Ripley, J.; Yunes, N. Radial mode stability of two-fluid neutron stars. Phys. Rev. D 2024, 110, 103038. [Google Scholar] [CrossRef]
- Liu, H.M.; Wei, J.B.; Li, Z.H.; Burgio, G.F.; Das, H.C.; Schulze, H.J. Dark matter effects on the properties of neutron stars: Compactness and tidal deformability. Phys. Rev. D 2024, 110, 023024. [Google Scholar] [CrossRef]
- Husain, W.; Thomas, A.W. Novel neutron decay mode inside neutron stars. J. Phys. G Nucl. Part. Phys. 2022, 50, 015202. [Google Scholar] [CrossRef]
- Kumar, A.; Das, H.C.; Biswal, S.K.; Kumar, B.; Patra, S.K. Warm dense matter and cooling of supernovae remnants. Eur. Phys. J. C 2020, 80, 775. [Google Scholar] [CrossRef]
- Pradhan, B.K.; Chatterjee, D.; Gandhi, R.; Schaffner-Bielich, J. Role of vector self-interaction in neutron star properties. Nucl. Phys. A 2023, 1030, 122578. [Google Scholar] [CrossRef]
- Tolman, R.C. Static Solutions of Einstein’s Field Equations for Spheres of Fluid. Phys. Rev. 1939, 55, 364–373. [Google Scholar] [CrossRef]
- Oppenheimer, J.R.; Volkoff, G.M. On Massive Neutron Cores. Phys. Rev. 1939, 55, 374–381. [Google Scholar] [CrossRef]
- Negele, J.W.; Vautherin, D. Neutron star matter at sub-nuclear densities. Nucl. Phys. A 1973, 207, 298–320. [Google Scholar] [CrossRef]
- Baym, G.; Pethick, C.; Sutherland, P. The Ground State of Matter at High Densities: Equation of State and Stellar Models. Astrophys. J. 1971, 170, 299. [Google Scholar] [CrossRef]
- Hinderer, T.; Lackey, B.D.; Lang, R.N.; Read, J.S. Tidal deformability of neutron stars with realistic equations of state and their gravitational wave signatures in binary inspiral. Phys. Rev. D 2010, 81, 123016. [Google Scholar] [CrossRef]
- Hartle, J.B.; Thorne, K.S. Slowly Rotating Relativistic Stars. II. Models for Neutron Stars and Supermassive Stars. Astrophys. J. 1968, 153, 807. [Google Scholar] [CrossRef]
- Thorne, K.S. Nonradial Pulsation of General-Relativistic Stellar Models.IV. The Weakfield Limit. Astrophys. J. 1969, 158, 997. [Google Scholar] [CrossRef]
- Riley, T.E.; Watts, A.L.; Bogdanov, S.; Ray, P.S.; Ludlam, R.M.; Guillot, S.; Arzoumanian, Z.; Baker, C.L.; Bilous, A.V.; Chakrabarty, D.; et al. A NICER View of PSR J0030+0451: Millisecond Pulsar Parameter Estimation. Astrophys. J. Lett. 2019, 887, L21. [Google Scholar] [CrossRef]
- Riley, T.E.; Watts, A.L.; Ray, P.S.; Bogdanov, S.; Guillot, S.; Morsink, S.M.; Bilous, A.V.; Arzoumanian, Z.; Choudhury, D.; Deneva, J.S.; et al. A NICER View of the Massive Pulsar PSR J0740+6620 Informed by Radio Timing and XMM-Newton Spectroscopy. Astrophys. J. Lett. 2021, 918, L27. [Google Scholar] [CrossRef]
- Choudhury, D.; Salmi, T.; Vinciguerra, S.; Riley, T.E.; Kini, Y.; Watts, A.L.; Dorsman, B.; Bogdanov, S.; Guillot, S.; Ray, P.S.; et al. A NICER View of the Nearest and Brightest Millisecond Pulsar: PSR J0437–4715. Astrophys. J. Lett. 2024, 971, L20. [Google Scholar] [CrossRef]
- Fonseca, E.; Cromartie, H.T.; Pennucci, T.T.; Ray, P.S.; Kirichenko, A.Y.; Ransom, S.M.; Demorest, P.B.; Stairs, I.H.; Arzoumanian, Z.; Guillemot, L.; et al. Refined Mass and Geometric Measurements of the High-mass PSR J0740+6620. Astrophys. J. Lett. 2021, 915, L12. [Google Scholar] [CrossRef]
- Chen, W.C.; Piekarewicz, J. Building relativistic mean field models for finite nuclei and neutron stars. Phys. Rev. C 2014, 90, 044305. [Google Scholar] [CrossRef]
- Zhu, Z.; Li, A.; Hu, J.; Shen, H. Equation of state of nuclear matter and neutron stars: Quark mean-field model versus relativistic mean-field model. Phys. Rev. C 2023, 108, 025809. [Google Scholar] [CrossRef]
- Drischler, C.; Carbone, A.; Hebeler, K.; Schwenk, A. Neutron matter from chiral two- and three-nucleon calculations up to N3LO. Phys. Rev. C 2016, 94, 054307. [Google Scholar] [CrossRef]
- Abbott, B.P.; Abbott, R.; Abbott, T.D.; Acernese, F.; Ackley, K.; Adams, C.; Adams, T.; Addesso, P.; Adhikari, R.X.; Adya, V.B.; et al. GW170817: Measurements of Neutron Star Radii and Equation of State. Phys. Rev. Lett. 2018, 121, 161101. [Google Scholar] [CrossRef]
- Shirke, S.; Pradhan, B.K.; Chatterjee, D.; Sagunski, L.; Schaffner-Bielich, J. Effects of dark matter on f-mode oscillations of neutron stars. Phys. Rev. D 2024, 110, 063025. [Google Scholar] [CrossRef]
- Vinciguerra, S.; Salmi, T.; Watts, A.L.; Choudhury, D.; Riley, T.E.; Ray, P.S.; Bogdanov, S.; Kini, Y.; Guillot, S.; Chakrabarty, D.; et al. An Updated Mass–Radius Analysis of the 2017–2018 NICER Data Set of PSR J0030+0451. Astrophys. J. 2024, 961, 62. [Google Scholar] [CrossRef]
- Salmi, T.; Vinciguerra, S.; Choudhury, D.; Riley, T.E.; Watts, A.L.; Remillard, R.A.; Ray, P.S.; Bogdanov, S.; Guillot, S.; Arzoumanian, Z.; et al. The Radius of PSR J0740+6620 from NICER with NICER Background Estimates. Astrophys. J. 2022, 941, 150. [Google Scholar] [CrossRef]
- Fattoyev, F.J.; Horowitz, C.J.; Piekarewicz, J.; Reed, B. GW190814: Impact of a 2.6 solar mass neutron star on the nucleonic equations of state. Phys. Rev. C 2020, 102, 065805. [Google Scholar] [CrossRef]
- Das, H.C.; Kumar, A.; Kumar, B.; Biswal, S.K.; Patra, S.K. BigApple force and its implications to finite nuclei and astrophysical objects. Int. J. Mod. Phys. E 2021, 30, 2150088. [Google Scholar] [CrossRef]
- Hornick, N.; Tolos, L.; Zacchi, A.; Christian, J.E.; Schaffner-Bielich, J. Relativistic parameterizations of neutron matter and implications for neutron stars. Phys. Rev. C 2018, 98, 065804. [Google Scholar] [CrossRef]
- Routaray, P.; Das, H.C.; Pattnaik, J.A.; Kumar, B. Constraining neutron star properties and dark matter admixture with the NITR-I equation of state: Insights from observations and universal relations. Int. J. Mod. Phys. E 2024, 33, 2450052. [Google Scholar] [CrossRef]
- Kumar, B.; Patra, S.K.; Agrawal, B.K. New relativistic effective interaction for finite nuclei, infinite nuclear matter, and neutron stars. Phys. Rev. C 2018, 97, 045806. [Google Scholar] [CrossRef]
- Parmar, V.; Das, H.C.; Kumar, A.; Sharma, M.K.; Patra, S.K. Crustal properties of a neutron star within an effective relativistic mean-field model. Phys. Rev. D 2022, 105, 043017. [Google Scholar] [CrossRef]
- Chen, W.C.; Piekarewicz, J. Searching for isovector signatures in the neutron-rich oxygen and calcium isotopes. Phys. Lett. B 2015, 748, 284–288. [Google Scholar] [CrossRef]
- Girmohanta, S.; Shrock, R. Cross section calculations in theories of self-interacting dark matter. Phys. Rev. D 2022, 106, 063013. [Google Scholar] [CrossRef]
- Tulin, S.; Yu, H.B.; Zurek, K.M. Resonant Dark Forces and Small-Scale Structure. Phys. Rev. Lett. 2013, 110, 111301. [Google Scholar] [CrossRef] [PubMed]
- Tulin, S.; Yu, H.B.; Zurek, K.M. Beyond collisionless dark matter: Particle physics dynamics for dark matter halo structure. Phys. Rev. D 2013, 87, 115007. [Google Scholar] [CrossRef]
- Tulin, S.; Yu, H.B. Dark matter self-interactions and small scale structure. Phys. Rep. 2018, 730, 1–57. [Google Scholar] [CrossRef]
- Loeb, A.; Weiner, N. Cores in Dwarf Galaxies from Dark Matter with a Yukawa Potential. Phys. Rev. Lett. 2011, 106, 171302. [Google Scholar] [CrossRef] [PubMed]
- Kaplinghat, M.; Tulin, S.; Yu, H.B. Dark Matter Halos as Particle Colliders: Unified Solution to Small-Scale Structure Puzzles from Dwarfs to Clusters. Phys. Rev. Lett. 2016, 116, 041302. [Google Scholar] [CrossRef]
- Sagunski, L.; Gad-Nasr, S.; Colquhoun, B.; Robertson, A.; Tulin, S. Velocity-dependent self-interacting dark matter from groups and clusters of galaxies. J. Cosmol. Astropart. Phys. 2021, 2021, 024. [Google Scholar] [CrossRef]
- Randall, S.W.; Markevitch, M.; Clowe, D.; Gonzalez, A.H.; Bradač, M. Constraints on the Self-Interaction Cross Section of Dark Matter from Numerical Simulations of the Merging Galaxy Cluster 1E 0657–56. Astrophys. J. 2008, 679, 1173. [Google Scholar] [CrossRef]
- Oh, S.H.; de Blok, W.J.G.; Brinks, E.; Walter, F.; Kennicutt, R.C. Dark and Luminos Matter in Things Dwarf Galaxies. Astron. J. 2011, 141, 193. [Google Scholar] [CrossRef]
- Burgio, G.F.; Das, H.C.; Vidaña, I. The nuclear symmetry energy and the neutron skin thickness in nuclei. Front. Astron. Space Sci. 2024, 11, 1505560. [Google Scholar] [CrossRef]

| Model | () | (km) | Astro | EFT | Type | ||||||||
|---|---|---|---|---|---|---|---|---|---|---|---|---|---|
| HCD0 | 9.4544 | 11.7732 | 10.0442 | 1.8514 | −6.4302 | 0.0000 | 0.0225 | 2.52 | 13.42 | 748.93 | ✓ | ✓ | stiff |
| HCD1 | 9.5045 | 11.9267 | 10.1018 | 1.6127 | −3.7633 | 1.4225 | 0.0230 | 2.19 | 13.21 | 647.04 | ✓ | ✓ | inter. |
| HCD2 | 9.5562 | 12.0865 | 10.1604 | 1.3716 | −1.0533 | 2.9216 | 0.0235 | 2.02 | 13.02 | 577.41 | ✓ | ✓ | soft |
Disclaimer/Publisher’s Note: The statements, opinions and data contained in all publications are solely those of the individual author(s) and contributor(s) and not of MDPI and/or the editor(s). MDPI and/or the editor(s) disclaim responsibility for any injury to people or property resulting from any ideas, methods, instructions or products referred to in the content. |
© 2025 by the authors. Licensee MDPI, Basel, Switzerland. This article is an open access article distributed under the terms and conditions of the Creative Commons Attribution (CC BY) license (https://creativecommons.org/licenses/by/4.0/).
Share and Cite
Das, H.C.; Burgio, G.F. Neutron Decay Anomaly and Its Effects on Neutron Star Properties. Universe 2025, 11, 159. https://doi.org/10.3390/universe11050159
Das HC, Burgio GF. Neutron Decay Anomaly and Its Effects on Neutron Star Properties. Universe. 2025; 11(5):159. https://doi.org/10.3390/universe11050159
Chicago/Turabian StyleDas, H. C., and G. F. Burgio. 2025. "Neutron Decay Anomaly and Its Effects on Neutron Star Properties" Universe 11, no. 5: 159. https://doi.org/10.3390/universe11050159
APA StyleDas, H. C., & Burgio, G. F. (2025). Neutron Decay Anomaly and Its Effects on Neutron Star Properties. Universe, 11(5), 159. https://doi.org/10.3390/universe11050159