Abstract
In this paper, we investigate the thread oscillations in a quiescent prominence observed by New Vacuum Solar Telescope at the H line center on 17 April 2024. Each individual thread is traced by the local maximum intensity on the time–distance maps. Although there are numerous threads in this prominence, 24 oscillating threads are identified at eight slits parallel to the solar surface. A sinusoidal function is used to fit them, and about 1.5 cycles of oscillations and a mean period of 27.7 min are detected. We find that all these 24 threads display the oscillation with almost a constant amplitude with an average value of about 0.92 Mm, with no damping or expansion during their lifetimes. Furthermore, we find the oscillations at different positions on a same thread almost have a similar period of 88.7 min in phase, which indicates that the thread oscillations could be triggered by a standing-type wave. Using the typical parameters in the prominence, the magnetic field strength (B) is estimated in the range of 4 G ≤ B ≤ 21 G, which is consistent with the previous results. Our findings would provide the clues for the thread oscillation mechanism in the prominence.
1. Introduction
Solar prominences/filaments are large-scale structures consisting of relatively cool and dense plasma embedded in the surrounding lower corona, which often lie above the magnetic polarity inversion lines [1]. Based on their location, they can be classified as active region (AR) or quiescent prominences/filaments. The latter has a long lifetime of tens days or more. The AR prominences/filaments tend to be more dynamic and short-lived, usually accompany the solar flares or coronal mass ejection (CME) in many studies [2,3,4,5]. Observationally, prominences/filaments have two linked categories of structures, spines and barbs [6,7]. The spine is the horizontal axis of the prominence/filament, while the barb connects the high spine and terminate in the chromosphere.
Different from the filaments located on the solar disk, the prominences are commonly observed as elongated features of a loop or arc shapes on solar limb [8,9]. The quiescent prominences stay in an equilibrium of the balance between the upward magnetic hoop force and the downward magnetic tension of the overlying coronal magnetic field, which is thought to be the spine. Different from the AR prominences, the quiescent prominences are usually observed in the polar crown regions at high latitudes (≥50°). High-resolution observations from the Swedish Solar Telescope (SST) [10] and the Dutch Open Telescope (DOT) [11] have resolved the fine structures such as numerous thin threads in the prominences. These threads are measured with an average width about 0.3″ (∼210 km) and a length between 5″ and 40″ (∼3500–28,000 km). These fine threads are well observed in the filament on the disk and in the prominence on the limb. It is generally thought that these threads outline the thin magnetic flux tubes which are fully filled by the dense and cool plasma to constitute the whole filament or prominence [12,13,14,15,16]. However, Heinzel and Anzer [13] proposed that these fine threads are many magnetic field dips filled with the cool plasma.
Prominences are found to display highly dynamics, and one of the most attractive behaviors is the displacement oscillations [14,16]. The observational findings and theoretical interpretation about the prominence oscillations are well presented in the publications [17,18,19]. Based on the magnitude of the velocity amplitudes, prominence oscillations are classified into large-amplitude (≥20 km s−1) oscillations and small-amplitude (≤3 km s−1) oscillations [20,21]. The larger-amplitude oscillations often are related to the spine and affect a signification portion of the whole prominence volume [22,23,24,25]. These oscillations are usually associated with the solar activities, being triggered by phenomena such as Moreton or EIT waves [26,27,28,29], micro-flares [30], emerging flux [22,23,31], or surges [32]. Small-amplitude oscillations are usually not related to solar activities and only affect a small fraction of the prominence [33,34]. On the other hand, observations of prominences have revealed a great diversity in characteristic periods range from 1 min to 90 min [35,36]. Based on the periods, these oscillations can be classified into four categories: very short periods (≤1 min), short periods (1–20 min), intermediate periods (20–40 min), and long periods (≥40 min) [37,38]. However, using the Hinode/SOT observations, we found that two spines of a prominence exhibits the oscillations with a long period of 98 min [7]. High spatial resolution and high cadence observations have discovered the oscillations of threads within the prominence. For example, Lin et al. [39] discovered the filament thread oscillations with a mean period of 3.6 min in the plane of sky. Using the Hinode/SOT data, Okamoto et al. [13] found some horizontal threads in an active region prominence oscillating vertically in the plane of sky with periods of 130–250 s and amplitudes from 400 to 1900 km. Berger et al. [40] also found transverse oscillations in quiescent prominences with intermediate periods of 20–40 min and amplitudes of 100–250 km; and Ning et al. [41] found that the threads in a quiescent prominence display the oscillation with a dominant period of 5 min. Recently, the prominence threads are found to show the oscillation at a period of 26 min, and some of them display their intensity oscillations with a mean period of 8 min simultaneously [42]. This is because the prominences display lots of vertical threads on the limb, and such threads are thought to be the vertical magnetic field lines [43,44,45,46]. The oscillations are proposed to provide evidence for Alfvén waves propagating in the prominence threads [13,40]. However, the magneto-hydrodynamic (MHD) simulations show that the vertical threads in the prominence are caused by the magnetic Rayleigh–Taylor instability process [47]. Therefore, the nature of the oscillations of the vertical threads in the prominence is still an open issue.
In this paper, using the data from the New Vacuum Solar Telescope (NVST) [48], we study the vertical thread oscillation in a prominence on 17 April 2024. The data analysis and the method are outlined in Section 2, and Section 3 presents the results. The discussions and conclusions are provided in Section 4.
2. Observation and Data Analysis
NVST is a vacuum solar telescope with 985 mm clear aperture located at Fuxian Lake in China at an approximate altitude of 1700 m. It has an imaging system, an adaptive optic system, and a spectrometer for now. The imaging system has two channels, such as H and TiO-band. The H channel is equipped with a tunable Lyot filter with a bandwidth of 0.25 Å, which can record the image in the Årange with a step size of 0.1 Å. In this paper, we studied the quiescent prominence detected by NVST in the H center (6562.8 Å). The field of view (FOV) of these H images is , with a 12 s cadence and a CCD plate scale of 0.165″/pixel [48].
The prominence studied here was located at the solar northwest limb, with a coordinate of N02W59. It was observed by NVST from 02:40 to 05:05 UT on 17 April 2024. Figure 1 shows the H center image of the prominence at 04:06:09 UT. All of the NVST H images are normalized by the quiet Sun, and to eliminate the effect of seeing and aligned with each other based on a cross-correlation algorithm [49]. This prominence is observed with a perpendicular direction to its spine, which has a height of 60 Mm and a cross-section of about 360 Mm2. There are numerous threads almost perpendicular to the solar surface. One end of the most threads is rooted into the solar photosphere, but the other end is suspended into the chromosphere towards the corona. Continuous observations such as the data movie show that these threads are not stationary but highly dynamics and display the oscillations parallel to the solar surface. A bubble is seen in the middle of the prominence ranging from 55 Mm to 65 Mm at the y-axis.
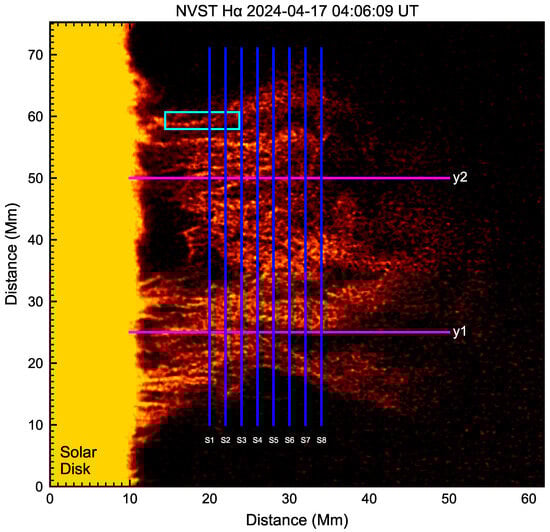
Figure 1.
NVST H image of the quiescent prominence on 17 April 2024 at 04:06:09 UT. The scale in Figure indicates the actual distance in megameters (Mm). The blue lines represent the eight slits marked by S1, S2, S3, S4, S5, S6, S7, S8 to plot the time–distance maps in Figure 2. The distance between the two slits is 2 Mm (about 16 pixels). Two purple lines marked by y1 and y2 are vertical to the solar surface to plot the time–distance maps in Figure 8. The cyan box show a single thread used to be sliced at different positions in Figure 7.
Figure 2 plots the time–distance maps of H intensity along eight slits. The length of slits is about 450 pixels (60 Mm), and the distance between two adjacent slit is same as 15 pixels (2 Mm), which is larger than the thread width, i.e., 1.2 Mm [12,16,37]. The H intensity is integrated by a width of 8 pixels around each slit. The bright regions represent H prominence, while the dark regions indicate the corona on the boundaries of prominence. Figure 2 shows that these threads are dynamics. Some threads display the drifting motions, but some exhibit oscillation motions, and even some are stable during the observational interval. Thus, it is possible that the threads intersect with each other at certain times. For example, the regions from 15 to 25 Mm along y-axis and between 04:10 UT and 04:25 UT at slit of S1; from 10 to 25 Mm and between 03:00 UT and 03:40 UT along slit of S3 in Figure 2 could be several threads overlapping together. Not all but only the threads exhibiting oscillations are studied in this paper.
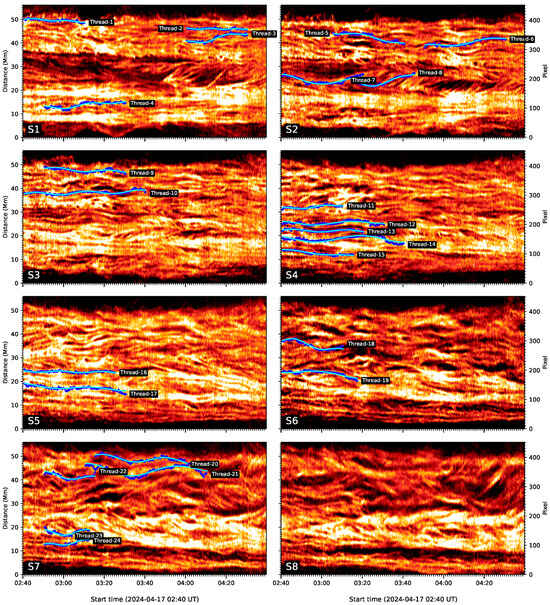
Figure 2.
Time–distance maps along the slits of S1–S8 in Figure 1. The blue dots trace the individual threads with the local maximum intensity. The green lines represent sinusoidal fitting curves. In total, 24 oscillating threads are identified and marked by Thread-1 to Thread-24.
In order to investigate thread oscillations in prominence, we have to trace the thread location at each time. Observationally, the continuous bright lines in the time–distance maps are thought to be the individual thread. Figure 2 shows that there are a lot of the continuous bright lines. However, most of them are fragmented with a short lifetime, which results into being hard to detect the oscillating motions. However, Figure 2 does show that there are some threads exhibiting the oscillations. Some of them are oscillating started at the NVST observation, i.e., at 02:40 UT, and some threads are oscillating in the middle of the observational interval. Firstly, we use naked-eyes to search for the threads displaying oscillations, and then determine the starting point with the local maximum intensity. For example, we judge an oscillating thread along the y-axis from 48 to 51 Mm at 02:40 UT in the time–distance map of S1. It is marked by Thread-1 in Figure 2. The first point is detected at 50 Mm with the local maximum intensity. The second point in the next time could be near 50 Mm, which has a location of 399 pixel along y-axis. Therefore, the second point is identified from the seven points around the center point of 399 pixel at the next cadence, such as 396, 397, 398, 379, 400, 401, 402 pixels along y-axis pixel, with the maximum intensity among them. We find that the second point is located at 400 pixels along y-axis. Then the 400 pixel is the center point of the third point which has a local maximum intensity among seven points around it. We use this method to find the subsequent points on the thread. It is possible that there are two or more points with the local maximum intensity. The point with the shortest distance from the center point is identified as the thread. At a time, if the point has a local maximum intensity less than the noise level, i.e., three times standard deviation plus the mean value at the background, or the several threads cross each other at this point, and the thread is identified to stop here. For example, Thread-1 is stopped at 03:09 UT due to other threads overlapped, while Thread-5 is stopped at 03:42 UT due to the weak brightness less than noise level. In total, 24 individual oscillating threads are identified in the eight time–distance maps in Figure 2. Each thread is traced by the blue dots, and they all display the oscillating behaviors. Actually, none of oscillating threads is detected in the time–distance map at S8. Although there are many threads, either drifting motion or crossed each other with a short lifetime. Slit of S8 is located in the top of prominence, which is highly dynamics resulting in the thread fragmentation.
After detecting the oscillating threads, we use the following function to fit:
where A represents the amplitude, P represents the oscillating period, b represents the drifting speed of the thread. The blue solid lines are fitting results shown in Figure 2. Figure 3, Figure 4 and Figure 5 show the fitting results of 24 threads in detail. For each thread, for example, Thread-1 in Figure 3, top panel plots the time–distance map of H intensity with a small window from 02:40 UT to 03:12 UT in its lifetime. The blue dots trace the location fluctuation on the thread. The green line represents the function fitting. Second panel plots the thread with the blue dots and the drifting motion with the orange line. Thread-1 has a drifting speed of 0.65 km s−1. Third panel shows the oscillating behavior of Thread-1 removing the drifting component. A complete oscillation is found in Thread-1 as the sinusoidal function with a period of 16 min. For the Thread-2, it has a drifting speed of 0.35 km s−1, but the drifting direction is inverse from the Thread-1. Namely, Thread-1 and Thread-2 are drifting parallel to the solar surface, but with opposite directions. In this paper, the thread drifting speeds are estimated but the directions are ignored.
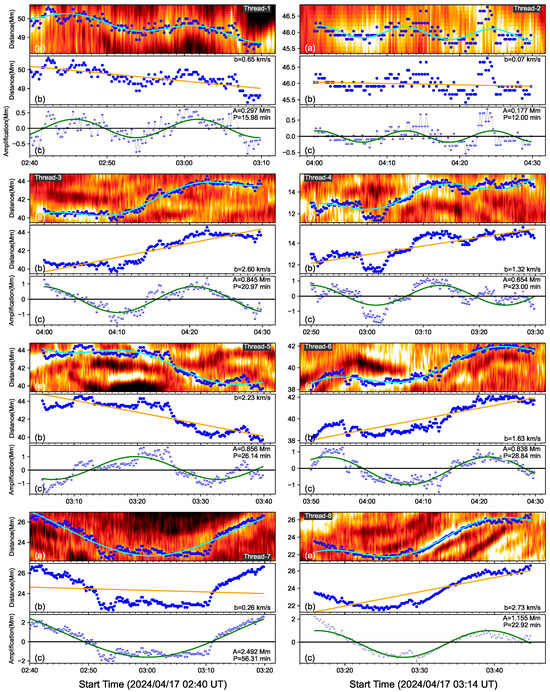
Figure 3.
Zoomed-out image of Thread-1–Thread-8 to show the function fitting in detail. For each thread, the blue dots trace the threads with the local maximum intensity, and the green lines represent the function (1) fitting (a). The orange line is the drifting motion of the threads (b). Each (c), the blue dots are thread behavior removing the drifting motion and the green lines shows the sinusoidal fitting.
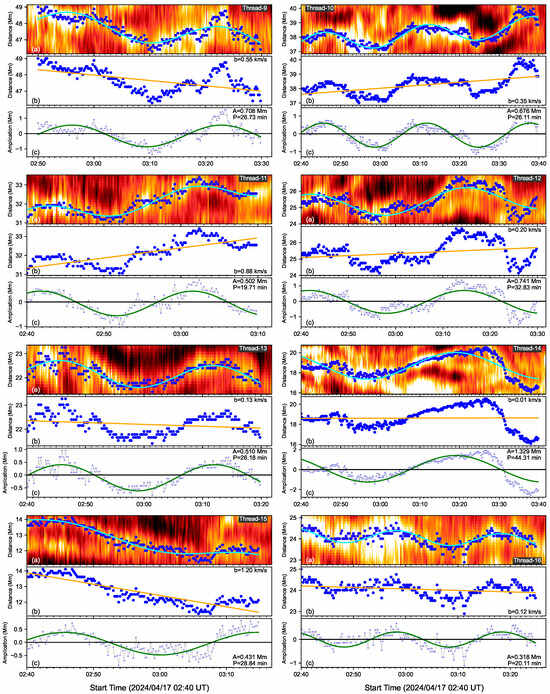
Figure 4.
Same as Figure 3, but for Thread-9–Thread-16.
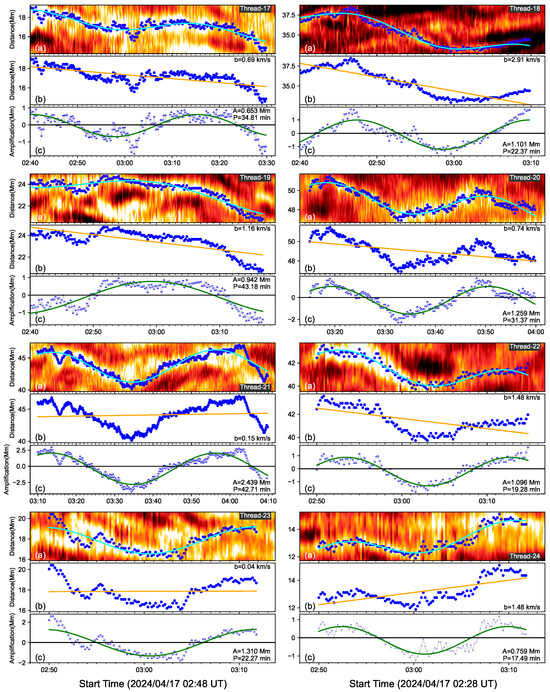
Figure 5.
Same as Figure 3, but for Thread-17–Thread-24.
3. Results
Using the function (1) to fit 24 oscillating threads, the parameters such as the period of P, the amplitude of A and the drifting speed of b, cycles of oscillations and lifetime of oscillations are listed in Table 1. We find the oscillating periods between 12 min and 43.18 min. The amplitude is between 0.18 Mm and 2.49 Mm. The drifting speed is between 0.04 km s−1 and 2.91 km s−1. The oscillating thread lifetime is between 22 min and 60 min. We find that most of the threads could display a complete cycle of oscillation here. The cycle of thread oscillation is identified by dividing the oscillating lifetime by the period. Thread-2 displays two and half cycles of oscillations, with the shortest period of 12 min and the smallest drifting speed of 0.07 km s−1 among 24 threads. Thread-19 has the longest period of 43.18 min. The largest drifting speed of 2.91 km s−1 is detected in Thread-18. Thread-13 and Thread-21 have the longest oscillating lifetime of 60 min but with just under one and half cycles of oscillations. We find that each thread shows its oscillation with a constant amplitude, no damping, and no expansion. Meanwhile, Threads 11–15 on the time–distance map of S4 are almost oscillating together, and they display a similar cycle of 1.5 and almost the same phase, indicating that there might be some interaction between these individual threads; alternatively, they share a collective driver.

Table 1.
The parameters of the displacement oscillation detected in 24 threads.
Figure 6 plots the histograms of the fitting parameters, including the periods (a), amplitudes (b), drifting speeds (c), cycles (d), and the lifetime (e) of oscillations, and the mean values of these parameters are given. About 79% (19/24) of the threads have an oscillating period between 15 min and 35 min; 75% (18/24) of the threads have an oscillating amplitude between 0.5 Mm and 1.5 Mm; 58% (14/24) of the threads have a small drifting speed less than 1 km s−1. Here, the speed direction can be ignored. These threads have a mean period of 27.7 min, a mean amplitude of 0.92 Mm, a mean drifting speed of 1.0 km s−1, a mean cycle of 1.5, and a mean oscillating lifetime of 38.5 min. Most of the threads, 87% (21/24), display one cycle in our observation interval.
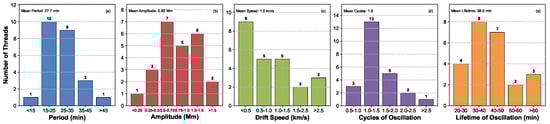
Figure 6.
Histograms of oscillating parameters such as period (a), amplitude (b), drifting speed (c), cycle (d), and lifetime (e) of oscillations. The mean values are given.
The thread oscillating parallel to the solar surface that we found here is consistent with the previous results, indicating the MHD waves from the photosphere through the chromosphere to corona [37,38,39,40]. Such MHD waves are either propagating or standing waves. Several studies discovered the evidences of thread oscillation as the propagating waves, because the phase velocity are detected from the thread oscillations, such as 25 to 100 km s−1 [50], 33 km s−1 [39], 10 km s−1 [32], 26–34 km s−1 [46], and 15–46 km s−1 [20]. These works compare the thread oscillations at different positions or cuts to determine the phase velocity. Using the same method, Song et al. [42] studied the oscillations on the different positions of the same thread and found there is almost no phase difference, indicating that the standing wave, not the propagating wave, triggered the thread oscillations. In order to determine which mode of waves is at work in our observed data, we use a similar method to analyze the oscillations at various positions along the same thread (a cyan box in Figure 1). Figure 7a plots the H image of this thread at 04:06:09 UT. It has a length of 8 Mm. The three slits, ST1, ST2, and ST3, are located in different positions, and the distances between each slit are not the same, i.e., there is a distance of 2.45 Mm (20 pixels) between ST1 and ST2, while there is a distance of 1.1 Mm (9 pixels) between ST2 and ST3. Figure 7b–d show the time–distance maps in its lifetime from 02:40 UT to 04:30 UT, which illustrate that this thread is oscillating at these three slits’ positions. As shown in the method in Figure 3, we traced the thread local maximum intensity using the blue dots and fit their trajectories with the function (1) as the green lines. We obtained oscillating periods of 88.0 min, 84.6 min, and 93.4 min at ST1, ST2, and ST3, respectively. Figure 7 shows that the oscillations at three positions are almost in the same phase, which suggests that the thread oscillation is very likely to be a standing kink wave. Such features are well observed in the oscillations of coronal loops [51,52,53].
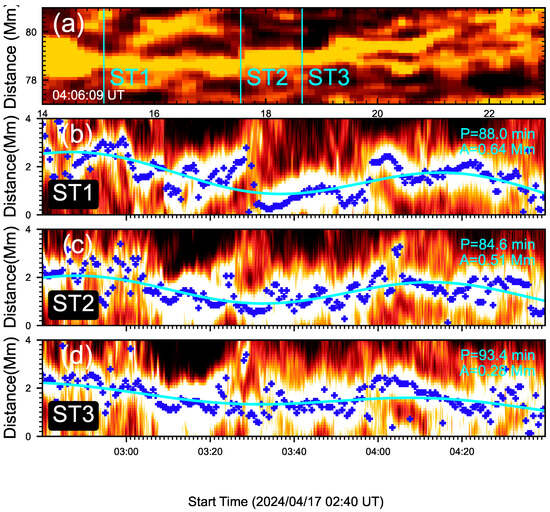
Figure 7.
Oscillations at three positions of the thread encircled by the cyan box in Figure 1. (a), H image of the thread at 04:06:09 UT. (b–d) Time–distance maps corresponding to the perpendicular slits marked by ST1, ST2, and ST3 in (a).
4. Discussions and Conclusions
In this paper, we studied the thread oscillations in a quiescent prominence observed by NVST at H line center on 17 April 2024 from 02:40 UT to 05:05 UT. This prominence is located at the northwest limb of N02W59, and it has a height of 60 Mm above the photosphere and a cross-section about . The high-spatial-resolution (0.165″/pixel) and high-cadence (12 s) observations show that there are numerous threads in the prominence and that they are highly dynamic; these threads display oscillating motions parallel to the solar surface. In order to study the threads’ oscillations, eight slits were set with a distance of 2 Mm, parallel each other across all the prominence. Using the threads to plot the time–distance maps, we saw that the threads exhibit typical behaviors, such as drifting motion and oscillations. Based on our data, we developed a method to trace the local maximum intensity to identify each individual thread. Although this prominence has a lot of threads, we just detected the oscillating threads, which display almost one whole cycle of oscillation in this paper. Some threads are ruled out here because it was not possible to detect obvious oscillations during their lifetime. Although three threads, Thread-7, Thread-19, and Thread-13, did not display whole cycles of oscillation during their lifetimes, they did have an obvious oscillation behavior: at least 0.7 cycles of oscillation periods. In total, 24 threads were identified to exhibit the oscillations. Using a sinusoidal function to fit their behavior, we statistically studied the parameters, such as the period, amplitude, drifting speed, cycle, and the lifetime of oscillations. Thread-2 has the shortest period, 12 min, and displays two and half cycles of oscillation in its 30 min lifetime. Most of threads exhibit about 1.3 oscillation cycles. We obtained a mean period of 27.7 min, a mean amplitude of 0.82 Mm, and a mean drifting speed of 1.0 km s−1.We find the minimum period of 12 min in Thread-2 is longer than in the previous results, such as 3.6 min in [39], 3–5 min in [13], 5 min in [41], and 13–17 min [46]; our findings are consistent with the periods of 20–40 min and amplitudes of 2–5 Mm obtained in the Hinode/SOT observations [40]. Meanwhile, consistent with the results from previous observations [40], we find that these 24 threads are oscillating with a mostly constant amplitude in their lifetime, with no damping and no expansion. Song et al. [42] found some threads oscillating with the damping and some threads oscillating with the expansion in another quiescent prominence observed by NVST.
Figure 1 shows our observations with a cross-section of the prominence spine, with the end views of the filament [17]. These vertical threads could be the spine magnetic fields, which either run the full length of the prominence or transition from the spine into the barbs that terminate in the chromosphere. It is generally thought these vertical threads of prominences are cool condensed plasma filled into the vertical magnetic flux tubes. As noted earlier, the observed thread oscillations are interpreted in the context of MHD waves [20,38]. In this paper, we find that a whole thread could triggered by the standing kink wave to oscillate with the same phase. This is most likely the situation of the standing kink waves to trigger the coronal loop oscillations [54,55,56]. We use the relation between kink speed () and internal Alfvén speed ()
where L, P, and , are the length of the thread, the oscillating period, and the external and internal plasma densities, respectively. Here, we assume that the thread is a semi-circle, and that its radii (R) is the same as the prominence height (60 Mm) detected from the NVST image in Figure 1; thus, the thread length can be estimated as follows: L = 188 Mm. Assuming a ratio of / 200 [39] for typical coronal and prominence densities, and combining the observed periods from 12 to 56 min in Table 1, we can obtain ≃ 40–186 km s−1. For an average period of 27.7 min, here, we obtain ≃ 80 km s−1. Once the Alfvén speed is determined, we can estimate the magnetic field strength using the relation such as ; here, is the magnetic permittivity. Since the thread density is unknown parameter, when we assume kg m−3, subsequently, the magnetic field strength (B) is 9 G in this prominence, i.e., 4 G ≤ B ≤ 21 G for the detected thread periods from 12 min to 56 min. This magnetic field is consistent with the previous findings such as several G in [39] and 50 G in [28].
In this paper, we put the slits across all the prominence threads to study the oscillations parallel the solar surface, which is a similar process to that used in previous studies [40,46]. This method ignores the fact that the threads may have different inclinations with respect to each other. This will result in under-representation of the oscillatory behavior in some cases due to non-perpendicular slits, which could be leaded to most oscillation cycles are less than 1.5 here. Namely, our observational duration is about 2.5 h, which should have shown many more instances of thread oscillations with a long lifetime. Figure 3, Figure 4 and Figure 5 show that some oscillating threads are mixed with other threads, and they oscillate with different phase. Thus, an oscillating motion seems to disappear while another new oscillation is excited nearby simultaneously. Probably, these appearing and disappearing behaviors are due to the thread oscillations into or out of the slit surfaces here. If the threads are declining to the solar surface, it is possible to see the thread oscillations along the slit vertical to the solar surface. In order to check this possibility, Figure 8 plots the time–distance maps along two vertical slits of y1 and y2 in Figure 1. As shown in Figure 2, there are lots of threads along this direction and they are high dynamics. Unfortunately, no individual thread displays the oscillations, but all threads exhibit the collectively drifting motions during our observational interval. This fact suggests that the threads have a tendency to oscillate parallel to the solar surface, and the triggered waves are along the vertical direction. On the other hand, we do not identify a thread to exhibit one whole cycle of oscillation on the top of the prominence; in the time–distance map at the S8 slit, there are many threads, but the map only displays the drifting motions. It is possible that the threads on the top of the prominence are fragmented due to the plasma turbulence there. Therefore, the thread oscillations in the prominence need to be studied further.
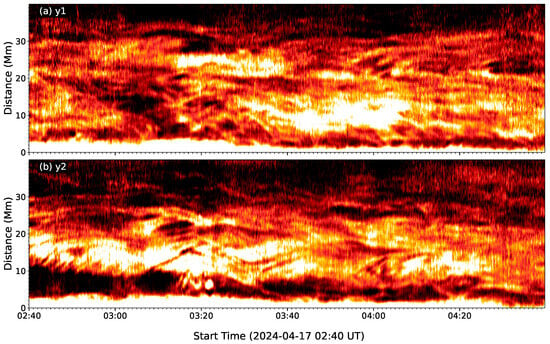
Figure 8.
Time–distance maps along the vertical slits of y1 and y2 in Figure 1. The Y axis is at a height of 40 Mm from the solar surface to the chromosphere.
Author Contributions
Software and methodology, M.G., Y.Y., Y.H. (Yijie Han), G.X. and X.T.; data, K.L. and Y.H. (Yu Huang), writing—original draft preparation, M.G.; writing—review and editing, Z.N. and Y.H. (Yu Huang); supervision, Z.N. All authors have read and agreed to the published version of the manuscript.
Funding
This work is supported by the Strategic Priority Research Program of the Chinese Academy of Sciences, Grant No. XDB0560000. This work is also funded by the National Key R&D Program of China 2022YFF0503002 (2022YFF0503000) and the NSFC under grant 12073081.
Data Availability Statement
The data presented in this study are openly available on the homepage of NVST.
Acknowledgments
We appreciate the teams of NVST for their open data use policy.
Conflicts of Interest
The authors declare no conflicts of interest.
References
- Martin, S.F. Conditions for the Formation and Maintenance of Filaments. Sol. Phys. 1998, 182, 107–137. [Google Scholar] [CrossRef]
- Gilbert, H.R.; Holzer, T.E.; Burkepile, J.T.; Hundhausen, A.J. Active and Eruptive Prominences and Their Relationship to Coronal Mass Ejections. Astrophys. J. 2000, 537, 503–515. [Google Scholar] [CrossRef]
- Hori, K.; Culhane, J.L. Trajectories of microwave prominence eruptions. Astron. Astrophys. 2002, 382, 666–677. [Google Scholar] [CrossRef]
- Gopalswamy, N.; Shimojo, M.; Lu, W.; Yashiro, S.; Shibasaki, K.; Howard, R.A. Prominence Eruptions and Coronal Mass Ejection: A Statistical Study Using Microwave Observations. Astrophys. J. 2003, 586, 562–578. [Google Scholar] [CrossRef]
- Zhuang, B.; Lugaz, N.; Wood, B.E.; Braga, C.R.; Temmer, M.; Gou, T.; Hess, P.; Shaik, S.B.; Mac Cormack, C.; Li, X. Evolution of a Coronal Mass Ejection with an Eruptive Prominence from the Corona to Interplanetary Space. Astrophys. J. 2025, 990, 181. [Google Scholar] [CrossRef]
- Zirker, J.B.; Engvold, O.; Martin, S.F. Counter-streaming gas flows in solar prominences as evidence for vertical magnetic fields. Nature 1998, 396, 440–441. [Google Scholar] [CrossRef]
- Ning, Z.; Cao, W.; Goode, P.R. Behavior of the Spines in a Quiescent Prominence Observed by Hinode/SOT. Astrophys. J. 2009, 707, 1124–1130. [Google Scholar] [CrossRef]
- Gibson, S.E.; Fan, Y. Coronal prominence structure and dynamics: A magnetic flux rope interpretation. J. Geophys. Res. Space Phys. 2006, 111, A12103. [Google Scholar] [CrossRef]
- Parenti, S.; Schmieder, B.; Heinzel, P.; Golub, L. On the Nature of Prominence Emission Observed by SDO/AIAT. Astrophys. J. 2012, 754, 66–74. [Google Scholar] [CrossRef]
- Lin, Y.; Engvold, O.; van der Voort, L.R.; Wiik, J.E.; Berger, T.E. Thin Threads of Solar Filaments. Sol. Phys. 2005, 226, 239–254. [Google Scholar] [CrossRef]
- Heinzel, P.; Anzer, U. Small-scale, Dynamic Bright Blobs in Solar Filaments and Active Regions. Astrophys. J. 2006, 643, L65–L68. [Google Scholar] [CrossRef]
- Lin, Y.; Wiik, J.E.; Engvold, O.; Van Der Voort, L.R.; Frank, Z.A. Solar Filaments and Photospheric Network. Sol. Phys. 2005, 227, 283–297. [Google Scholar] [CrossRef]
- Okamoto, T.J.; Tsuneta, S.; Berger, T.E.; Ichimoto, K.; Katsukawa, Y.; Lites, B.W.; Nagata, S.; Shibata, K.; Shimizu, T.; Shine, R.A.; et al. Coronal Transverse Magnetohydrodynamic Waves in a Solar Prominence. Science 2007, 318, 1577–1580. [Google Scholar] [CrossRef] [PubMed]
- Engvold, O. Observational aspects of prominence oscillations. Waves Oscil. Sol. Atmos. 2008, 247, 152–157. [Google Scholar] [CrossRef]
- Cao, W.; Ning, Z.; Goode, P.R.; Yurchyshyn, V.; Ji, H. Evidence of Filament Upflows Originating from Intensity Oscillations on the Solar Surface. Astrophys. J. Lett. 2010, 719, L95–L98. [Google Scholar] [CrossRef]
- Lin, Y.; Martin, S.; Engvold, O.; van der Voort, L.R.; van Noort, M. On small active region filaments, fibrils and surges. Adv. Space Res. 2008, 42, 803–811. [Google Scholar] [CrossRef]
- Lin, Y. Filament Thread-like Structures and Their Small-amplitude Oscillations. Space Sci. Rev. 2011, 158, 237–266. [Google Scholar] [CrossRef]
- Vial, J.-C.; Engvold, O. Solar Prominences; Astrophysics and Space Science Library; Springer: Berlin/Heidelberg, Germany, 2015; Volume 415. [Google Scholar] [CrossRef]
- Arregui, I.; Oliver, R.; Ballester, J.L. Prominence oscillations. Living Rev. Sol. Phys. 2018, 15, 3. [Google Scholar] [CrossRef]
- Oliver, R.; Ballester, J.L. Oscillations in Quiescent Solar Prominences Observations and Theory (Invited Review). Sol. Phys. 2002, 206, 45–67. [Google Scholar] [CrossRef]
- Oliver, R. Prominence Seismology Using Small Amplitude Oscillations. Space Sci. Rev. 2009, 149, 175–197. [Google Scholar] [CrossRef]
- Isobe, H.; Tripathi, D. Large amplitude oscillation of a polar crown filament in the pre-eruption phase. Astron. Astrophys. 2006, 449, L17–L20. [Google Scholar] [CrossRef]
- Isobe, H.; Tripathi, D.; Archontis, V. Ellerman Bombs and Jets Associated with Resistive Flux Emergence. Astrophys. J. 2007, 657, L53–L56. [Google Scholar] [CrossRef]
- Zhang, Q.; Ou, Y.; Huang, Z.; Song, Y.; Ma, S. Tracking an Eruptive Prominence Using Multiwavelength and Multiview Observations on 2023 March 7. Astrophys. J. 2024, 977, 4. [Google Scholar] [CrossRef]
- Zhang, Q.M.; Lin, M.S.; Yan, X.L.; Dai, J.; Hou, Z.Y.; Li, Y.; Qiu, Y. Two successive EUV waves and a transverse oscillation of a quiescent prominence. Mon. Not. R. Astron. Soc. 2024, 533, 3255–3262. [Google Scholar] [CrossRef]
- Moreton, G.E.; Ramsey, H.E. Recent Observations of Dynamical Phenomena Associated with Solar Flares. Publ. Astron. Soc. Pac. 1960, 72, 357. [Google Scholar] [CrossRef]
- Asai, A.; Ishii, T.T.; Isobe, H.; Kitai, R.; Ichimoto, K.; UeNo, S.; Nagata, S.; Morita, S.; Nishida, K.; Shiota, D.; et al. First Simultaneous Observation of an Hα Moreton Wave, EUV Wave, and Filament/Prominence Oscillations. Astrophys. J. Lett. 2012, 745, 18. [Google Scholar] [CrossRef]
- Shen, Y.; Liu, Y.D.; Chen, P.F.; Ichimoto, K. Simultaneous Transverse Oscillations of a Prominence and a Filament and Longitudinal Oscillation of Another Filament Induced by a Single Shock Wave. Astrophys. J. 2014, 795, 130. [Google Scholar] [CrossRef]
- Zhang, Q.M.; Guo, J.H.; Tam, K.V.; Xu, A.A. Longitudinal filament oscillations enhanced by two C-class flares. Astron. Astrophys. 2020, 635, A132. [Google Scholar] [CrossRef]
- Jing, J.; Lee, J.; Spirock, T.J.; Xu, Y.; Wang, H.; Choe, G.S. Periodic Motion along a Solar Filament Initiated by a Subflare. Astrophys. J. Lett. 2003, 584, L103–L106. [Google Scholar] [CrossRef]
- Xu, X.-Y.; Fang, C.; Chen, P.-F. A Statistical Study on the Filament Eruption Caused by New Emerging Flux. Chin. Astron. Astrophys. 2008, 32, 56–64. [Google Scholar] [CrossRef]
- Chen, P.F.; Innes, D.E.; Solanki, S.K. SOHO/SUMER observations of prominence oscillation before eruption. Astron. Astrophys. 2008, 484, 487–493. [Google Scholar] [CrossRef]
- Soler, R.; Oliver, R.; Ballester, J. Attenuation of small-amplitude oscillations in a prominence corona model with a transverse magnetic field. New Astron. 2009, 14, 238–248. [Google Scholar] [CrossRef]
- Ballai, I. On dissipative effects in solar prominences. Astron. Astrophys. 2003, 410, L17–L19. [Google Scholar] [CrossRef]
- Molowny-Horas, R.; Heinzel, P.; Mein, P.; Mein, N. A non-LTE inversion procedure for chromospheric cloud-like features. Astron. Astrophys. 1999, 345, 618–628. [Google Scholar]
- Terradas, J.; Carbonell, M.; Oliver, R.; Ballester, J.L. Time damping of linear non-adiabatic magnetoacoustic waves in a slab-like quiescent prominence. Astron. Astrophys. 2005, 434, 741–749. [Google Scholar] [CrossRef]
- Terradas, J.; Arregui, I.; Oliver, R.; Ballester, J.L. Transverse Oscillations of Flowing Prominence Threads Observed with Hinode. Astrophys. J. Lett. 2008, 678, L153. [Google Scholar] [CrossRef]
- Ballester, J.L. Seismology of Prominence-Fine structures: Observations and Theory. Space Sci. Rev. 2006, 122, 129–135. [Google Scholar] [CrossRef]
- Lin, Y.; Soler, R.; Engvold, O.; Ballester, J.L.; Langangen, Ø.; Oliver, R.; van der Voort, L.H.M.R. Swaying Threads of a Solar Filament. Astrophys. J. 2009, 704, 870–876. [Google Scholar] [CrossRef]
- Berger, T.E.; Shine, R.A.; Slater, G.L.; Tarbell, T.D.; Title, A.M.; Okamoto, T.J.; Ichimoto, K.; Katsukawa, Y.; Suematsu, Y.; Tsuneta, S.; et al. Hinode SOT Observations of Solar Quiescent Prominence Dynamics. Astrophys. J. 2008, 676, L98. [Google Scholar] [CrossRef]
- Ning, Z.; Cao, W.; Okamoto, T.J.; Ichimoto, K.; Qu, Z.Q. Small-scale oscillations in a quiescent prominence observed by HINODE/SOT. Prominence oscillations. Astron. Astrophys. 2009, 499, 595–600. [Google Scholar] [CrossRef]
- Song, Y.; Ning, Z.; Li, D.; Shi, F.; Xu, J.; Yang, Y. Thread Displacement and Intensity Oscillations in a Quiescent Prominence. Astrophys. J. 2024, 975, 280. [Google Scholar] [CrossRef]
- Chae, J.; Ahn, K.; Lim, E.-K.; Choe, G.S.; Sakurai, T. Persistent Horizontal Flows and Magnetic Support of Vertical Threads in a Quiescent Prominence. Astrophys. J. Lett. 2008, 689, L73. [Google Scholar] [CrossRef]
- Chae, J. Dynamics of Vertical Threads and Descending Knots in a Hedgerow Prominence. Astrophys. J. 2010, 714, 618–629. [Google Scholar] [CrossRef]
- Jacob, P.T.J.; Maurya, R.A.; Tripathi, D. Dynamics of Plasma and Magnetic Fields in a Quiescent Prominence Formation. Sol. Phys. 2025, 300, 86. [Google Scholar] [CrossRef]
- Wang, J.; Li, D.; Li, C.; Hou, Y.; Xue, Z.; Xu, Z.; Yang, L.; Li, Q. Negative-energy Waves in the Vertical Threads of a Solar Prominence. Astrophys. J. Lett. 2024, 965, L28. [Google Scholar] [CrossRef]
- Rees-Crockford, T.; Scullion, E.; Khomenko, E.; de Vicente, Á. The Observational and Numerical Analysis of the Rayleigh–Taylor Instability beneath a Hedgerow Prominence. Astrophys. J. 2024, 974, 64. [Google Scholar] [CrossRef]
- Liu, Z.; Xu, J.; Gu, B.-Z.; Wang, S.; You, J.-Q.; Shen, L.-X.; Lu, R.-W.; Jin, Z.-Y.; Chen, L.-F.; Lou, K.; et al. New vacuum solar telescope and observations with high resolution. Res. Astron. Astrophys. 2014, 14, 705–718. [Google Scholar] [CrossRef]
- Yang, Y.F.; Qu, H.X.; Ji, K.F.; Feng, S.; Deng, H.; Lin, J.B.; Wang, F. Characterizing motion types of G-band bright points in the quiet Sun. Res. Astron. Astrophys. 2015, 15, 569. [Google Scholar] [CrossRef]
- Yi, Z.; Engvold, O. Vertical Velocities and Oscillations in Quiescent Filaments. Sol. Phys. 1991, 134, 275–286. [Google Scholar] [CrossRef]
- Shi, F.; Li, D.; Ning, Z.; Guo, Y.; Feng, S.; Xu, J. Are Quasi-periodic Pulsations Independent of Loop Oscillations in Solar Flare? Astrophys. J. 2023, 958, 39. [Google Scholar] [CrossRef]
- Shi, F.; Ning, Z.; Li, D. An Investigation of the Loop Oscillations after a Solar Flare. Res. Astron. Astrophys. 2022, 22, 105017. [Google Scholar] [CrossRef]
- Xu, J.; Ning, Z.; Li, D.; Shi, F.; Song, Y.; Yang, Y. An Investigation of the Loop Oscillations after a Solar Flare. Universe 2024, 10, 201. [Google Scholar] [CrossRef]
- Nakariakov, V.M.; Ofman, L. Determination of the coronal magnetic field by coronal loop oscillations. Astron. Astrophys. 2001, 372, L53–L56. [Google Scholar] [CrossRef]
- White, R.S.; Verwichte, E. Transverse coronal loop oscillations seen in unprecedented detail by AIA/SDO. Astron. Astrophys. 2012, 537, A49. [Google Scholar] [CrossRef]
- Nisticò, G.; Nakariakov, V.M.; Verwichte, E. Decaying and decayless transverse oscillations of a coronal loop. Astron. Astrophys. 2013, 552, A57. [Google Scholar] [CrossRef]


Disclaimer/Publisher’s Note: The statements, opinions and data contained in all publications are solely those of the individual author(s) and contributor(s) and not of MDPI and/or the editor(s). MDPI and/or the editor(s) disclaim responsibility for any injury to people or property resulting from any ideas, methods, instructions or products referred to in the content. |
© 2025 by the authors. Licensee MDPI, Basel, Switzerland. This article is an open access article distributed under the terms and conditions of the Creative Commons Attribution (CC BY) license (https://creativecommons.org/licenses/by/4.0/).