Article

About Jordan and Einstein Frames: A Study in Inflationary Magnetogenesis

by
Joel Velásquez
1,*,
Héctor J. Hortua
2 and
Leonardo Castañeda
1
1
Grupo de Gravitación y Cosmología, Observatorio Astronómico Nacional, Universidad Nacional de Colombia, Cra 45 # 26-85, Ed. Uriel Gutierrez, Bogotá 16486, Colombia
2
Grupo Signos, Departamento de Matemáticas, Universidad el Bosque, Bogotá 11321, Colombia
*
Author to whom correspondence should be addressed.
Universe 2024, 10(9), 350; https://doi.org/10.3390/universe10090350
Submission received: 12 July 2024 / Revised: 19 August 2024 / Accepted: 28 August 2024 / Published: 1 September 2024
(This article belongs to the Special Issue The Nature of Dark Energy)

Abstract

:
In this paper, we make a detailed side-by-side comparison between Jordan and Einstein frames in the context of cosmic magnetogenesis. We have computed the evolution of the vector potential in each frame along with some observables such as the spectral index and the magnetic field amplitude. We found that contrary to the Einstein frame, the electric and magnetic energy densities in the Jordan Frame do not depend on any parameter associated with the scalar field. Furthermore, in the Einstein frame, and assuming scale invariance for the magnetic field, most of the total energy density contribution comes from the electric and magnetic densities. Finally, we show the ratio between magnetic field signals in both frames printed in the CMB.

1. Introduction

One of the most exciting outstanding puzzles in modern Cosmology is the origin of the accelerating expansion of the Universe [1,2,3,4]. Modifications to Einstein’s gravity have been interesting candidates for explaining its origin without the cosmological constant. Representative modified gravity models that have been studied include scalar–tensor theories (STTs) [5,6,7,8,9,10,11,12,13], f ( R ) gravity [14,15,16], Gauss–Bonnet gravity [17,18,19], DGP (Dvali–Gabadadze–Porrati) model [20], and brane–world gravity [21,22] among others [23]. Depending on the coupling between the scalar field and the scalar curvature, STTs are formulated in two distinct frames, the Jordan Frame (JF) and the Einstein frame (EF). In the former, the scalar field is non-minimally coupled to gravity, while in the latter, a minimal coupling is present. Both frames are related by conformal transformations of the metric, along with a redefinition of the scalar field. Moving from JF to EF gets rid of non-minimal coupling from the gravity sector in the action, and the Lagrangian of the redefined scalar restores its canonical form. This transformation preserves the non-minimal coupling with the “new” scalar field in the matter sector. As a consequence, the matter energy–tensor momentum is no longer covariantly conserved, implying that massive particles will not follow geodesics due to the appearance of an additional force in this frame.
Although these two frames are conformally related and, at least on a classical level, are physically equivalent [24,25,26,27,28,29,30,31,32], there are still controversial opinions regarding this in the literature. For example, it is possible to have acceleration in the Jordan frame, and when a conformal transformation moves to the Einstein frame, the transformed metric can describe a decelerating Universe [33]. In [34], it was pointed out that in quadratic and scale-invariant gravity the solution space of the Jordan frame cannot be entirely mapped into the solution space of the Einstein frame. Additionally, in [35], they demonstrate that gauge invariance does not guarantee frame invariance (e.g., the Bardeen potentials). Therefore, we want to explore behaviors in the physical quantities within a specific cosmological scenario by performing the calculations in these frames without invoking the conformal transformation between them.
This paper aims to analyze, side-by-side, the physical quantities in both the Jordan and Einstein frames within the context of magnetogenesis. In this scenario, we focus on nonminimal couplings and the breaking of the conformal invariance of the electromagnetic field. Our specific goal is to describe the main physical observables in both frames without invoking conformal transformations and to compare constraints on magnetic field spectra [36,37,38,39,40,41,42].
This paper is organized as follows: In Section 2, we briefly review the conformal transformations between Jordan and Einstein frames. Section 3, describes the evolution of the potential vector using both frames and we evaluate power spectra. In Section 4 we show different constraints on the magnetic field spectra in both frames, while in Section 5 we discuss the CMB signal left from those fields. Finally, we conclude with a summary in Section 6.

2. Conformal Transformations between Jordan and Einstein Frames

In this section, we briefly show the standard procedure to demonstrate the equivalence between scalar–tensor theories in the Jordan and Einstein frames [6,7,15].
Let us consider the action for scalar–tensor theories in the so-called Jordan frame [7,43]
S J = d 4 x g Z ( ϕ , R ) ,
Z = 1 2 f ( ϕ ) R 1 2 ω ( ϕ ) g c d c ϕ d ϕ V ( ϕ ) ,
where the function f ( ϕ ) is the coupling function, ω ( ϕ ) is a parameter, and V ( ϕ ) is the potential of the scalar field. Performing a conformal transformation on the metric
g * a b = Ω 2 ( x ) g a b , where Ω 2 = f ( ϕ ) ,
and defining a new scalar field χ [6]
d χ d ϕ = 3 2 f ϕ f 2 + ω f ,
where f ϕ = ϕ f ( ϕ ) , allows us to write the action in the Einstein frame [6]
S E = d 4 x g * Q ( χ , R * ) ,
Q = 1 2 R * 1 2 g * c d c χ d χ U ( χ ) ,
where R * is the Ricci scalar corresponding to the metric g * a b and
U ( χ ) = V ( ϕ ( χ ) ) f ( ϕ ( χ ) ) 2 .
The f ( R ) gravity can be cast in the form of scalar–tensor theories considering the action without the kinetic term ( ω ( ϕ ) = 0 ) of the scalar field [44,45,46]
S f ( R ) = d 4 x g f ϕ ( R ϕ ) + f ( ϕ ) ,
and by taking the variation of the action with respect to the scalar field, we obtain
f ϕ ϕ ( R ϕ ) = 0 .
If f ϕ ϕ 0 then ϕ = R , recovering the f ( R ) action [47]. Using this transformation, the potential follows
V = ϕ f ϕ f ( ϕ ) V = R f R f ( R ) ,
where f R = R f ( R ) . We can get the Brans–Dicke (BD) theory, which is a particular case of the scalar–tensor theories via
f ( ϕ ) = ϕ , ω ( ϕ ) = ω B D ϕ ,
and plugging it into Equation (4) becomes
ϕ = e 2 3 χ ,
where we have used ω B D = 0 because of its equivalence.

3. U(1) Gauge Field Coupled with Scalar-Tensor Theories

In what follows, we shall describe the magnetogenensis approach in both Jordan and Einstein frames. We will work on both frames independently in order to review the advantages and properties that each frame offers.

3.1. Magnetogenesis in Jordan Frame

We consider a model with non-minimal coupling between scalar–tensor theories and the electromagnetic field in the Jordan frame
S i n t J = 1 4 d 4 x g Z ( ϕ , R ) F a b F a b + γ g 4 d 4 x g Z ( ϕ , R ) F a b F ˜ a b ,
where F a b = a A b b A a is the electromagnetic field–strength tensor. Here, A a is the U ( 1 ) gauge field, F ˜ a b is the dual electromagnetic tensor, and γ g is a constant that leads to a magnetic field with a net helicity [38]. To obtain the equation of motion we vary the action with respect to A b
1 g a g Z ( ϕ , R ) F a b γ g 2 ϵ a b c d F c d = 0 ,
where ϵ a b c d is the totally antisymmetric tensor defined as ϵ a b c d = η a b c d g . Here, η a b c d is a Levi–Civita symbol. Working in the Coulomb gauge A 0 = 0 , i A i = 0 the equation of motion is written as
A i + Z Z A i a 2 ( τ ) j j A i + Z Z γ g η i j k a 2 ( τ ) j A k = 0 ,
where prime denotes differentiation with respect to conformal time and we have assumed a spatially flat Friedmann–Lemaître–Robertson–Walker (FLRW) spacetime
d s 2 = a 2 ( τ ) ( d τ 2 + d x 2 ) .
Defining A ¯ i = 2 Z A i , the equation of motion reads as
A ¯ i + 1 4 Z Z 2 2 Z Z A ¯ i a 2 ( τ ) j j A ¯ i + Z Z γ g η i j k a 2 ( τ ) j A ¯ k = 0 .
Quantizing the electromagnetic field, we can expand the vector potential in the helicity basis in terms of creation and annihilation operators b ^ h ( k ) and b ^ h ( k ) with the co-moving wave vector [48,49,50],
A ^ i ( τ , x ) = d 3 k ( 2 π ) 3 / 2 h = ± e i h ( k ) b ^ h ( k ) A h ( τ , x ) e i k · x + e i h * ( k ) b ^ h ( k ) A h * ( τ , x ) e i k · x .
Using the above expression along with A = a ( τ ) A ¯ , Equation (17) becomes
A h + k 2 + Z Z γ g h k + 1 4 Z Z 2 1 2 Z Z A h = 0 .
The evolution of this equation develops in three stages. In early stages k | τ | 1 the term k 2 dominates over the last two (the mode is far inside the horizon). Later on, when k | τ | 1 , the term proportional to γ g dominates, but only the modes γ g h > 0 are amplified. Finally, as τ 0 the terms 1 / τ 2 are amplified but the term γ g h < 0 is less amplified than the other case; for that reason we will neglect its effect [38,51]. Now, before calculating the spectral densities of the electric and magnetic energy densities, we need to compute the contribution to the energy density of the electromagnetic field; to achieve this, we will find the stress–energy tensor of the EM field, which is obtained by varying the action Equation (13) with respect to the metric g a b
T a b = 2 g δ S ( J F ) δ g a b = 1 4 Z ( ϕ , R ) g a b F 2 + Z ( ϕ , R ) g c d F a c F b d + 1 4 f ( ϕ ) F 2 R a b g a b f ( ϕ ) F 2 + a b f ( ϕ ) F 2 1 4 ω ( ϕ ) a ϕ b ϕ F 2 γ g 4 f ( ϕ ) F ˜ 2 R a b g a b f ( ϕ ) F ˜ 2 + a b f ( ϕ ) F ˜ 2 + γ g 4 ω ( ϕ ) a ϕ b ϕ F ˜ 2 ,
where F 2 = F c d F c d and F ˜ 2 = F c d F ˜ c d . Taking a = b = 0 , we have
T 00 = 1 2 m 1 g i j A i A j + 1 2 a 2 m 2 g i j g k l j A l i A k k A i + m 3 a 2 g i j A i A j m 3 g i j g k l j A l i A k k A i + 2 γ g m 4 ϵ i j k A i j A k + 2 γ g m 3 ϵ i j k A i j A k
where we have neglected the second-order spatial derivative of the quadratic quantity of electromagnetic fluctuations [52] and defined the following quantities
m 1 1 2 f ( ϕ ) R + 3 a 2 ω ( ϕ ) ( ϕ ) 2 2 V ( ϕ )
m 2 1 2 f ( ϕ ) R a 2 ω ( ϕ ) ( ϕ ) 2 2 V ( ϕ )
m 3 3 2 H f ( ϕ )
m 4 1 2 ω ( ϕ ) ( ϕ ) 2 .
Taking the expectation value for the stress–energy tensor in the vacuum state | 0 (defined by the condition b h ( k ) | 0 = 0 , for all k), we obtain the total energy density
ρ = ρ E + ρ B + Δ ρ ,
where
ρ E = 0 | T   0 0   ( E ) | 0 = m 1 8 π 2 0 d k k k 3 a 4 A + ( τ , k ) Z 2 + A ( τ , k ) Z 2 ,
ρ B = 0 | T   0 0   ( B ) | 0 = m 2 8 π 2 d k k k 5 a 4 A + ( τ , k ) Z 2 + A ( τ , k ) Z 2 ,
Δ ρ = 3 8 π 2 a 2 d d τ 0 d k k k 3 a 4 H f ( ϕ ) A + ( τ , k ) Z 2 + A ( τ , k ) Z 2 3 8 π 2 a 2 d d τ 0 d k k k 5 a 4 H f ( ϕ ) A + ( τ , k ) Z 2 + A ( τ , k ) Z 2 + 3 8 π 2 a 2 d d τ 0 d k k k 4 a 4 H f ( ϕ ) A + ( τ , k ) Z 2 A ( τ , k ) Z 2 .
Here, the first term is the electric energy density stored at a given scale, the second term is the magnetic energy density, and finally, Δ ρ represents the additional contributions to the total energy density.

3.2. Magnetogenesis in Einstein Frame

Let us follow the same procedure to calculate both the evolution equation of the potential vector and the energy density in the Einstein frame, following the same procedure described in the previous section. The action in this frame is written as
S i n t E = 1 4 d 4 x g * Q ( χ , R * ) F a b F * a b + 1 4 d 4 x g * Q ( χ , R * ) γ g F a b F * ˜ a b .
Now, the equation of motion for the electromagnetic vector potential in the Coulomb gauge is given by
A h + k 2 + Q Q γ g η i j k k + 1 4 Q Q 2 1 2 Q Q A h = 0 ,
where A = 2 a ( τ ) Q A i . The stress–tensor energy reads
T * a b = 1 4 Q ( χ , R * ) g * a b F * 2 + Q ( χ , R * ) g * c d F a c F b d + 1 4 F * 2 R * a b g * a b * F * 2 + * a * b F * 2 γ g 4 F * ˜ 2 R * a b g * a b * F * ˜ 2 + * a * b F * ˜ 2 1 4 * a χ * b χ F * 2 + γ g 4 * a χ * b χ F * ˜ 2 ,
where the time–time component is given by
T * 00 = 1 2 m * 1 g * i j A i A j + 1 2 m * 2 a * 2 g * i j g * k l j A l i A k k A i + m * 3 a * 2 g * i j A i A j m * 3 g * i j g * k l j A l i A k k A i + 2 γ g m * 4 ϵ * i j k A i j A k + 2 γ g m * 3 ϵ * i j k A i j A k ,
and where we have defined the following functions
m * 1 1 2 R * + 3 a * 2 χ 2 2 U ( χ ) = Q + χ 2 a * 2 ,
m * 2 1 2 R * a * 2 χ 2 2 U ( χ ) = Q χ 2 a * 2 .
Taking the expectation value for the stress–energy tensor in the vacuum state, we obtain the following terms
ρ * E = 0 | T *   0 0   ( E ) | 0 = m * 1 8 π 2 0 d k k k 3 a * 4 A * + ( τ * , k ) Q 2 + A * ( τ * , k ) Q 2 ,
ρ * B = 0 | T *   0 0   ( B ) | 0 = m * 2 8 π 2 d k k k 5 a * 4 A * + ( τ * , k ) Q 2 + A * ( τ * , k ) Q 2 ,
Δ ρ * = 3 8 π 2 a * 2 d d τ * d k k k 3 a * 4 H * A * + ( τ * , k ) Q 2 + A * ( τ * , k ) Q 2 3 8 π 2 a * 2 d d τ * d k k k 5 a * 4 H * A * + ( τ * , k ) Q 2 + A * ( τ * , k ) Q 2 + 3 γ g 8 π 2 a * 2 d d τ * * d k k k 4 a * 4 H * A * + ( τ * , k ) Q 2 A * ( τ * , k ) Q 2 + γ g 8 π 2 a * 2 d k k k 4 a * 6 χ 2 A * + ( τ * , k ) Q 2 A * ( τ * , k ) Q 2 .
The total energy density can be calculated by adding up all the energy densities, i.e., ρ * = ρ * E + ρ * B + Δ ρ * . It is important to bear in mind that the action in this frame has been taken as independent of the Jordan one. By taking a conformal transformation in Equation (13), we arrive at
S i n t E = 1 4 f 2 d 4 x g * Q ( χ , R * ) F a b F * a b + 1 4 f 2 d 4 x g * Q ( χ , R * ) γ g F a b F * ˜ a b .
Notice factor f 2 in the transformation, which reveals the conformal invariance breaking between both frames.

4. Magnetogenesis on Power–Law Inflation

In the previous section, we obtained the spectral densities of the electric and magnetic densities of Jordan and Einstein frames. In this section, we want to explore the above results using a specific model for these frames.

4.1. Model in Jordan Frame

By using the magnetogenesis procedure, which assumes that the coupling functions evolve due to a power law, we assume the evolution of the coupling Z in this manner because, in this context, we are interested in the asymptotic solutions
Z = Z 0 τ τ 0 γ .
The vector potential behaves
A h + k 2 2 ξ γ g h k τ ξ ( ξ + 1 ) τ 2 A h = 0 ,
where ξ = 2 γ . The solution to this equation is given by [53]
A h = C 1 W κ , μ ( z ) + C 2 W κ , μ ( z ) ,
being W κ , μ ( z ) the Whittaker functions. The asymptotic representations of these functions are [53]
W κ , μ ( z ) = Γ ( 2 μ ) Γ ( 1 2 + μ κ ) z 1 2 μ + Γ ( 2 μ ) Γ ( 1 2 μ κ ) z 1 2 + μ , z 0 e 1 2 z z κ , z
In order to determine the coefficients C 1 and C 2 , we have to match the solution with the Bunch–Davies vacuum
A 1 2 k e i k τ , for k τ .
As a result, we see that C 2 = 0 and C 1 becomes
C 1 = 1 2 k e ξ h γ π / 2 .
At the end of the inflation, all the modes outside the horizon will be given by
A h = e ξ h γ π / 2 2 k ( 2 i ) ξ Γ ( 2 ξ + 1 ) Γ ( ξ + 1 i h γ ξ ) C 3 ( k τ ) ξ + ( 2 i ) ξ + 1 Γ ( 2 ξ 1 ) Γ ( ξ i h γ ξ ) C 4 ( k τ ) ξ + 1 .
Assuming maximal helicity | A + | = | A | and | A | = 0 , the expectation values become
0 | T   0 0   ( J F ) | 0 = H 4 16 π 2 e π ξ γ g 0 d k k C 4 2 k a H 2 ξ + 4 ( 2 ξ + 1 ) 2 + H 4 16 π 2 e π ξ γ g 0 d k k C 3 2 k a H 2 ξ + 4 + C 4 2 k a H 2 ξ + 6 + 3 H 6 16 π 2 e π ξ γ g β 0 0 d k k C 4 2 k a H 2 ξ + 4 ( 2 ξ + 1 ) 2 β ( 2 ξ + 3 ) τ β 3 H 6 16 π 2 e π ξ γ g β 0 0 d k k [ C 3 2 k a H 2 ξ + 4 β ( 2 ξ + 3 ) + C 4 2 k a H 2 ξ + 6 β ( 2 ξ + 5 ) ] τ β + 3 H 6 16 π 2 e π ξ γ g β 0 0 d k k C 4 2 k a H 2 ξ + 5 2 ( 2 ξ + 1 ) 2 ξ + 4 β τ β ,
where we have assumed that the fraction f ( ϕ ) Z = β 0 τ β . The invariance scale in the magnetic field is given by ξ = 2 , 3 , but to the value ξ = 3 , the electric field diverges as k a H 2 in the super horizon limit. To avoid an excessive production of electromagnetic energy, we calculate the energy stored in the electromagnetic field at the end of the inflation τ f
ρ E M ( J F ) = H 4 16 π 2 e π ξ γ g ( 2 ξ + 1 ) 2 2 ξ + 4 C 4 2 1 e ( 2 ξ + 4 ) N + H 4 16 π 2 e π ξ γ g C 3 2 2 ξ + 4 1 e ( 2 ξ + 4 ) N + C 4 2 2 ξ + 6 1 e ( 2 ξ + 6 ) N + 3 H 6 16 π 2 e π ξ γ g β 0 ( 2 ξ + 1 ) 2 2 ξ + 4 β ( 2 ξ + 3 ) τ f β C 4 2 1 e ( 2 ξ + 4 ) N 3 H 6 16 π 2 e π ξ γ g β 0 [ C 3 2 β ( 2 ξ + 3 ) 2 ξ + 4 1 e ( 2 ξ + 4 ) N + C 4 2 β ( 2 ξ + 5 ) 2 ξ + 6 1 e ( 2 ξ + 6 ) N ] τ f β + 3 H 6 16 π 2 e π ξ γ g β 0 C 4 2 2 ( 2 ξ + 1 ) 2 ξ + 4 β 2 ξ + 5 1 e ( 2 ξ + 5 ) N τ f β ,
where N is the number of e-folds and it is defined by N ln a f a i .
Using f ( ϕ ) Z τ = τ f = β 0 τ f β = α H 2 , being that α is a parameter that runs 0–1 so as not to spoil the inflation energy. Figure 1 displays the allowed area for Δ ρ constrained by the α and β values. α values run 0–1, while β goes 0–70. We can observe in the upper-left plot for ξ = 2 that Δ ρ permits only small β values ( β ∼2).
In contrast, for ξ > 0 , the allowed region has a higher yield of broad ranges for these parameters.
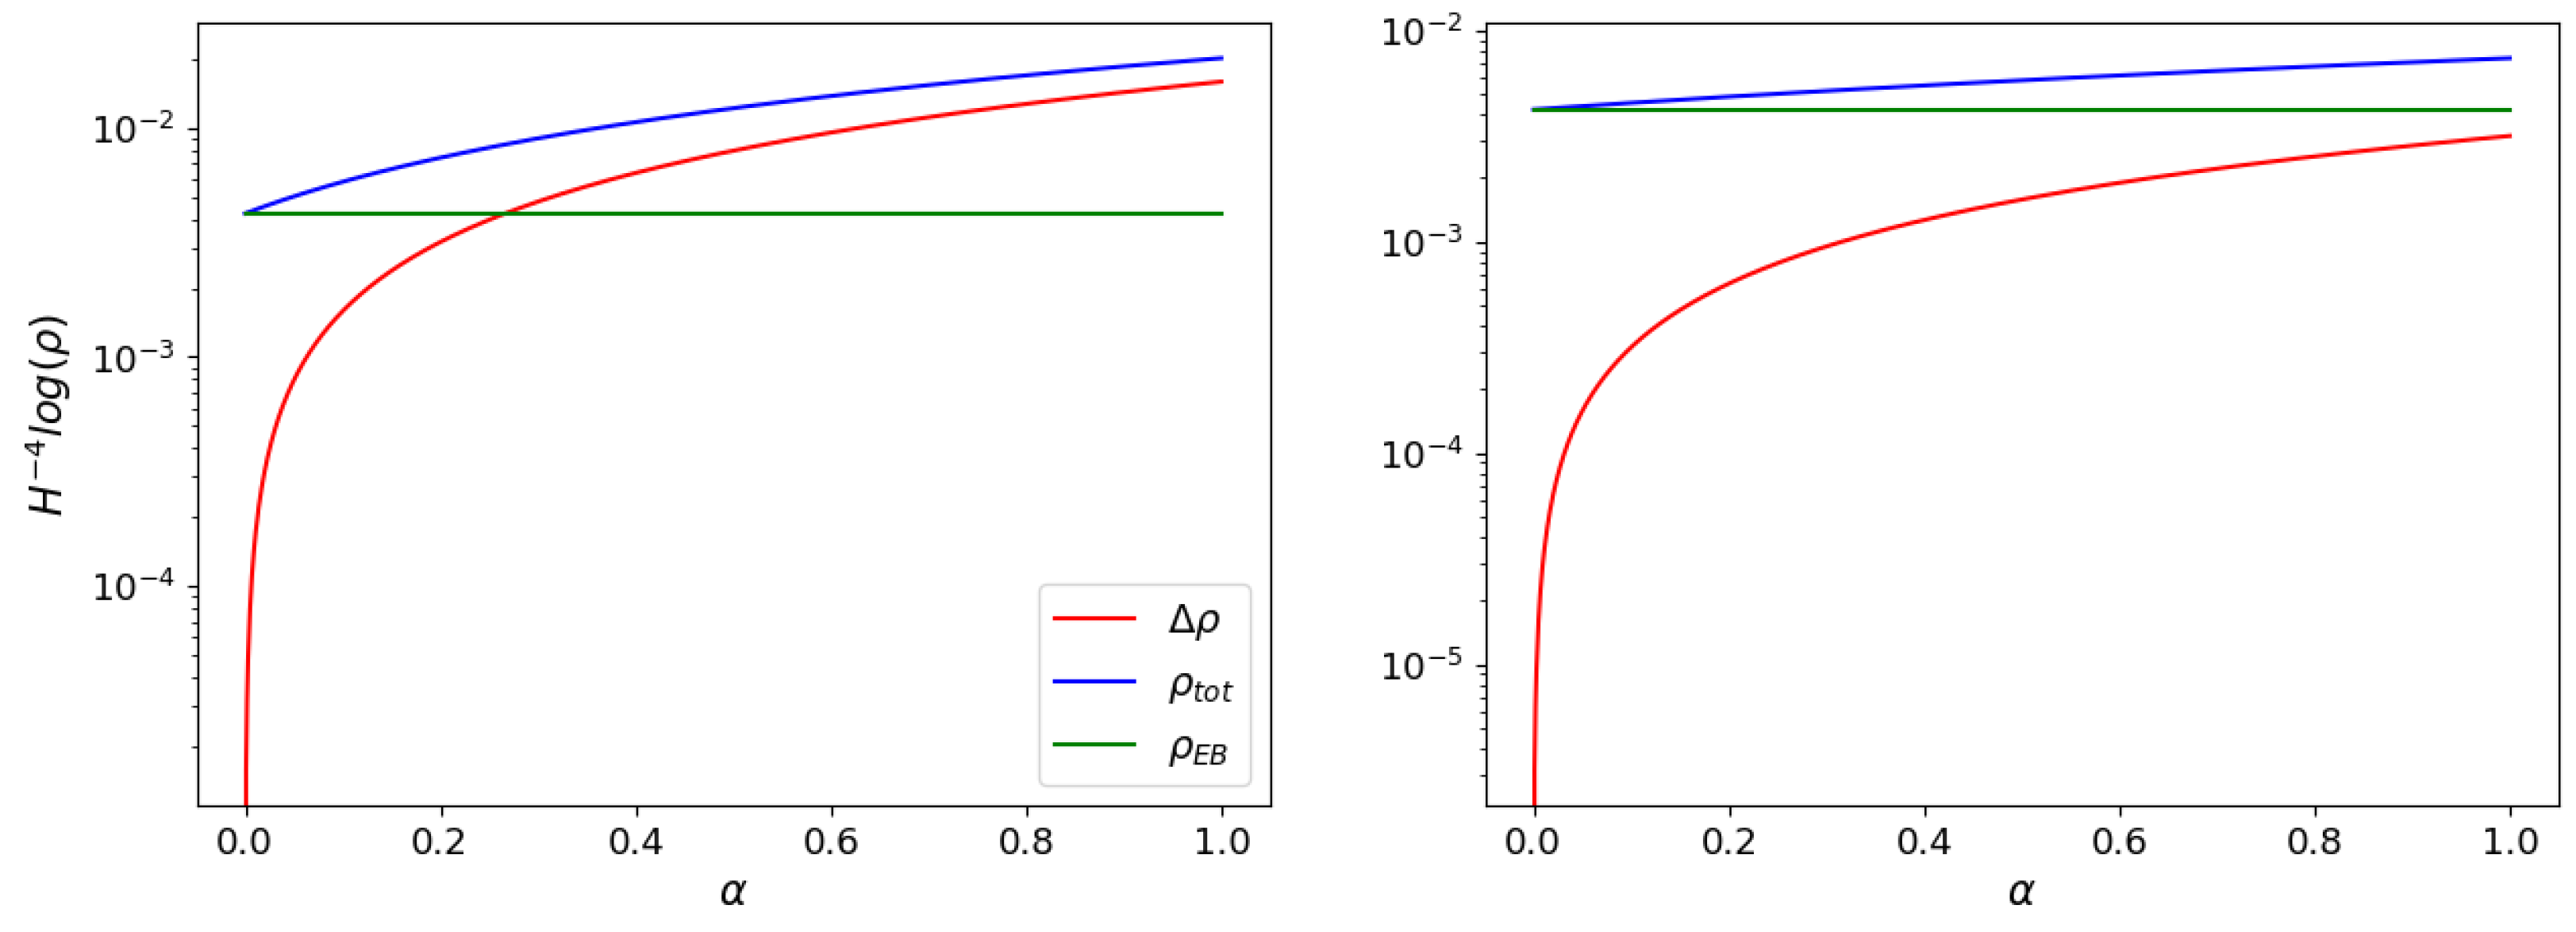
Figure 2 shows the behavior of Δ ρ and ρ t o t for two β values taken from the previous analysis using ξ = 2 . The remaining energy density represented by the red line increases with α , although its contribution is negligible with respect to the magnetic and electric densities.
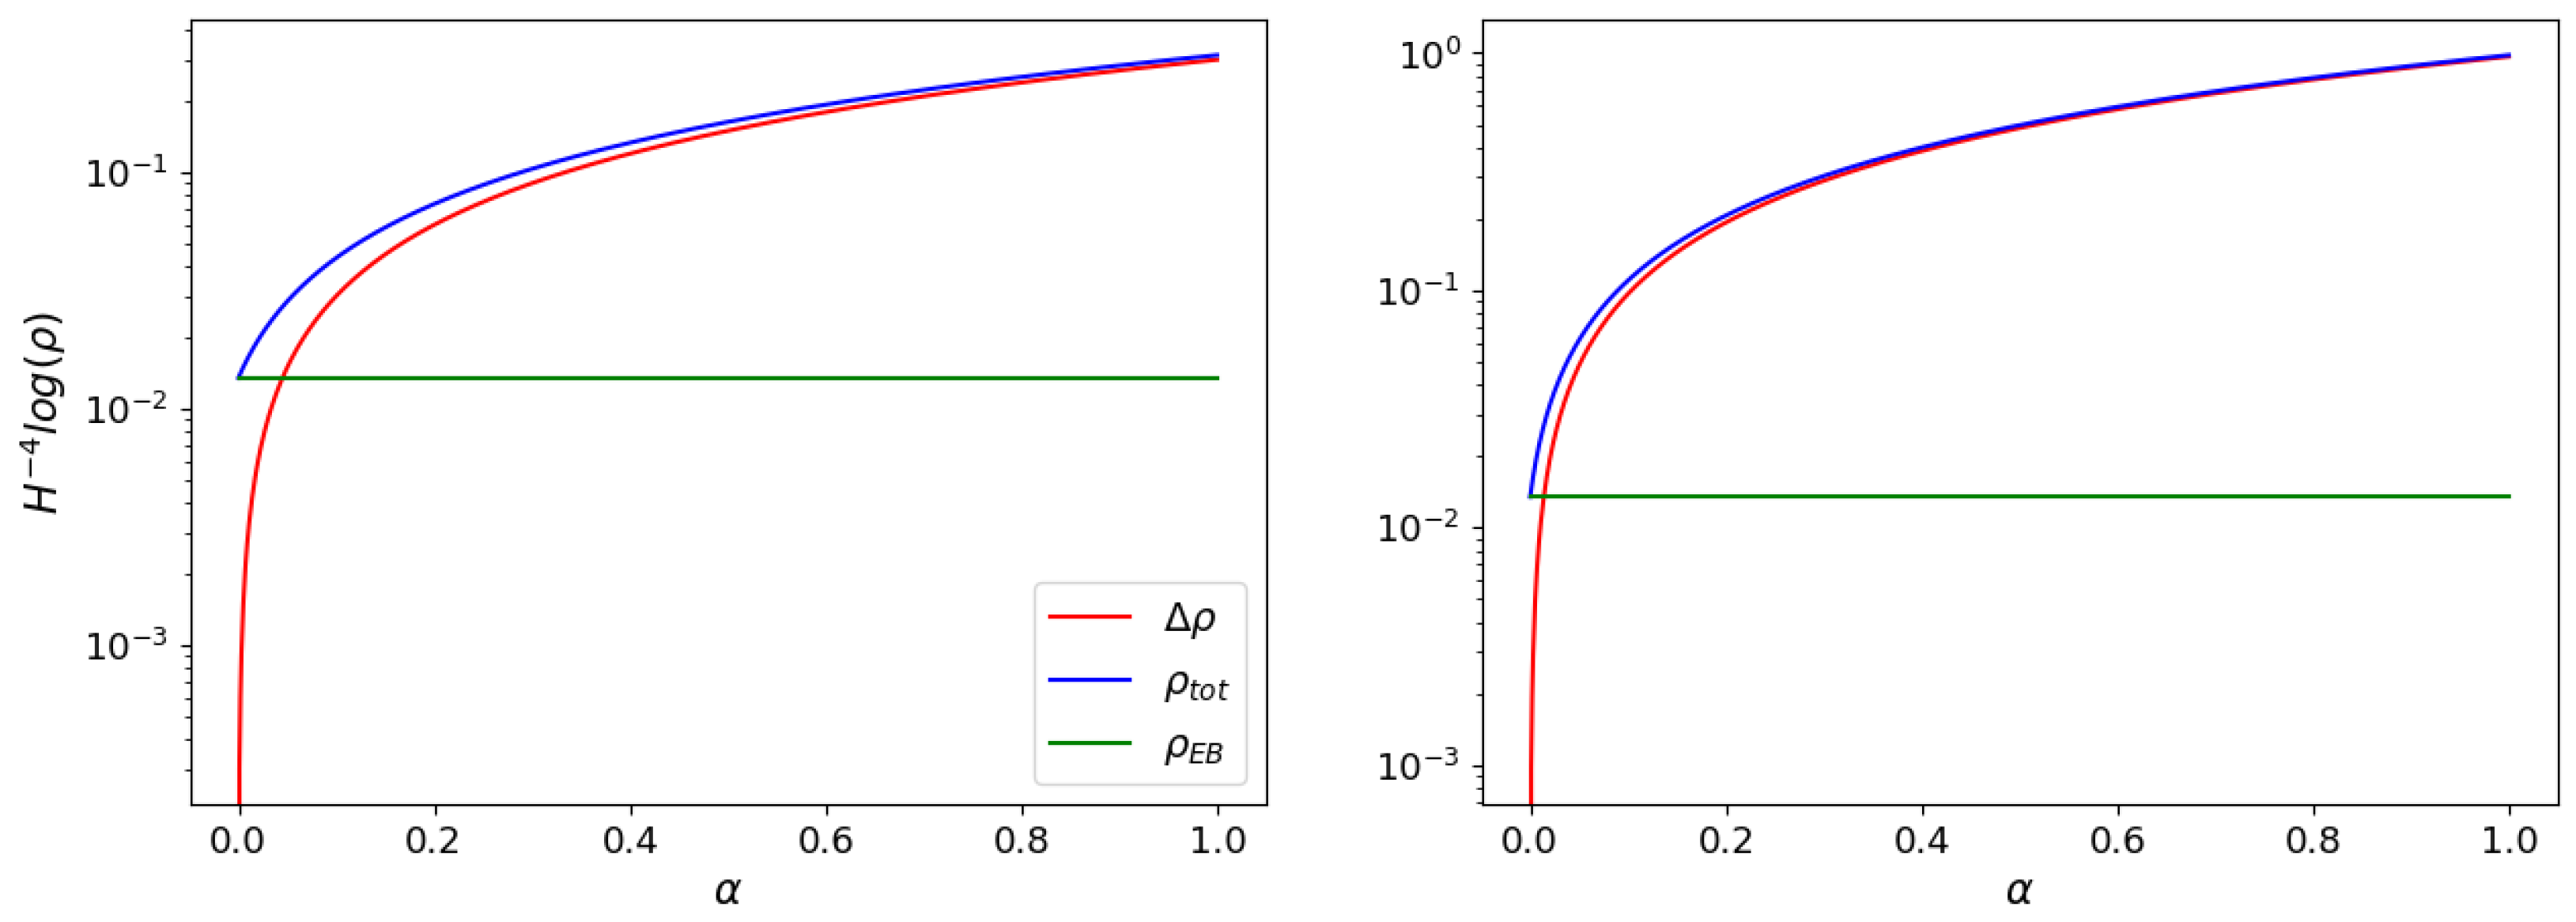
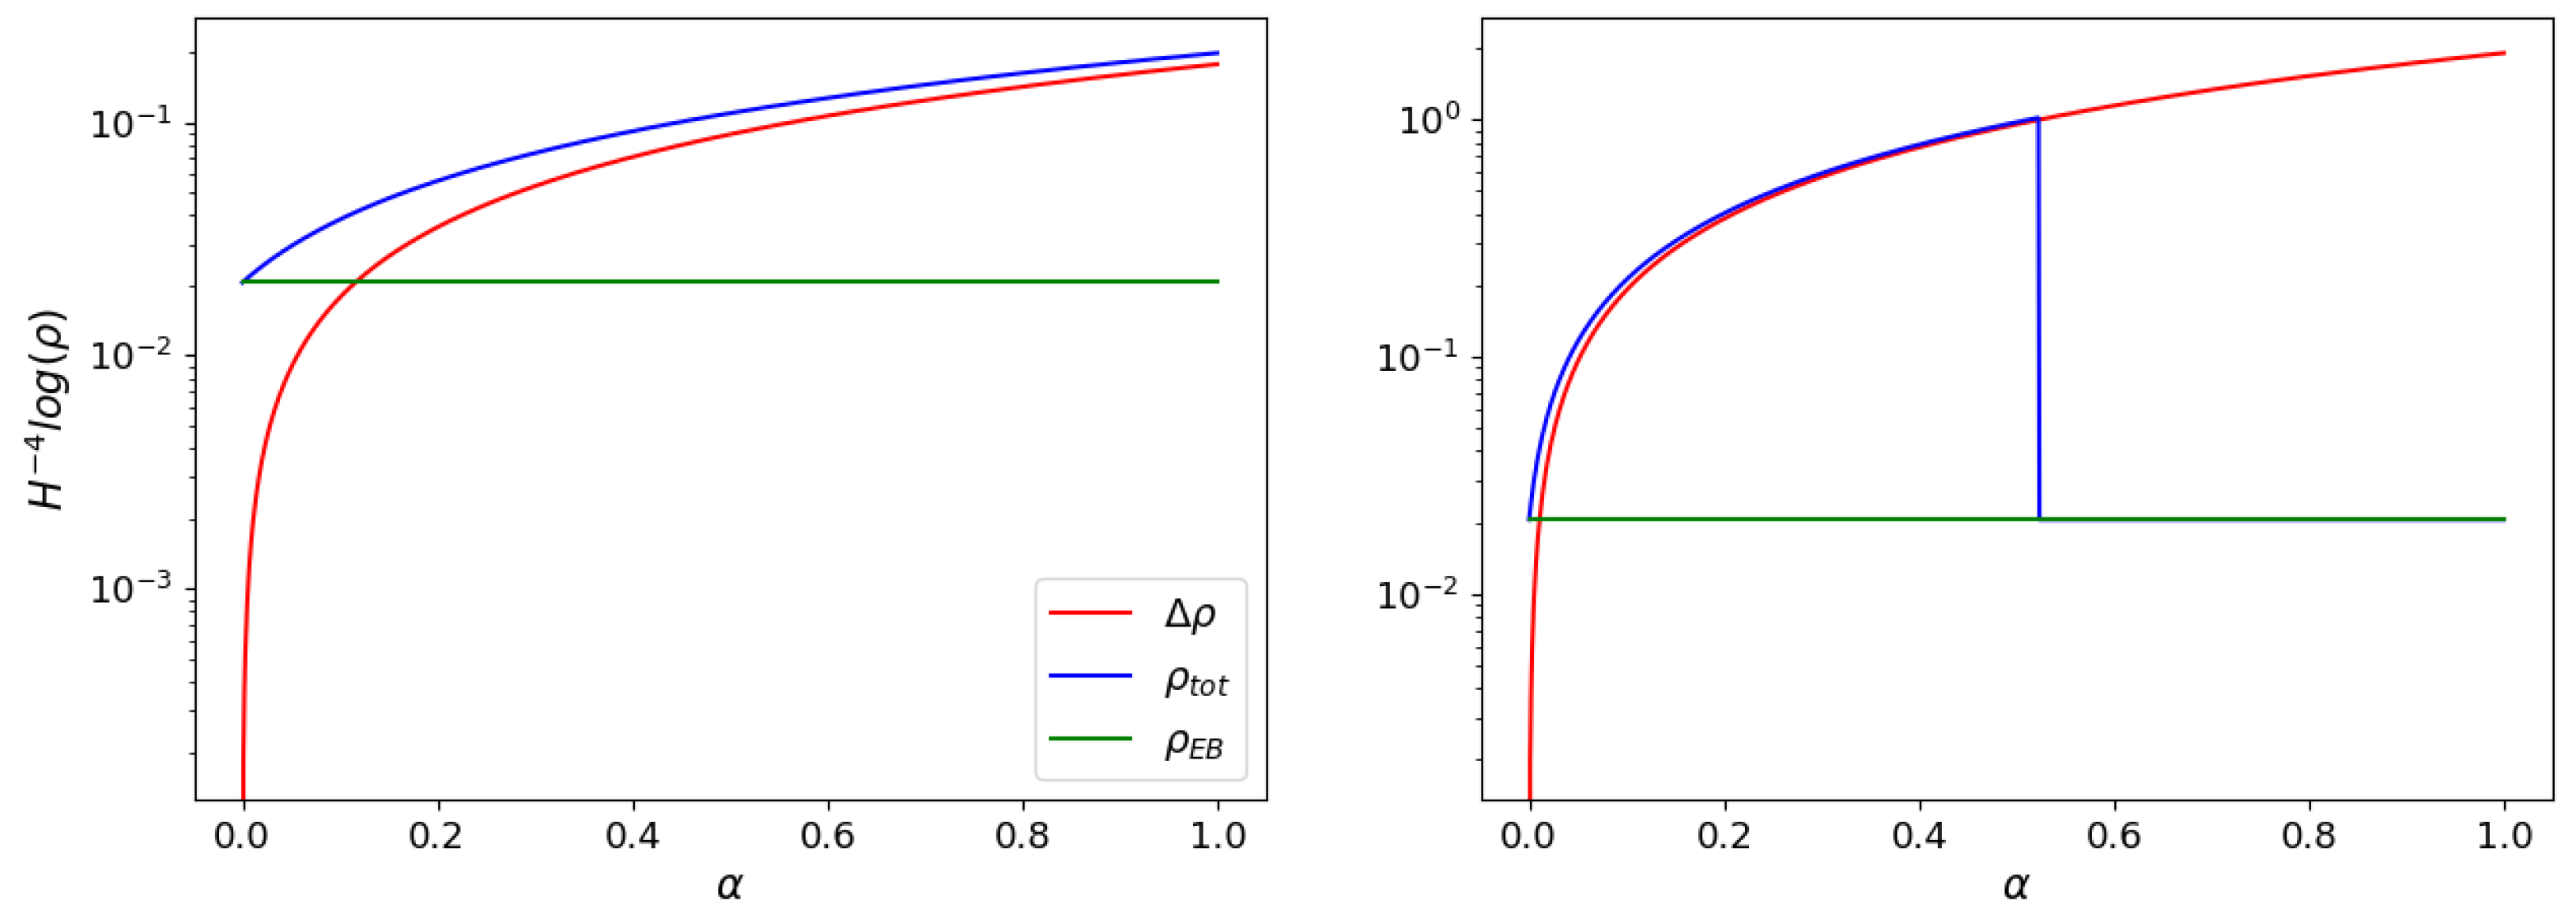
Figure 3 and Figure 4 illustrate the behavior of the electromagnetic field and Δ ρ for ξ = 0 , 1 , respectively. Notice how the combination for α and β determines the larger contribution for either ρ E B or Δ ρ . Finally, we can also approximate the forbidden limit at which the total density equals the inflation energy, as shown in Figure 5.
Assuming that the power spectra scale has a power law, we can write the magnetic spectral index as
2 ( 2 π ) 3 P B = k 2 < | A | 2 > k n B P k n B = 2 ξ + 1 for k τ < < 1 .
where we have used the fact that the magnetic field strength
B ( k ) = k A + ( k ) = k A + ( k ) 2 a Z = e π γ g k 2 2 a Z C 3 k τ ξ + C 4 k τ ξ + 1 .
On the other hand, we can compute the strength of the magnetic field to the present day, assuming that it is scale-invariant, and also that the universe is instantaneously shifted from inflation to radiation domination [36]. Hence, the temperature at the end of inflation is
T f = 90 8 π 3 1 / 4 H 1 / 2 M p 1 / 2 T 0 g f 1 / 12 g 0 1 / 3 = 90 8 π 3 1 / 4 10 5 / 2 M p T 0 100 1 / 12 2 . 64 1 / 3 H 10 5 M p 1 / 2 = 0.0026 M p T 0 H 10 5 M p 1 / 2 ,
where M p is the Planck mass. Since the magnetic density decreases with the expansion as a 4 , the value of the magnetic field for the actual epoch becomes
ρ B 0 = ρ B a f a 0 4 B 0 = 0.63 × 10 10 G H 10 5 M p
where the entropy conservation has been used
a 0 a f = g f g 0 1 / 3 T f T 0 ,
where g f ∼100 and g 0 ∼2.64 [36].
Finally, the helicity can be found using the following equation
H = A · B d 3 x H = 1 ( 2 π ) 3 | A k | 2 k d 3 k = 1 2 π 2 k 3 | A k | 2 d k
= 1 8 π 2 a 2 Z k 3 | A k | 2 d k
H = e ξ γ g π 16 π 2 a 2 Z | C 3 | 2 2 ξ + 3 ( k τ ) 2 ξ k 3 + | C 4 | 2 2 ξ + 5 ( k τ ) 2 ξ + 2 k 3
being the kinetic helicity spectral index
n H = 2 ξ + 2 .

4.2. Magnetogenesis View from the Einstein Frame

It is important to emphasize that we are going to analyze the evolution of the vector potential and the magnetic field amplitude independently of what we found in the above section, that is, we will not use the conformal transformation for the variable Q. For that reason we assume a power law for the Q-coupling
Q = Q 0 τ * τ * 0 η .
Bear in mind that to find asymptotic solutions we make this assumption.
The evolution equation for the vector potential in this frame becomes
A * h + k 2 2 δ γ g h k τ * δ ( δ + 1 ) τ * 2 A * h = 0 ,
where δ = 2 η . After following a straightforward procedure similar to the one used in the Jordan frame of the previous section, we arrive at
0 | T *   0 0   ( E F ) | 0 = H * 4 16 π 2 e π δ γ g 1 + a * 2 x 2 Q 0 d k k C 4 2 k a * H * 2 δ + 4 ( 2 δ + 1 ) 2 + H * 4 16 π 2 e π δ γ g 1 a * 2 x 2 Q 0 d k k [ C 3 2 k a * H * 2 δ + 4 + C 4 2 k a * H * 2 δ + 6 ] 3 H * 6 16 π 2 e π δ γ g 0 d k k C 4 2 Q k a * H * 2 δ + 4 ( 2 δ + 1 ) 2 ( 4 δ + 3 ) + 3 H * 6 16 π 2 e π δ γ g 0 d k k 3 C 3 2 Q k a * H * 2 δ + 4 + C 4 2 Q k a * H * 2 δ + 6 4 δ + 5 + 12 γ g H * 6 16 π 2 e π δ γ g 0 d k k C 4 2 Q k a * H * 2 δ + 5 2 ( 2 δ + 1 ) ( δ + 1 ) + γ g H * 6 16 π 2 e π δ γ g 0 d k k χ 2 Q C 4 2 1 a * H * k a * H * 2 δ + 5 2 ( 2 δ + 1 ) .
where the energy density at the end of inflation in this frame reads
ρ * E M = H 4 16 π 2 e π δ γ g ( 2 δ + 1 ) 2 2 δ + 4 C 4 2 1 + ψ μ 1 e ( 2 δ + 4 ) N + H 4 16 π 2 e π δ γ g 1 ψ μ C 3 2 2 δ + 4 1 e ( 2 δ + 4 ) N + C 4 2 2 δ + 6 1 e ( 2 δ + 6 ) N 3 H 4 16 π 2 e π δ γ g ψ ( 2 δ + 1 ) 2 2 δ + 4 4 δ + 3 C 4 2 1 e ( 2 δ + 4 ) N + 3 H 4 16 π 2 e π δ γ g ψ 3 C 3 2 2 δ + 4 1 e ( 2 δ + 4 ) N + 4 δ + 5 2 δ + 6 C 4 2 1 e ( 2 δ + 6 ) N + 24 γ g H 4 16 π 2 e π δ γ g ψ C 4 2 ( 2 δ + 1 ) δ + 1 2 δ + 5 1 e ( 2 δ + 5 ) N + 2 γ g ν H 4 16 π 2 e π δ γ g ψ 2 δ + 1 2 δ + 5 C 4 2 1 e ( 2 δ + 4 ) N ,
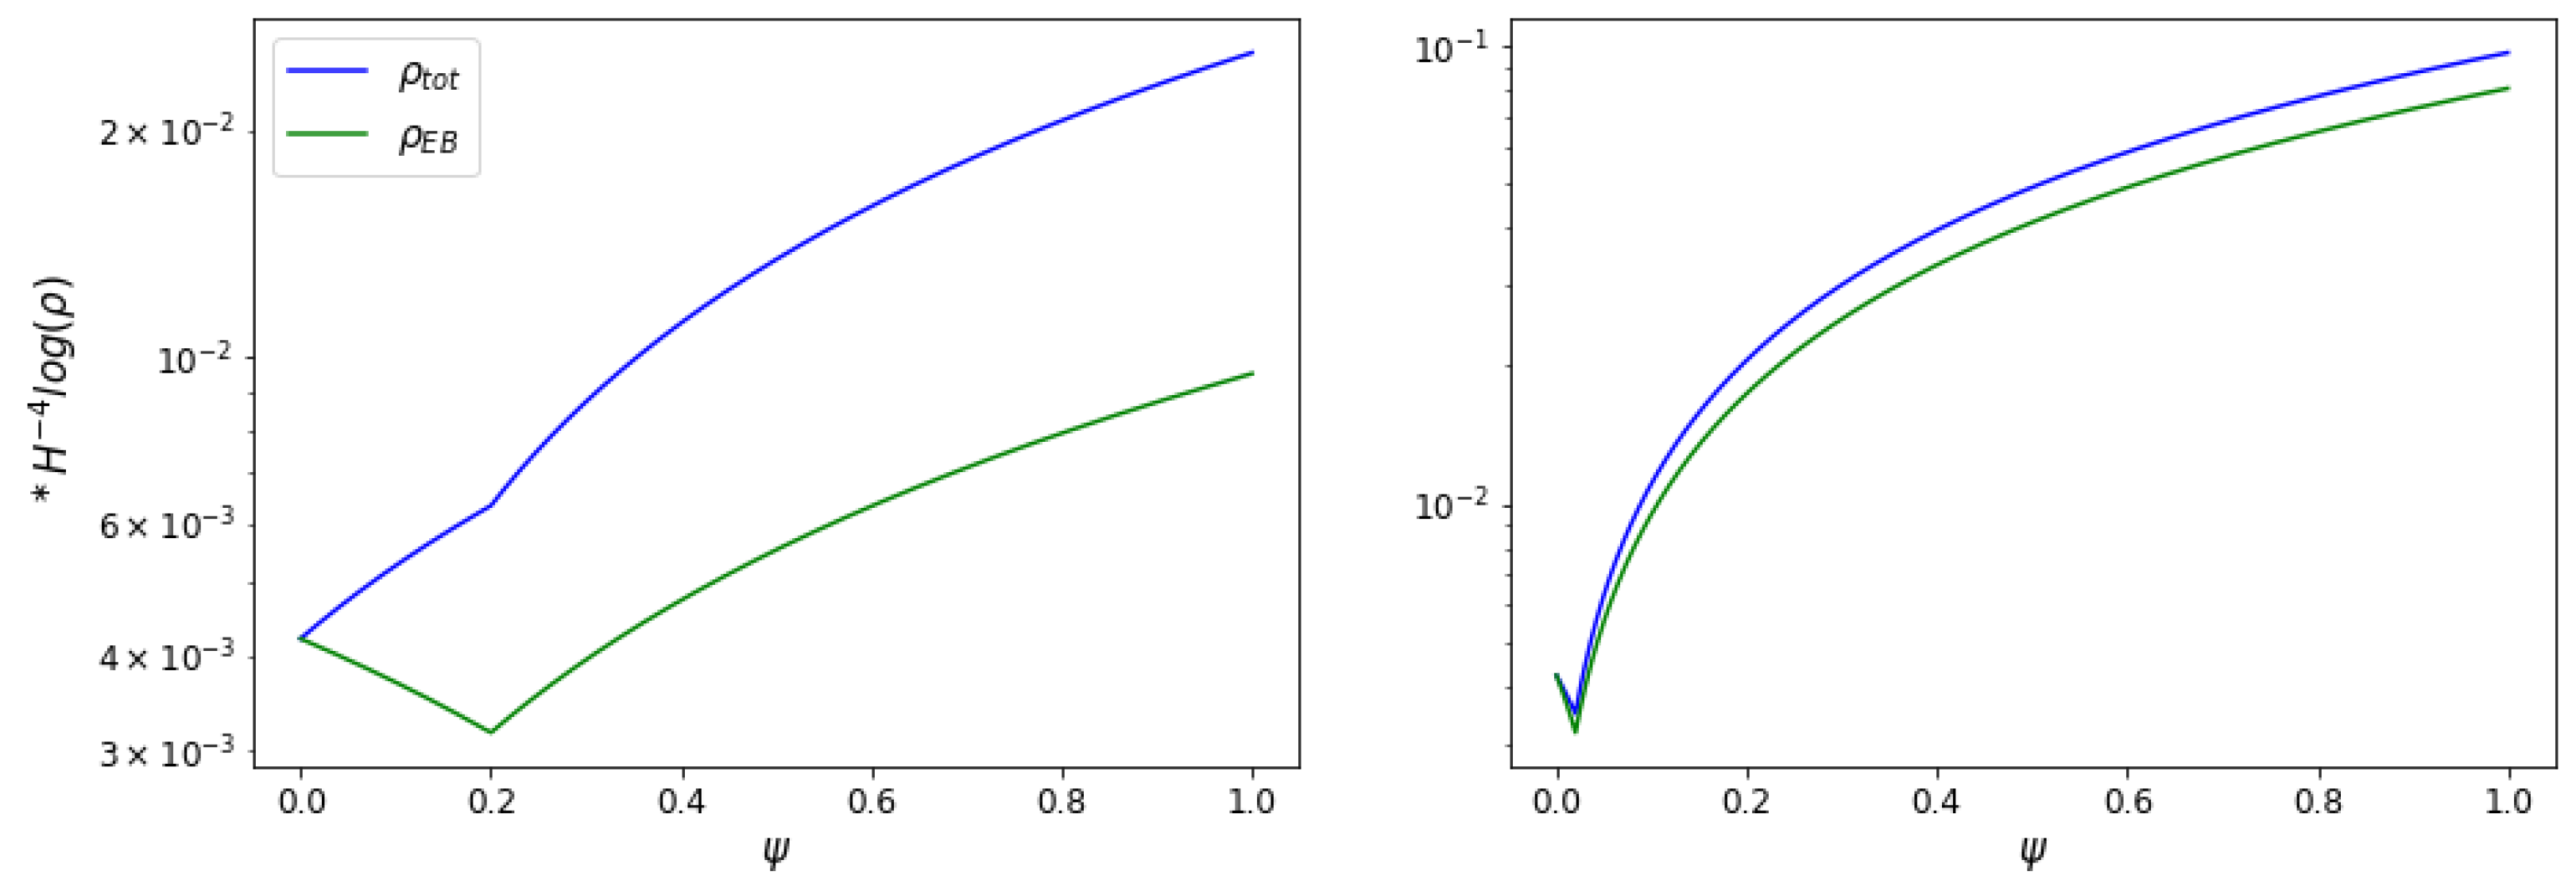
where we have used ψ = H * 2 Q τ = τ f , μ = χ 2 τ * 2 τ = τ f and ν = χ 2 τ * τ = τ f . Notice a slight difference between both frames in the magnetic and electric density terms, due to the existence of the additional variables ψ and μ , missing in the Jordan frame. This difference lies in the parameter ω ( ϕ ) on the Jordan frame that emerged from its equivalence with the f ( R ) theories. The following contour plots display the permitted and forbidden regions for ρ B , ρ E , and ρ t o t for different values of delta, and where ψ values running 0–1, μ goes 0–70 and ν = 0.5 . In Figure 6, the permitted values for ρ B and ρ t o t are located in regions where μ is close to zero. The electric density is zero as we can see in the first term of the Equation (59).
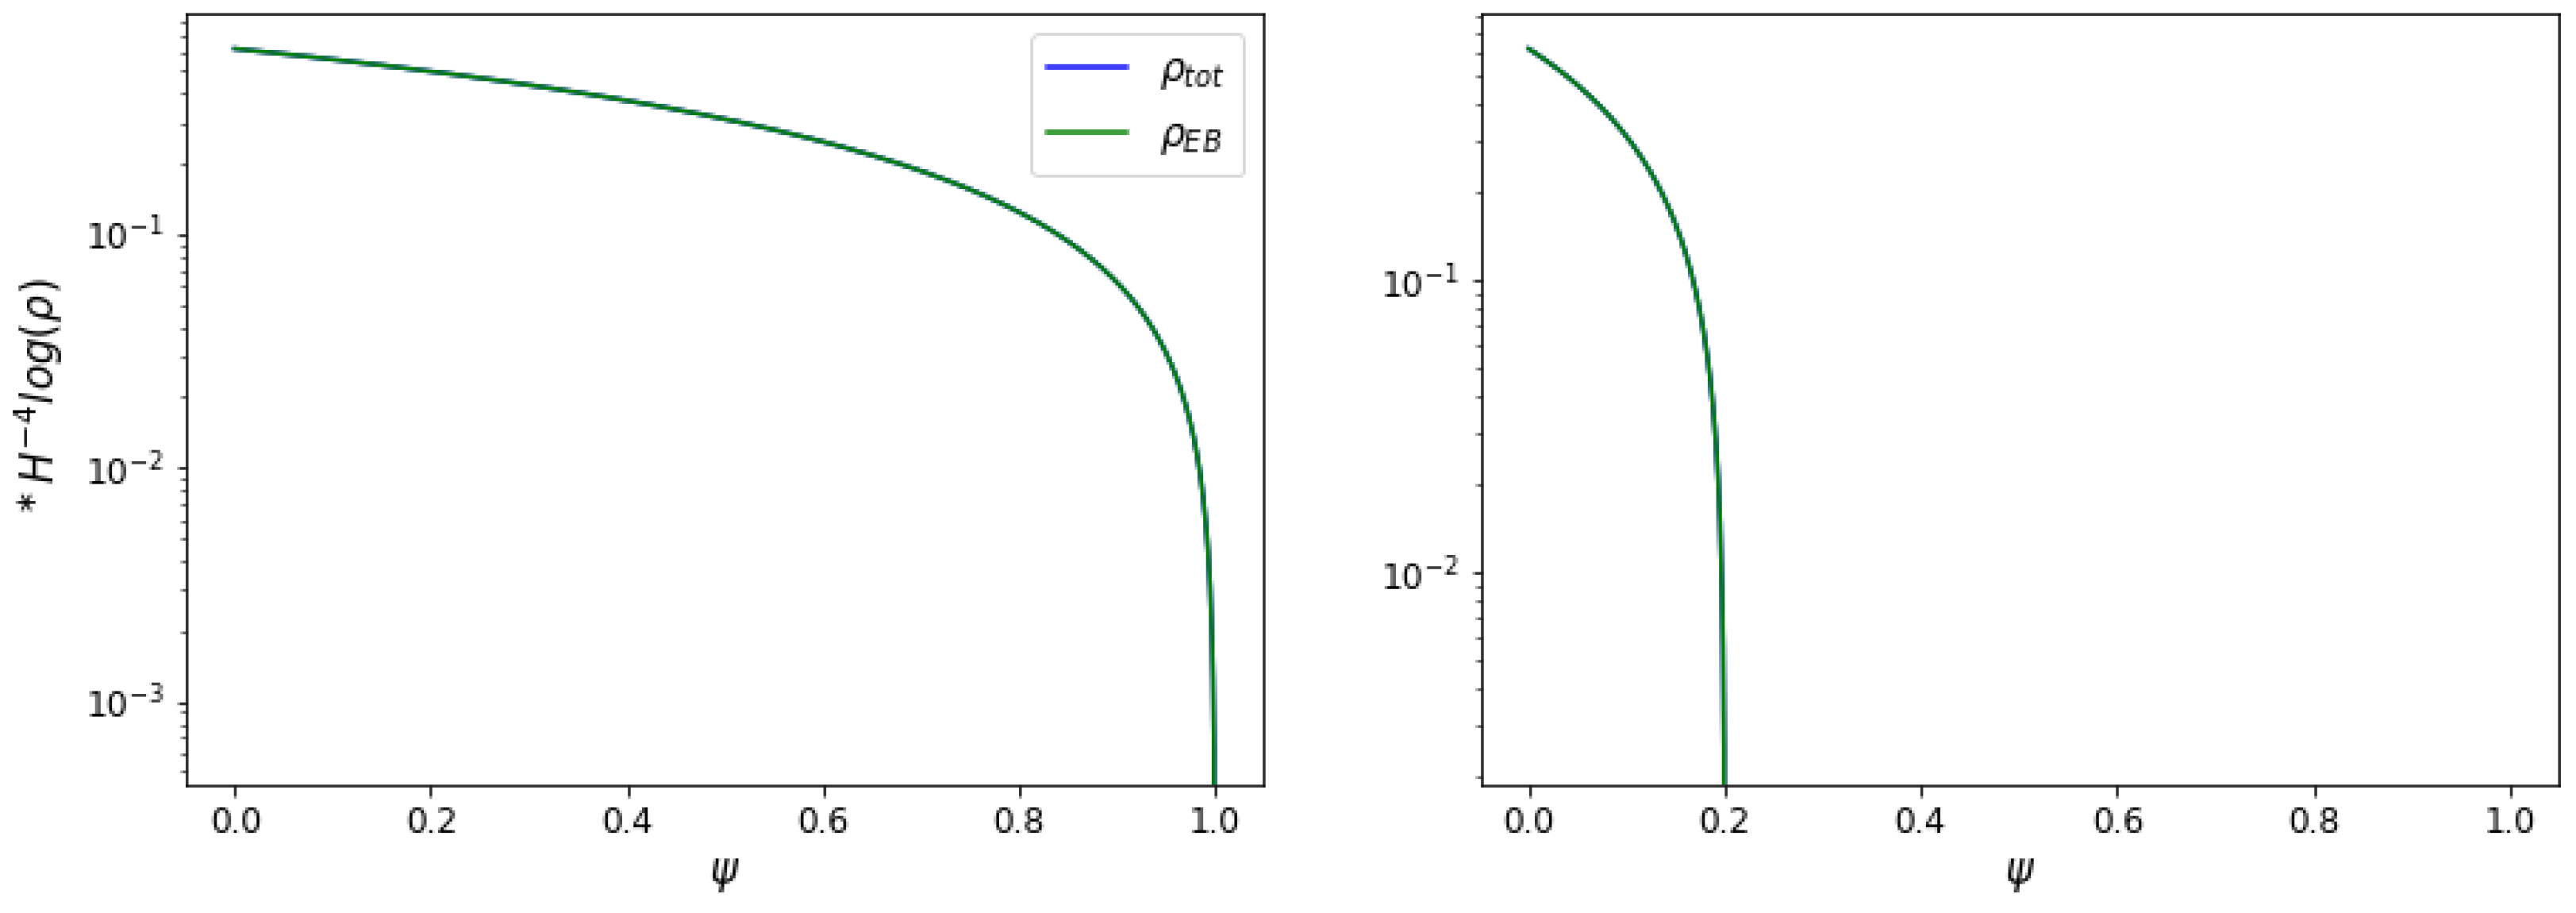
Figure 7 shows the similarity between ρ B (green line) and ρ t o t (blue line), yielding a negligible value of Δ ρ to avoid increased energy on inflation. The curve with μ = 5 falls rapidly for ψ = 0.2 , because energy densities run into the forbidden region.
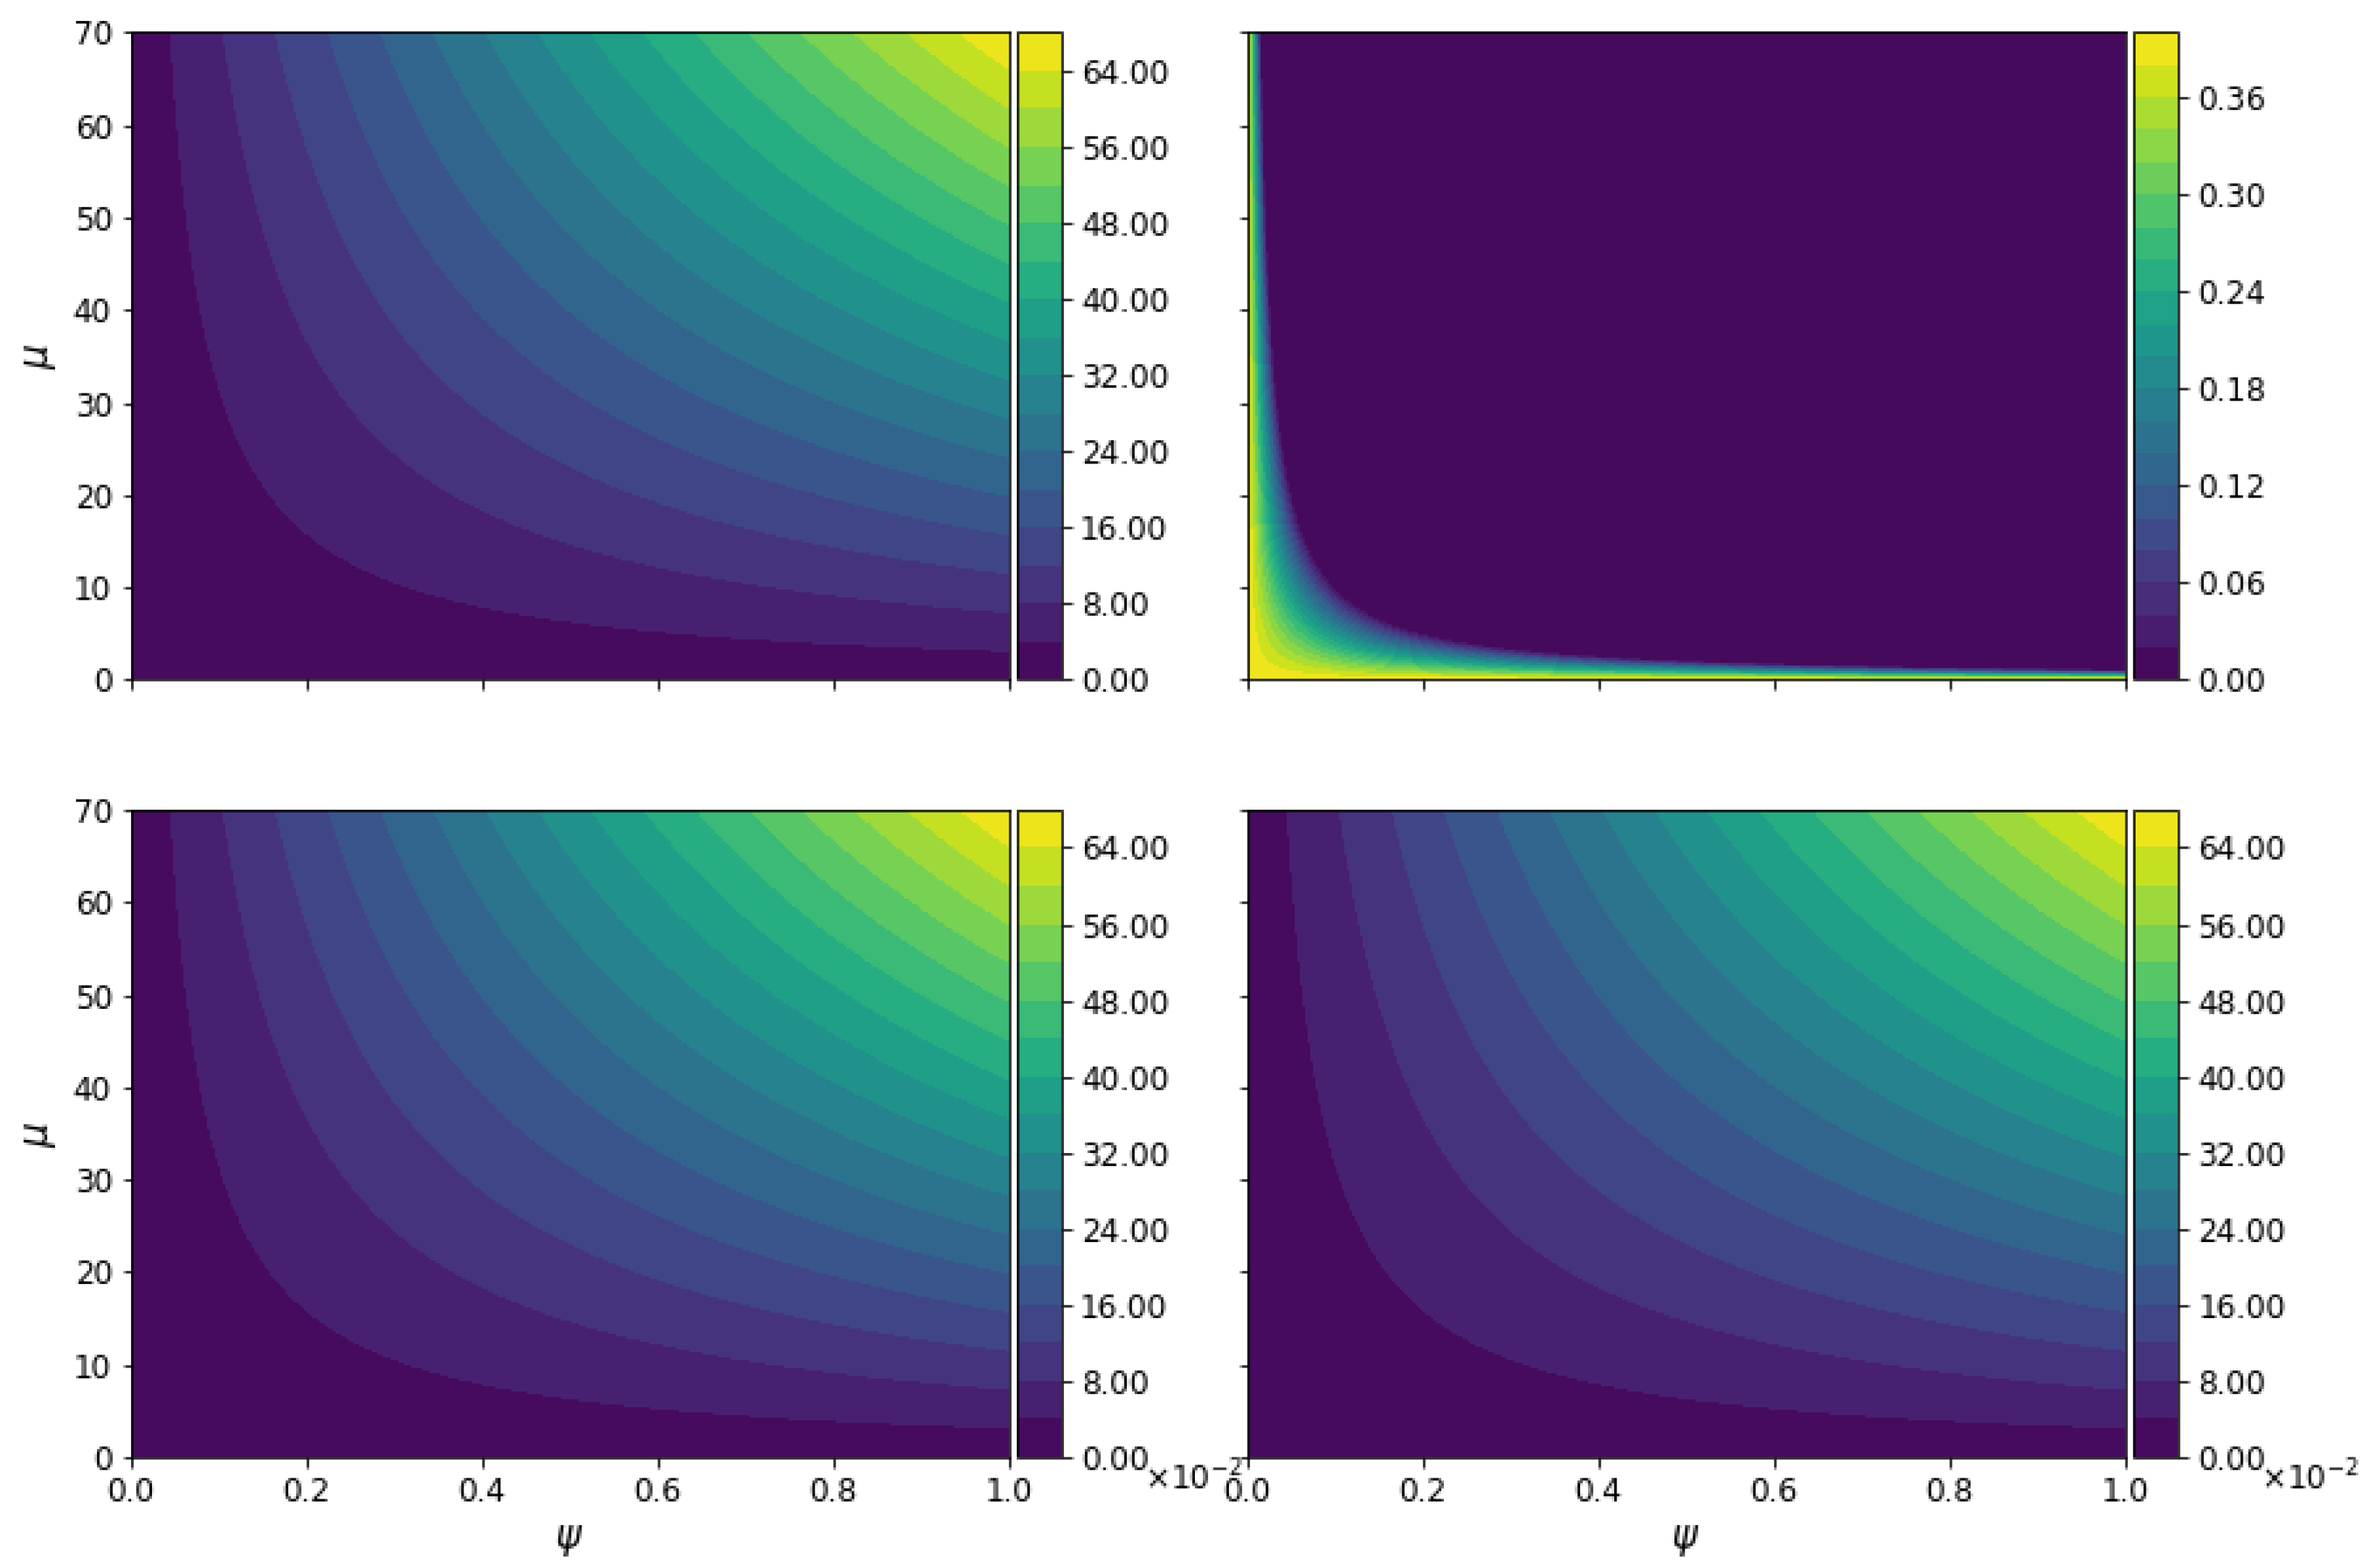
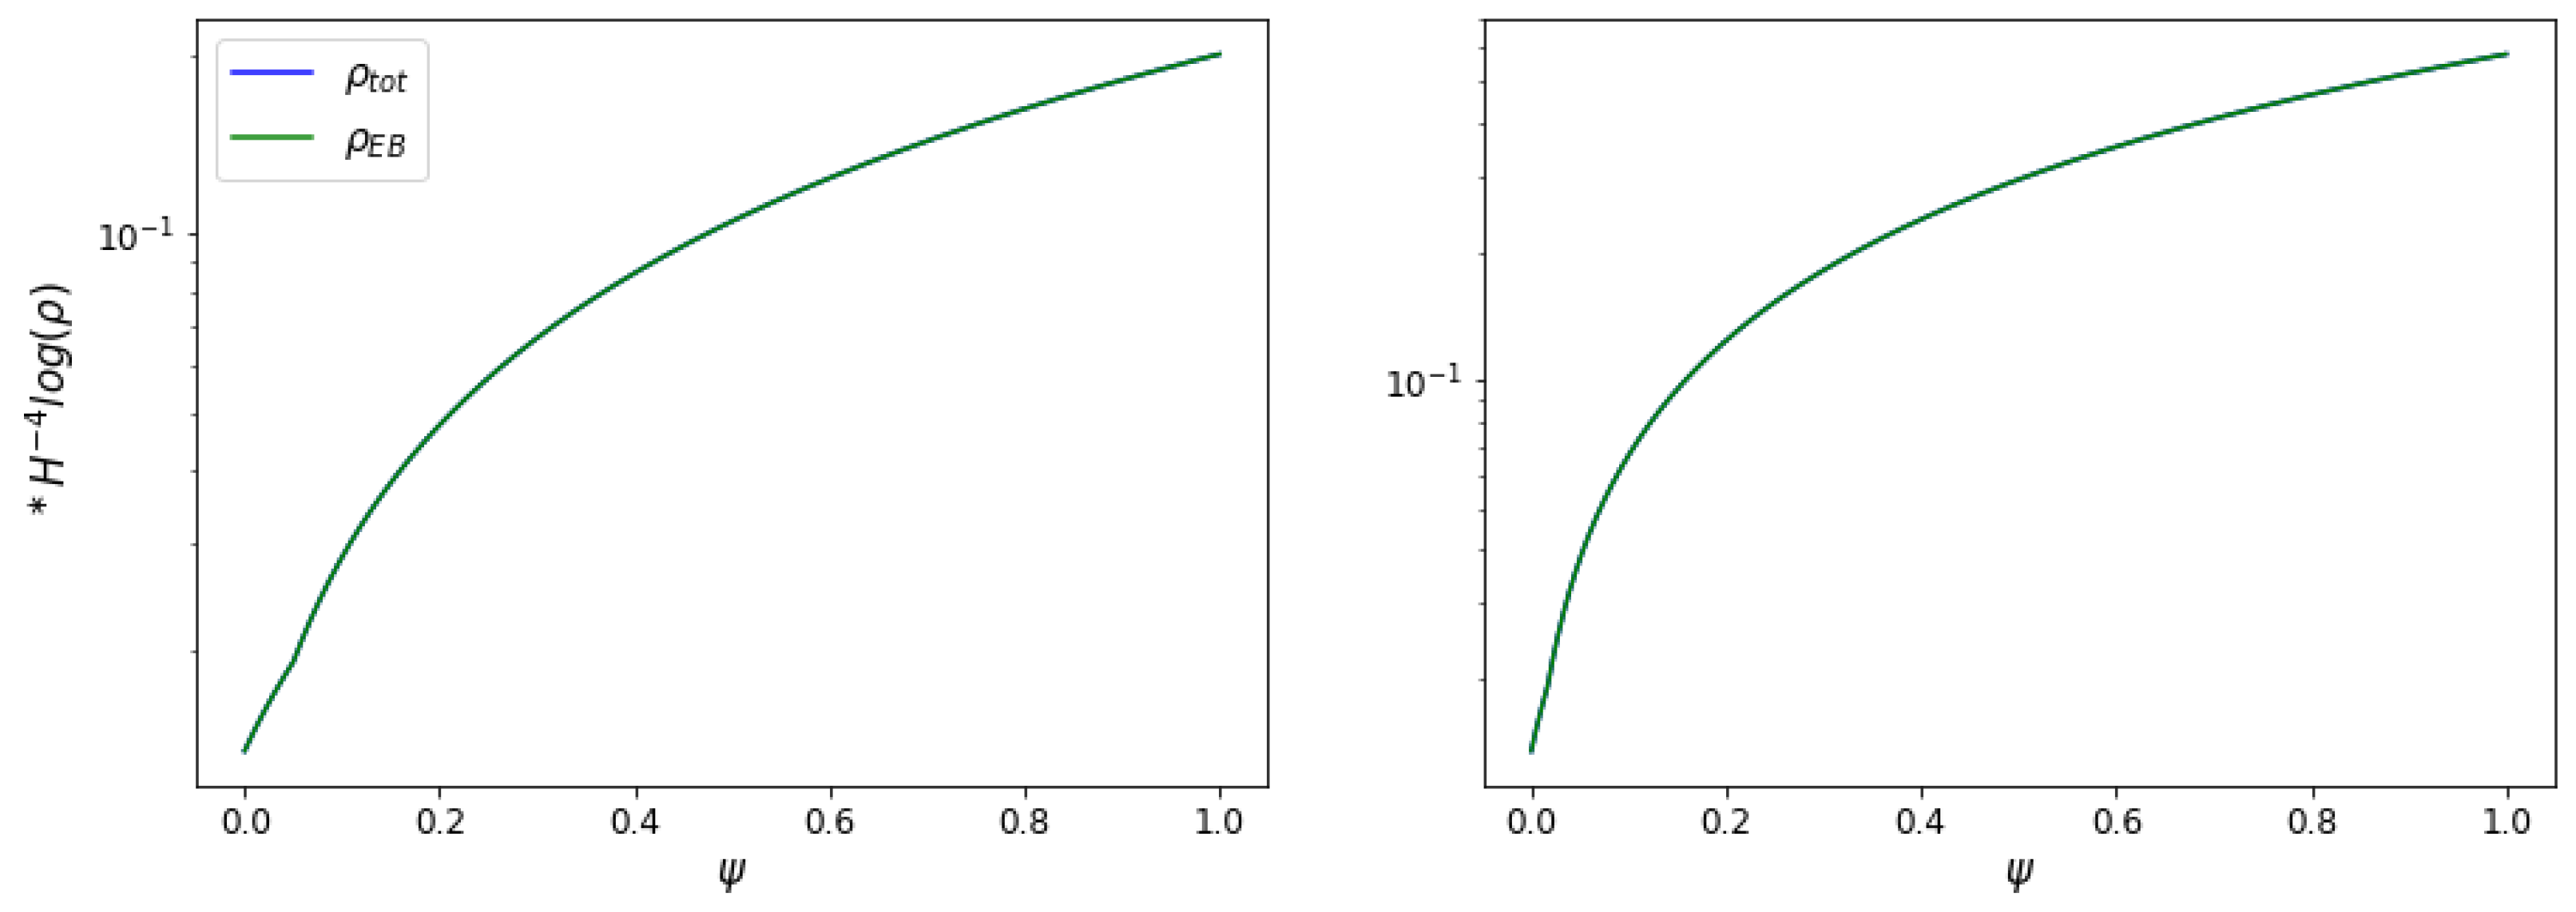
The top panel in Figure 8 shows the behavior of ρ E , ρ B while the bottom panel exhibits ρ E B = ρ E + ρ B and ρ t o t with δ = 0 . The forbidden region for ρ B expands quickly when ψ goes to 0.1 . In this case, Δ ρ contributes to constraining ρ t o t for the small values of ψ . Figure 9 unveils that when μ is greater, the contribution of Δ ρ notably affects ρ t o t . For μ = 50 , the enhancement of energy is faster than μ = 5 . In contrast, in Figure 10 and Figure 11, notice the null contribution from Δ ρ to the total energy density, i.e, ρ t o t is practically due to the contribution of ρ E . For the latter, the energy grows faster for μ = 60 than μ = 20 , especially in the range of ψ 0–20.
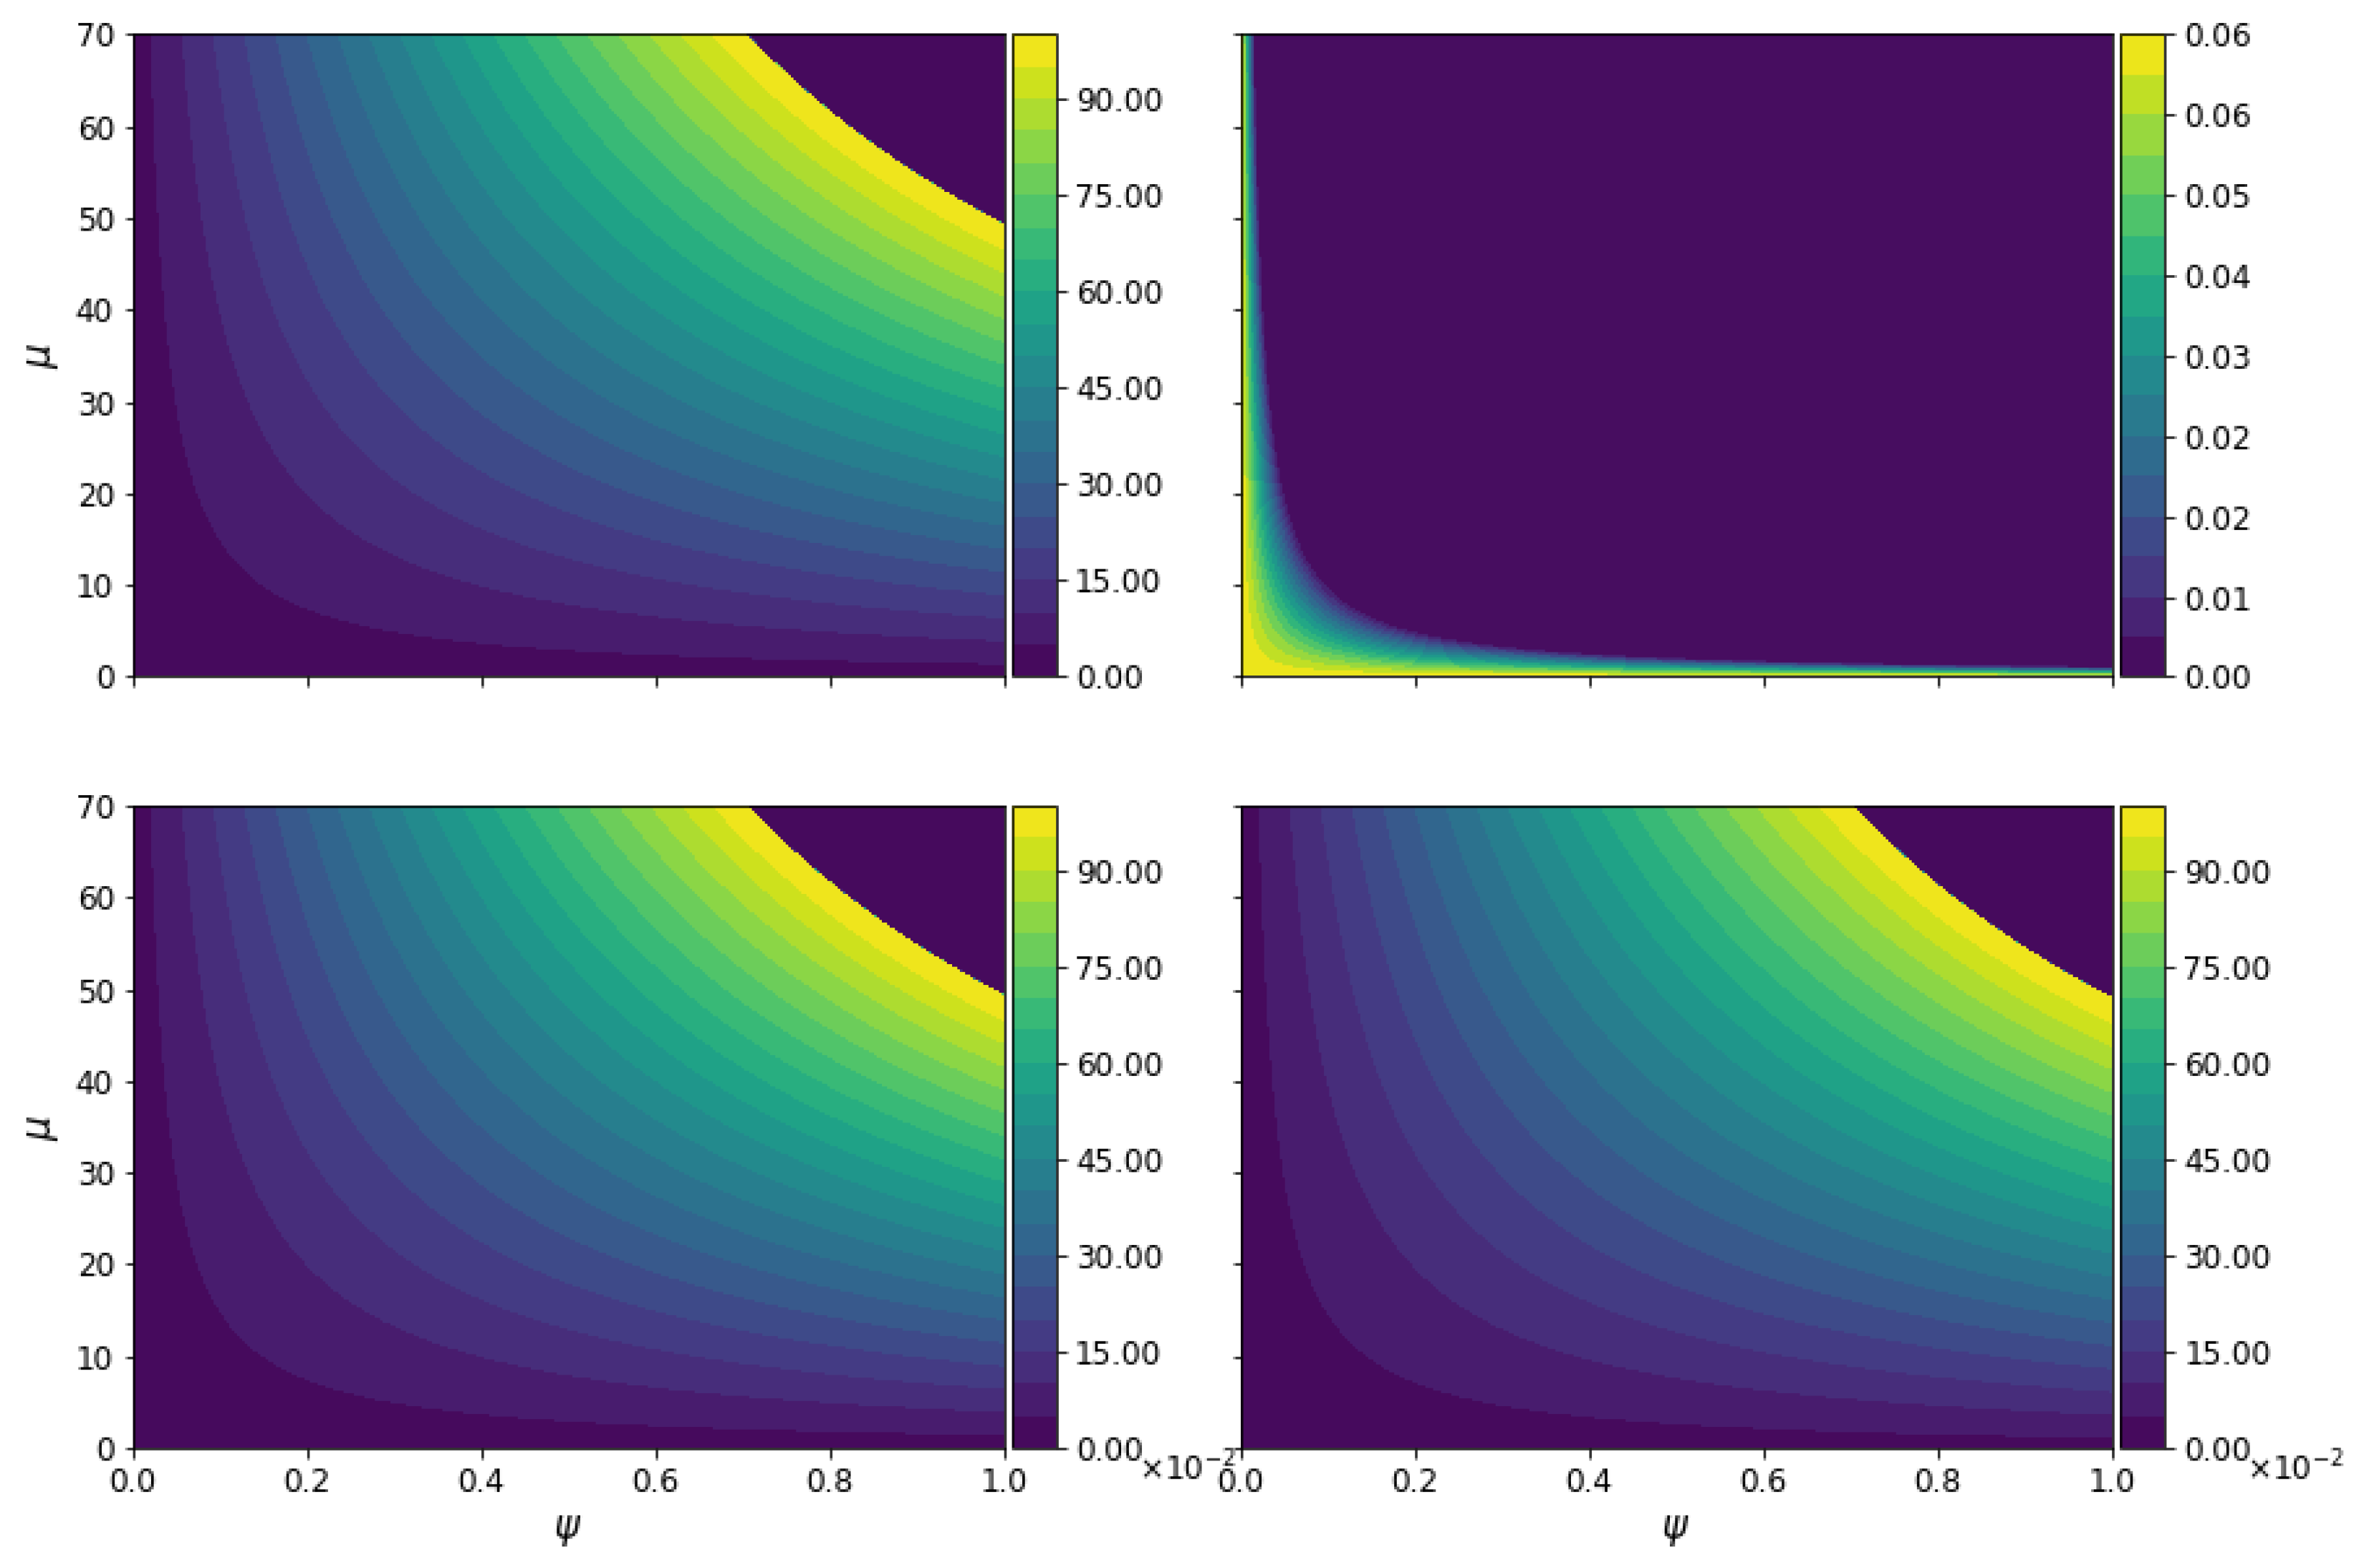
Finally, Figure 12 and Figure 13 present the behavior for a scale-invariant magnetic field. Here, Δ ρ does not contribute to the energy total density.
Let us now obtain the same observable quantities as we found in the Jordan frame. For the magnetic spectral index, we have
2 ( 2 π ) 3 P * B = k 2 < | A * | 2 > k n * B P * k n * B = 2 δ + 1 for k τ * < < 1 ,
using the fact that
B * ( k ) = k A * + ( k ) = e π γ g k 2 2 a * Q C * 3 k τ * δ + C * 4 k τ * δ + 1 .
While the magnetic field for the present epoch is
B * 0 = 0.63 ( 1 ψ μ ) × 10 10 G H * 10 5 M p l .
Finally, the helicity in this frame is written as
H * = A * · B * d 3 x H * = e δ γ g π 16 π 2 a * 2 Q | C 3 | 2 2 δ + 3 ( k τ * ) 2 δ k 3 + | C 4 | 2 2 δ + 5 ( k τ * ) 2 δ + 2 k 3 ,
while the kinetic helicity spectral index reads as
n * H = 2 δ + 2 .
As we can see from Equations (62) and (51), a disparity between both frames is clear.

5. Discussion about Jordan and Einstein Frames

Through this paper, we have shown differences in distinct quantities in scalar–tensor theories between Jordan and Einstein frames in the context of primordial magnetic fields by using a model of power law coupled to F 2 and F F ˜ . We found out that the magnetic spectral index and its helicity are similar in both frames. In contrast, the amplitude of the magnetic field today differs in each frame (see (65)). It is important to remark that different assumptions have been taken throughout the work to find the above results, limiting the solutions that we have encountered. The primary goal of this paper was to compare observables between Jordan and Einstein frames via asymptotic solutions found in the scenario of magnetogenesis. For more detail about the evolution of the electromagnetic field during inflation, see [51,54].
Finally, the ratio between the amplitudes of the magnetic field in Jordan and Einstein frames (using Equations (62) and (51)) in the actual epoch (assuming a scale-invariant case) is written as
B * 0 B 0 = ( 1 ψ μ ) H * H .
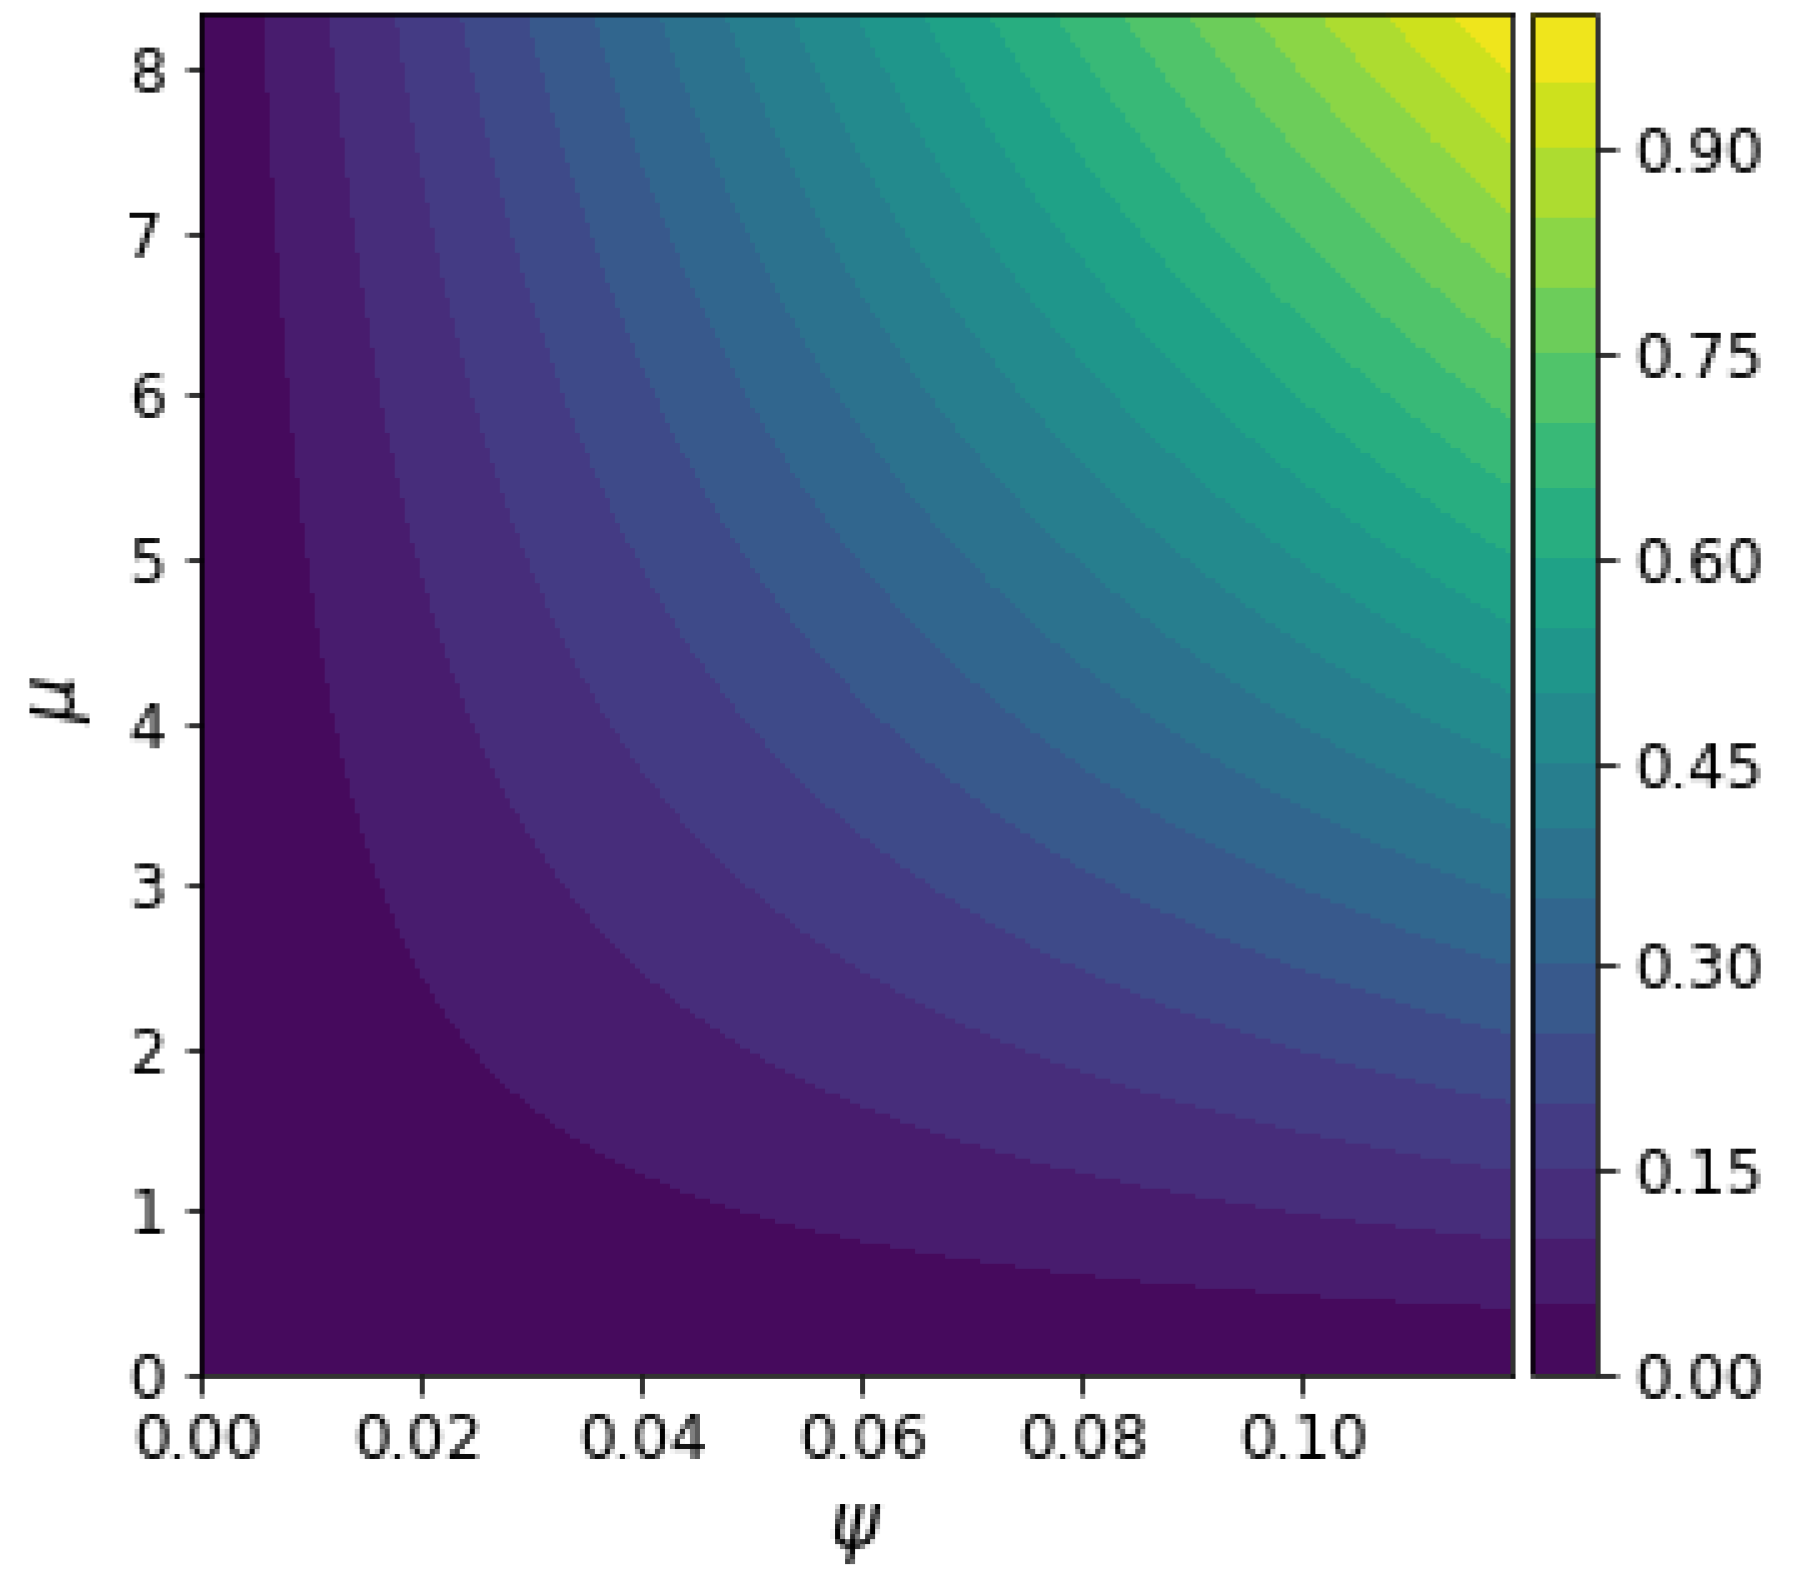
This equation depends on two factors, the constraints values (see Figure 12) and the Hubble parameters in both frames. To show an approximate relation between the Hubble parameters in each frame, let us take two values, μ and ψ , from Figure 14 (this figure is a zoomed-in perspective of the permitted values for μ and ψ of the ρ B values). For example, assuming μ = 5 and ψ = 0.1 , and a value of B 0 = 10 nG, we can find that H * = H with B * 0 = 5 nG.
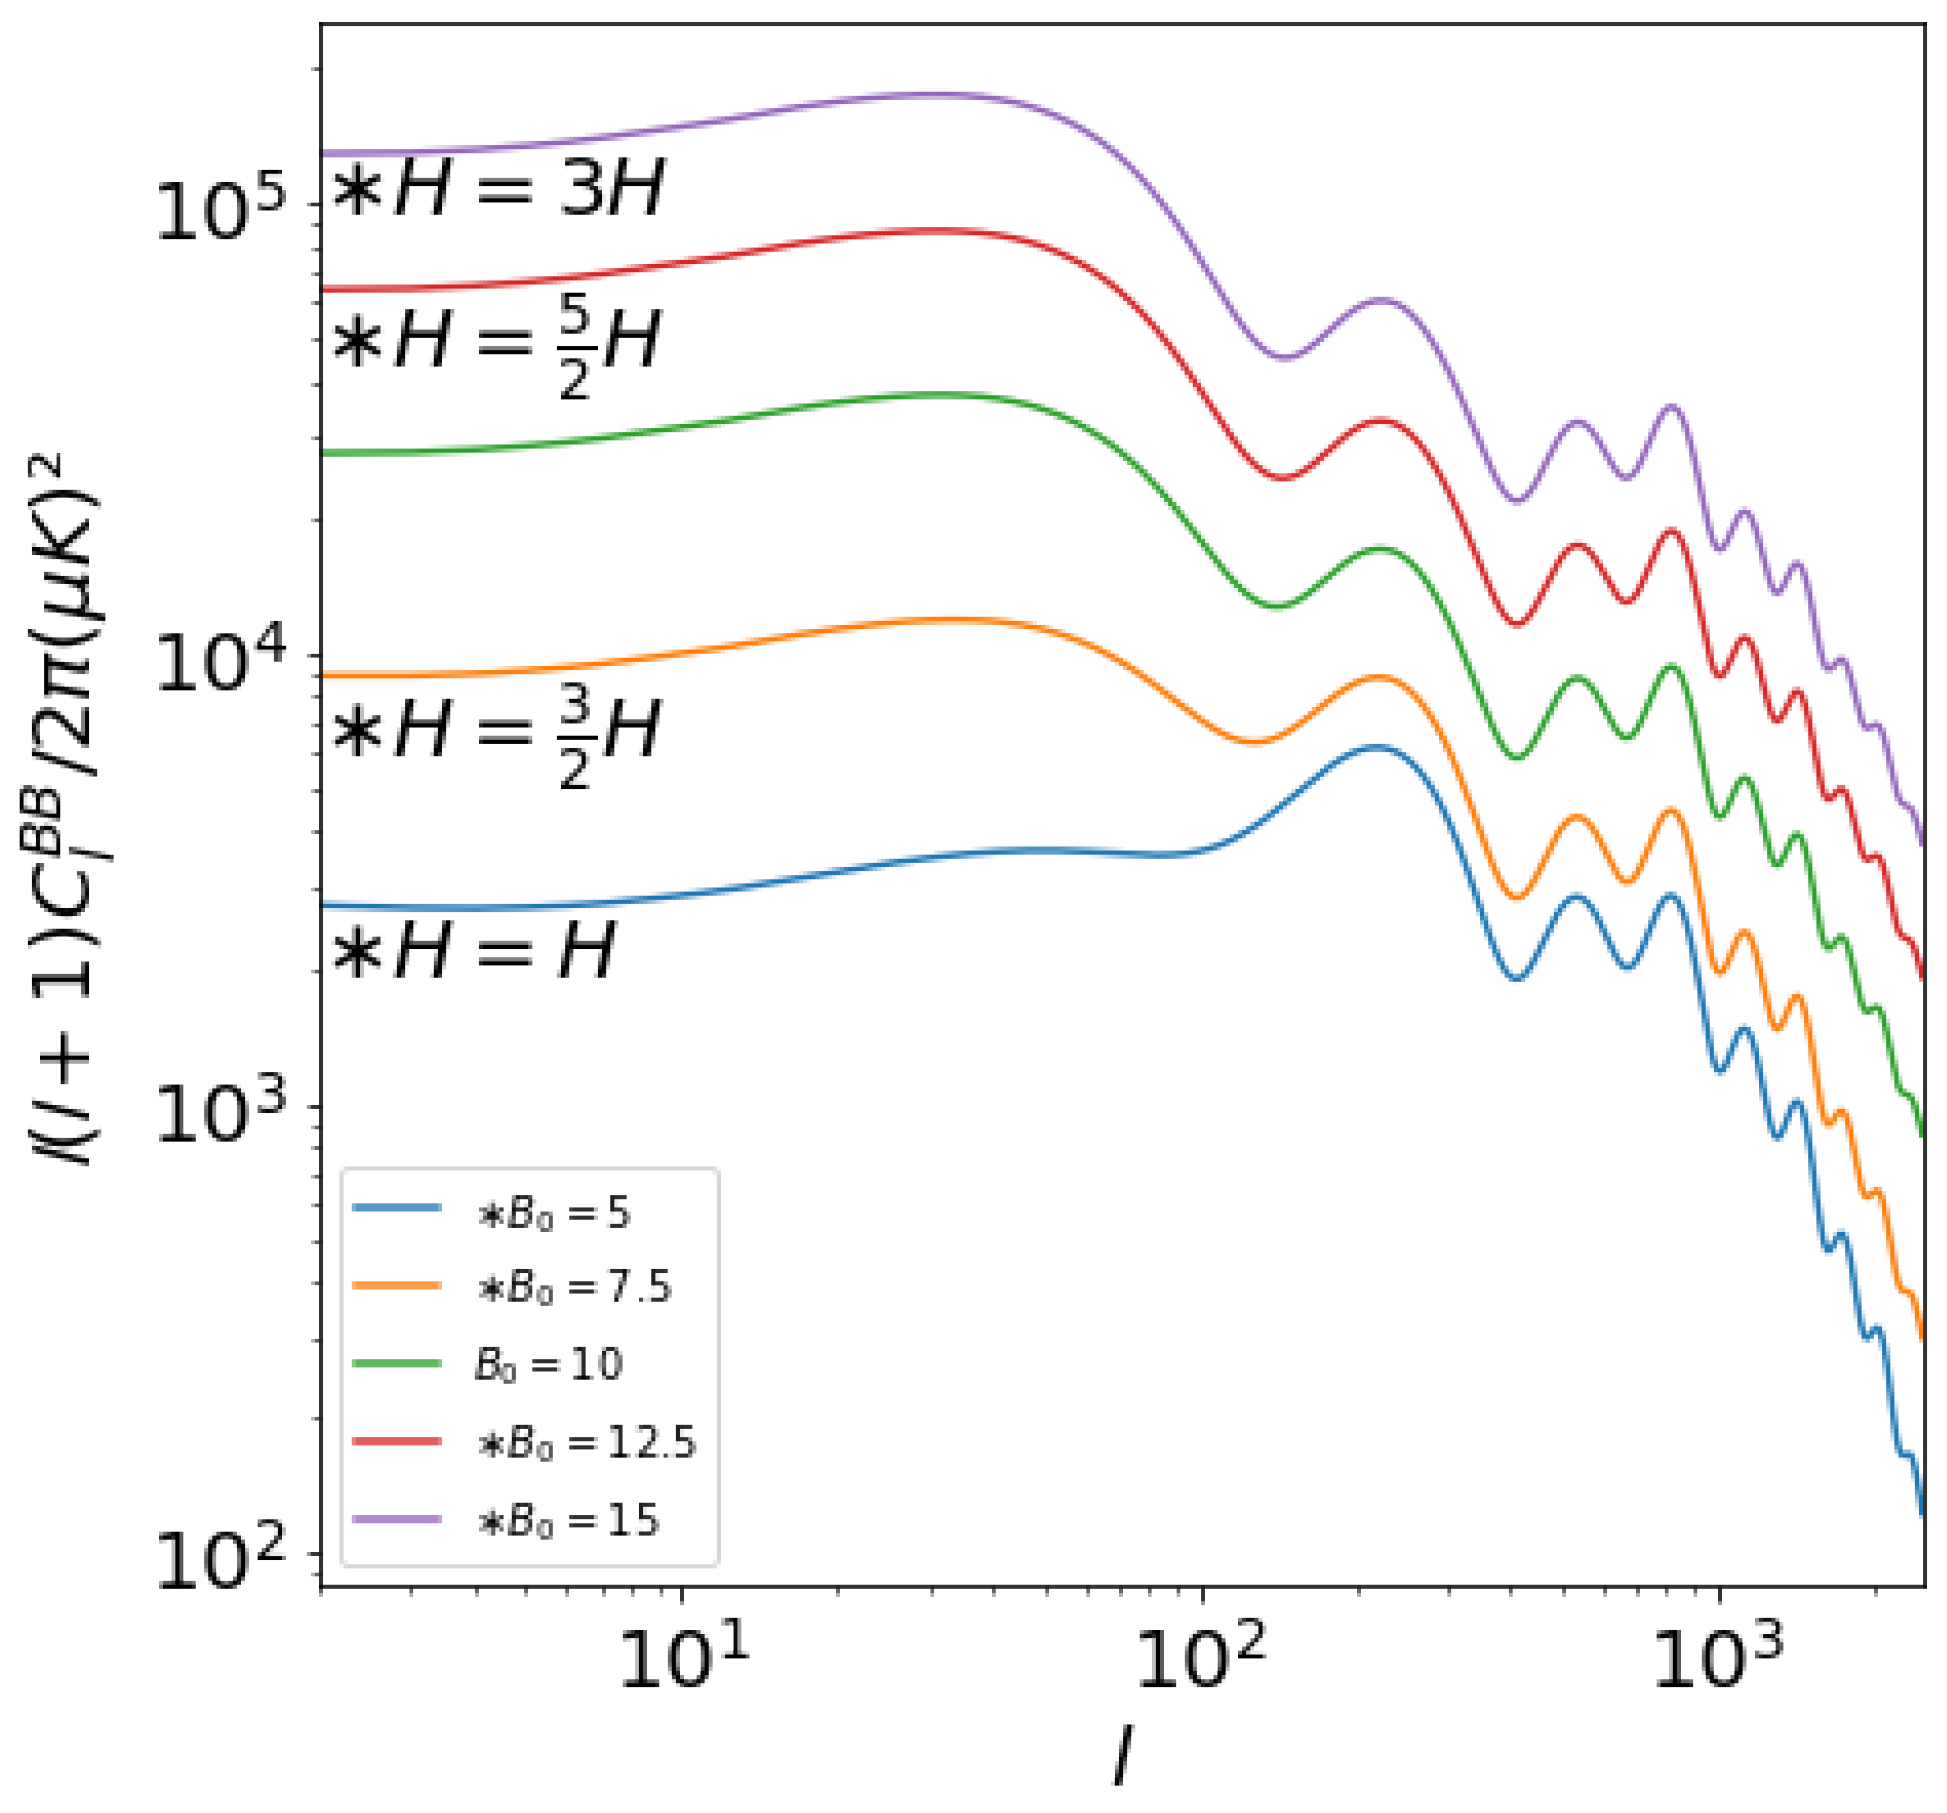
In Figure 15 (this figure was realized using a patch of the CAMB code account for primordial magnetic field [55,56]), we can see the relation between these two parameters for one value of the amplitude of the magnetic field in JF, B 0 = 10 nG, and different values of the magnetic field in EF, B * 0 = 5 , 7.5 , 12.5 , 15 nG, taking n b = 2.9 .

6. Conclusions

This paper aims to provide a detailed side-by-side comparison of the Jordan and Einstein frames within the primordial magnetic field cosmological scenario. We have calculated the electromagnetic energy density in both frames, where the electric and magnetic energy densities along with other contributions from couplings between the gravity sector with the electromagnetic field tensor contribute to the total energy density. Assuming a power law model in the magnetic spectra, we found that in Jordan frame the electric and magnetic energy densities only depend on the power ξ . In contrast, the total energy density in the Einstein frame depends not only on the power of the coupling but also on additional parameters relevant to not spoiling inflation energy (59). The amount Δ ρ (the other contributions of the energy density) was restricted in both frames. For instance, in the Jordan frame, the parameters that we found were α and β , while in the Einstein frame, we used ψ and ν . The μ and ν terms are seen as a result because when we do the equivalence between the scalar–tensor theory in the Jordan frame and f ( R ) -gravity we turn off the ω term, but this does not happen in the other frame. We obtained the same value, for which the magnetic field is scale-invariant, and we derived a relation to the present magnetic field in both frames in the case of scale invariance (65).

Author Contributions

Conceptualization, methodology, software and writing—original draft preparation, J.V. and H.J.H.; writing—review and editing, visualization and supervision, L.C. All authors have read and agreed to the published version of the manuscript.

Funding

Joel Velásquez and Leonardo Castañeda were supported by Patrimonio Autónomo—Fondo Nacional de Financiamiento para la Ciencia, la Tecnología y la Innovación Francisco José de Caldas (MINCIENCIAS—COLOMBIA) Grant No. 110685269447 RC-80740-465-2020, projects 69723.

Data Availability Statement

No data were used in the present work.

Conflicts of Interest

The authors declare no conflicts of interest.

References

  1. Riess, A.G.; Filippenko, A.V.; Challis, P.; Clocchiatti, A.; Diercks, A.; Garnavich, P.M.; Gilliland, R.L.; Hogan, C.J.; Jha, S.; Kirshner, R.P.; et al. Observational evidence from supernovae for an accelerating universe and a cosmological constant. Astron. J. 1998, 116, 1009–1038. [Google Scholar] [CrossRef]
  2. Perlmutter, S.; Aldering, G.; Goldhaber, G.; Knop, R.A.; Nugent, P.; Castro, P.G.; Deustua, S.; Fabbro, S.; Goobar, A.; Groom, D.E.; et al. Measurements of Omega and Lambda from 42 high redshift supernovae. Astrophys. J. 1999, 517, 565–586. [Google Scholar] [CrossRef]
  3. Padmanabhan, T. Cosmological constant—the weight of the vacuum. Phys. Rep. 2003, 380, 235–320. [Google Scholar] [CrossRef]
  4. Carroll, S.M. The Cosmological Constant. Living Rev. Relativ. 2001, 4, 1. [Google Scholar] [CrossRef]
  5. Brans, C.; Dicke, R.H. Mach’s Principle and a Relativistic Theory of Gravitation. Phys. Rev. 1961, 124, 925–935. [Google Scholar] [CrossRef]
  6. Fujii, Y.; Maeda, K. The Scalar-Tensor Theory of Gravitation; Cambridge Monographs on Mathematical Physics; Cambridge University Press: Cambridge, UK, 2007. [Google Scholar] [CrossRef]
  7. Faraoni, V. Cosmology in Scalar Tensor Gravity; Springer: Dordrecht, The Netherlands, 2004. [Google Scholar] [CrossRef]
  8. Quiros, I. Selected topics in scalar–tensor theories and beyond. Int. J. Mod. Phys. D 2019, 28, 1930012. [Google Scholar] [CrossRef]
  9. Carroll, S.M.; Duvvuri, V.; Trodden, M.; Turner, M.S. Is cosmic speed-up due to new gravitational physics? Phys. Rev. D 2004, 70, 043528. [Google Scholar] [CrossRef]
  10. Chiba, T. 1/R gravity and scalar-tensor gravity. Phys. Lett. B 2003, 575, 1–3. [Google Scholar] [CrossRef]
  11. Nojiri, S.; Odintsov, S.D. Where new gravitational physics comes from: M-theory? Phys. Lett. B 2003, 576, 5–11. [Google Scholar] [CrossRef]
  12. Rasouli, S.; Moniz, P.V. Gravity-driven acceleration and kinetic inflation in noncommutative brans-dicke setting. Odessa Astron. Publ. 2016, 29, 19–24. [Google Scholar] [CrossRef]
  13. Quaglia, R.G.; German, G. A comparison between the Jordan and Einstein Frames in Brans-Dicke theories with torsion. arXiv 2023, arXiv:2206.14228. [Google Scholar] [CrossRef]
  14. Carloni, S.; Dunsby, P.K.S.; Capozziello, S.; Troisi, A. Cosmological dynamics of Rn gravity. Class. Quantum Gravity 2005, 22, 4839–4868. [Google Scholar] [CrossRef]
  15. Felice, A.D.; Tsujikawa, S. f(R) Theories. Living Rev. Relativ. 2010, 13, 3. [Google Scholar] [CrossRef] [PubMed]
  16. Amendola, L.; Polarski, D.; Tsujikawa, S. Are f(R) Dark Energy Models Cosmologically Viable? Phys. Rev. Lett. 2007, 98, 131302. [Google Scholar] [CrossRef] [PubMed]
  17. Nojiri, S.; Odintsov, S.D.; Gorbunova, O.G. Dark energy problem: From phantom theory to modified Gauss–Bonnet gravity. J. Phys. A Math. Gen. 2006, 39, 6627–6633. [Google Scholar] [CrossRef]
  18. Amendola, L.; Charmousis, C.; Davis, S.C. Constraints on Gauss–Bonnet gravity in dark energy cosmologies. J. Cosmol. Astropart. Phys. 2006, 2006, 020. [Google Scholar] [CrossRef]
  19. Fernandes, P.G.S.; Carrilho, P.; Clifton, T.; Mulryne, D.J. The 4D Einstein–Gauss–Bonnet theory of gravity: A review. Class. Quantum Gravity 2022, 39, 063001. [Google Scholar] [CrossRef]
  20. Dvali, G.; Gabadadze, G.; Porrati, M. 4D gravity on a brane in 5D Minkowski space. Phys. Lett. B 2000, 485, 208–214. [Google Scholar] [CrossRef]
  21. Maartens, R.; Koyama, K. Brane-World Gravity. Living Rev. Relativ. 2010, 13, 5. [Google Scholar] [CrossRef]
  22. Rasouli, S.M.M.; Bahrehbakhsh, A.F.; Jalalzadeh, S.; Farhoudi, M. Quantum mechanics and geodesic deviation in the brane world. Europhys. Lett. 2009, 87, 40006. [Google Scholar] [CrossRef]
  23. Rasouli, S.M.M.; Cheraghchi, S.; Moniz, P. Fractional Scalar Field Cosmology. Fractal Fract. 2024, 8, 281. [Google Scholar] [CrossRef]
  24. Faraoni, V.; Gunzig, E. Einstein frame or Jordan frame? arXiv 1999, arXiv:astro-ph/9910176. [Google Scholar] [CrossRef]
  25. Capozziello, S.; de Ritis, R.; Marino, A.A. Some aspects of the cosmological conformal equivalence between the ‘Jordan frame’ and the ‘Einstein frame’. Class. Quantum Gravity 1997, 14, 3243–3258. [Google Scholar] [CrossRef]
  26. Flanagan, É.É. The conformal frame freedom in theories of gravitation. Class. Quantum Gravity 2004, 21, 3817–3829. [Google Scholar] [CrossRef]
  27. Quiros, I.; García-Salcedo, R.; Madriz-Aguilar, J.E.; Matos, T. The conformal transformation’s controversy: What are we missing? Gen. Relativ. Gravit. 2012, 45, 489–518. [Google Scholar] [CrossRef]
  28. Rashidi, R. Hubble diagrams in the Jordan and Einstein frames. Gen. Relativ. Gravit. 2018, 51, 8. [Google Scholar] [CrossRef]
  29. Rondeau, F.; Li, B. Equivalence of cosmological observables in conformally related scalar tensor theories. Phys. Rev. D 2017, 96, 124009. [Google Scholar] [CrossRef]
  30. Dicke, R.H. Mach’s Principle and Invariance under Transformation of Units. Phys. Rev. 1962, 125, 2163–2167. [Google Scholar] [CrossRef]
  31. Faraoni, V.; Nadeau, S. (Pseudo)issue of the conformal frame revisited. Phys. Rev. D 2007, 75, 023501. [Google Scholar] [CrossRef]
  32. Postma, M.; Volponi, M. Equivalence of the Einstein and Jordan frames. Phys. Rev. D 2014, 90, 103516. [Google Scholar] [CrossRef]
  33. Bahamonde, S.; Odintsov, S.D.; Oikonomou, V.; Tretyakov, P.V. Deceleration versus acceleration universe in different frames of F(R) gravity. Phys. Lett. B 2017, 766, 225–230. [Google Scholar] [CrossRef]
  34. Rinaldi, M. On the equivalence of Jordan and Einstein frames in scale-invariant gravity. Eur. Phys. J. Plus 2018, 133, 408. [Google Scholar] [CrossRef]
  35. Francfort, J.; Ghosh, B.; Durrer, R. Cosmological number counts in Einstein and Jordan frames. J. Cosmol. Astropart. Phys. 2019, 2019, 071. [Google Scholar] [CrossRef]
  36. Subramanian, K. The origin, evolution and signatures of primordial magnetic fields. Rep. Prog. Phys. 2016, 79, 076901. [Google Scholar] [CrossRef] [PubMed]
  37. Hortúa, H.J.; Castañeda, L. Reduced bispectrum seeded by helical primordial magnetic fields. J. Cosmol. Astropart. Phys. 2017, 2017, 020. [Google Scholar] [CrossRef]
  38. Caprini, C.; Sorbo, L. Adding helicity to inflationary magnetogenesis. J. Cosmol. Astropart. Phys. 2014, 2014, 056. [Google Scholar] [CrossRef]
  39. Bamba, K.; Elizalde, E.; Odintsov, S.; Paul, T. Inflationary magnetogenesis with reheating phase from higher curvature coupling. J. Cosmol. Astropart. Phys. 2021, 2021, 009. [Google Scholar] [CrossRef]
  40. Bamba, K.; Odintsov, S.D.; Paul, T.; Maity, D. Helical magnetogenesis with reheating phase from higher curvature coupling and baryogenesis. arXiv 2022, arXiv:2107.11524. [Google Scholar] [CrossRef]
  41. Yanagihara, K.; Uchida, F.; Fujita, T.; Tsujikawa, S. Low-Scale Inflationary Magnetogenesis without Baryon Isocurvature Problem. arXiv 2023, arXiv:2312.07938. [Google Scholar] [CrossRef]
  42. Adshead, P.; Giblin, J.T.; Scully, T.R.; Sfakianakis, E.I. Magnetogenesis from axion inflation. J. Cosmol. Astropart. Phys. 2016, 2016, 039. [Google Scholar] [CrossRef]
  43. Nojiri, S.; Odintsov, S.; Oikonomou, V. Modified gravity theories on a nutshell: Inflation, bounce and late-time evolution. Phys. Rep. 2017, 692, 1–104. [Google Scholar] [CrossRef]
  44. Velásquez, J.; Castañeda, L. Equivalence between Scalar-Tensor theories and f(R)-gravity: From the action to cosmological perturbations. J. Phys. Commun. 2020, 4, 055007. [Google Scholar] [CrossRef]
  45. Nojiri, S.; Odintsov, S.D. Unified cosmic history in modified gravity: From f(R) theory to Lorentz non-invariant models. Phys. Rep. 2011, 505, 59–144. [Google Scholar] [CrossRef]
  46. Ziaie, A.H.; Atazadeh, K.; Rasouli, S.M.M. Naked singularity formation in f(R) gravity. Gen. Relativ. Gravit. 2011, 43, 2943–2963. [Google Scholar] [CrossRef]
  47. Bahamonde, S.; Odintsov, S.; Oikonomou, V.; Wright, M. Correspondence of F(R) Gravity Singularities in Jordan and Einstein Frames. Ann. Phys. 2016, 373, 96–114. [Google Scholar] [CrossRef]
  48. Subramanian, K. Magnetic fields in the early Universe. Astron. Nachrichten 2010, 331, 110–120. [Google Scholar] [CrossRef]
  49. Markkanen, T.; Nurmi, S.; Räsänen, S.; Vennin, V. Narrowing the window of inflationary magnetogenesis. J. Cosmol. Astropart. Phys. 2017, 2017, 035. [Google Scholar] [CrossRef]
  50. Sharma, R.; Subramanian, K.; Seshadri, T. Generation of helical magnetic field in a viable scenario of inflationary magnetogenesis. Phys. Rev. D 2018, 97, 083503. [Google Scholar] [CrossRef]
  51. Durrer, R.; Sobol, O.; Vilchinskii, S. Magnetogenesis in Higgs-Starobinsky inflation. Phys. Rev. D 2022, 106, 123520. [Google Scholar] [CrossRef]
  52. Bamba, K.; Odintsov, S.D. Inflation and late-time cosmic acceleration in non-minimal Maxwell-F(R) gravity and the generation of large-scale magnetic fields. J. Cosmol. Astropart. Phys. 2008, 2008, 024. [Google Scholar] [CrossRef]
  53. Olver, F.W.J.; Lozier, D.W.; Boisvert, R.F.; Clark, C.W. The NIST Handbook of Mathematical Functions; Cambridge University Press: Cambridge, UK, 2010. [Google Scholar]
  54. Savchenko, O.; Shtanov, Y. Magnetogenesis by non-minimal coupling to gravity in the Starobinsky inflationary model. J. Cosmol. Astropart. Phys. 2018, 2018, 040. [Google Scholar] [CrossRef]
  55. Zucca, A.; Li, Y.; Pogosian, L. Constraints on primordial magnetic fields from Planck data combined with the South Pole Telescope CMB B-mode polarization measurements. Phys. Rev. D 2017, 95, 063506. [Google Scholar] [CrossRef]
  56. Lewis, A.; Challinor, A.; Lasenby, A. Efficient Computation of Cosmic Microwave Background Anisotropies in Closed Friedmann-Robertson-Walker Models. Astrophys. J. 2000, 538, 473–476. [Google Scholar] [CrossRef]
Figure 1. Contour plots of the forbidden regions (in purple) for Δ ρ for four different values of ξ . The left and right upper plots display the region for ξ = 2 and ξ = 0 , respectively. ξ = 1 and ξ = 2 are described in the left and right bottom plots, respectively.
Universe 10 00350 g001
Figure 2. Plots for Δ ρ (red line), ρ E B = ρ E + ρ B (green line), and ρ t o t (blue line) using β = 0.01 (left plot) and β = 1.9 (right plot) for ξ = 2 .
Universe 10 00350 g002
Figure 3. Plots for Δ ρ (red line), ρ E B = ρ E + ρ B (green line), and ρ t o t (blue line) using β = 0.01 (left plot) and β = 4 (right plot) for ξ = 0 .
Universe 10 00350 g003
Figure 4. Plot for Δ ρ (red line), ρ E B = ρ E + ρ B (green line), and ρ t o t (blue line) using β = 25 (left plot) and β = 65 (right plot) for ξ = 1 .
Universe 10 00350 g004
Figure 5. Plot for Δ ρ (red line), ρ E B = ρ E + ρ B (green line), and ρ t o t (blue line) using β = 10 (left plot) and β = 40 (right plot) for ξ = 2 .
Universe 10 00350 g005
Figure 6. Contour plots display the forbidden regions for ρ B (left plot) and ρ t o t (right plot) taking δ = 2 . ψ runs from 0 to 1, μ ranges 0–70, and ν = 0.5 . Here, the amplitude scale is × 10 2 and the forbidden values are shown in purple. We can see that the greatest contribution comes from ρ E .
Universe 10 00350 g006
Figure 7. Plots for ρ E B = ρ E + ρ B (green line) and ρ t o t (blue line) taking μ = 1 (left plot) and μ = 5 (right plot). The remaining values are δ = 2 , ν = 0.5 , and ψ goes from 0 to 1.
Universe 10 00350 g007
Figure 8. Contour plot for forbidden regions for ρ E (left upper plot), ρ B (right upper plot), ρ E B = ρ E + ρ B (left bottom plot), and ρ t o t (right bottom plot) taking δ = 0 . ψ goes from 0 to 1, μ ranges 0–70, and ν = 0.5 . Here, the scale is × 10 2 , and the forbidden values are shown in purple.
Universe 10 00350 g008
Figure 9. Plots for ρ E B (green line), ρ t o t (blue line) taking μ = 5 (left plot), and μ = 50 (right plot) for δ = 0 , ν = 0.5 , and ψ ranges 0–1.
Universe 10 00350 g009
Figure 10. Contour plot with the permitted values and forbidden regions for ρ E (left upper plot), ρ B (right upper plot), ρ E B (left bottom plot), and ρ t o t (right bottom plot) with δ = 1 . ψ runs from 0 to 1, μ ranges 0–70. Here, the scale of the plots is × 10 2 , and the forbidden values are shown in purple.
Universe 10 00350 g010
Figure 11. Plot for ρ E B (green line) and ρ t o t (blue line) taking μ = 20 (left plot) and μ = 60 (right plot) for δ = 1 and choosing ν = 0.5 , ψ goes 0–1.
Universe 10 00350 g011
Figure 12. Contour plot with the permitted values and forbidden regions for ρ E (left upper plot), ρ B (right upper plot), ρ E B (left bottom plot), and ρ t o t (right bottom plot) with δ = 2 . Here, the scale is × 10 2 and the forbidden values are in purple. We can see two prohibited regions, the first one for small μ and ψ values, and the second one for μ above 50 and ψ are higher than 0.6 .
Universe 10 00350 g012
Figure 13. Plots for ρ E B (green line) and ρ t o t (blue line) taking μ = 10 (left plot) and μ = 60 (right plot) for δ = 2 , choosing ν = 0.5 , ψ ranges 0–1.
Universe 10 00350 g013
Figure 14. Ratio between Hubble parameters in JF to EF using the same amplitude of the magnetic field taking a scale-invariant case. μ goes to 0–8 and ψ runs over 0–0.12.
Universe 10 00350 g014
Figure 15. The B-mode spectrum from the PMF vector mode, B 0 = 10   nG in JF, and different values of the magnetic field in EF B * 0 = 5 , 7.5 , 12.5 , 15 nG. The results pictured in this figure were arrived at using MagCAMB [55,56].
Universe 10 00350 g015
Disclaimer/Publisher’s Note: The statements, opinions and data contained in all publications are solely those of the individual author(s) and contributor(s) and not of MDPI and/or the editor(s). MDPI and/or the editor(s) disclaim responsibility for any injury to people or property resulting from any ideas, methods, instructions or products referred to in the content.