Abstract
The Huairou Solar Observing Station (HSOS) has conducted solar vector magnetic field observations for 40 years and developed multiple vector magnetographs (including one space magnetic field observation instrument). Using these accumulated magnetic field observation data, HSOS has achieved significant progress in solar physics research, including important advancements in the helicity sign rule of solar active regions, the helicity characteristics of strong and weak magnetic fields in active regions, the chromospheric magnetic field characteristics of the Sun, the evolution of magnetic fields in active regions, and the extraction of magnetic field characteristics for flare precursors. However, due to historical reasons, the calibration of vector magnetic field data in HSOS are not standardized. Therefore, this paper summarizes past historical experiences and introduces the standardized calibration procedure for vector magnetic field processing in detail. These calibration procedures are the basic steps of the calibration process for the space vector magnetograph (Full-Disk Vector MagnetoGraph, abbreviated as FMG) observation data, and are also applicable to the calibration of other instrument observation data at HSOS. They mainly include basic processing of polarization data and in-depth processing of vector magnetic fields. We believe that such calibration processing of the historical data collected by HSOS over the past 40 years will help us to accurately measure and analyze the solar magnetic field, further revealing the laws of solar activity and its impact on the Earth’s environment.
1. Introduction
The solar magnetic field plays an important role in shaping the dynamic solar atmosphere and governing various astrophysical phenomena, including solar flares, coronal mass ejections, and the solar wind. Over the past four decades, the HSOS, located in Beijing, China, has been at the forefront of solar magnetic field measurements, providing valuable insights into the complex structure and dynamics of the Sun’s magnetic environment. Since its establishment in 1984, the HSOS has relentlessly pursued technological advancements and instrumentation innovations, enabling continuity in monitoring the solar magnetic field. Table 1 comprehensively outlines all the polarization measurment instruments, including five vector magnetographs and one spectro-polarimeter, that have been developed and maintained by the HSOS. The three instruments (SMFT [1], STCT and AIMS) are designed to obtain solar active region magnetograms, while SMAT [1], FMG [2], and SFMM are designed to capture solar full-disk magnetograms. It is worth noting that SFMM observes polarization at multiple wavelengths of the working spectral lines, while others observe polarization only at one (wing) wavelength of the working spectral lines. AIMS measures the Stokes parameter profiles (I(), Q(), U(), and V()) for each spatial point in active regions on the Sun.

Table 1.
Magnetographs for solar polarization measurement maintained by HSOS.
The polarization data calibration mentioned in this article focus specifically on three vector magnetographs: SMFT, SMAT, and FMG. These instruments are employed to precisely measure the solar photospheric polarization signals, specifically the Stokes parameters Q/I, U/I, and V/I, at a particular wavelength position. SMFT has been used to observe the vector magnetic fields of solar active regions for nearly 40 years, spanning solar cycles 22–25. SMAT has been in operation since 2005, conducting ground-based observations of the full-disk vector magnetic fields of the Sun. The FMG instrument is one payload on the Advanced Space-based Solar Observatory (ASO-S) [7] that was launched in October 2022. Central to these vector magnetographs is the working line of FeI 5324.185 Å line [8], which exhibits distinct triplet behavior in a magnetic field. This line is characterized by a landé factor and an excitation potential of 3.197 eV for its lower energy level. Its equivalent width measures 0.334 Å, with a residual intensity at the line core of 0.17. Upon analyzing the formation depths of the FeI 5324.185 Å line in the quiet Sun (VAL-C) [9] model atmosphere, Zhang [10,11] noticed significant variations in the formation depths of the Stokes parameters I, Q, U, and V for wavelengths spanning 0.005–0.2 Å from the line center. Specifically, in the far wing ( Å), these parameters primarily originate from the relatively deep solar photosphere, located at , corresponding to depths ranging from approximately 150 to 0 km. Conversely, near the line center ( Å), the Stokes parameters form in the relatively higher layers of the photosphere, situated at , which translates to depths between 450 and 150 km. Here, represents the optical depth of the continuous spectrum at 5000 Å.
To achieve rapid construction of a vector magnetogram, we routinely derive the solar magnetic field under the weak-field approximation [12,13]. The linear relationships between the magnetic field and the Stokes parameters I, Q, U, V are assumed as follows
where and are calibration coefficients for longitudinal (line of sight) and transverse field components, respectively. There are three methods used to determine the calibration coefficients, which are theoretical calculation [8], empirical observation [14], and comparison of observed polarization profiles with theoretically synthesized profiles [15,16]. Recently, attempts have also been made to utilize machine learning techniques for rapid magnetic field inversion of polarization signals [17,18,19].
It is important to note that while the weak-field approximation simplifies computations and analyses, it may also introduce errors. However, Ai et al. [8] noted in their study on magnetic field calibration that FeI 5324.19 Å is a strong and wide spectral line. Consequently, the Zeeman splitting saturation effect and Doppler shift have minor effects. When observing the longitudinal field at a position 0.075 Å away from the line center, the error caused by the saturation effect is only when the field strength reaches 3000 G. This point is also discussed in the article by Wang et al. [14], indicating that FeI 5324.19 Å can be used to observe longitudinal field strengths above 2800 G. Su et al. [15] found that for the Allen umbra atmospheric model [20], when the transverse field strength reaches 1500 G, the error caused by the deviation of the transverse field from linearity is 126 G (∼8.4%), and when it reaches 2000 G, the error is 306 G (∼15.3%). For the VAL-C atmospheric model [9], when the transverse field strength reaches 1500 G, the error caused by the deviation from linearity is 19.5 G (∼1.3%), and when it reaches 2000 G, the error is 54 G (∼2.7%). The errors introduced by the weak-field approximation calibration are probably tolerable.
FeI 5324.185 Å is a temperature-insensitive spectral line, and this characteristic also favors the weak-field approximation calibration [8]. The temperature sensitivity effect depends on the excitation potential of the lower energy level. For example, the excitation potential of FeI 5250.02 Å line is 0.12 eV, so it is highly sensitive to temperature; the excitation potentials of FeI 6302.5 Å and FeI 5324.185 Å are 3.7 eV and 3.179 eV, respectively, so they are not very sensitive to temperature. Therefore, it was found that the line-of-sight magnetic field calibration coefficients, determined at the line wing −0.15 Å in photosphere, penumbra and Allen umbra [15], are 10,309, 10,482, and 10,000, respectively, and they demonstrate a considerable level of similarity. On the other hand, for the spectral line of 5324.185 Å, due to its large width, it exhibits relatively low sensitivity to weak magnetic fields. This implies that under weak magnetic field conditions, the shape and position of this spectral line may not undergo notable changes, rendering it challenging to accurately measure weak magnetic fields through observations of this spectral line alone. In contrast, narrow spectral lines such as 6302.5 Å are more sensitive to changes in magnetic fields, and hence are potentially more useful in magnetic field measurements. To overcome the limitation of FeI 5324.185 Å’s insensitivity to weak magnetic fields, in practice, we employ a method of superimposing multiple frames of polarization images to enhance its sensitivity towards detecting weak magnetic fields.
In this article, we delve into the fundamental calibration procedures for observational data sourced from vector magnetographs operated at the HSOS, building upon a robust foundation of previous works. Our study commences with the background correction of linear polarization in Section 2.1.1. We then proceed to Section 2.1.2, where we tackle the intricate cross-talk correction between polarization quantities V/I, Q/I, and U/I. Section 2.1.3 focuses on rectifying the effects stemming from different atmospheric layers, specifically the contributions of and . Section 2.2.1 confronts the challenge of eliminating magnetic saturation effects, ensuring the purity of our data. In Section 2.2.2, we correct for the magneto-optic effect, a vital step in refining our measurements. Subsequently, Section 2.2.3 addresses the uncertainty in transverse field correction, a critical aspect of data integrity. Lastly, Section 2.2.4 outlines the projection correction of magnetic maps. It is noteworthy that Section 2.1, Section 2.2.1 and Section 2.2.2 are tailored specifically to the three instruments under discussion, while Section 2.2.3 and Section 2.2.4 serve as a common ground, transcending the boundaries of individual instruments.
2. General Procedures of Calibration of Polarization Data
2.1. Polarization Crosstalks
Crosstalk refers to the unwanted interference or contamination of the signal being measured by undesired signals. This issue can be broadly categorized into three types based on its source: instrumental crosstalk, seeing-induced crosstalks, and solar crosstalk. Instrumental crosstalk originates from the instrument itself and is primarily caused by factors such as changes in ambient temperature within the KD*P thermal controller, variations in the high-voltage power supplies controlling the KD*P modulator, and retardation errors in quarter-wave plates used to measure linear polarization. In order to improve the measurement accuracy of the magnetic field and reduce the impact of polarization crosstalks, our instruments feature a straight light path leading directly to the polarization analyzer, without the use of oblique mirrors. Seeing-induced crosstalks (from I to Q, U and V) are induced by image motion caused by seeing conditions. Solar crosstalk has a solar origin and can be induced by magneto-optic effects. These include effects that mimic a circular retarder (the Faraday effect) and effects that mimic a linear retarder (the Voigt effect). These effects are based on anomalous dispersion, which describes how the index of refraction changes as a function of wavelength near a resonant frequency. The polarization crosstalk discussed in this paper focuses specifically on instrumental crosstalk. Our discussions are limited to crosstalk between intensity and linear/circular polarization (Stokes to, , and ) as well as crosstalk between circular and linear polarization (Stokes to and to), both introduced by the instrumentation [21].
2.1.1. Intensity of Linear and Circular Polarization Crosstalks
For the active region polarization data (Q, U & V) observed by SMFT, we assume that the crosstalk distribution of I to Q, U, V across the field of view is uniform because the field of view is small, treating the crosstalk from I to Q, U, V as a homogeneous background. The removal of such crosstalk is straightforward: it involves identifying a relatively quiet region in the local image, calculating the average values of Q, U, V in that field of view, and then subtracting these averages from the Q, U, V images. For the observed full-disk polarization data (Q, U & V) by SMAT and FMG, the crosstalk distribution of I to Q, U, V across the full-disk field of view is non-uniform [10,22]. To remove such uneven crosstalk distribution, two methods are available. One approach involves accumulating the Q, U, and V images captured over a specified time period, such as one week or one month [23,24]. By aggregating these images separately, one can then determine the crosstalk distribution of I to Q, U, and V by calculating the median or mean value of the respective accumulated data. Alternatively, observing the Q, U, and V polarization images specifically in the far line wing of the working spectral line offers a direct representation of the crosstalk distribution of I to Q, U, and V. In the following paragraphs, we intend to utilize the first method to derive the crosstalk distribution of I to Q, U, and V.
From top to bottom, the left panels of Figure 1 exhibit the crosstalk distribution of I to Q, U, and V, reflecting the average values of multiple Stokes V, Q, and U images captured at the filter positions Å with the SMAT. A total of 384 images were utilized for the estimation of Stokes Q crosstalk amplitude, 376 images for the estimation of Stokes U crosstalk amplitude, and 408 images for the estimation of Stokes V crosstalk amplitude. These images were acquired over the course of a month, specifically in September 2017. The crosstalk amplitude can be estimated from the average values of three images, which are , and , respectively. The middle panels depict the V, Q, and U images on 12 September 2007, before crosstalk correction, while the right panels showcase these images after the correction has been applied. One distinct characteristic of the crosstalk distribution of light intensity to Stokes V is that the first and third quadrants are relatively brighter, while the second and fourth quadrants are darker. This could be due to the imperfect implementation of wide field element in the birefringent filter [25]. A notable characteristic of the crosstalk distribution of light intensity to Stokes V is that the first and third quadrants are relatively brighter, while the second and fourth quadrants are darker. This phenomenon is also evident in panel (a2), but after correction, the image becomes more uniform overall (see panel (a3)).
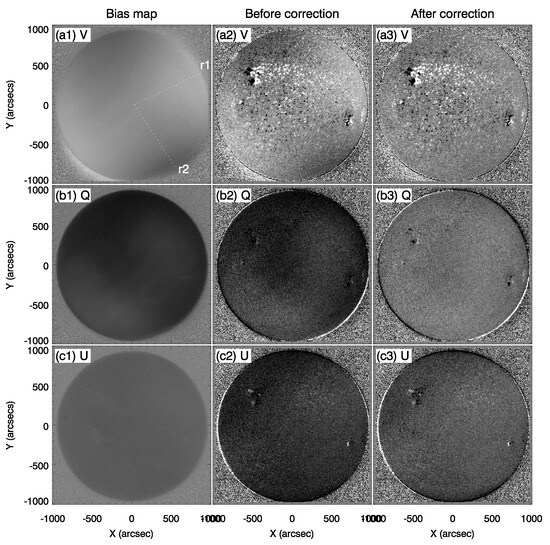
Figure 1.
Correction for intensity to circular and linear polarization crosstalks. (a1–c1) Full-disk maps showing crosstalks intensity (I) to Stokes V, Q, and U. (a2–c2) The original Stokes V, Q, and U images. (a3–c3) The corrected Stokes V, Q, and U images.
We examine the changes in the background intensity of Stokes Q, U, and V before and after correction, with data sampled along the radial directions r1 (with an azimuth angle of ) and r2 (with an azimuth angle of ) in panel (a1). Figure 2 shows the variations in the V, Q, and U parameters along the radial directions r1 and r2. The black curves represent the data before correction, while the red curves represent the data after correction. Panel (a) indicates that the corrected V data are slightly smaller, while panel (d) shows a slight increase in the corrected V data (>600 arcseconds). As seen from the remaining four panels (b), (e), (c), and (f), the values of Stokes Q and U tend to approach zero after correction. Table 2 lists the changes in the average values of the Stokes parameters along the radial directions r1 and r2 before and after correction.
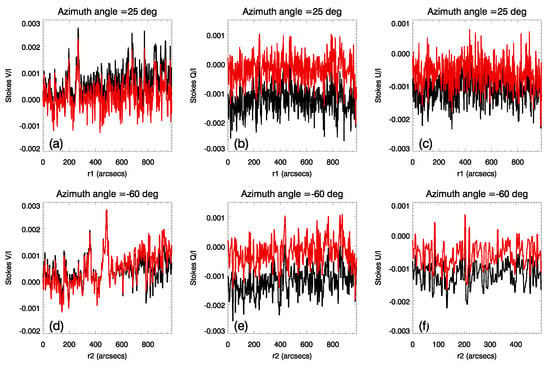
Figure 2.
The variation of the raw and corrected Stokes V, Q, and U parameters along radial directions, at azimuth angles of 25° (a–c) and −60° (d–f). The black curves represent the data before correction, while the red curves represent the data after correction.

Table 2.
Average values of the Stokes parameters along the radial directions r1 and r2 (see Figure 2) before and after correction.
2.1.2. Circular to Linear Polarization Crosstalk
Since the solar magnetic field is normally perpendicular to the surface of the Sun, the strongest polarization signal for active regions near the center of the solar disk is circular polarization, which is one order of magnitude stronger than the linear polarization. The process of eliminating crosstalk from V to Q(U) for active region (partial region) observations is by empirical means. Initially, we pinpoint the V signal embedded in the data and then subtract it accordingly. Given the fundamental principle that Stokes Q and U profiles exhibit symmetry, whereas the V profile exhibits antisymmetry, the crosstalk ratio from V to Q(U), denoted as
and
where the superscript refers to the observed signal and the subscripts b and r refer to the blue wing and red wing of the spectral line. They are ascertained by comparing the disparity between a set of Q(U) images captured at symmetrical line wings offset from the line center and a corresponding set of V maps [26], designated as Method I. Applying this methodology, Su and Zhang [21] were pioneers in generating comprehensive solar full-disk maps of and , overlooking the potential impact of radial Doppler velocities. However, on a broader scale, the full-disk images of Q, U, and V we captured at the symmetrical line wings of the spectral line may only accurately reflect the signals observed at the central region of the solar disk due to solar rotation and the satellite’s line-of-sight velocity with respect to the Sun during space observations. In other regions, this may not be the case. To effectively apply this method, we must observe the polarized profiles of Q, U, and V, which enable us to pinpoint the center of the spectral line and subsequently locate the signals precisely at the symmetrical positions of the spectral line wings. The polarized spectral profiles of the working line were captured using a comprehensive set of 31-step scan filtergrams taken by the SMAT, spanning from the blue wing at Å to the red wing at Å, with increments of Å, offset from the line center.
Therefore, these scan data are utilized to precisely identify the line centers in each pixel. Subsequently, the signals of Stokes Q, U, and V are extracted at symmetric line wing positions, offset by a specified distance from the determined line centers, such as Å. Finally, the crosstalk ratios and for the full-disk maps can be accurately measured, as illustrated in panels (a) and (b) of Figure 3, respectively. There exist evidently large cross-talk values (e.g., >0.5) for the SMAT data, which may result from the regions with high-level noise or without significant polarization signals [27]. Figure 4 displays the raw (panels (a) and (d)) and corrected data (panels (c) and (e)) of the Stokes Q and U full-disk maps observed on 7 September 2017 and the maps of and maps measured on the same day. This method is highly effective for correcting a significant fraction (exceeding ) of circular polarization crosstalk in linear polarization signals. The correction errors [27], and , are influenced by both the Doppler velocity, , and the magnetic field strength, B. Specifically, when reaches 2 km or B is 3000 G, the maximum errors in and can rise to approximately or more. However, a notable limitation exists: in cases where only minimal polarization crosstalk ( less than ) is present, significant correction errors (around ) may occur in regions where B exceeds 2000 G or surpasses 1 km .
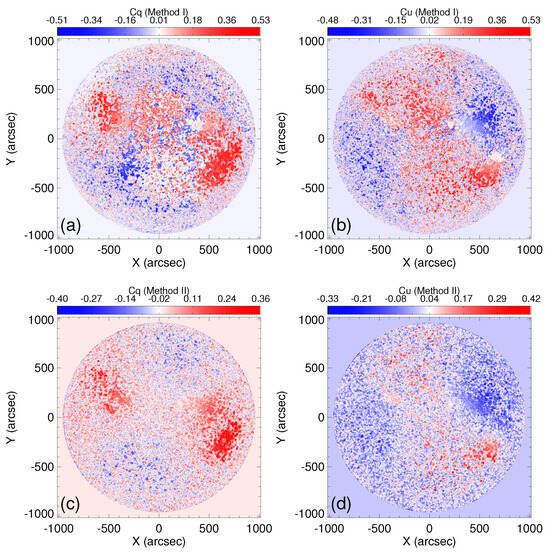
Figure 3.
Full-disk intensity maps showing the crosstalks from Stokes V to Q and U, obtained using Method I (a,b) and Method II (c,d).
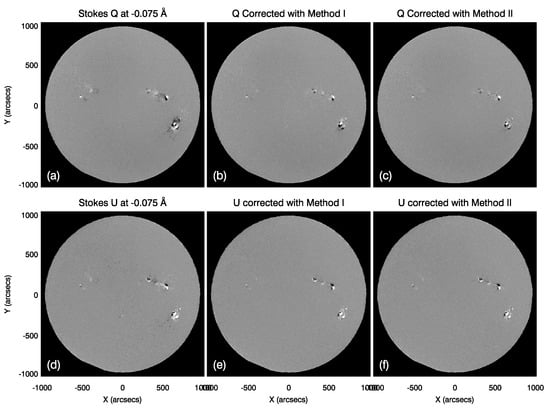
Figure 4.
Correction of full-disk Stokes V to Q and U images. (a,d) The raw Stokes Q and U data. (b,e) The corrected Stokes Q and U images using Method I. (c,f) The corrected Stokes Q and U images obtained through Method II.
We would like to to introduce an alternative correction method, designated as Method II [27], that capitalizes on the linear independence exhibited among the Stokes Q, U, and V signals. This independence can be observed either in their spatial intensity distribution at a specific wavelength position of the working line or in their polarized spectral profiles. Once a correlation emerges among the Stokes Q, U, and V signals, it can be considered as a result of crosstalk from the V signal to the Q and U signals. The correction method involves finding the values of and from a series of assigned values that minimize the correlation between V and Q, U. In this way, we can consider that we have found the correct and as shown in panels (c) and (d) of Figure 3. The maps of and obtained from both methods are similar in distribution, but the data obtained from Method II are slightly smaller. Panels (c) and (f) in Figure 4 show the corrected data of the Stokes Q and U full-disk maps. The error analysis [27] indicates that the impact of the line-of-sight Doppler velocity on the crosstalk coefficients obtained from Method II is not significant, resulting in an error of no more than when km . When the crosstalk exceeds , the calculated coefficients are very close to the actual crosstalk coefficients. However, when the crosstalk is less than , the deviation between the calculated coefficients and the actual coefficients exceeds . The smaller the crosstalk is, the larger the calculated coefficient error becomes.
2.1.3. Correction for Consistency of Calibration Coefficients
Since the SMFT was put into use, we have been continuously improving the calibration coefficients for solar vector magnetic fields. Table 3 lists all the calibration coefficients obtained for the longitudinal and transverse magnetic fields through relevant work. However, as the circular polarization signal V is observed at a position that deviates from the line center by Å, while the linear polarization signals Q and U are observed near the line center, this implies that the two magnetic signal components are observed in different layers of the solar atmosphere, with the transverse field observed in a layer that is 50 km higher than the longitudinal field. This can lead to inconsistencies in the calibration of vector magnetic fields. J. X. Wang et al. [28] utilized an empirical correction method to adjust the theoretical calibration coefficients ( 10,000 and ) proposed by Ai et al. [8], in order to enhance their accuracy and applicability. They compared the transverse field derived from potential field extrapolation using the longitudinal field as a boundary condition with the observed transverse field, obtaining a correction factor of for the transverse field. All transverse field data were then divided by this value.

Table 3.
Calibration coefficients for longitudinal and transverse field components observed at −0.075 Å away from the line center and directly on the line center, respectively.
We applied the same correction method as J. X. Wang et al. [28] to modify all the calibration coefficients in Table 3, utilizing the polarization data observed by SMFT: L50317224023335.fit, Q50317224023451.fit, and U50317224023530.fit (download the data at the following website https://sun10.bao.ac.cn/SHDA/search/index.php/index/index/search.html (accessed on 24 October 2003)). The resulting correction coefficients are listed in the last column of Table 3. We obtained a correction factor of 1.69 for the transverse field calibration coefficient of 9730, which is larger than the correction factor of 1.18 employed by J. X. Wang et al. Further research is needed to investigate the reasons behind this discrepancy. Another method commonly used to correct inconsistencies in calibration coefficients is to conduct a detailed comparison of the observations from Huairou with other ground-based and space-based data to determine the inconsistency of the calibration coefficients. We will not elaborate on this here.
2.2. Data Deep Reduction
2.2.1. Removal of Magnetic Saturation Effect
Filter-type magnetographs observe circular polarization at a single wavelength and calibrate the line-of-sight (LOS) magnetic field from images of Stokes V under the assumption of a weak magnetic field, where the relationship between LOS field strength and the Stokes parameter V/I is approximately linear. Figure 5(a1,a2) show the Stokes I map and LOS magnetogram of NOAA 11877 observed by SMFT on 24 October 2013. It was composed of a single sunspot. We can see that the magnetic field decreased in the sunspot umbra (inside the red contour) which may be caused by the weak-field approximation calibration adopted by SMFT. Figure 5(a3) displays the relationships. represents the maximum value of Stokes I for the whole intensity image of an active region, which varies with the active region. The relationship is not linear. A similar phenomenon was also found for NOAA 12209, observed by SMFT on 21 November 2014, which was composed of multiple sunspots (Figure 5(b1–b3)). To solve this phenomenon, Xu et al. [30] developed a method based on the correlation between the Stokes and observed by SMFT. They used the second-order polynomial to fit the scatter plot of Stokes . We applied the same method for NOAA 11877 and 12209. From Figure 5(a3,b3), we can see that the second-order polynomial (red line) has a good fit when > 0.02 and ≤ 0.70. The corresponding to the apex (green asterisk, hereafter denoted as ) is 0.380 for NOAA 11877 and is 0.451 for NOAA 12209. For NOAA 11877, and have a negative correlation for the area , and a positive correlation for the area which is inside the red contour in Figure 5(a2). For NOAA 12209, and have a negative correlation for the area , and a positive correlation for the area which is inside the red contour in Figure 5(b2).
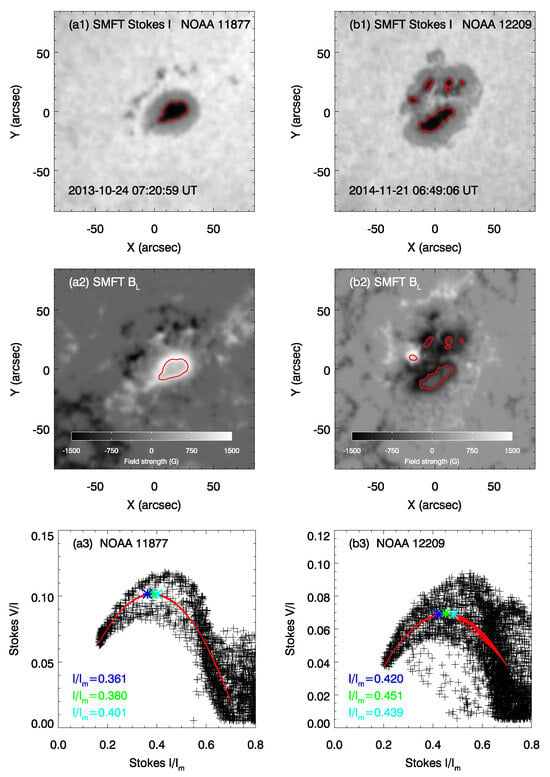
Figure 5.
Panels (a1,b1) are the maps of Stokes I of NOAA 11877 and 12209 observed by SMFT. The corresponding LOS magnetograms are shown in panels (a2,b2). The red contours represent = 0.380 for NOAA 11877 and = 0.451 for NOAA 12209. Panels (a3,b3) display the relationships. The green asterisk presents the apex of the second-order polynomial fit (red line). The cyan and blue asterisks present the uncertainty of the apex. The corresponding values are marked using the same color as asterisks.
We reconstruct Stokes for pixels where < using Equation (4) (Equation (3), as described by Xu et al. [30]).
where (, ) and (, ) are linear fitting coefficients corresponding to area < and ≥ , respectively. and are slopes; and are intercepts. After re-calculation, the relationship between the values of and is given in Figure 6(a1,b2). We find a near-linear negative correlation between and .
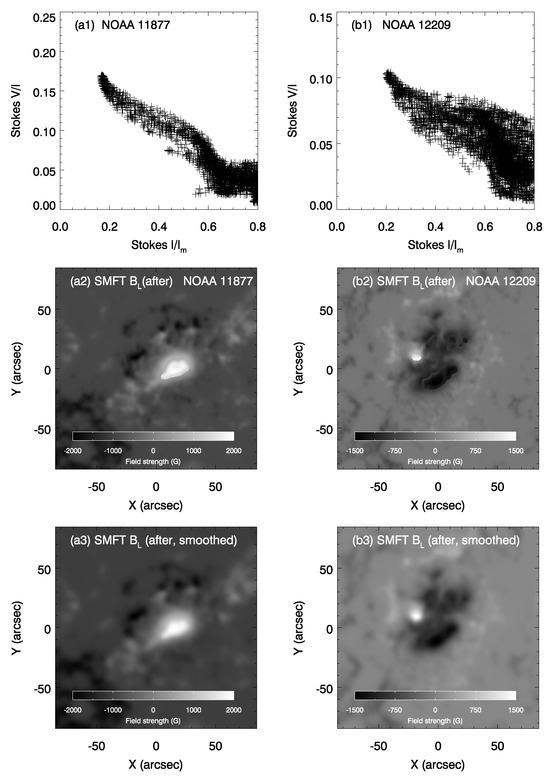
Figure 6.
Panels (a1,b1) display the relationship of NOAA 11877 and 12208 after correcting for saturation. The corresponding LOS magnetograms are shown in panels (a2,b2). Panels (a3,b3) show the corrected LOS magnetograms after the smoothing of the data.
The SMFT LOS magnetic field can be re-calibrated from Equations (5) and (6):
and
where is the calibration coefficient. We adopt 8381 G as proposed by Su & Zhang [15]. The re-calibrated maps are shown in Figure 6(a2,b2). It can be seen that the saturation in sunspot umbra has been corrected. We apply a Gauss-smooth function to smooth the corrected data by 7 pixels. The smoothed maps are displayed in Figure 6(a3,b3). It can be seen that the discontinuity at the umbra–penumbra boundary has been eliminated.
2.2.2. Removal of Faraday Rotation Effect
Essentially, the magneto-optical effect arises because the three absorption sub-lines created by the Zeeman splitting of an absorption line have different refractive indices in the medium. Therefore, as they propagate through the medium, a phase difference develops between the sub-lines, leading to a rotation of the polarization plane of the sub-lines. The transverse field azimuth determined by linearly polarized light also rotates accordingly. The magneto-optical effect has the most significant impact on the field azimuth obtained at the line center, but the effect diminishes as the deviation from the line center increases. The observed spiral distribution pattern of the magnetic field in a unipolar sunspot is purely due to magneto-optical effects [31]. In the 1990s, there was close attention and controversy internationally regarding the impact of the magneto-optical effect on the measurement accuracy of azimuth at the HSOS of the National Astronomical Observatories [32,33]. For example, it affects the ratio of the positive and negative signs of magnetic helicity in the northern and southern hemispheres of the Sun, and it is also related to the phenomenon of flipping the magnetic helicity sign at the end or beginning of the solar cycle [34,35].
Our concern is how to correct the magneto-optical effect for the historical observational data at HSOS. Numerical simulations show that when the magnetic field inclination angle is relatively large (for example, exceeding ), the rotation of the transverse field azimuth is proportional to the longitudinal magnetic field strength [8]. Gao et al. [36] also presented a formula, , that depicts the quadratic function relationship between the azimuthal differences of the line center and the line wing at −0.12 Å and the longitudinal field strength. In this paper, we present another method for automatically correcting the magneto-optical effect. Based on the fact that the rotation of the magnetic field azimuth will twist the magnetic field and increase the current, we propose a method for eliminating this enhanced current (pseudo-current). We automatically adjust the magnitude of the transverse field azimuth within a certain range, for instance, varying from to . At last, we assume that the that minimizes the overall current is the azimuth rotation value caused by the magneto-optical effect. In practice, it is found that using the current helicity parameter for correction is more stable. With this method, not only can the FMG transverse field observation data be corrected, but the magnetic field observation data of SMFT over the past 40 years can also be corrected.
Figure 7 shows the SMAT cutout vector magnetograms before (panels (a) and (b)) and after (panels (c) and (d)) the correction for the magneto-optical effect, with the corresponding HMI vector magnetograms placed in panels (e) and (f). Panel (a) shows a clockwise spiral distribution in the negative polarity sunspot of active region AR 12626, while panel (b) depicts a counterclockwise spiral distribution in the positive polarity sunspot of active region AR 12644, with a slight clockwise distribution also present in the negative polarity sunspot. After processing and analysis, the transverse field of AR 12626 was corrected by subtracting , while the transverse field of AR 12644 was corrected by subtracting . Both corrections resulted in the overall current reaching a minimum. The corrected vector magnetogram of the sunspots (panels (c) and (d)) exhibit a closer resemblance in morphology to the HMI vector magnetogram of the sunspots (panels (e) and (f)). To further examine the effectiveness of our correction for the magneto-optical effect, we applied an overall addition of to the azimuth angles of the HMI-observed AR12626 vector magnetic map and to the azimuth angles of the AR12644 vector magnetic map. Then, we compared them with the corresponding uncorrected SMAT vector magnetic maps, and the results are presented in Figure 8. It can be observed that the spiral distributions of the transverse fields in the sunspots are very similar, indicating that the rotation of the azimuth angles of the SMAT magnetic maps determined by our magneto-optical effect correction program is effective. We will discuss the degree of correction and the associated errors of this magneto-optical effect correction method in detail in another article.
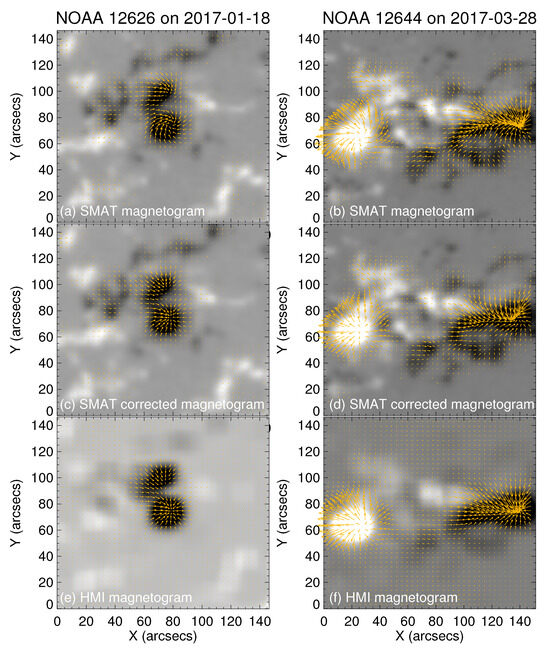
Figure 7.
Removal of Faraday rotation in the transverse field. (a,b) Depiction of the raw vector magnetograms with Faraday rotation, captured by SMAT on 18 January 2017, and 28 March 2017, respectively. (c,d) The corrected vector magnetograms after accounting for Faraday rotation. (e,f) The vector magnetograms captured by HMI on 18 January 2017, and 28 March 2017, respectively.
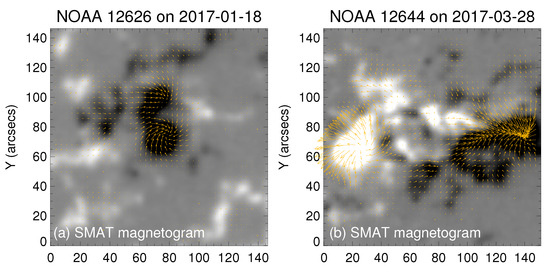
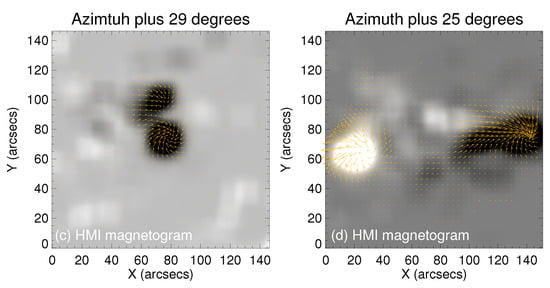
Figure 8.
(a,b) The SMAT raw vector magnetograms, exhibiting Faraday rotation, recorded on 18 January 2017, and 28 March 2017, respectively. (c,d) The vector magnetograms captured by HMI (with azimuth angles revised) on 18 January 2017, and 28 March 2017, respectively.
2.2.3. Removal of Ambiguity in the Measurement of the Transverse Magnetic Field
In the measurement of the transverse component of the solar magnetic field, the direction of the transverse field is determined by measuring the orientation of the linearly polarized photoelectric vector. However, the linearly polarized photoelectric vector has two directions that are opposite to each other, forming a straight angle. The orientation of the polarization plane of the polarized light can only indicate the orientation of the transverse magnetic field, but not its exact direction (i.e., if the transverse field forms an angle with a certain coordinate axis, may also be the direction of the transverse field). Before calculating any physical quantities of the vector magnetic field, this ambiguity must be resolved. Two methods are commonly used to remove the ambiguity in the direction of the transverse field.
One method, known as the potential field acute angle method, involves comparing the observed transverse magnetic field with an extrapolated transverse field. If the observed field and the extrapolated field form an acute angle, meaning the angle between them falls within the range of (), then the direction of the transverse field is determined by the direction of the extrapolated field. This condition can be expressed as , where is the observed transverse component, and is the extrapolated transverse component. Another notable approach is the minimum energy algorithm, which aims to minimize both the electric density (J) and the magnetic field divergence concurrently. Originating from the work of Aly (1988) [37], magnetic free energy is proportional to the maximum value of for a force-free field. Recognizing this, Metcalf [38] coined the term “minimum energy algorithm” to describe this method. Leveraging the equation and the observed electric current density (J), they formulated the energy as . The crux of this approach lies in calculating the minimum energy (E) to resolve the vexing ambiguity. In fact, this methodology has been successfully applied to address the transverse ambiguity in SDO/HMI data, as evidenced by studies in [39,40].
We used the above two methods to remove the ambiguity in the transverse field observed at the HSOS. For example, Figure 9 shows the vector magnetogram of the positive-polarity sunspot in active region 12644 observed by SMAT. Panel (a) uses the potential-field acute-angle method, while panel (b) uses the minimum energy algorithm. At the Cartesian coordinate position of and , the transverse magnetic field direction resolved by the potential field acute angle method is chaotic, while the transverse magnetic field direction resolved by the minimum energy method looks reasonable, showing an overall radial pattern.
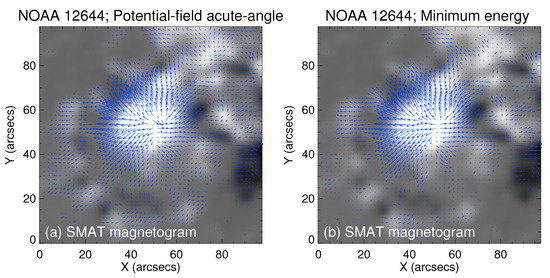
Figure 9.
SMAT cutout vector magnetograms, displaying a segment of active region 12644, captured on 28 March 2017. (a) Implementation of the potential method for resolving the 180-degree ambiguity in the transverse magnetic field. (b) Employment of the minimum energy method to address the 180-degree ambiguity in the transverse magnetic field.
2.2.4. Removal of Magnetic Field Projection Effect
The projection correction process for solar magnetograms comprises two main steps: remapping and vector transformation. First, remapping involves converting the 2D observational coordinates into 3D spherical coordinates. This step is crucial to accurately represent the solar surface in its natural spherical geometry. To minimize distortion, especially towards the poles, our full-disk magnetographs initially employ a cylindrical equal-area (CEA) projection, as introduced by Calabretta and Greisen (2002) [41] and Sun (2013) [42]. The CEA projection allows for a more uniform representation of the solar surface by mapping it onto a cylinder. After the CEA projection, the heliographic coordinates () are then converted to CCD coordinates (), which are used by the imaging sensors. Figure 10 and Figure 11 show two examples of the remapping process applied to the filtergrams captured by SMAT taken on 28 March 2017. It is noticeable that the remapping is undistorted along the equator but that distortion increases progressively towards the poles.
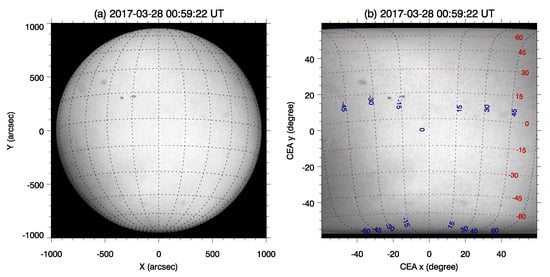
Figure 10.
Remapping of a full-disk solar filtergram captured by SMAT at the blue wing of −0.075 Å in the spectral line of FeI 5324.185 Å on 28 March 2017, utilizing the CEA projection technique. (a) Initial solar filtergram. (b) Remapped version of the filtergram.
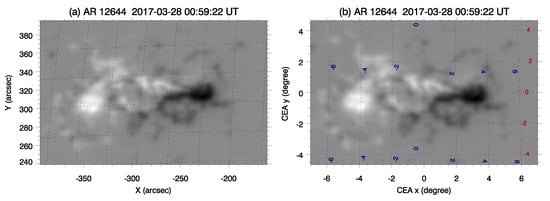
Figure 11.
Analogous to Figure 10, this depicts remapping of a magnetogram of active region 12644, extracted from the full-disk longitudinal magnetogram captured by SMAT at the blue spectral wing of −0.075 Å in the FeI 5324.185 Å spectral line on 28 March 2017.
Second, vector transformation represents the magnetic field vectors in spherical coordinates. This step involves disentangling the three components of the vector magnetic fields () with respect to the ambiguity using the minimum energy algorithm. Once disentangled, these components are transformed into spherical coordinates () following the equation provided by Gary and Hagyard in 1990 [43]. Before the vector transformation is performed, a specific region (AR 12644) is extracted from the entire field of view. This step ensures that any potential artifacts or irregularities in that particular region do not affect the overall analysis. The results of the vector transformation are presented in Figure 12, which displays the magnetic field vectors in spherical coordinates. This representation provides a more physical representation of the solar magnetic field.
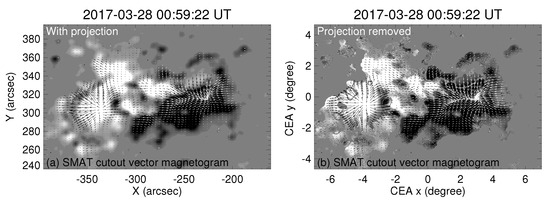
Figure 12.
Vector magnetogram of active region 12664, extracted from the full-disk vector magnetograms captured by SMAT at the blue spectral wing of −0.075 Å in the FeI 5324.185 Å spectral line on 28 March 2017. (a) The original (observed) vector magnetogram, and (b) the magnetogram deprojected to the local Cartesian (or spherical) coordinate system.
3. Limitations of Observing the Polarization Signal at a Single Wavelength Position
As can be seen from the above sections, most of the vector magnetographs at HSOS observe polarization data at the single wavelength position of the working spectral line FeI 5324.185Å and then calibrate the polarization data into the magnetic field through the weak field approximation. We have two issues to address, both concerning the observation of polarization data at a single wavelength position. The first one is the problem of magnetic saturation in the umbra of a sunspot. The basis for calibration using the weak field approximation is that the spectral line is not very sensitive to temperature changes [8]. It can be seen from numerical simulation that the calibration coefficient of the longitudinal magnetic field varies little in the solar quiet region, umbra and penumbra. When the magnetic field intensity reaches 3000 gauss, the error caused by magnetic saturation is only [8]. When the transverse magnetic field reaches 2000 gauss, the error caused by magnetic saturation to the umbra atmospheric model is only about , and the error caused by magnetic saturation to the quiet region atmospheric model is only about [15]. But in fact, we found that there is a magnetic saturation effect in the longitudinal magnetograms (as shown in Figure 5) observed by these magnetographs in the umbral center region of the sunspot, which differs from the conclusion that the error caused by magnetic saturation is only [8] when the magnetic field intensity reaches 3000 gauss.
We aim to identify an active region 12770 that has been observed by all three instruments (SMAT, SMFT, and FMG), as shown in Figure 13. We then intend to conduct a comparative analysis of the Stokes V signals in the umbra center region, focusing on potential variations that may indicate the presence of magnetic saturation mechanisms. In the umbra center, panel (d) reveals that the V signal observed by SMAT hardly shows any sign of weakening, while the V signal observed by FMG exhibits a decrease of approximately (with a concave upward curve). However, the V signal observed by SMFT experiences the most significant weakening, decreasing by approximately . This suggests that the weakening of the magnetic field signal at the umbra center is not only related to the working spectral line itself, but also to the instrument or the environment where the instrument is located. According to Su et al. [44], the scattered light caused by the instrument itself can affect the intensity of the umbra center signal of the sunspot, and generally, the stronger the scattered light is, the weaker the umbra magnetic field signal will be. Therefore, we believe that the weakened penumbra signal observed by the Huairou Solar Magnetic Field Telescopes may be the result of the combined effect of magnetic saturation and instrument stray light. The weakening of the penumbra signal caused by a single magnetic saturation may not be severe.
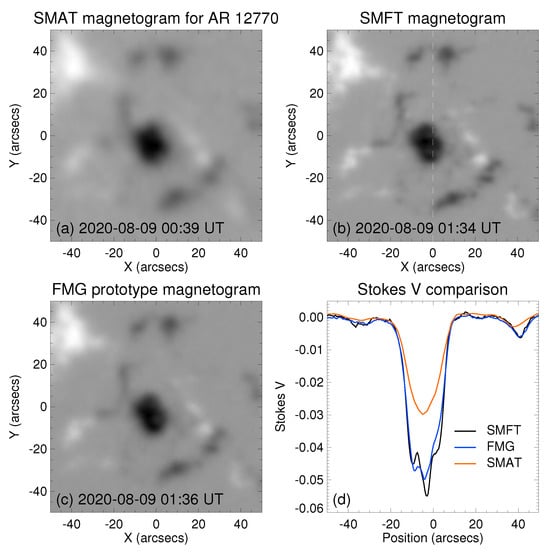
Figure 13.
Comparison of the observed Stokes V signals in active region 12770 on 9 August 2020. (a) Stokes V captured by SMAT at the blue wing of −0.075 Å in the FeI 5324.185 Å spectral line. (b) Similarly, this panel shows Stokes V recorded by SMFT at the same blue wing position. A white dotted line is utilized to distinctly designate the locations of data sampling within panel (d). (c) The Stokes V signal captured by the engineering prototype of FMG at the blue wing of −0.1 Å. (d) The variation of Stokes V signals along the white dotted line in panel (b).
The second issue is the shifts of spectral line caused by an incomplete wide field of view of instruments and radial Doppler velocities. The optical system of the full-disk vector magnetographs at HSOS is telecentric, and ideally, all the points in the field of view should be treated equally. However, in practice, observations from such magnetographs [4,25] revealed that this design cannot completely reduce variation in the bandpass of the filter at different positions in the image plane. This incomplete wide field of view of the instrument can introduce a shift equivalent to approximately 1 km of Doppler velocity. Moreover, for ground-based observations, the solar differential rotation can cause a large-scale spectral line shift (up to 2 km ). For space-based observations, the maximum orbital line-of-sight velocity of the satellite relative to the Sun is 4 km , which can cause even more severe spectral line shift. The maximum spectral line shift caused by these factors can reach 0.12 Å (here, the spectral line shift caused by the motion of the observed object itself has not been discussed). For the space instrument FMG, the daily observation position is set at the spectral line blueshift of −0.08 Å. In this case, the actual observation position may exceed the observable range of the spectral line (with a full width of 0.334 Å), posing a significant challenge to the calibration of the space instrument’s observations at a single point on the working spectral line [45]. Learning the advanced observational concepts and practices of HMI, observing polarization at multiple positions on the spectral line, and then performing magnetic field inversion is a reasonable choice for our future solar magnetic field observations.
4. Summary and Conclusions
This article systematically introduces the data calibration procedures used by the vector magnetograph developed by the HSOS over the past four decades to observe magnetic fields at a single wavelength position of a FeI 5324.185 Å spectral line. These procedures include basic polarization data processing, correction of crosstalk between intensity I and Stokes Q, U, and V, correction of crosstalk between circular polarization V and polarization Q and U, and calibration coefficient adjustments for the longitudinal and transverse magnetic fields to enhance their consistency. After basic polarization data processing, we calibrate the data into vector magnetic fields. Subsequently, we conduct in-depth data processing, which includes magnetic saturation correction for the longitudinal magnetic field, correction for the magneto-optical effect present in the observed transverse magnetic field, correction for the ambiguity in the observed transverse magnetic field, and projection correction for the magnetic field.
We are preparing to apply these correction methods to the polarization data obtained from single-wavelength observations, recalibrate the historical observation data, and then open these corrected data to colleagues both domestically and internationally. Through these detailed calibrations, we can improve the accuracy and reliability of the vector magnetograph’s measurements of solar magnetic field data. However, we are also fully aware that some of these correction methods, such as the correction of intensity crosstalk to polarization, circular polarization crosstalk to linear polarization, projection correction, and ambiguity correction of transverse fields, are relatively mature. Some of these correction methods, like magnetic saturation correction, have limitations and require different correction coefficients for different active regions. Additionally, some correction methods, such as magneto-optical effect correction, are still under further verification. It is important for users to understand the assumptions and limitations of the corrections that have been applied.
Author Contributions
Conceptualization, S.Y. and J.S.; methodology, J.S., H.X. and S.L.; formal analysis, J.S., H.X., S.L., J.L., H.W., X.B., Y.S. (Yongliang Song), J.C., X.Y. and X.W.; writing—original draft preparation, J.S. and Y.S. (Yingzi Sun); writing—review and editing, J.S.; supervision, S.Y., H.X. and S.L.; project administration, Y.D. and J.L.; funding acquisition, J.S., H.X. and S.L. All authors have read and agreed to the published version of the manuscript.
Funding
This research was funded by the Strategic Priority Research Program on Space Science of Chinese Academy of Sciences (Grant No. XDB0560302), the National Key R&D Program of China (Nos. 2022YFF0503001, 2021YFA1600 and 2021YFA1600503), and Natural Science Foundation of China (Grant Nos. 12273059 and 12373057). ASO-S’s mission is supported by the Strategic Priority Research Program on Space Science, the Chinese Academy of Sciences, Grant No. XDA15320000.
Data Availability Statement
Data are contained within the article.
Acknowledgments
The authors thank the reviewers very much for the valuable comments and suggestions that helped improve the manuscript. We acknowledge the use of data from the Huairou Solar Observing Station, Advanced Space-based Solar Observatory (ASO-S), and SDO/HMI. The ASO-S mission is supported by the Strategic Priority Research Program on Space Science, Chinese Academy of Sciences.
Conflicts of Interest
The authors declare no conflicts of interest. The funders had no role in the design of the study; in the collection, analyses, or interpretation of data; in the writing of the manuscript; or in the decision to publish the results.
References
- Ai, G.X.; Hu, Y.F. The propose for the solar magnetic field Telescope and its working theorem. Publ. Beijing Astron. Obs. 1986, 8, 1–10. [Google Scholar]
- Deng, Y.Y.; Zhang, H.Y.; Yang, J.F.; Li, F.; Lin, J.B.; Hou, J.F.; Wu, Z.; Song, Q.; Duan, W.; Bai, X.Y.; et al. Design of the Full-disk MagnetoGraph (FMG) onboard the ASO-S. Res. Astron. Astrophys. 2019, 19, 157–168. [Google Scholar] [CrossRef]
- Ai, G.X.; Hou, Y.F. Multichannel birefringent filter. In NASA Marshall Space Flight Center Meas. of Solar Vector Magnetic Fields; NASA: Washington, DC, USA, 1985; pp. 257–259. [Google Scholar]
- Zhang, H.Q.; Wang, D.G.; Deng, Y.Y.; Hu, K.L.; Su, J.T.; Lin, J.B.; Lin, G.H.; Yang, S.M.; Mao, W.J.; Wang, Y.N.; et al. Solar Magnetism and the Activity Telescope at HSOS. Chin. J. Astron. Astrophys. 2007, 7, 281–288. [Google Scholar] [CrossRef]
- Sun, Y.Z.; Deng, Y.Y.; Wang, D.G.; Tong, L.Y.; Lv, J.; Lin, J.B.; Zhang, Y.; Li, X.Y.; Lu, D.; Yang, X.; et al. Solar Full-disk Multi-layer Magnetograph (SFMM). Space Weather 2024. in preparation. [Google Scholar]
- Deng, Y.Y.; Liu, Z.; Qu, Z.; Liu, Y.; Ji, H. The Chinese Giant Solar Telescope. Coimbra Sol. Phys. Meet. Ground-Based Sol. Obs. Space Instrum. Era 2016, 504, 293–298. [Google Scholar]
- Gan, W.Q.; Zhu, C.; Deng, Y.Y.; Li, H.; Su, Y.; Zhang, H.Y.; Chen, B.; Zhang, Z.; Wu, J.; Deng, L.; et al. Advanced Space-based Solar Observatory (ASO-S): An overview. Res. Astron. Astrophys. 2019, 19, 156–163. [Google Scholar] [CrossRef]
- Ai, G.-X.; Li, W.; Zhang, H.Q. FeI λ 5324.19 Å line forms in the solar magnetic field and the theoretical calibration of the solar magnetic field telescope. Acta Astron. Sin. 1982, 23, 39–48. [Google Scholar]
- Vernazza, J.E.; Avrett, E.H.; Loeser, R. Structure of the solar chromosphere. III. Models of the EUV brightness components of the quiet sun. Astrophys. J. Suppl. Ser. 1981, 45, 635–725. [Google Scholar] [CrossRef]
- Zhang, H.Q. From polarimetry to helicity: Studies of solar magnetic fields at the Huairou Solar Observing Station. Sci. China Physics, Mech. Astron. 2019, 62, 999601. [Google Scholar] [CrossRef]
- Zhang, H.Q. FeI λ 5324.19 Å line formation depth in the solar magnetic field. Acta Astron. Sin. 1986, 6, 295–302. [Google Scholar]
- Stenflo, J.O. Measurements of Magnetic Fields and the Analysis of Stokes Profiles. Sol. Phys. 1985, 100, 189–208. [Google Scholar] [CrossRef]
- Jefferies, J.; Lites, B.W.; Skumanich, A. Transfer of Line Radiation in a Magnetic Field. Astrophys. J. 1989, 343, 920–935. [Google Scholar] [CrossRef]
- Wang, T.J.; Ai, G.X.; Deng, Y.Y. Calibration of Nine-channel Solar Magnetic field Telescope. I. The methods of the observational calibration. Astrophys. Rep. Publ. Beijing Astron. Obs. 1996, 28, 31. [Google Scholar]
- Su, J.T.; Zhang, H.Q. Calibration of Vector Magnetogram with the Nonlinear Least-squares Fitting Technique. Chin. J. Astron. Astrophys. 2004, 4, 365–376. [Google Scholar] [CrossRef]
- Bai, X.Y.; Deng, Y.Y.; Teng, F. Improved magnetogram calibration of Solar Magnetic Field Telescope and its comparison with the Helioseismic and Magnetic Imager. Mon. Not. R. Astron. Soc. 2014, 445, 49–55. [Google Scholar] [CrossRef]
- Guo, J.; Bai, X.; Deng, Y.; Liu, H.; Lin, J.; Su, J.; Yang, X.; Ji, K. A Non-Linear Magnetic Field Calibration Method for Filter-Based Magnetographs by Multilayer Perceptron. Sol. Phys. 2020, 295, 5–23. [Google Scholar] [CrossRef]
- Guo, J.; Bai, X.; Liu, H.; Yang, X.; Deng, Y.; Lin, J.; Su, J.; Yang, X.; Ji, K. A nonlinear solar magnetic field calibration method for the filter-based magnetograph by the residual network. Astron. Astrophys. 2021, 646, 41–52. [Google Scholar] [CrossRef]
- Hu, Z.; Ji, K.; Chen, J.; Deng, Y.; Su, J.; Bai, X.; Liu, S.; Guo, J.; Liu, J.; Wintoft, P. Calibration scheme for space-borne full-disk vector magnetograph under the influence of orbiter velocity. Astron. Astrophys. 2022, 666, 93–106. [Google Scholar] [CrossRef]
- Allen, C.W. Astrophysical Quantities, 3rd ed.; University of London, Athlone Press: London, UK, 1973; p. 368. [Google Scholar]
- Su, J.T.; Zhang, J.Q. The Effects of Polarization Crosstalk and Solar Rotation on Measuring Full-Disk Solar Photospheric Vector Magnetic Fields. Astrophys. J. 2007, 666, 559–575. [Google Scholar] [CrossRef]
- Wang, X.; Su, J.; Zhang, H. The non-uniform pattern in full-disc vector magnetograms and its correction. Mon. Not. R. Astron. Soc. 2008, 387, 1463–1469. [Google Scholar] [CrossRef][Green Version]
- Su, J.T.; Bai, X.Y.; Chen, J.; Guo, J.J.; Liu, S.; Wang, X.F.; Xu, H.Q.; Yang, X.; Song, Y.L.; Deng, Y.Y.; et al. Data reduction and calibration of the FMG onboard ASO-S. Res. Astron. Astrophys. 2019, 19, 161–176. [Google Scholar] [CrossRef]
- Xu, H.; Su, J.; Bai, X.; Chen, J.; Gao, Y.; Liu, S.; Wang, X.; Yang, X.; Guo, J.; Deng, Y. A Method to Correct the Intensity to Polarization Crosstalk in Measuring Full-Disk Solar Photospheric Vector Magnetic Fields. Sol. Phys. 2019, 294, 129–140. [Google Scholar] [CrossRef]
- Xuan, W.J.; Wang, D.G.; Deng, Y.Y.; Su, J.T.; Zhang, Z.Y.; Sun, Y.Z. Error analysis and performance optimization of birefringent filter. Opt. Precis. Eng. 2010, 18, 52–59. [Google Scholar]
- Mickey, D.L. The Haleakala Stokes Polarimeter. Sol. Phys. 1985, 97, 223–238. [Google Scholar] [CrossRef]
- Liu, S.; Su, J.T.; Bai, X.Y.; Deng, Y.Y.; Chen, J.; Song, Y.L.; Wang, X.F.; Xu, H.Q.; Yang, X. A Study on Correcting the Effect of Polarization Crosstalk in Full-Disk Solar Photospheric Magnetic Field Observations. Sol. Phys. 2022, 297, 6–22. [Google Scholar] [CrossRef]
- Wang, J.; Shi, Z.; Wang, H.; Lue, Y. Flares and the magnetic nonpotentiality. Astrophys. J. 1996, 456, 861–878. [Google Scholar] [CrossRef]
- Wang, D.; Zhang, M.; Li, H.; Zhang, H. A comparison of co-temporal magnetograms obtained with the Huairou magnetograph and the Spectro-Polarimeter on board Hinode. Sci. China Ser. Phys. Mech. Astron. 2009, 52, 1707–1712. [Google Scholar] [CrossRef]
- Xu, H.Q.; Liu, S.; Su, J.T.; Deng, Y.Y.; Plotnikov, A.; Bai, X.Y.; Chen, J.; Yang, X.; Guo, J.J.; Wang, X.F.; et al. Automatic detection and correction algorithms for magnetic saturation in the SMFT/HSOS longitudinal magnetograms. Res. Astron. Astrophys. 2021, 21, 67–75. [Google Scholar] [CrossRef]
- West, E.A.; Hagyard, M.J. Interpretation of Vector Magnetograph Data Including Magneto Optic Effects-Part One—Azimuth Angle of the Transverse Field. Sol. Phys. 1983, 88, 51–64. [Google Scholar] [CrossRef]
- Hagyard, M.J.; Pevtsov, A.A. Studies of Solar Helicity Using Vector Magnetograms. Sol. Phys. 1999, 189, 25–43. [Google Scholar] [CrossRef]
- Pevtsov, A.A.; Dun, J.P.; Zhang, H. Helicity Measurements from Two Magnetographs. Sol. Phys. 2006, 234, 203–212. [Google Scholar] [CrossRef]
- Zhang, H.; Sakurai, T.; Pevtsov, A.; Gao, Y.; Xu, H.; Sokoloff, D.D.; Kuzanyan, K. A new dynamo pattern revealed by solar helical magnetic fields. Mon. Not. R. Astron. Soc. Lett. 2010, 402, L30–L33. [Google Scholar] [CrossRef]
- Liu, J.; Liu, Y.; Zhang, Y.; Huang, J.; Zhang, H. Helicity observations of active regions during the exchange period of Solar Cycle 24 and 25. Mon. Not. R. Astron. Soc. Lett. 2022, 509, 5298–5304. [Google Scholar] [CrossRef]
- Gao, Y.; Su, J.; Xu, H.; Zhang, H. Statistical removal of Faraday rotation in vector magnetograms taken by filter-type magnetographs. Mon. Not. R. Astron. Soc. 2008, 386, 1959–1965. [Google Scholar] [CrossRef]
- Aly, J.J. Some properties of the solutions of a non-linear boundary value problem for a force-free field in an infinite region of space. I —Energy estimates. Astron. Astrophys. 1988, 203, 183–188. [Google Scholar]
- Metcalf, T.R. Resolving the 180-degree ambiguity in vector magnetic field measurements: The ‘minimum’ energy solution. Astron. Astrophys. 1994, 155, 235–242. [Google Scholar] [CrossRef]
- Metcalf, T.R.; Leka, K.D.; Barnes, G.; Lites, B.W.; Georgoulis, M.K.; Pevtsov, A.A.; Balasubramaniam, K.S.; Gary, G.A.; Jing, J.; Li, J.; et al. An Overview of Existing Algorithms for Resolving the 180° Ambiguity in Vector Magnetic Fields: Quantitative Tests with Synthetic Data. Sol. Phys. 2006, 237, 267–296. [Google Scholar] [CrossRef]
- Leka, K.D.; Barnes, G.; Crouch, A.D.; Metcalf, T.R.; Gary, G.A.; Jing, J.; Liu, Y. Resolving the 180° Ambiguity in Solar Vector Magnetic Field Data: Evaluating the Effects of Noise, Spatial Resolution, and Method Assumptions. Sol. Phys. 2009, 260, 83–108. [Google Scholar] [CrossRef]
- Calabretta, M.R.; Greisen, E.W. Representations of celestial coordinates in FITS. Astron. Astrophys. 2002, 395, 1077–1122. [Google Scholar] [CrossRef]
- Sun, X. On the Coordinate System of Space-Weather HMI Active Region Patches (SHARPs): A Technical Note. arXiv 2013, arXiv:1309.2392. [Google Scholar]
- Gary, G.A.; Hagyard, M.J. Transformation of vector magnetograms and the problems associated with the effects of perspective and the azimuthal ambiguity. Sol. Phys. 1990, 126, 21–36. [Google Scholar] [CrossRef]
- Su, J.T.; Zhang, H.Q. Influence Of Stray Light in the Instrument on Measurements of Longitudinal Magnetic Signals and Magnetic Field Azimuths. Sol. Phys. 2005, 226, 189–200. [Google Scholar] [CrossRef]
- Liu, S.; Su, J.T.; Bai, X.Y.; Deng, Y.Y.; Chen, J.; Song, Y.L.; Wang, X.F.; Xu, H.Q.; Yang, X. The Magnetic-Field Calibration of the Full-Disk Magnetograph Onboard the Advanced Space Based Solar Observatory (ASO-S/FMG). Sol. Phys. 2023, 298, 141–151. [Google Scholar] [CrossRef]
Disclaimer/Publisher’s Note: The statements, opinions and data contained in all publications are solely those of the individual author(s) and contributor(s) and not of MDPI and/or the editor(s). MDPI and/or the editor(s) disclaim responsibility for any injury to people or property resulting from any ideas, methods, instructions or products referred to in the content. |
© 2024 by the authors. Licensee MDPI, Basel, Switzerland. This article is an open access article distributed under the terms and conditions of the Creative Commons Attribution (CC BY) license (https://creativecommons.org/licenses/by/4.0/).