Article

Metabolomic Profiling and Cytotoxic Tetrahydrofurofuran Lignans Investigations from Premna odorata Blanco

by
Abeer H. Elmaidomy
1,
Rabab Mohammed
1,
Hossam M. Hassan
1,
Asmaa I. Owis
1,
Mostafa E. Rateb
1,2,
Mohammad A. Khanfar
3,4,
Markus Krischke
5,
Martin J. Mueller
5,* and
Usama Ramadan Abdelmohsen
6,7,*
1
Department of Pharmacognosy, Faculty of Pharmacy, Beni-Suef University, Beni-Suef 62514, Egypt
2
School of Computing, Engineering & Physical Sciences, University of the West of Scotland, Paisley PA1 2BE, UK
3
Faculty of Pharmacy, The University of Jordan, P.O Box 13140, Amman 11942, Jordan
4
College of Pharmacy, Alfaisal University, Al Takhassusi Rd, Riyadh 11533, Saudi Arabia
5
Julius-von-Sachs-Institute of Biosciences, Biocenter, Pharmaceutical Biology, University of Würzburg, 97070 Würzburg, Germany
6
Department of Pharmacognosy, Faculty of Pharmacy, Deraya University, Universities Zone, New Minia City 61111, Egypt
7
Department of Pharmacognosy, Faculty of Pharmacy, Minia University, Minia 61519, Egypt
*
Authors to whom correspondence should be addressed.
Metabolites 2019, 9(10), 223; https://doi.org/10.3390/metabo9100223
Submission received: 18 September 2019 / Revised: 4 October 2019 / Accepted: 8 October 2019 / Published: 13 October 2019

Abstract

:
Metabolomic profiling of different Premna odorata Blanco (Lamiaceae) organs, bark, wood, young stems, flowers, and fruits dereplicated 20, 20, 10, 20, and 20 compounds, respectively, using LC–HRESIMS. The identified metabolites (134) belonged to different chemical classes, including iridoids, flavones, phenyl ethanoids, and lignans. A phytochemical investigation of P. odorata bark afforded one new tetrahydrofurofuran lignan, 4β-hydroxyasarinin 35, along with fourteen known compounds. The structure of the new compound was confirmed using extensive 1D and 2D NMR, and HRESIMS analyses. A cytotoxic investigation of compounds 3538 against the HL-60, HT-29, and MCF-7 cancer cell lines, using the MTT assay showed that compound 35 had cytotoxic effects against HL-60 and MCF-7 with IC50 values of 2.7 and 4.2 µg/mL, respectively. A pharmacophore map of compounds 35 showed two hydrogen bond acceptor (HBA) aligning the phenoxy oxygen atoms of benzodioxole moieties, two aromatic ring features vectored on the two phenyl rings, one hydrogen bond donor (HBD) feature aligning the central hydroxyl group and thirteen exclusion spheres which limit the boundaries of sterically inaccessible regions of the target’s active site.

Graphical Abstract

1. Introduction

Cancer is one of the most threatening diseases worldwide that affect human health and quality of life [1,2,3]. Chemotherapy is frequently used in cancer treatment, which is derived from natural or synthetic sources [4]. Natural products were the most consistently successful source of drug leads [5]. Approximately 60% of drugs in clinical trials against cancer are either natural products or inspired pharmacophores derived from natural products [3,6].
P. odorata, popularly known as ‘Alagaw’ is a small tree native to the tropical regions [4]. In the Philippines, the decoction of the leaves is used as a diuretic, a febrifuge, and for the treatment of vaginal irritation, coughs, abdominal pains, and dysentery [5]. Recently, in vitro and in vivo studies targeting its antituberculosis activity showed that P. odorata oil along with 1-heneicosyl formate that was isolated from the leaves significantly alleviated tuberculosis [4,6]. P. odorata is among the top natural sources of aliphatic iridoids, acylated iridoid glycosides, acylated rhamnopyranosides, flavones, and phenyl ethanoids [5,7,8,9]. Previous investigations of these constituents revealed their inhibitory activity against triple-negative breast cancer cell lines by targeting c-Met phosphorylation [5].
On the other hand; metabolomics is a valuable and comprehensive analysis tool that is used to study the metabolite profiles of unicellular and multicellular biological systems [10]. Plants represent a major challenge in metabolomics due to the high chemical diversity of their metabolites [10]. Consequently, no single analytical method can determine all plant metabolites simultaneously, but LC–HRESIMS is a powerful analytical tool for metabolic profiling that can detect/dereplicate a wide range of chemical compounds at the same time without tedious isolation procedures [11,12].
A limited number of phytochemical and biological investigations have been conducted on the Premna species, notably P. odorata, where iridoids, flavonoids, phenyl ethanoids, and acylated rhamnopyranosides were described as their major constituents present in leaves [5]. The present study was undertaken to investigate and compare P. odorata metabolites presented in different organs (bark, wood, young stems, flowers, and fruits) using LC–HRESIMS, in addition to a phytochemical study targeting the bark organ, which was accompanied by the determination of the cytotoxic activities of the isolated lignans with a pharmacophore study for the active compound.

2. Results and Discussion

2.1. Metabolomic Analysis

Chemical profiling of the secondary metabolites of the P. odorata bark, wood, young stems, flowers and fruits using LC–HRESIMS for dereplication purposes, resulted in the characterization of a variety of constituents, among which iridoids, flavones, tetrahydrofurofuran lignans, and phenyl ethanoids (Table 1, Figure 1) were predominant, with qualitative and quantitative variation in each organ.
From the metabolomics data, the mass ion peak at m/z 611.1915 for the predicted molecular formula C27H30O16 was dereplicated as the flavonoid glycoside luteolin-6,8-di-c-β-d-glucopyranoside 1, which was previously detected in Viola yedoensis and first reported in the Premna genus [13], whereas that at m/z 387.1276, corresponding to the suggested molecular formula C21H22O7 was dereplicated as 9-hydroxy-3’,4’-dimethoxy-3,4-methylenedioxy-7,9’:7’,9-diepoxylignan 2, which was formerly reported from the species Geranium thunbergii [14]. Likewise, another tetrahydrofurofuran lignan with the molecular formula C20H18O8 was characterized as 4,8-dihydroxy sesamin 3 from the mass ion peak at m/z 387.1323, which was previously obtained from Gmelina arborea [15]; this was the first report for this metabolite in the genus Premna. Moreover, the mass ion peak at m/z 595.2334, in agreement with the predicted molecular formula C27H30O15 was dereplicated as flavonoid glycoside vicenin-2 4. This has been isolated earlier from Erythrina caffra [16] but herein its extraction from P. odorata plants was reported for the first time. The mass ion peaks at m/z 581.1560, 551.1592, and 565.2288 for the predicted molecular formulas C26H28O15, C25H26O14, and C26H28O14 were dereplicated as the flavonoid glycoside luteolin 6-c-β-d-glucopyranoside, 8-c-α-l-arabinopyranoside, luteolin-6,8-di-c-α-l-arabinopyranoside, and schaftoside-2, 5, 6, 7, respectively, which were previously detected in Apometzgeria pubescens and was first reported in the Premna genus [17]. Whereas, the mass ion peaks at m/z 433.1361, corresponding to the suggested molecular formula C21H20O10, was dereplicated vitexin 8, which was formerly reported in P. odorata [5]. Likewise, acylated iridoid with the molecular formula C39H44O20 was characterized as premnoside-A 9 from the mass ion peak at m/z 833.2746 and was previously obtained from P. odorata [9]. Additionally, a compound at m/z 535.2889, corresponding to the suggested molecular formula C25H26O13 was dereplicated as flavonoid glycoside apigenin 6,8-di-c-α-l-arabinopyranoside 10, which was formerly reported from the species Apometzgeria pubescens and was first reported in the Premna genus [17].
In addition to the above-mentioned molecules, the mass ion peaks at m/z 671.1910 and 671.1910 for the suggested molecular formulas C30H38O17 and C30H38O17 were identified as 6-o-α-l-(2’’-O-trans-caffoyl) rhamnopyranosyl catalpol 11 and 6-o-α-l-(3’’-O-trans-caffoyl) rhamnopyranosyl catalpol 12, respectively, which were previously reported in P. odorata [8]. Peaks at m/z 793.3148 and 549.1555 were consistent with the molecular formula C40H34O15 and C26H28O13, and were dereplicated as premnadimer 13 and 4β-hydroxyasarinin-1-o-β-d-glucopyranoside 14, respectively; tetrahydrofurofuran lignans were previously isolated from the P. integrifolia bark [18].
Other iridoids, phenyl ethanoid, and flavones related compounds which were formally isolated from P. odorata leaves were characterized as premnoside-B 15, premnoside-F 16, premnoside-D 17, acacetin 18, premnoside-E 19, 6- o-α- l-(4’’-o-trans-P-methoxycinnamoyl) rhamnopyranosylcatalpol 20, verbascoside 21, premnoside-H 22, premnoside-G 23, diosmetin 24, premnaodoroside A-C 2527, premnoside-C 28, luteolin 30, and apigenin 33 based on the mass ion peaks and in accordance with their molecular formulas (Table 1, Figure 1) [5,7,9].
On the other hand, many other tetrahydrofurofuran lignans were also described. In this regard, the mass ion peak at m/z 355.1937, corresponding to the suggested molecular formula C20H18O6, was dereplicated as sesamin 29, while that at m/z 379.2381 was dereplicated as 9-hydroxypinoresinol 31 with the molecular formula C20H22O7 [19,20]. Pinoresinol 32 and 1,5α-dihydroxypinoresinol 34 were also characterized by the mass ion peaks at m/z 359.4261 and 391.2497, in agreement with the predicted formula C20H22O6 and C20H22O8, respectively. The latter four metabolites were reported for the first time in the Premna genus (Table 1) [21,22].
It is worth mentioning that based on dereplication, phenyl ethanoids (verbascoside 30) and flavones (vitexin 8, acacetin 18, diosmetin 24, luteolin 30, and apigenin 33) were generally found in all P. odorata organs (Table 1). On the other hand; lignans were the major metabolites class in both bark and wood organs, while iridoid metabolites were more associated with the flowers, fruits, and young stems (Table 1, Figure 1).
This is the first report for the active metabolites of P. odorata bark; wood, young stems, flowers, and fruits, and these phytochemical data concerning this rarely studied species are of appreciable chemotaxonomic value too.

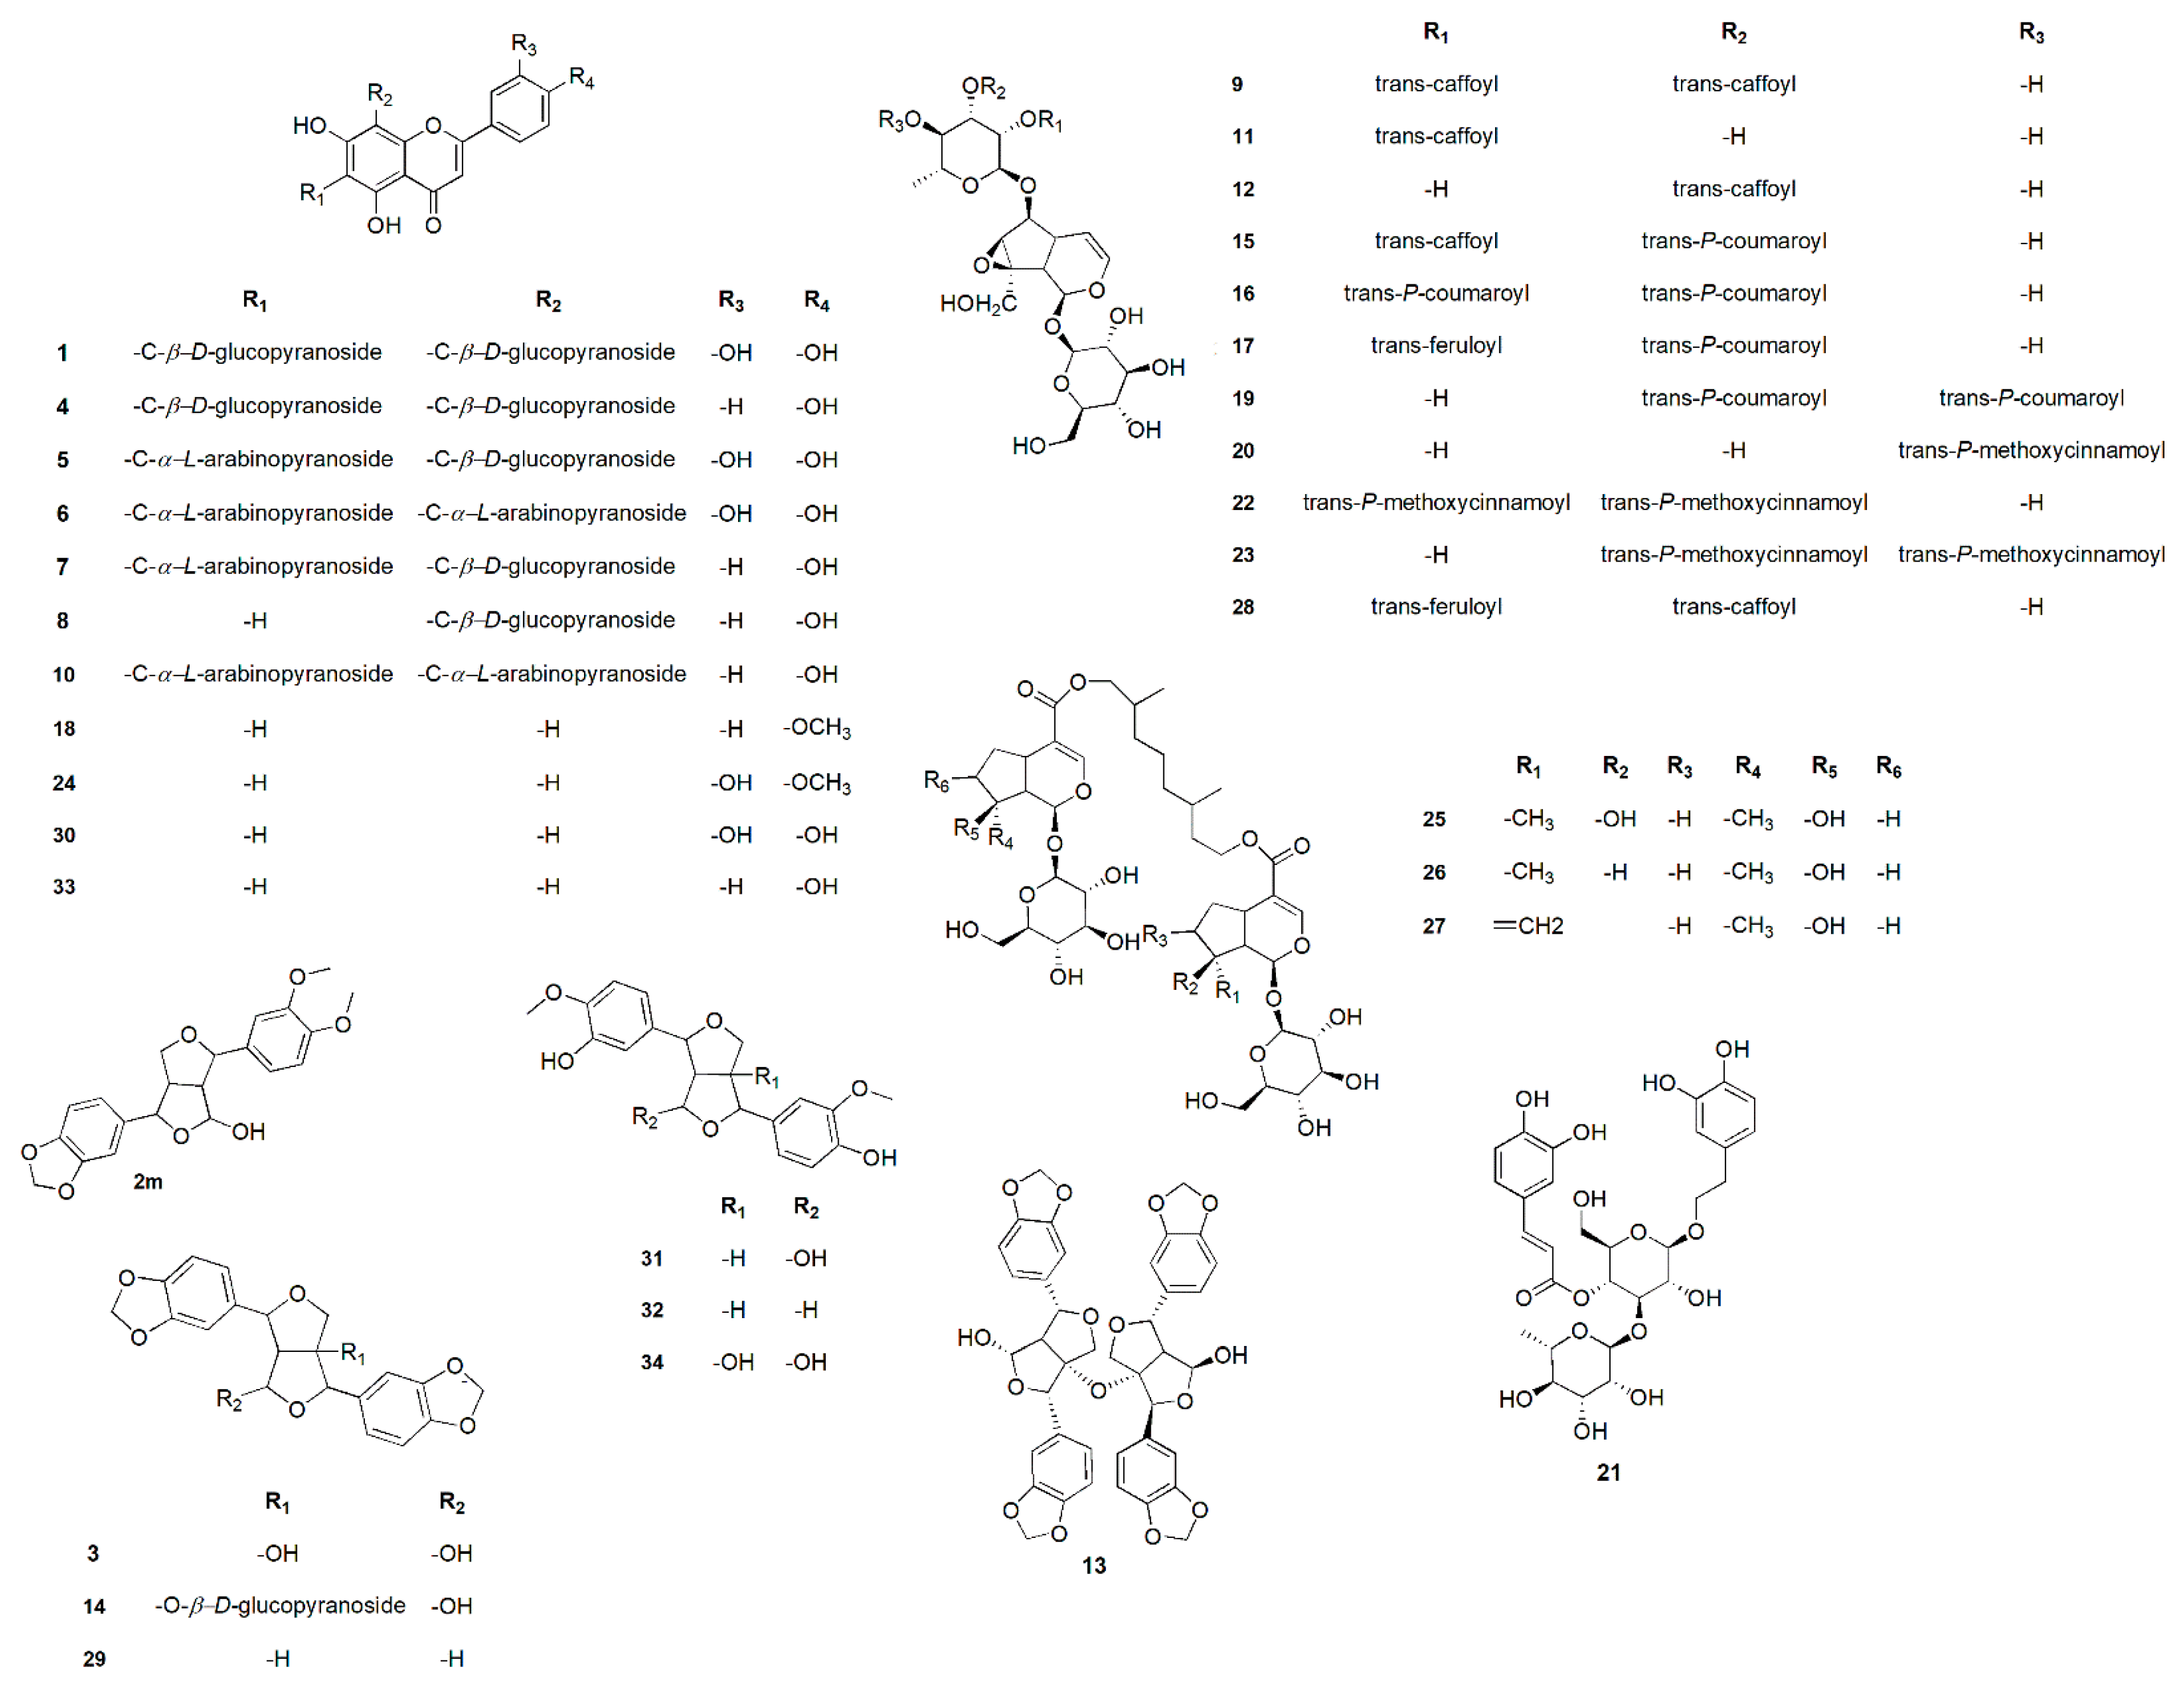
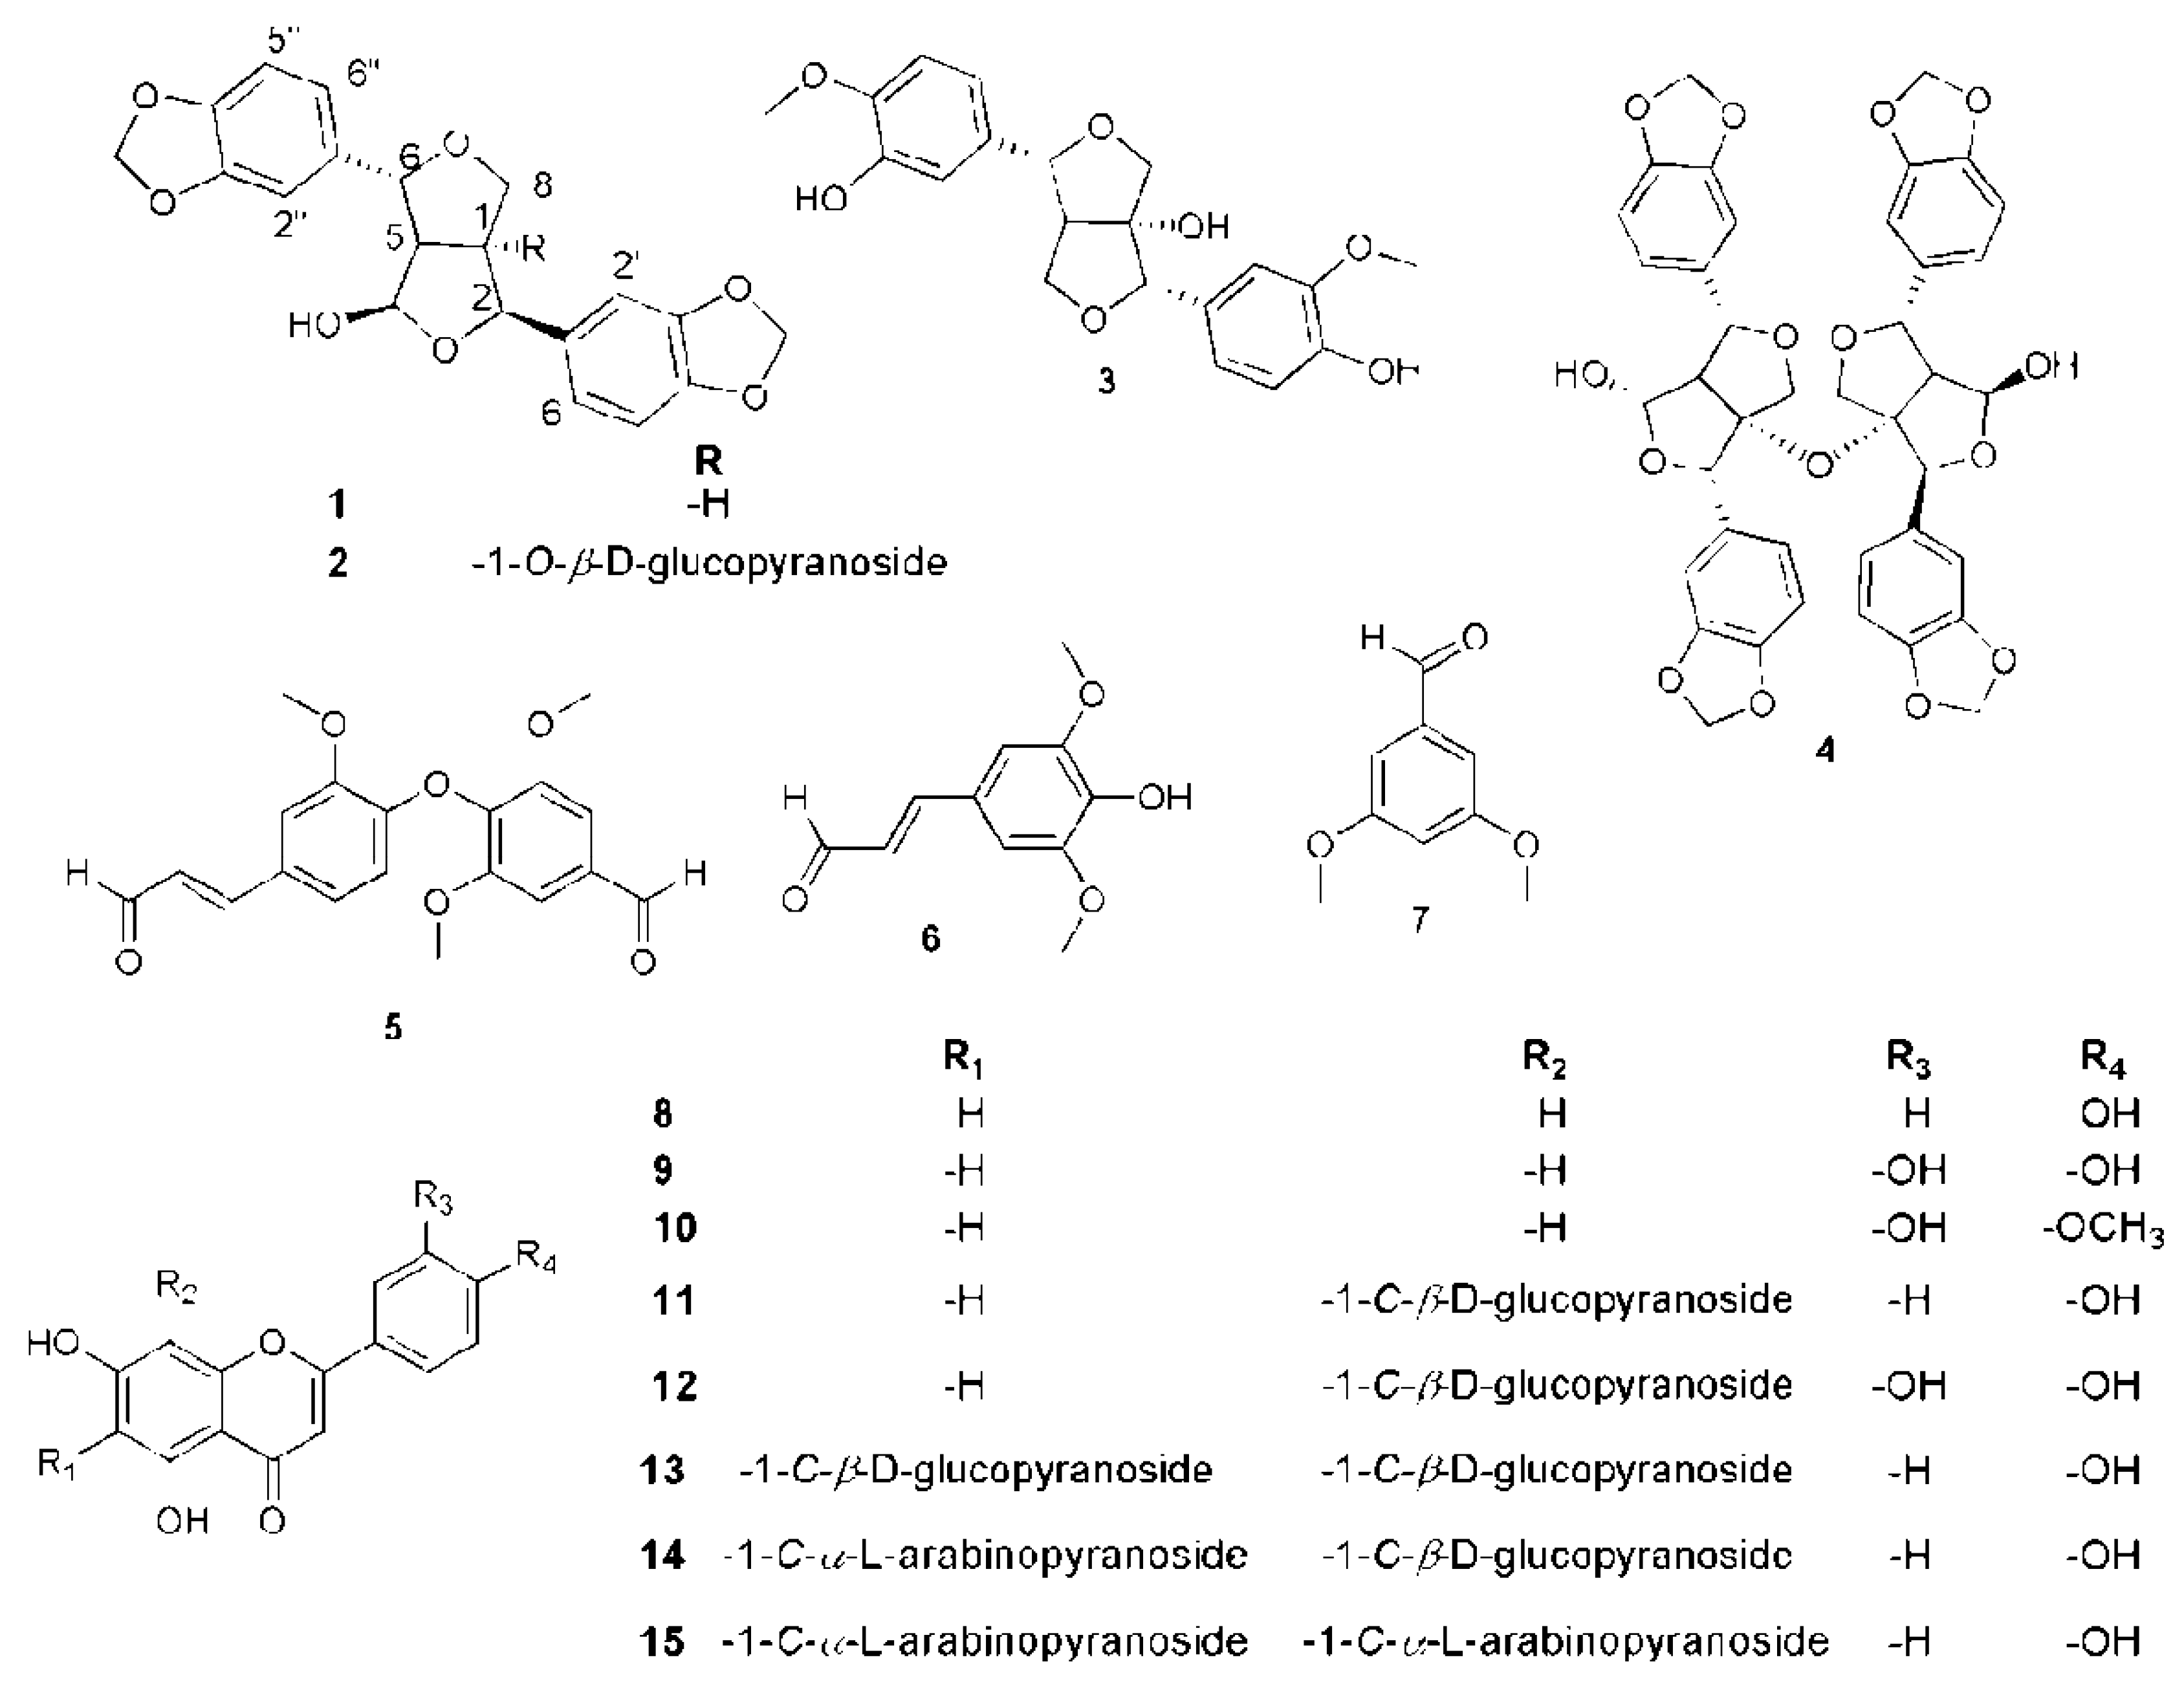
2.2. Phytochemical Investigation of P. odorata Bark

According to LC–HRESIMS metabolomic profiling, iridoids, flavones, and phenyl ethanoids were mainly dominant in the young stems, flowers, and fruits organs, and as previously reported, in leaves. However, bark and wood similarly produced lignans and flavonoid metabolites which were remarkably different from those other organs (Table 1). Consequently, this phytochemical study targeted bark organ polyphenolic compounds.
Based on the physicochemical and chromatographic properties, spectral analyses (UV, 1H, and DEPT‒Q NMR), as well as comparison with the literature and some authentic samples, the compounds isolated (Figure 2) from the ethanolic extract of P. odorata bark afforded the new tetrahydrofurofurnan lignan 35, along with the known 4β-hydroxyasarinin-1-o-β-glucopyranoside 36 [18], 1,5α-dihydroxypinoresinol 37 [22], premnadimer-A 38 [18], 3-[3′-methoxy-4′-(4′’-formyl-2′’,6′’-dimethoxy-phenoxy)-phenyl]-propenal 39 [23], sinapaldehyde 40 [24], 3,5-dimethoxybenzaldehyde 41 [24], apigenin 42, luteolin 43, diosmetin 44, vitexin 45 [5], orientin 46 [25],vicenin-2 47 [16], schaftoside-2 48 [17], and apigenin-6,8-di-c-α-l-arabinopyranoside 49 (Figure 2) [25]. All characterized compounds (37, 3941, 4649) were isolated herein for the first time from the genus Premna, while compounds 36, 38 were isolated for the first time from the Premna species.
Compound 35 (Table 2, Figure 2, see Supplementary Figures S1–S5) was obtained as a white amorphous solid. The HRESIMS data for compound 35 showed an adduct pseudo-molecular ion peak at m/z 393.0949 [M + Na]+, consistent with the molecular formula C20H18O7 and suggesting 12 degrees of unsaturation. The 1H, DEPT-Q, and HSQC NMR data (Table 2, Figure 2), showed 6 characteristic resonances; one CH group at δH 2.93 (1H, dd, J = 7.3, 7.5) δC 62.1, two benzylic oxymethine moieties at 4.84 (1H, d, J = 7.01) δC 83.3 and 4.96 (1H, d, J = 10.1) δC 88.1, one oxymethylene group at δH 4.01 (dd, J = 9.1, 11.1), 4.22 (dd, J = 9.1, 6.1) δC 72.2, one methine at δH 3.91 (1H, dddd, J = 6.1, 7.1, 7.3, 11.1) δC 53.2, and one oxymethine at δH 5.57 (1H, s) δC 101.7. Additionally, the HMBC experiment showed the characteristic 2J HMBC correlation of proton H-1 δH 3.91 (1H, dddd, J = 6.1, 7.1, 7.3, 11.1) with C-2 δC 83.3, C5 δC 62.1, C8 δC 72.2. It also showed characteristics of proton H-5 δH 2.93 (1H, ddd, J = 7.3, 7.5, 10.1) with C-1 δC 53.2, C-4 δC 101.7, and C-6 δC 88.1, suggesting the characteristic structure of the tetrahydrofurofuran unit [18]. This was confirmed through the 1H-1H COSY data of 35 (Figure 3), which showed the expected coupling of H-1, H-2, H-4, H-5, H-6, and H-8. Moreover; the acquired NMR data (Table 2, Figure 3) showed that 6 characteristic aromatic resonances appeared at δH 6.78–7.06, where the HMBC experiment showed characteristic 2J HMBC correlation of proton H-5’ δH 6.81 (1H, d, J = 8.0) with C-6’ δC 119.2 and C-4’ δC 147.3, respectively. Additionally, the 2J HMBC correlation of proton H-5’’ δH 6.89 (1H, d, J=8.1) with C-6’’ δC 120.0 and C-4’’ δC 147.2, respectively, suggested the presence of two 1,3,4-trisubstituted benzene rings [18]. The remaining two resonances present in the 1H, DEPT-Q, HSQC NMR data perfectly matched to the two OCH2O groups that appeared at δH 5.41 (4H, s) δC 101.4. The HMBC experiment showed characteristic 3J HMBC correlations of the protons of the two OCH2O group with C-3’ δC 147.3, C-4’ δC 147.2, C-3’’ δC 147.4, and C-4’’ δC 147.3, respectively (Table 2, Figure 3). The 2J HMBC correlations of the proton H-2 δH 4.84 (1H, d, J = 7.1) δC 83.3, with the quaternary carbonyl carbon C-1’ δC 135.4 and the correlation of the proton H-6 δH 4.96 (1H, d, J = 10.1) δC 88.1 with the carbonyl carbon C-1’’ δC 136.1, confirmed the location of the two 1,3,4-trisubstituted benzene rings at carbons C-2 and C-6 at the tetrahydrofurofuran moiety (Figure 3). The relative stereochemistry of compound 35 was deduced using the J values and a Nuclear Overhauser Effect (NOE) experiment (Table 2). Where the NOEs observed between H-1, H-2, H-4, and H-5 suggested that they are in the same plan, while the NOEs observed between H-4 and H-6 suggested they are on the other side of the tetrahydrofurofuran moiety. Comparing the 1H and DEPT-Q data of compound 35 with the known related compound 4β-hydroxyasarinin-1-o-β-glucopyranoside 36 [18] in which the o-β-glucopyranoside moiety was attached at C-1, showed that the 1-o-β-glucopyranoside moiety was obviously absent and the quaternary C-1 at 4β-hydroxyasarinin-1-o-β-glucopyranosid was converted to a methine group that appeared at δH 3.91 (1H, dddd, J = 6.1, 7.1, 7.3, 11.1) δC 53.2. Accordingly, compound 35 was identified as 4β-hydroxyasarinin.

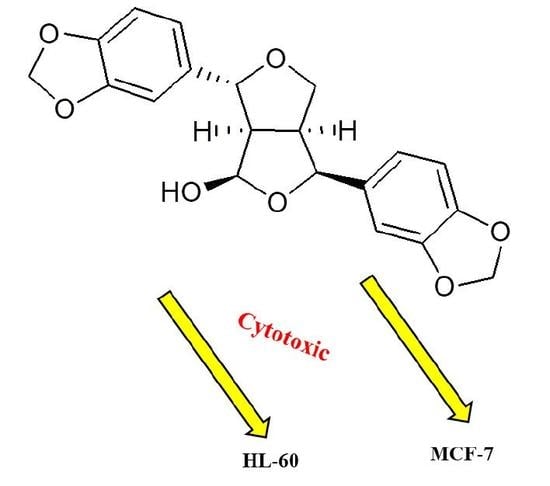
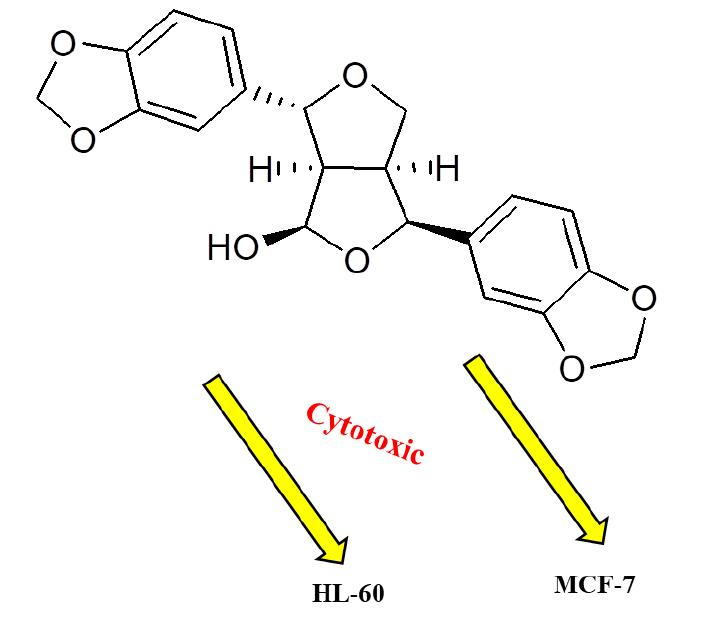
2.3. Cytotoxic Activity

Lignans are a class of secondary plant metabolites that are produced from shikimic acid via the phenylpropanoid pathway through the oxidative dimerization of two phenylpropanoid units [26]. Some lignins proved beneficial in decreasing the risk of breast tumor, prostate cancer, and cardiovascular disease. Further, they can have antioxidant and anti-inflammatory actions [26,27,28]. In this investigation; the isolated compounds 3538 from the ethanolic extract of P. odorata bark were evaluated for their cytotoxic activities against HL-60, HT-29, and MCF-7 cancer cell lines, using the MTT assay. The results showed that only compound 35 displayed cytotoxic effect towards HL-60 and MCF-7 cells with IC50 values of 2.7 and 4.2 mg/mL, respectively; the known doxirubicin (IC50 4.3, 6.5 µg/mL, respectively) was used as a positive control (Table 3). These results might be associated with the free position at C-1 with the di-substitution of a methylenedioxy group in compound 35 (Figure 2), as compared to the other tested tetrahydrofurofuran lignan compounds 3638.
Comparing the cytotoxic activity of compound 35 with the related previously isolated isomer (-)-sesamin [28], which has the same carbon framework as compound 35 but differ in the chemical configuration of C-6 and dehydroxylation at C-4, showed that (-)-sesamin exhibited a more potent inhibitory effect on MCF-7 cancer cell invasion with an IC50 value of 3.4 µg/mL.

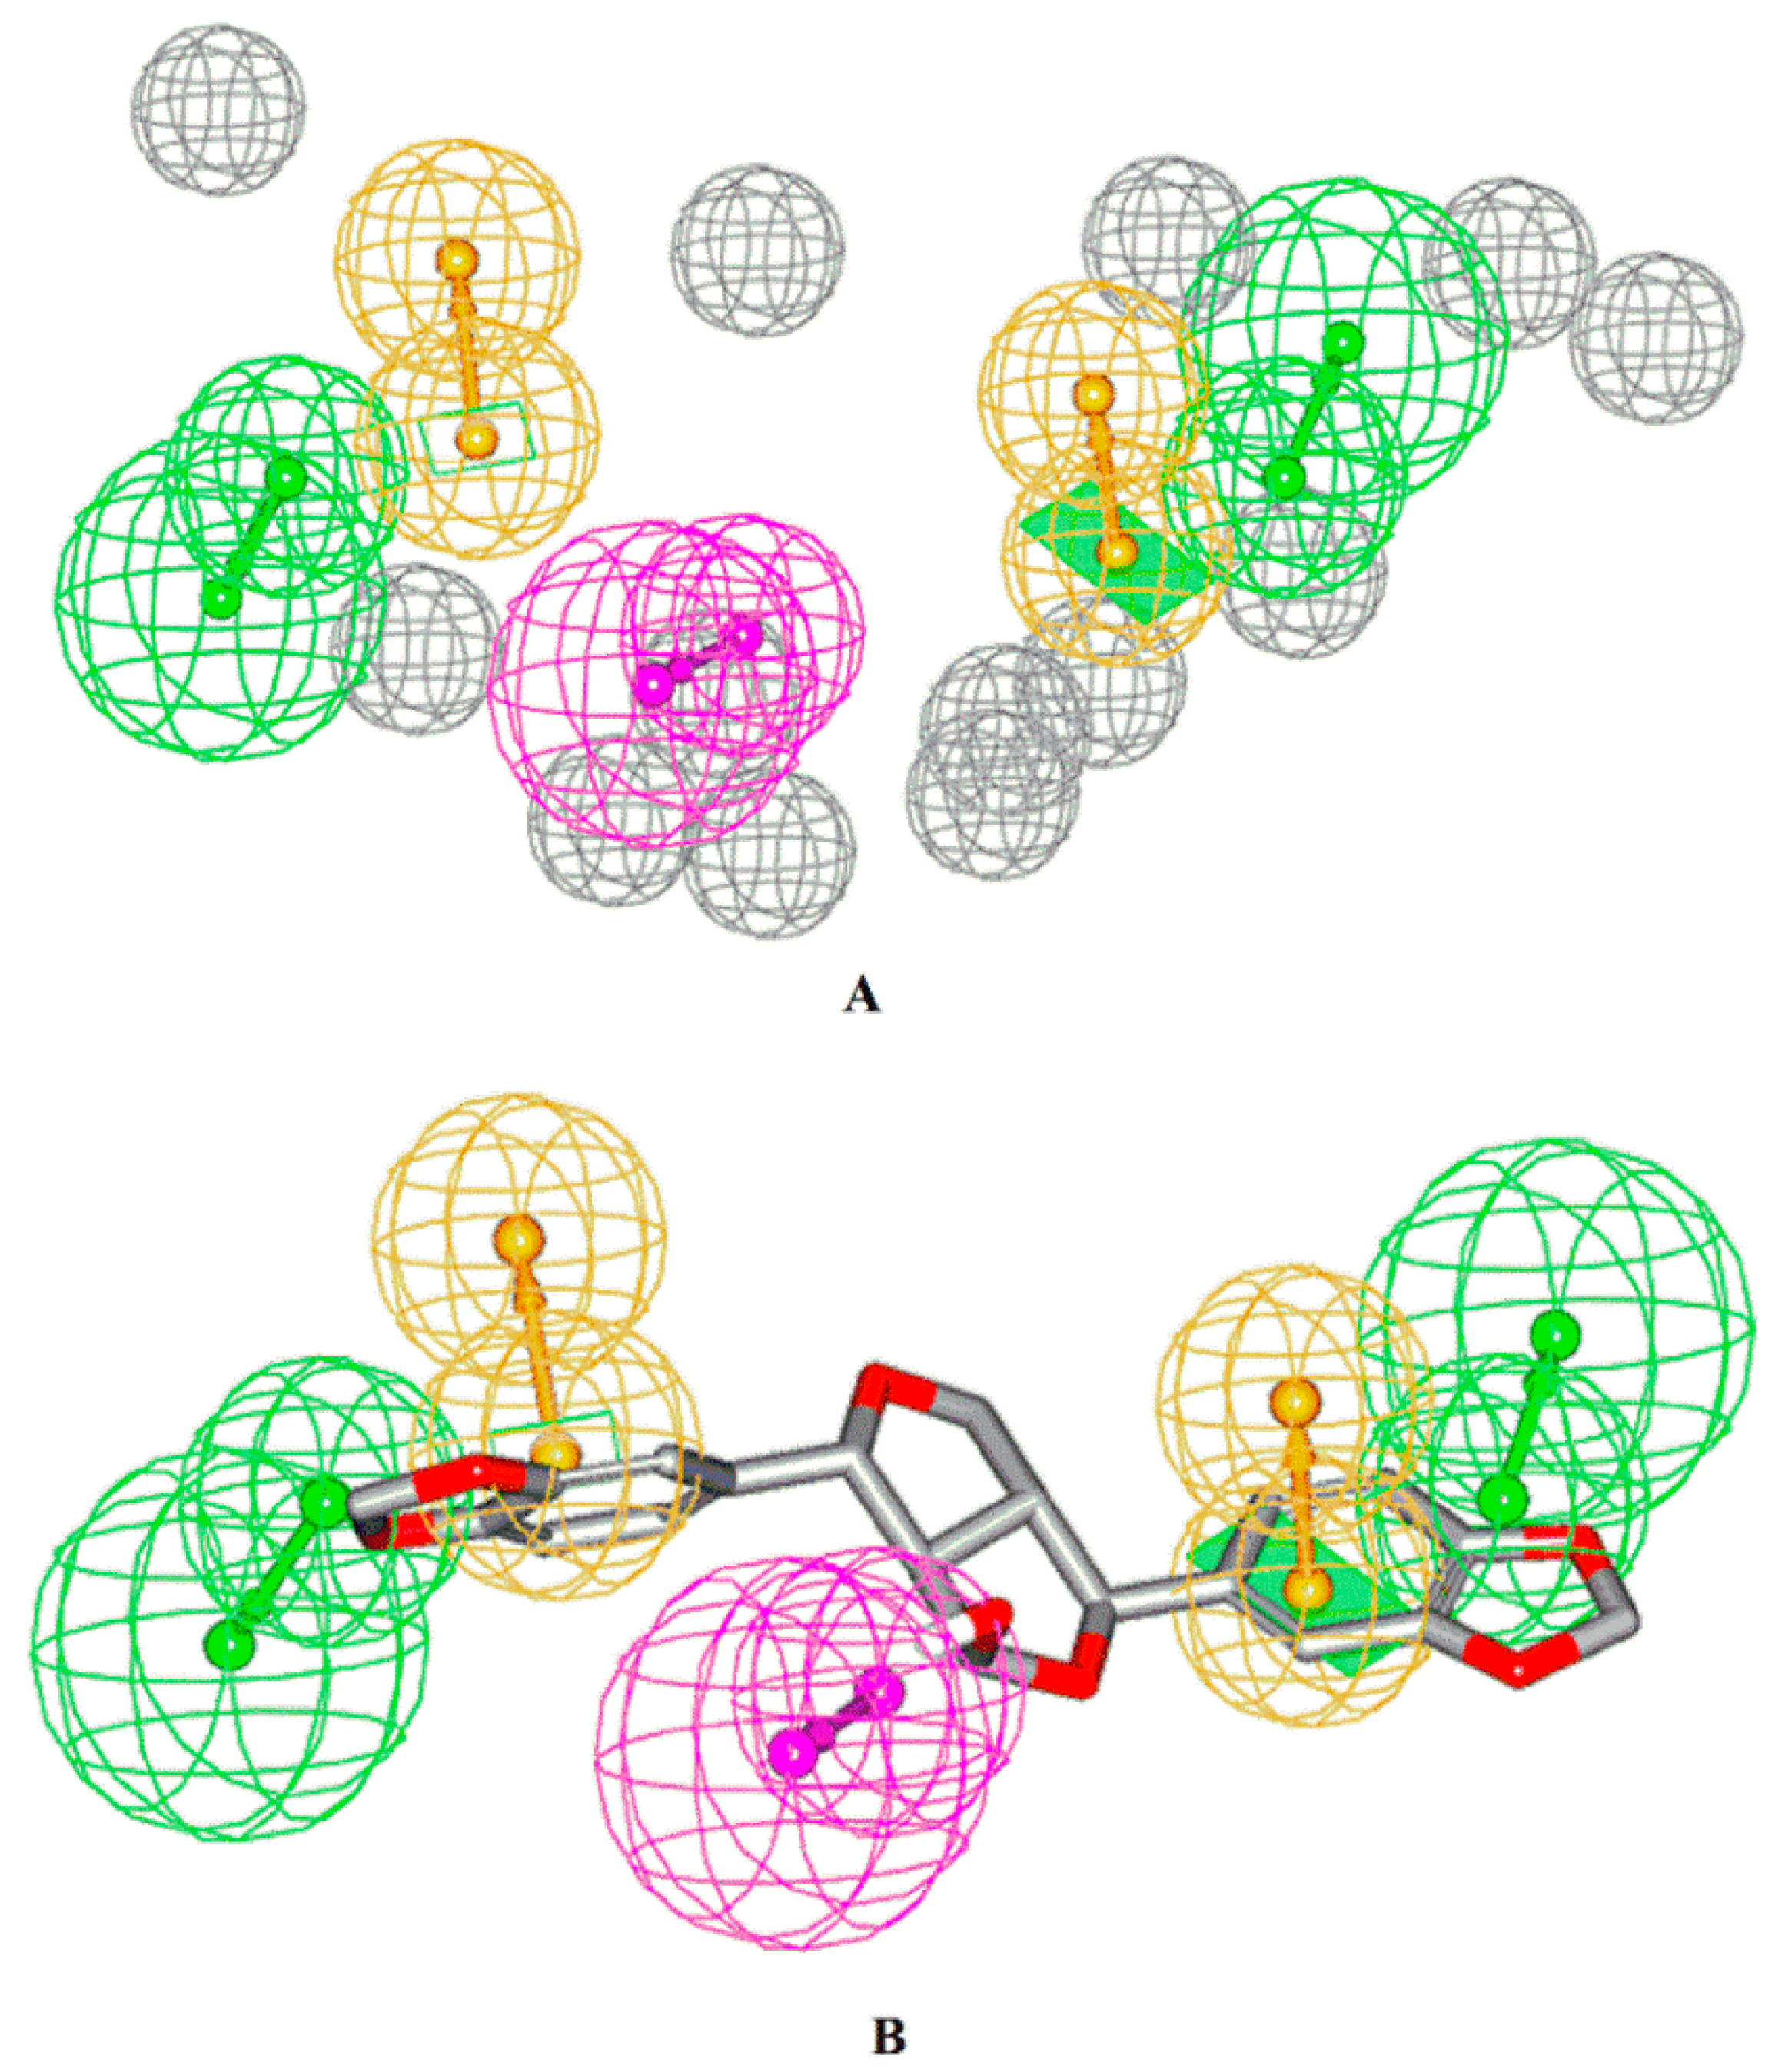
2.4. Pharmacophore Model Generation

Pharmacophore modeling is an essential concept in rational drug design, which represents the notion that compounds are active/inactive at a specific receptor because they have/lack some crucial functional groups (features) that correspondingly interact with specific moieties in the binding site of the target receptor [29,30]. Pharmacophore modeling has empowered the rational design of more active ligands, the discovery of more active hits by screening molecular databases, the generation of 3D SAR, the design of hits without the necessity of a receptor structure, and mapping the chemical space occupied by active ligands [29,30].
The HipHop module of the Discovery Studio 2.5 software was applied to construct a pharmacophore hypothesis of compounds 3538 (Figure 4). The highest-ranked model (generated using parameters described in the experimental part) had the following features which mapped compound 35—two hydrogen bond acceptor (HBAs) aligning the phenoxy oxygen atoms of the benzodioxole moieties, two Ring Arom features vectored on the two phenyl rings, one hydrogen bond donor (HBD) feature aligning the central hydroxyl group, and thirteen exclusion spheres limit the boundaries of the sterically inaccessible regions of the target’s active site.
The advantage of this model is that it identifies the essential chemical features necessary to inhibit the growth of cancer cells. Moreover, the generated pharmacophore can map the boundaries of the chemical space by placing exclusion constrains that mimic the inaccessible region of the active site.

3. Materials and Methods

3.1. Plant Material

P. odorata bark, wood, young stems, flowers, and fruits were collected in May 2018 from the Giza Zoo garden, Egypt. P. odorata was kindly identified by Dr. Abd ElHalim A. Mohammed of the Horticultural Research Institute, Department of Flora and Phytotaxonomy Researches, Dokki, Cairo, Egypt. A voucher specimen (2018-BuPD 45) was deposited at the Department of Pharmacognosy, Faculty of Pharmacy, Beni-Suef University, Egypt.

3.2. Chemicals and Reagents

Solvents used in this work, such as n-hexane (boiling point b.p. 60–80 °C), dichloromethane (CH2Cl2), ethyl acetate (EtOAc), ethanol (EtOH), and methanol (MeOH), were purchased from the El-Nasr Company for Pharmaceuticals and Chemicals, Egypt; the solvents were distilled before use. Deuterated solvents (Sigma-Aldrich, Saint Louis, Missouri, USA), including chloroform (CDCl3), methanol (CD3OD), and dimethyl sulfoxide (DMSO-d6) were used for the nuclear magnetic resonance (NMR) spectroscopic analyses. On the other hand, column chromatography (CC) was performed using silica gel 60 (63–200 μm, E. Merck, Sigma-Aldrich), polyamide-6 (50–160μm), and Sephadex LH–20 (0.25–0.1 mm, GE Healthcare, Sigma-Aldrich), while silica gel GF254 for Thin-layer chromatography (TLC) (El-Nasr Company for Pharmaceuticals and Chemicals, Egypt) was employed for vacuum liquid chromatography (VLC). Thin-layer chromatography (TLC) was carried out using pre-coated silica gel 60 GF254 plates (E. Merck, Darmstadt, Germany; 20 × 20 cm, 0.25 mm in thickness). Spots were visualized by spraying with para-anisaldehyde reagent PAA (85:5:10:0.5 absolute ethanol:sulfuric acid:glacial acetic acid:para-anisaldehyde), followed by heating at 110 °C [31]. Aluminum chloride reagent (5% in ethanol) was also used for the detection of flavonoids on TLC [32]. For the biological study, doxorubicin was used as a positive control and was purchased from the Merck Company, Sigma-Aldrich, Germany, while the HL-60, HT-29, and MCF-7 cancer cell lines were obtained from the American Type Culture Collection (ATCC, Rockville, MD; HPACC, Salisbury, UK) and were routinely sub-cultured twice per week. All other chemicals and reagents were purchased from Sigma Aldrich.

3.3. Apparatus

The 1H, DEPT-Q, and 2D NMR spectra were recorded at 400 and 100 MHz, respectively; using tetramethylsilane (TMS) as the internal standard in methanol-d4, using the residual solvent peak (δH = 3.34 & δC = 49.9) as references, on Bruker Avance III 400 MHz with a BBFO Smart Probe and Bruker 400 MHz EON Nitrogen-Free Magnet (Bruker AG, Billerica, MA, USA). Carbon multiplicities were determined using the DEPT-Q experiment. The optical rotation in methanol was obtained using a Perkin-Elmer 343 polarimeter (PerkinElmer Inc., Waltham, MA, USA). The UV spectrum in methanol was obtained using a Shimadzu UV 2401PC spectrophotometer (Shimadzu Corporation - UV-2401PC/UV-2501PC, Kyoto, Japan). The IR spectra were obtained using a Jasco FTIR 300E infrared spectrophotometer. HRESIMS data were obtained using an Acquity Ultra Performance Liquid Chromatography system coupled to a Synapt G2 HDMS quadrupole time-of-flight hybrid mass spectrometer (Waters, Milford, MA, USA).

3.4. Extraction and Fractionation of Plant Material

P. odorata bark (2 kg) was collected and air-dried in shade for one month. After drying, the bark was finely powdered using a OC-60B/60B set small, corn, bark grinding machine for herbs (60–120 mesh, Henan, Mainland China). The finely powdered bark was exhaustively extracted by maceration with 70% ethanol (5 L, 3 ×, seven days each) at room temperature and concentrated under vacuum at 45 °C, using rotavap (Buchi Rotavapor R-300, Cole-Parmer, Vernon Hills, IL, USA), to afford an 80 g crude extract. The dry extract was suspended in 200 mL distilled water and successively portioned with solvents of different polarities (n-hexane, CH2Cl2, and EtOAc). The organic phase in each step was separately evaporated under reduced pressure to afford the corresponding fractions I (5.0 g), II (10.0 g), and III (10.0 g), respectively, while the remaining mother liquor was then concentrated to give the aqueous fraction (IV). All resulting fractions were kept at 4 °C for the biological and phytochemical investigations.

3.5. Metabolomic Analysis Procedure

Air-dried and finely powdered P. odorata bark, wood, young stems, flowers, and fruits (2 g each) were exhaustively extracted with 70% ethanol (5 ml, 3 ×, 0.5 h.) at room temperature and concentrated under vacuum to afford 50, 80, 80, 40, and 50 mg crude extracts, respectively. The crude extracts of different organs were subjected to metabolomic analysis using analytical techniques of LC–HRESIMS, according to Abdelmohsen et al. [33]. LC–HRESIMS metabolomics analyses were performed on an Acquity Ultra Performance Liquid Chromatography system coupled to a Synapt G2 HDMS quadrupole time-of-flight hybrid mass spectrometer (Waters, Milford, MA, USA). Chromatographic separation was carried out on a BEH C18 column (2.1 × 100 mm, 1.7 μm particle size; Waters, Milford, MA, USA) with a guard column (2.1 × 5 mm, 1.7μm particle size) and a linear binary solvent gradient of 0–100% eluent B, over 6 min, at a flow rate of 0.3 mL min−1, using 0.1% formic acid in water (v/v) as solvent A and acetonitrile as solvent B. The injection volume was 2 μL and the column temperature was 40 °C. After chromatographic separation, the metabolites were detected by mass spectrometry using electrospray ionization (ESI) in the positive mode; the source was operated at 120 °C. The ESI capillary voltage was set to 0.8 kV, the sampling cone voltage was set to 25 V and nitrogen (at 350 °C, a flow rate of 800 L h−1) was used as the desolvation gas and the cone gas (flow rate of 30 L h−1). The mass range for TOF‒MS was set from m/z (mass-to-charge ratio) 50‒1200. In MZmine 2.12, the raw data were imported by selecting the ProteoWizard converted positive files in the mzML format. Mass ion peaks were detected and followed by a chromatogram builder and a chromatogram deconvolution. The local minimum search algorithm was applied and isotopes were also identified via the isotopic peaks grouper. Missing peaks were detected using the gap-filling peak finder. An adduct search, as well as complex search was performed. The processed data set was then subjected to molecular formula prediction and peak identification. The positive and negative ionization mode data sets from each of the respective plant extract were dereplicated against the DNP database Dictionary of Natural Products (DNP) database.

3.6. Isolation and Purification of Compounds

A part of fraction II (8 g) was subjected to VLC fractionation on a silica gel column (6 × 30 cm, 50 g). Elution was performed using CH2Cl2–EtOAc gradient mixtures in the order of increasing polarities (0%, 5%, 10%, 15%, 20%, 25%, 30%, 35%, 40%, 45%, 50%, 60%, 80%, and 100%, 1L each, flow rate FR 3 mL/min), then with EtOAc–MeOH (50, 50, 1L, flow rate FR 3 mL/min), and finally with MeOH. The effluents were collected in fractions (100 mL each); each fraction was concentrated and monitored by TLC, using the system CH2CL2:EtOAc in the ratio 9:1 and the PAA reagent. Similar fractions were grouped and concentrated under reduced pressure, to provide three subfractions (II1–II3). Subfraction II1 (1.0 g) was further fractionated on a silica gel column (65 × 1.5 cm, 50 g). Elution was performed using n-hexane–EtOAc gradient mixtures, in order of increasing polarities (0%, 5%, 10%, 15%, 20%, 25%, 30%, 35%, 40%, 45%, 50%, 60%, 80%, and 100%, 250 mL each, FR 3 mL/min). The effluents were collected in fractions (20 mL each); each fraction was concentrated and monitored by TLC to afford compound 35 (7 mg), 38 (50 mg), 40 (6 mg), and 41 (7 mg). While Subfraction II2 (1 g) was further fractionated on a silica gel column (65 × 1.5 cm, 50 g). Elution was performed using CH2CL2–EtOAc gradient mixtures in order of increasing polarities (0%, 5%, 10%, 15%, 20%, 25%, 30%, 35%, 40%, 45%, 50%, 60%, 80%, and 100%, 250 mL each, FR 3 mL/min). The effluents were collected in fractions (20 mL each); each fraction was concentrated and monitored by TLC to afford compound 37 (15 mg). Finally, Subfraction II3 (0.5 g) was further fractionated on a silica gel column (100 × 1 cm, 25 g). Elution was performed using a CH2CL2–EtOAc isocratic mixture (1%, 500 mL, FR 3 mL/min) to afford compound 39 (50 mg).
Moreover, a part of EtOAc fraction III (8 g) was fractionated on a polyamide column (50–160 μm, 1000 × 5 cm, 100 g) using a gradient elution starting with H2O and ending with MeOH in the order of increasing polarities (0%, 5%, 10%, 15%, 20%, 25%, 30%, 35%, 40%, 45%, 50%, 60%, 80%, and 100%, 1000 mL each, FR 5 mL/min). The effluents were collected in fractions (200 mL each); each fraction was concentrated and monitored by TLC using the system EtOAc:glacial acetic acid formic acid:H2O in the ratio 10:1:1:2 and the PAA reagent. Similar fractions were grouped together and concentrated under reduced pressure to also provide three subfractions (III1–III3). Subfraction III1 (1.0 g) was further fractionated on a silica gel column (63–200 μm, 65 × 1.5 cm, 50 g). Elution was performed using CH2Cl2–MeOH gradient mixtures, in order of increasing polarities (0%, 5%, 10%, 15%, 20%, 25%, 30%, 35%, 40%, 45%, 50%, 60%, 80%, and 100%, 250 mL each, FR 3 mL/min). The effluents were collected in fractions (20 mL each); each fraction was concentrated and monitored by TLC using the system EtOAc:glacial acetic acid:formic acid:H2O in the ratio 10:1:1:2 and PAA reagent, to afford one promising sub-subfraction III1 (80 mg), which was further purified on a Sephadex LH20 column (0.25–0.1 mm, 100 × 0.5 cm, 100 gm) which eluted with MeOH to afford compound 36 (17 mg). While Subfraction III2 (1 g) was further fractionated on a silica gel column (63–200 μm, 65 × 1.5 cm, 50 g). Elution was performed using CH2Cl2–MeOH gradient mixtures in order of increasing polarities (0%, 5%, 10%, 15%, 20%, 25%, 30%, 35%, 40%, 45%, 50%, 60%, 80%, and 100%, 250 mL each, FR 3 mL/min). The effluents were collected in fractions (20 mL each); each fraction was concentrated and monitored by TLC using the system EtOAc:glacial acetic acid:formic acid:H2O in the ratio of 10:1:1:2 and the PAA reagent, to afford one promising sub-subfraction III2 (70 mg), which further subjected to a preparative TLC eluted with the system EtOAc: glacial acetic acid: formic acid: H2O 10:1:1:2 to give compounds 47 (10 g), 48 (13 mg), and 49 (17 mg). Finally, Subfraction III3 (1.5 g) was further fractionated on a silica gel column (63–200 μm, 65 × 1.5 cm,75 g). Elution was performed using CH2Cl2-MeOH gradient mixtures in order of increasing polarities (0, 1, 2, 3, 4, 5, 6, 7, 8, 9, 10, 15, 20, 25, 30, 35, 40, 45, 50, 60, 80 and 100%, 500 mL each, FR 3 mL/min). The effluents were collected in fractions (20 mL each); each fraction was concentrated and monitored by TLC to afford five promising sub-subfraction III3, each sub-subfraction III3 was further separately purified on a Sephadex LH20 column (0.25–0.1 mm, 100 × 0.5 cm, 100 g) which eluted with MeOH to afford compounds 42 (10 gm), 43 (13 mg), 44 (20 mg), 45 (20 mg), and 46 (17 mg).
4β-hydroxyasarinin (35): Pale white amorphous solid; mp: 100–102 °C (lit.19 99–101 °C); TLC (CH2Cl2:EtOAC, 90:10 v/v): Rf = 0.20; [ α ] D 25 +18.5 (c 0.15, MeOH); UV (MeOH) λmax (log ε) 206 (1.4), 238 (1.6), 285 (0.8) nm; IR υmax (KBr) 3639, 3100, 1600, 1530, 1420, 1250, 1200, 1100, 853, 703, 601 cm−1; NMR data: refer to Table 1; HRESIMS m/z 393.0949 [M +Na]+ (calc. for C20H18NaO7, 393.0945).

3.7. Cell Cultures

HL-60 cells (human promyelocytic cell) were grown in 5% (v/v) CO2 in an RPMI 1640 medium at 37 °C, supplemented with 10% (v/v) 1%(w/v) l-glutamine, and 0.4% (w/v) antibiotics (50 U/mL penicillin and 50 mg/mL streptomycin). The HT-29 cells (human colon adenocarcinoma cell) were cultured at 37 °C, 5% (v/v) CO2 in Dulbecco’s Modified Eagle Medium (DMEM) with high glucose (4.5 g/L), supplemented with 10% (v/v) fetal bovine serum (FBS), 1% (w/v) l-glutamine, and 0.4% (w/v) antibiotics (50 U/mL penicillin, 50 mg/mL streptomycin). MCF-7 cells (Human breast adenocarcinoma cell) were cultured at 37 °C, 5% (v/v) CO2 in an RPMI1640 medium, supplemented with 10% (v/v) fetal bovine serum (FBS), 1% (w/v) L-glutamine, 1% sodium pyruvate, and 0.4% (w/v) antibiotics (50 U/mL penicillin, 50 mg/mL streptomycin).

3.8. Cytotoxic Assessment

The cytotoxic properties of compounds 3538 were evaluated against the three cancer cell lines including the HL-60, HT-29, and MCF-7 cell lines [34]. Cell proliferation was evaluated in the cell lines by the MTT assay, in triplicates. In brief, the cells were placed in a 96-well microtiter plate at a density of 1 × 10⁴ cells per well, in a final volume of 100 μL of culture medium. These cells were treated for 24 h with isolated compounds, using 10 µL MTT (5.0 mg/mL) at 37 °C with 5% CO2. After treatment, the cells were immediately incubated for 4 h at 37 °C. The cells were lysed in 100 μL of lysis buffer (isopropanol, conc. HCl and Triton X-100) for 10 min at room temperature and 300 rpm/min. The enzymatic reduction of MTT to formazan crystals that dissolved in DMSO was quantified by a Varioskan LUX multimode reader (Bio Tek, Tokyo, Japan) at 570 nm. Dose-response curves were generated and the IC50 values were defined as the concentration of compound required to inhibit cell proliferation by 50%. Doxirubicin was used as a positive control.
Data were expressed as mean ± S.E.M (n = 3). One-way analysis of variance (ANOVA) followed by Dunnett’s test was applied. Graph Pad Prism 5 was used for statistical calculations (Graph pad Software, San Diego, California, USA). Results were regarded as significant at p ˂ 0.05.

3.9. Pharmacophore Model Generation

ChemBioDraw Ultra 12.0 (CambridgeSoft, 100 Cambridge Park Drive, Cambridge, MA 02140) was used to sketch the 2D chemical structures of compounds 3538, saved in the MDL-molfile format and were subsequently imported into the Discovery Studio 2.5 to be converted into corresponding 3D structures [29,30]. The HipHop module of the Discovery Studio 2.5 software was applied to construct plausible binding hypotheses for compounds 3538. HipHop identifies 3D spatial arrangements of chemical features that are common to active molecules. HipHop was instructed to explore five to six-featured pharmacophoric spaces of the following possible features; hydrogen bond donor (HBD), hydrogen bond acceptor (HBA), hydrophobic (Hbic), and ring aromatic (Ring Arom). The number of features was allowed to vary from 1–2 for HBD, 1–3 for HBA, 0–3 for Hbic, and 0–3 for Ring Arom. HipHop uses inactive compounds to create excluded volumes that resemble the sterically inaccessible regions of the binding pocket. HipHop was configured to allow a maximum of 20 exclusion spheres to be added to the generated pharmacophoric hypotheses. The user defines the degree of molecules mapping completely or partially to the hypothesis, via the Principal and MaxOmitFeat parameters of the software. The conformational space of each compound was explored applying the ‘‘best conformer generation’’ option. The default values were applied for other parameters.

4. Conclusions

This study dealt with LC–HRESIMS metabolomic profiling of P. odorata different organs (bark, wood, young stems, flowers, and fruits) which derplicated different chemical metabolomic compounds belonging to different classes, including iridoids, flavones, phenyl ethanoids, and lignans. A phytochemical investigation of the P. odorata bark afforded one new tetrahydrofurofuran lignan, 4β-hydroxyasarinin 35, along with fourteen known compounds. Investigating the cytotoxic activities of compounds 3538 against the HL-60, HT-29, and MCF-7 cancer cell lines, using the MTT assay showed that only compound 35 had cytotoxic effects against HL-60 and the MCF-7 cell lines, with IC50 values of 2.7 and 4.2 mg/mL, respectively, using a concentration 10 µL MTT (5.0 mg/mL). The HipHop module of 4β-hydroxyasarinin showed two HBAs aligning with the phenoxy oxygen atoms of benzodioxole moieties, two Ring Arom features vectored on the two phenyl rings, one HBD feature aligning the central hydroxyl group, and thirteen exclusion spheres limiting the boundaries of the sterically inaccessible regions of the target’s active site.

Supplementary Materials

The following are available online at https://www.mdpi.com/2218-1989/9/10/223/s1, Figure S1. 1H NMR spectrum of compound 35 measured in CDCl3 at 400 MHz, Figure S2. DEPT-Q NMR spectrum of compound 35 measured in CDCl3 at 100 MHz, Figure S3. HSQC spectrum of compound 35 measured in CDCl3, Figure S4. HMBC spectrum of compound 35 measured in CDCl3, Figure S5. HRESIMS spectrum of compound 35.

Author Contributions

Conceptualization: A.H.E., R.M., H.M.H., A.I.O., M.E.R., M.A.K., U.R.A., and M.J.M.; Data Curating: A.H.E., R.M., H.M.H., and U.R.A.; Formal Analysis: A.H.E., R.M., H.M.H., M.E.R., and M.A.K.; Investigation: H.M.H., M.K., and U.R.A.; Methodology: H.M.H., U.R.A., and M.A.K.; Project administration: M.J.M. and U.R.A.; Resources: M.J.M. and U.R.A.; Software: H.M.H., M.E.R., M.A.K., and U.R.A.; Writing – original draft: A.H.E.; Writing—review and editing: A.H.E., R.M., H.M.H., A.I.O., M.E.R., M.A.K., M.K., M.J.M., and U.R.A.

Funding

This publication was funded by the German Research Foundation (DFG) and the University of Wuerzburg in the funding program Open Access Publishing. The author(s) received no specific funding for this work.

Acknowledgments

We thank Maria Lesch (University of Würzburg) for her help in the laboratory.

Conflicts of Interest

The authors declare that no conflicts of interest exists.

References

  1. Kim, K.H.; Moon, E.; Kim, S.Y.; Choi, S.U.; Lee, K.R. Lignan constituents of Tilia amurensis and their biological evaluation on antitumor and anti-inflammatory activities. Food Chem. Toxicol. 2012, 50, 3680–3686. [Google Scholar] [CrossRef] [PubMed]
  2. Olano, C.; Méndez, C.; Salas, J.A. Antitumor compounds from actinomycetes: From gene clusters to new derivatives by combinatorial biosynthesis. Nat. Prod. Rep. 2009, 26, 628–660. [Google Scholar] [CrossRef] [PubMed]
  3. Newman, D.J.; Cragg, G.M. Natural products as sources of new drugs over the last 25 years. J. Nat. Prod. 2007, 70, 461–477. [Google Scholar] [CrossRef] [PubMed]
  4. Lirio, S.B.; Macabeo, A.P.G.; Paragas, E.M.; Knorn, M.; Kohls, P.; Franzblau, S.G.; Wang, Y.; Aguinaldo, M.A.M. Antitubercular constituents from Premna odorata Blanco. J. Ethnopharmacol. 2014, 154, 471–474. [Google Scholar] [CrossRef]
  5. Elmaidomy, A.H.; Mohyeldin, M.M.; Ibrahim, M.M.; Hassan, H.M.; Amin, E.; Rateb, M.E.; Hetta, M.H.; El Sayed, K.A. Acylated iridoids and rhamnopyranoses from Premna odorata (lamiaceae) as novel mesenchymal epithelial transition factor receptor inhibitors for the control of breast cancer. Phytother. Res. 2017, 31, 1546–1556. [Google Scholar] [CrossRef]
  6. Elmaidomy, A.H.; Hassan, H.M.; Amin, E.; Mohamed, W.; Hetta, M.H. Premna odorata volatile oil as a new mycobacterium tuberculosis growth inhibitor for the control of tuberculosis disease. Eur. J. Med. Plants 2017, 21, 1–11. [Google Scholar] [CrossRef]
  7. Otsuka, H.; Kashima, N.; Hayashi, T.; Kubo, N.; Yamasaki, K.; Padolina, W.G. Premnaodorosides A, B and C, iridoid glucoside diesters of an acyclic monoterpenediol from leaves of Premna odorata. Phytochemistry 1992, 31, 3129–3133. [Google Scholar] [CrossRef]
  8. Otsuka, H.; Kubo, N.; Sasaki, Y.; Yamasaki, K.; Takeda, Y.; Seki, T. Iridoid diglycoside monoacyl esters from stems of Premna japonica. Phytochemistry 1991, 30, 1917–1920. [Google Scholar] [CrossRef]
  9. Otsuka, H.; Kubo, N.; Yamasaki, K.; Padolina, W.G. Premnosides A–D: Diacyl 6-O-α-l-rhamnopyranosylcatalpols from Premna odorata. Phytochemistry 1989, 28, 3063–3067. [Google Scholar] [CrossRef]
  10. Rambla, J.L.; Lopez, M.P.; Belles, J.M.; Granell, A. Metabolomic Profiling of Plant Tissues, in Plant Functional Genomics; Springer: New York, NY, USA, 2015; pp. 221–235. [Google Scholar]
  11. Clarke, C.J.; Haselden, J.N. Metabolic profiling as a tool for understanding mechanisms of toxicity. Toxicol. Pathol. 2008, 36, 140–147. [Google Scholar] [CrossRef] [PubMed]
  12. Allwood, J.W.; Goodacre, R. An introduction to liquid chromatography–mass spectrometry instrumentation applied in plant metabolomic analyses. Phytochem. Anal. 2010, 21, 33–47. [Google Scholar] [CrossRef] [PubMed]
  13. Xie, C.; Veitch, N.C.; Houghton, P.J.; Simmonds, M.S. Flavone C-Glycosides from Viola yedoensis M Akino. Chem. Pharm. Bull. 2003, 51, 1204–1207. [Google Scholar] [CrossRef] [PubMed]
  14. Liu, Q.H.; Jeong, J.E.; Choi, E.J.; Moon, Y.H.; Woo, E.R. A new furofuran lignan from Geranium thunbergii Sieb. et Zucc. Arch. Pharmacal. Res. 2006, 29, 1109. [Google Scholar] [CrossRef] [PubMed]
  15. Anjaneyulu, A.S.; Rao, K.J.; Rao, V.K.; Row, L.R.; Subrahmanyam, C.; Pelter, A.; Ward, R.S. The structures of lignans from Gmelina arborea Linn. Tetrahedron 1975, 31, 1277–1285. [Google Scholar] [CrossRef]
  16. Desta, Z.Y.; Sewald, N.; Majinda, R.R. New flavonoids from the stem bark of Erythrina caffra Thunb. Nat. Prod. Res. 2014, 28, 667–673. [Google Scholar] [CrossRef]
  17. Markham, K.R.; Mues, R.; Stoll, M.; Zinsmeister, H.D. NMR spectra of flavone di-C-glycosides from Apometzgeria pubescens and the detection of rotational isomerism in 8-C-hexosylflavones. Z. Nat. C 1987, 42, 1039–1042. [Google Scholar] [CrossRef]
  18. Yadav, D.; Masood, N.; Luqman, S.; Brindha, P.; Gupta, M.M. Antioxidant furofuran lignans from Premna integrifolia. Ind. Crops Prod. 2013, 41, 397–402. [Google Scholar] [CrossRef]
  19. Ju, Y.; Still, C.C.; Sacalis, J.N.; Li, J.; Ho, C.T. Cytotoxic coumarins and lignans from extracts of the northern prickly ash (Zanthoxylum americanum). Phytotherp. Res. 2001, 15, 441–443. [Google Scholar] [CrossRef]
  20. Abe, F.; Yamauchi, T. 9α-Hydroxypinoresinol, 9α-hydroxymedioresinol and related lignans from Allamanda neriifolia. Phytochemistry 1988, 27, 575–577. [Google Scholar] [CrossRef]
  21. Casabuono, A.C.; Pomillo, A.B. Lignans and a stilbene from Festuca argentina. Phytochemistry 1994, 35, 479–483. [Google Scholar] [CrossRef]
  22. Benabdelaziz, I.; Haba, H.; Lavaud, C.; Harakat, D.; Benkhaled, M. Lignans and Other Constituents from Helianthemum sessiliflorum Pers. Rec. Nat. Prod. 2015, 9, 342. [Google Scholar]
  23. Li, N.; Lee, H.S.; Zhang, N.; Sun, Y.N.; Li, J.L.; Xing, S.S.; Chen, J.G.; Cui, L. Two new diphenyl ethers from Acanthopanax senticosus (Rupr. & Maxim.) Harms with PTP1B inhibitory activity. Phytochem. Lett. 2015, 13, 286–289. [Google Scholar]
  24. Zhang, X.; Guo, P.; Sun, G.; Chen, S.; Yang, M.; Fu, N.; Wu, H.; Xu, X. Phenolic compounds and flavonoids from the fruits of Pandanus tectorius Soland. J. Med. Plants Res. 2012, 6, 2622–2626. [Google Scholar]
  25. Elmasry, S.; Hammoda, H.M.; Radwan, M.M.; Ross, S.A.; Zaatout, H.H. C-flavonoidal glycosides from Erythrina caffra flowers. Nat. Prod. Sci. 2010, 16, 217–222. [Google Scholar]
  26. Sok, D.E.; Cui, H.S.; Kim, M.R. Isolation and boactivities of furfuran type lignan compounds from edible plants. Recent Pat. Food Nutr. Agric. 2009, 1, 87–95. [Google Scholar] [CrossRef]
  27. Ren, Y.; Yuan, C.; Deng, Y.; Kanagasabai, R.; Ninh, T.N.; Tu, V.T.; Chai, H.B.; Soejarto, D.D.; Fuchs, J.R.; Yalowich, J.C. Cytotoxic and natural killer cell stimulatory constituents of Phyllanthus songboiensis. Phytochemistry 2015, 111, 132–140. [Google Scholar] [CrossRef]
  28. Lee, J.S.; Kim, J.; Yu, Y.; Kim, Y.C. Inhibition of phospholipase Cγ1 and cancer cell proliferation by lignans and flavans from Machilus thunbergii. Arch. Pharmacal. Res. 2004, 27, 1043–1047. [Google Scholar] [CrossRef]
  29. Khanfar, M.A.; AbuKhader, M.M.; Alqtaishat, S.; Taha, M.O. Pharmacophore modeling, homology modeling, and in silico screening reveal mammalian target of rapamycin inhibitory activities for sotalol, glyburide, metipranolol, sulfamethizole, glipizide, and pioglitazone. J. Mol. Graph. Model 2013, 42, 39–49. [Google Scholar] [CrossRef]
  30. Khanfar, M.A.; Taha, M.O. Elaborate ligand-based modeling coupled with multiple linear regression and k nearest neighbor QSAR analyses unveiled new nanomolar mTOR inhibitors. J. Chem. Inf. Model 2013, 53, 2587–2612. [Google Scholar] [CrossRef]
  31. Stahl, E. Thin Layer Chromatography, 2nd ed.; Springer Verlage: Berlin/Heidelberg, Germany; New York, NY, USA, 1970; p. 810. [Google Scholar]
  32. Markham, K.R. Techniques of Flavonoids Identification; Academic Press: London, UK, 1982. [Google Scholar]
  33. Abdelmohsen, U.R.; Cheng, C.; Viegelmann, C.; Zhang, T.; Grkovic, T.; Ahmed, S.; Quinn, R.J.; Hentschel, U.; Edrada-Ebel, R. Dereplication strategies for targeted isolation of new antitrypanosomal actinosporins A and B from a marine sponge associated-Actinokineospora sp. EG49. Mar. Drugs 2014, 12, 1220–1244. [Google Scholar] [CrossRef]
  34. Mojarrab, M.; Lagzian, M.S.; Emami, S.A.; Asili, J.; Tayarani-Najaran, Z. In vitro anti-proliferative and apoptotic activity of different fractions of Artemisia armeniaca. Rev. Bras. Farmacogn. 2013, 23, 783–788. [Google Scholar] [CrossRef]
Figure 1. Dereplicated metabolites from the LC–HRESIMS analysis of Premna odorata bark, wood, young stems, flowers, and fruit.
Metabolites 09 00223 g001
Figure 2. Structures of compounds isolated from the Premna odorata bark.
Metabolites 09 00223 g002
Figure 3. Selected HMBC ( Metabolites 09 00223 i001) and 1H–1H COSY ( Metabolites 09 00223 i002) correlations of compound 35.
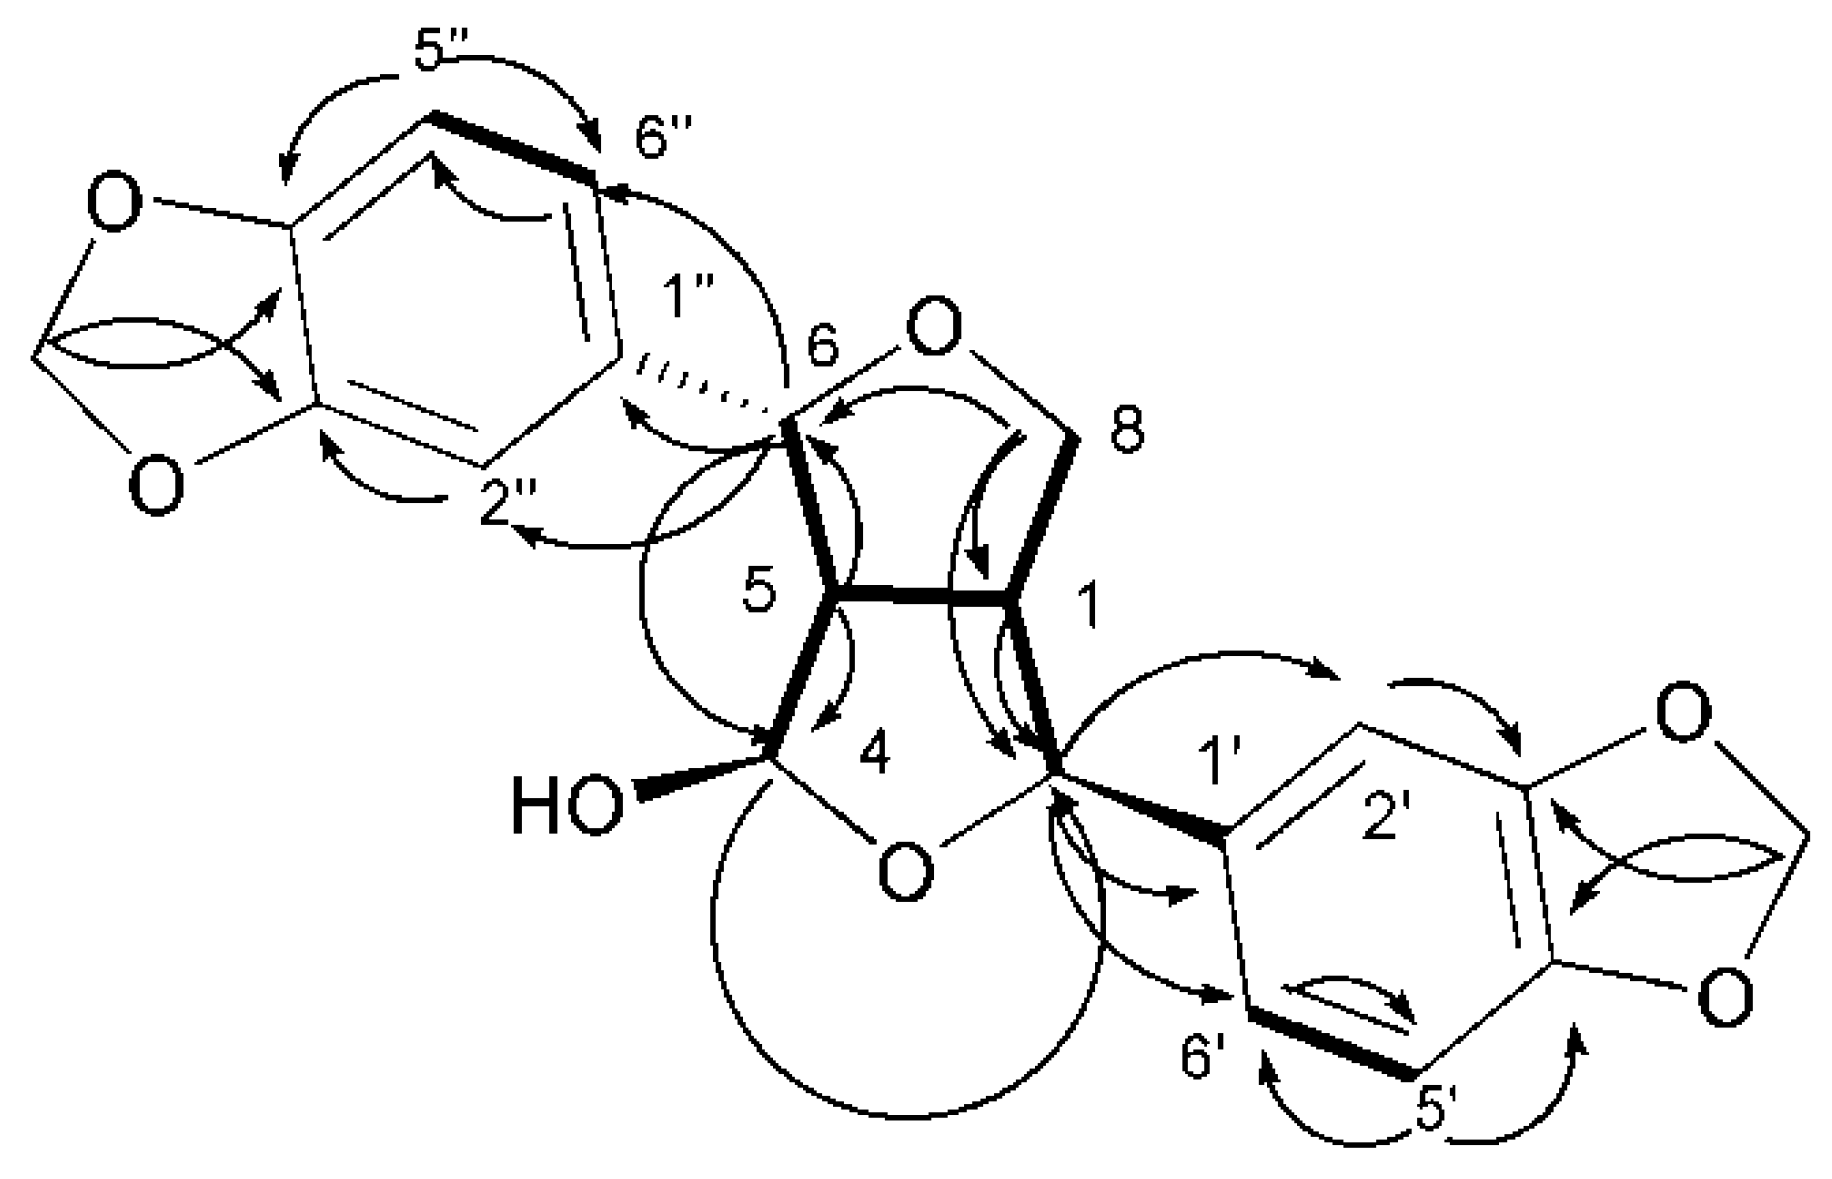
Metabolites 09 00223 g003
Figure 4. (A) The highest-ranked pharmacophore model generated for compounds 3538. Hydrogen bond acceptor (HBAs) are represented as green-vectored spheres, hydrogen bond donor (HBD) is represented as a purple-vectored sphere, Ring Arom features are represented as an orange-vectored sphere, and the exclusion volumes as gray spheres. (B) Structure of compound 35 and how it aligns the pharmacophore map. Exclusion spheres were hidden for clarity.
Metabolites 09 00223 g004
Table 1. The LC–HR–ESIMS dereplication results of the Premna odorata bark, wood, young stems, flowers, and fruits crude extracts.
No.Metabolites NameOriginal Source MFRT(min.)m/zB.W.Y.Fl.Fr.
1Luteolin-6,8-di-c-β-d-glucopyranosideViola yedoensisC27H30O167.54611.1915++
29-hydroxy-3’,4’-dimethoxy-3,4-methylenedioxy-7,9’:7’,9-diepoxylignanGeranium thunbergiiC21H22O77.60387.1276++
34,8-dihydroxy sesaminGmelina arboreaC20H18O87.71387.1323++
4Vicenin-2 Erythrina caffraC27H30O158.25595.2334++
5luteolin 6-c-β-d-glucopyranoside, 8-c-α-l-arabinopyranosideApometzgeria pubescensC26H28O158.65581.1560++
6Luteolin-6,8-di-c-α-l-arabinopyranosideApometzgeria pubescensC25H26O148.89551.1592++
7Schaftoside-2 Apometzgeria pubescensC26H28O149.11565.2288++
8VitexinPremna odorataC21H20O109.71433.1361+++++
9Premnoside APremna odorataC39H44O2011.37833.2746 ++
10Apigenin-6,8-di-c-α-l-arabinopyranosideApometzgeria pubescensC25H26O1311.81535.2889++
116- o-α- l-(2″-o-trans-caffoyl) rhamnopyranosylcatalpolPremna odorataC30H38O1711.98671.1910 ++
126- o-α- l-(3″-o-trans-caffoyl) rhamnopyranosylcatalpolPremna odorataC30H38O1712.03671.1910 ++
13Premnadimer APremna integrifoliaC40H34O1512.22793.3148++
144β-hydroxyasarinin-1-o-β-d-glucopyranosidePremna integrifoliaC26H28O1312.53549.1555++
15Premnoside BPremna odorataC39H44O1912.61817.2282 ++
16Premnoside FPremna odorataC39H44O1813.00801.2404 +++
17Premnoside DPremna odorataC40H46O1913.09831.2411 ++
18AcacetinPremna odorataC16H12O513.60285.1126+++++
19Premnoside EPremna odorataC39H44O1813.72801.2404 +++
206- o-α- l-(4’’-o-trans-p-methoxycinnamoyl) rhamnopyranosylcatalpolPremna odorataC31H40O1614.10669.1634 ++
21VerbascosidePremna odorataC29H36O1514.47625.1396+++++
22Premnoside HPremna odorataC41H48O1814.54829.2011 +++
23Premnoside GPremna odorataC41H48O1814.73829.2011 +++
24DiosmetinPremna odorataC16H12O615.09301.2947+++++
25Premnaodoroside APremna odorataC42H66O2015.94891.3561 ++
26Premnaodoroside BPremna odorataC42H66O1916.06875.2437 ++
27Premnaodoroside CPremna odorataC42H64O1916.12873.3192 ++
28Premnoside CPremna odorataC40H46O2016.21847.2782 ++
29SesaminZanthoxylum senegalenseC20H18O618.21355.1937++
30LuteolinPremna odorataC15H10O618.66309.2349+++++
319-hydroxypinoresinolAllamanda neriifoliaC20H22O719.07379.2381++
32PinoresinolFestuca argentinaC20H22O620.61359.4261++
33ApigeninPremna odorataC15H10O520.82293.2147+++++
341,5α-dihydroxypinoresinol Helianthemum sessiliflorumC20H22O822.25391.2497++
MF: molecular formula, RT: retention time, min: minute, B: bark, W: wood, Y: young stems, Fl: flowers, Fr: fruits.
Table 2. DEPT-Q (400 MHz) and 1H (100 MHz) NMR data of compound 35 in CDCL3; Carbon multiplicities were determined by the DEPT-Q experiments.
PositionδCδH (J in Hz)
153.2,CH3.91 (dddd, 6.1, 7.1, 7.3, 11.1)
283.3,CH4.84 (d,7.1)
3
4101.7,CH5.57 (s)
562.1,CH2.93 (dd, 7.3, 7.5)
688.1,CH4.96 (d, 10.1)
7
872.2,CH24.01 (dd, 9.1, 11.1), 4.22 (dd,9.1, 6.1)
1’135.4,C
2’107.1,CH7.06 (d,2.1)
3’147.3,C
4’147.2,C
5’108.1,CH6.81 (d,8.0)
6’119.2,CH6.80 (dd,2.1,8.0)
OCH2101.45.41 (s)
1’’136.1,C
2’’106.3,CH6.86 (d,2.0)
3’’147.4,C
4’’147.3,C
5’’108.2,CH6.89 (d,8.1)
6’’120.0,CH6.78 (dd,2.0,8.1)
OCH2101.45.41 (s)
qC—quaternary, CH—methine, CH2—methylene, and CH3—methyl carbon.
Table 3. Cytotoxic properties for compounds 3538 isolated from Premna odorata bark.
CompoundIC50 (µg/mL) a
HL-60MCF-7HT-29
352.7 *4.2 *NA
36NANANA
37NANANA
38NANANA
Doxirubicin b0.080.68501
NA—not active a IC50 value of compounds against each cancer cell line, which was defined as the concentration (µg) that caused a 50% inhibition of cell growth in vitro. Data were expressed as mean ± S.E.M (n = 3). One-way analysis of variance (ANOVA) followed by Dunnett’s test was applied. Graph Pad Prism 5 was used for statistical calculations (Graph pad Software, San Diego, California, USA). * statistically significant at p < 0.05. b Doxirubicin a positive control.

