Microbiota and Metabolite Profiling of Spoiled Spanish-Style Green Table Olives

 , and
, and
Abstract
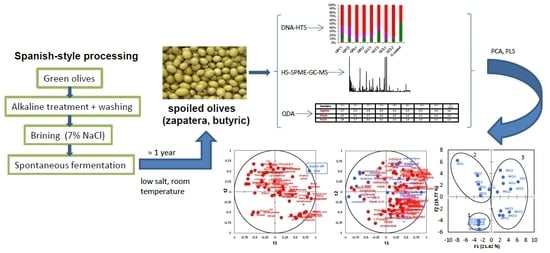
1. Introduction
2. Results and Discussion
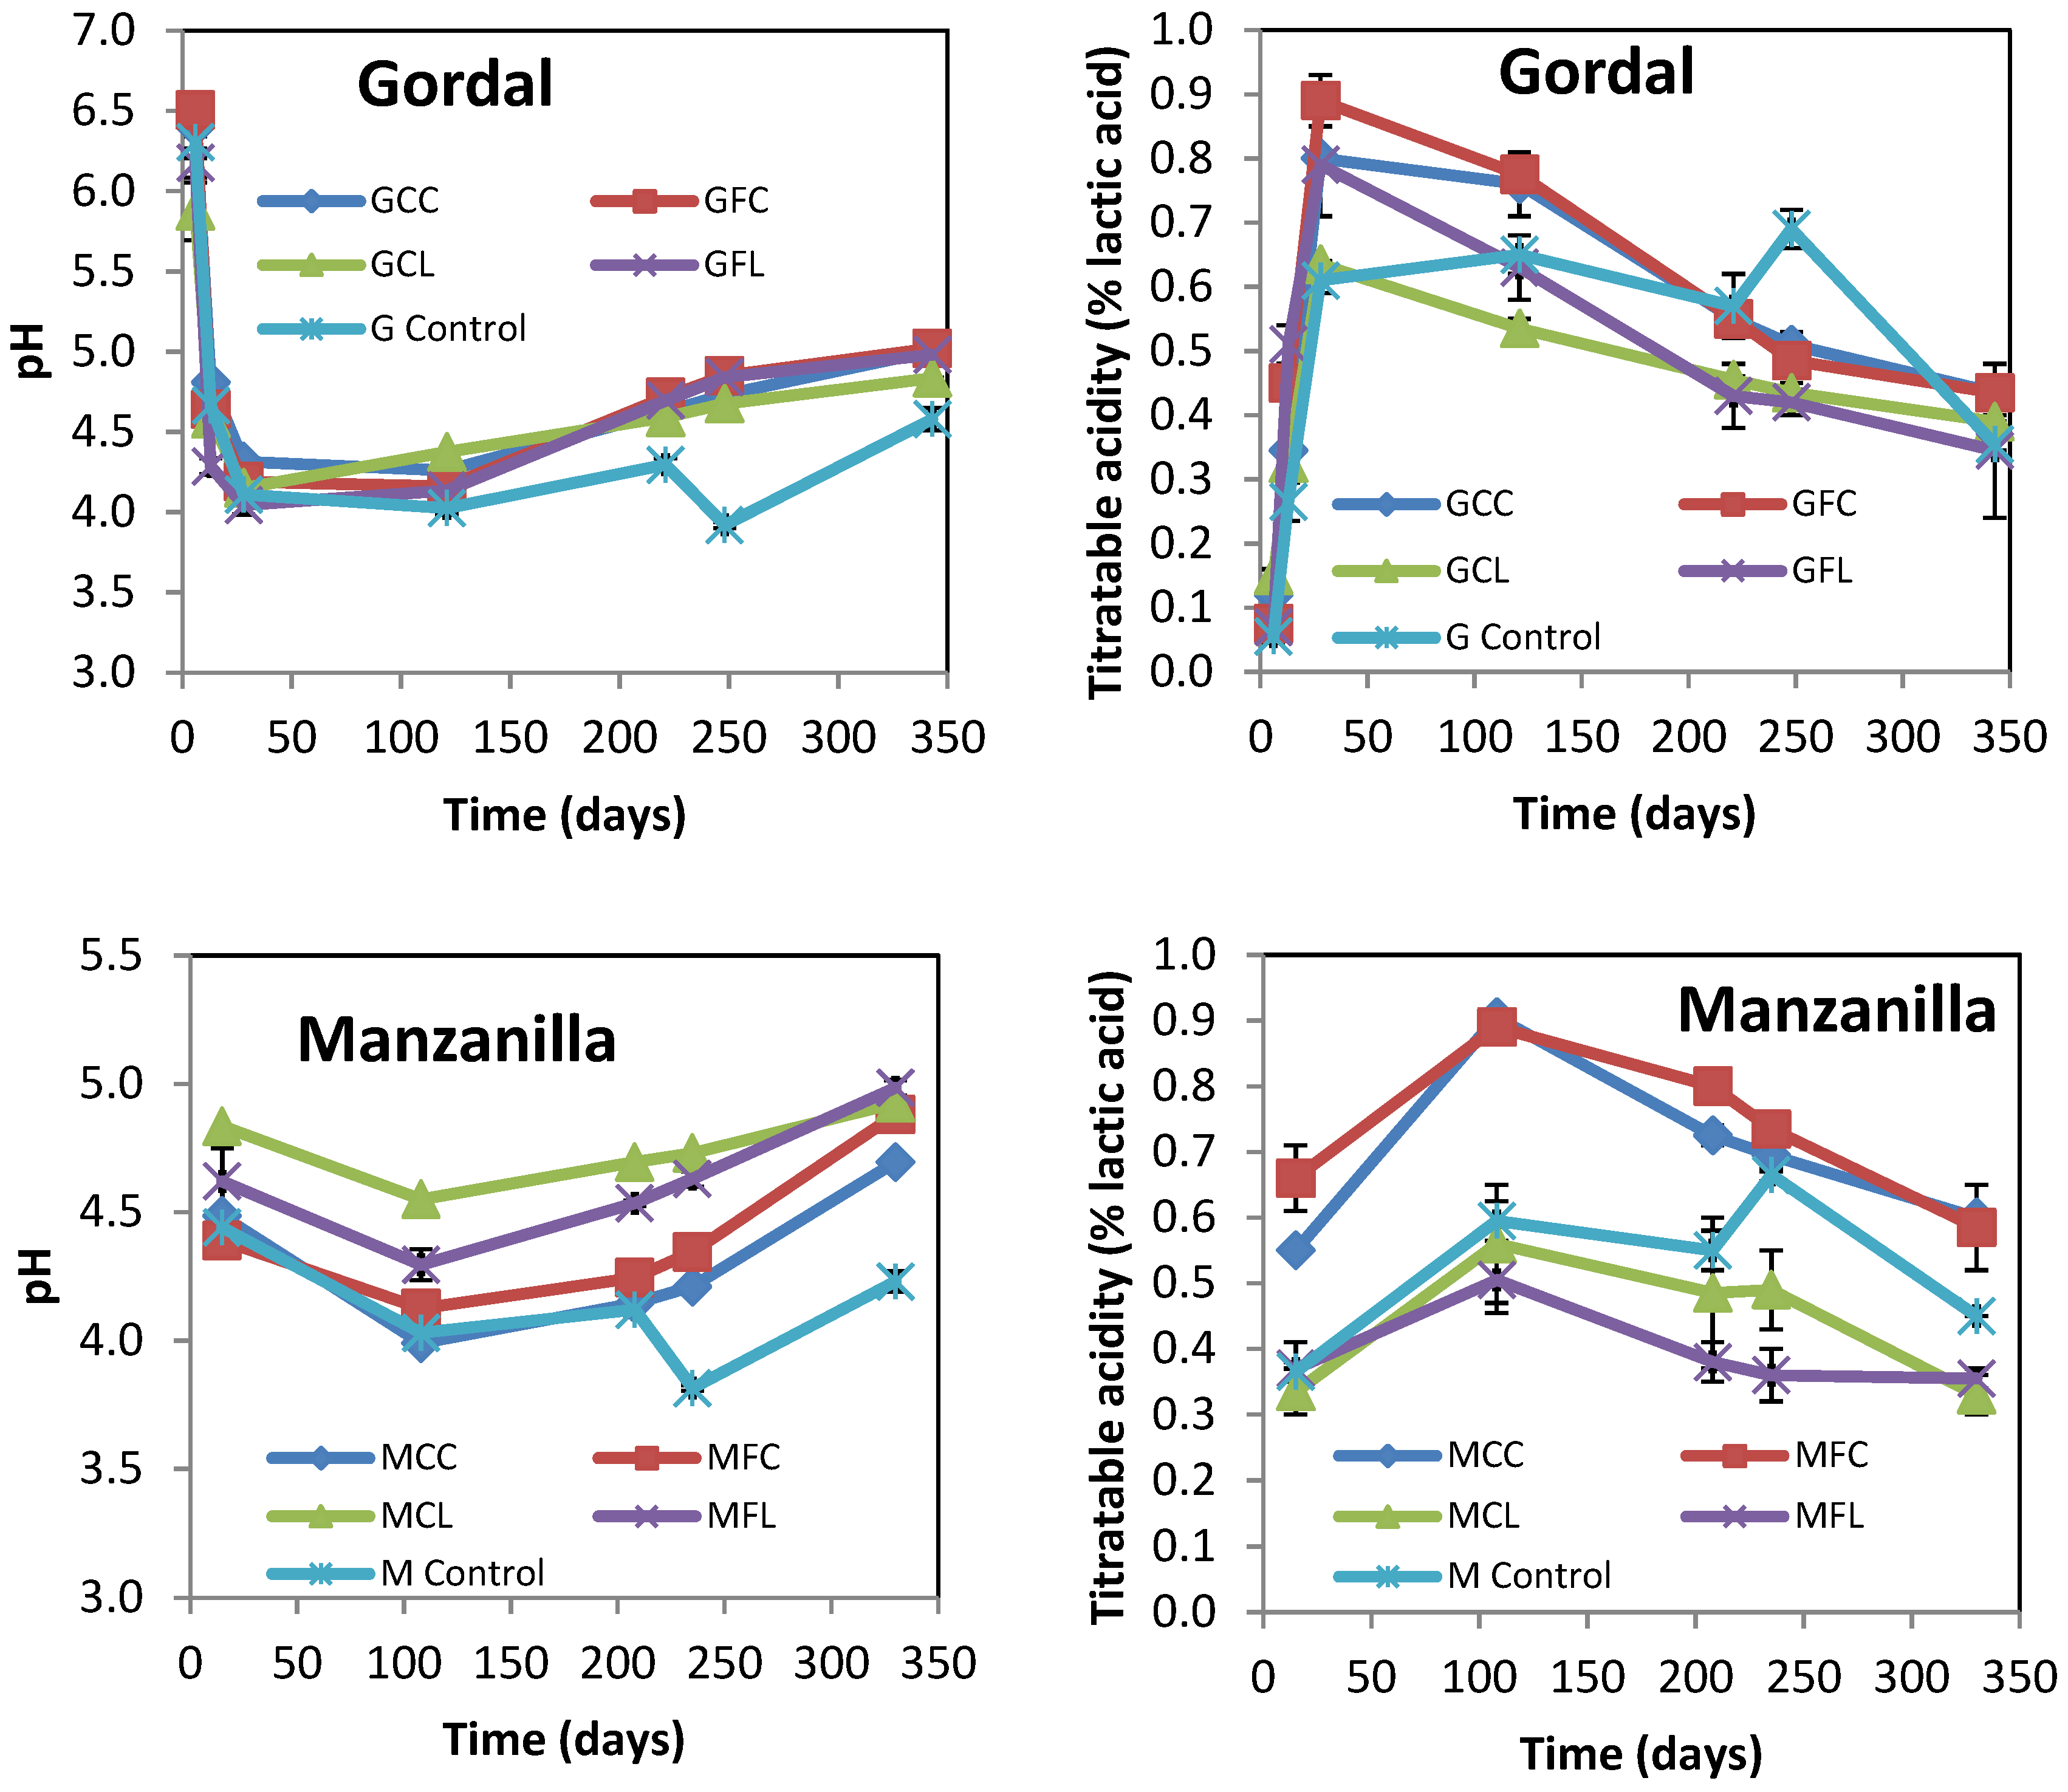
2.1. Physicochemical Characteristics of Brine Samples
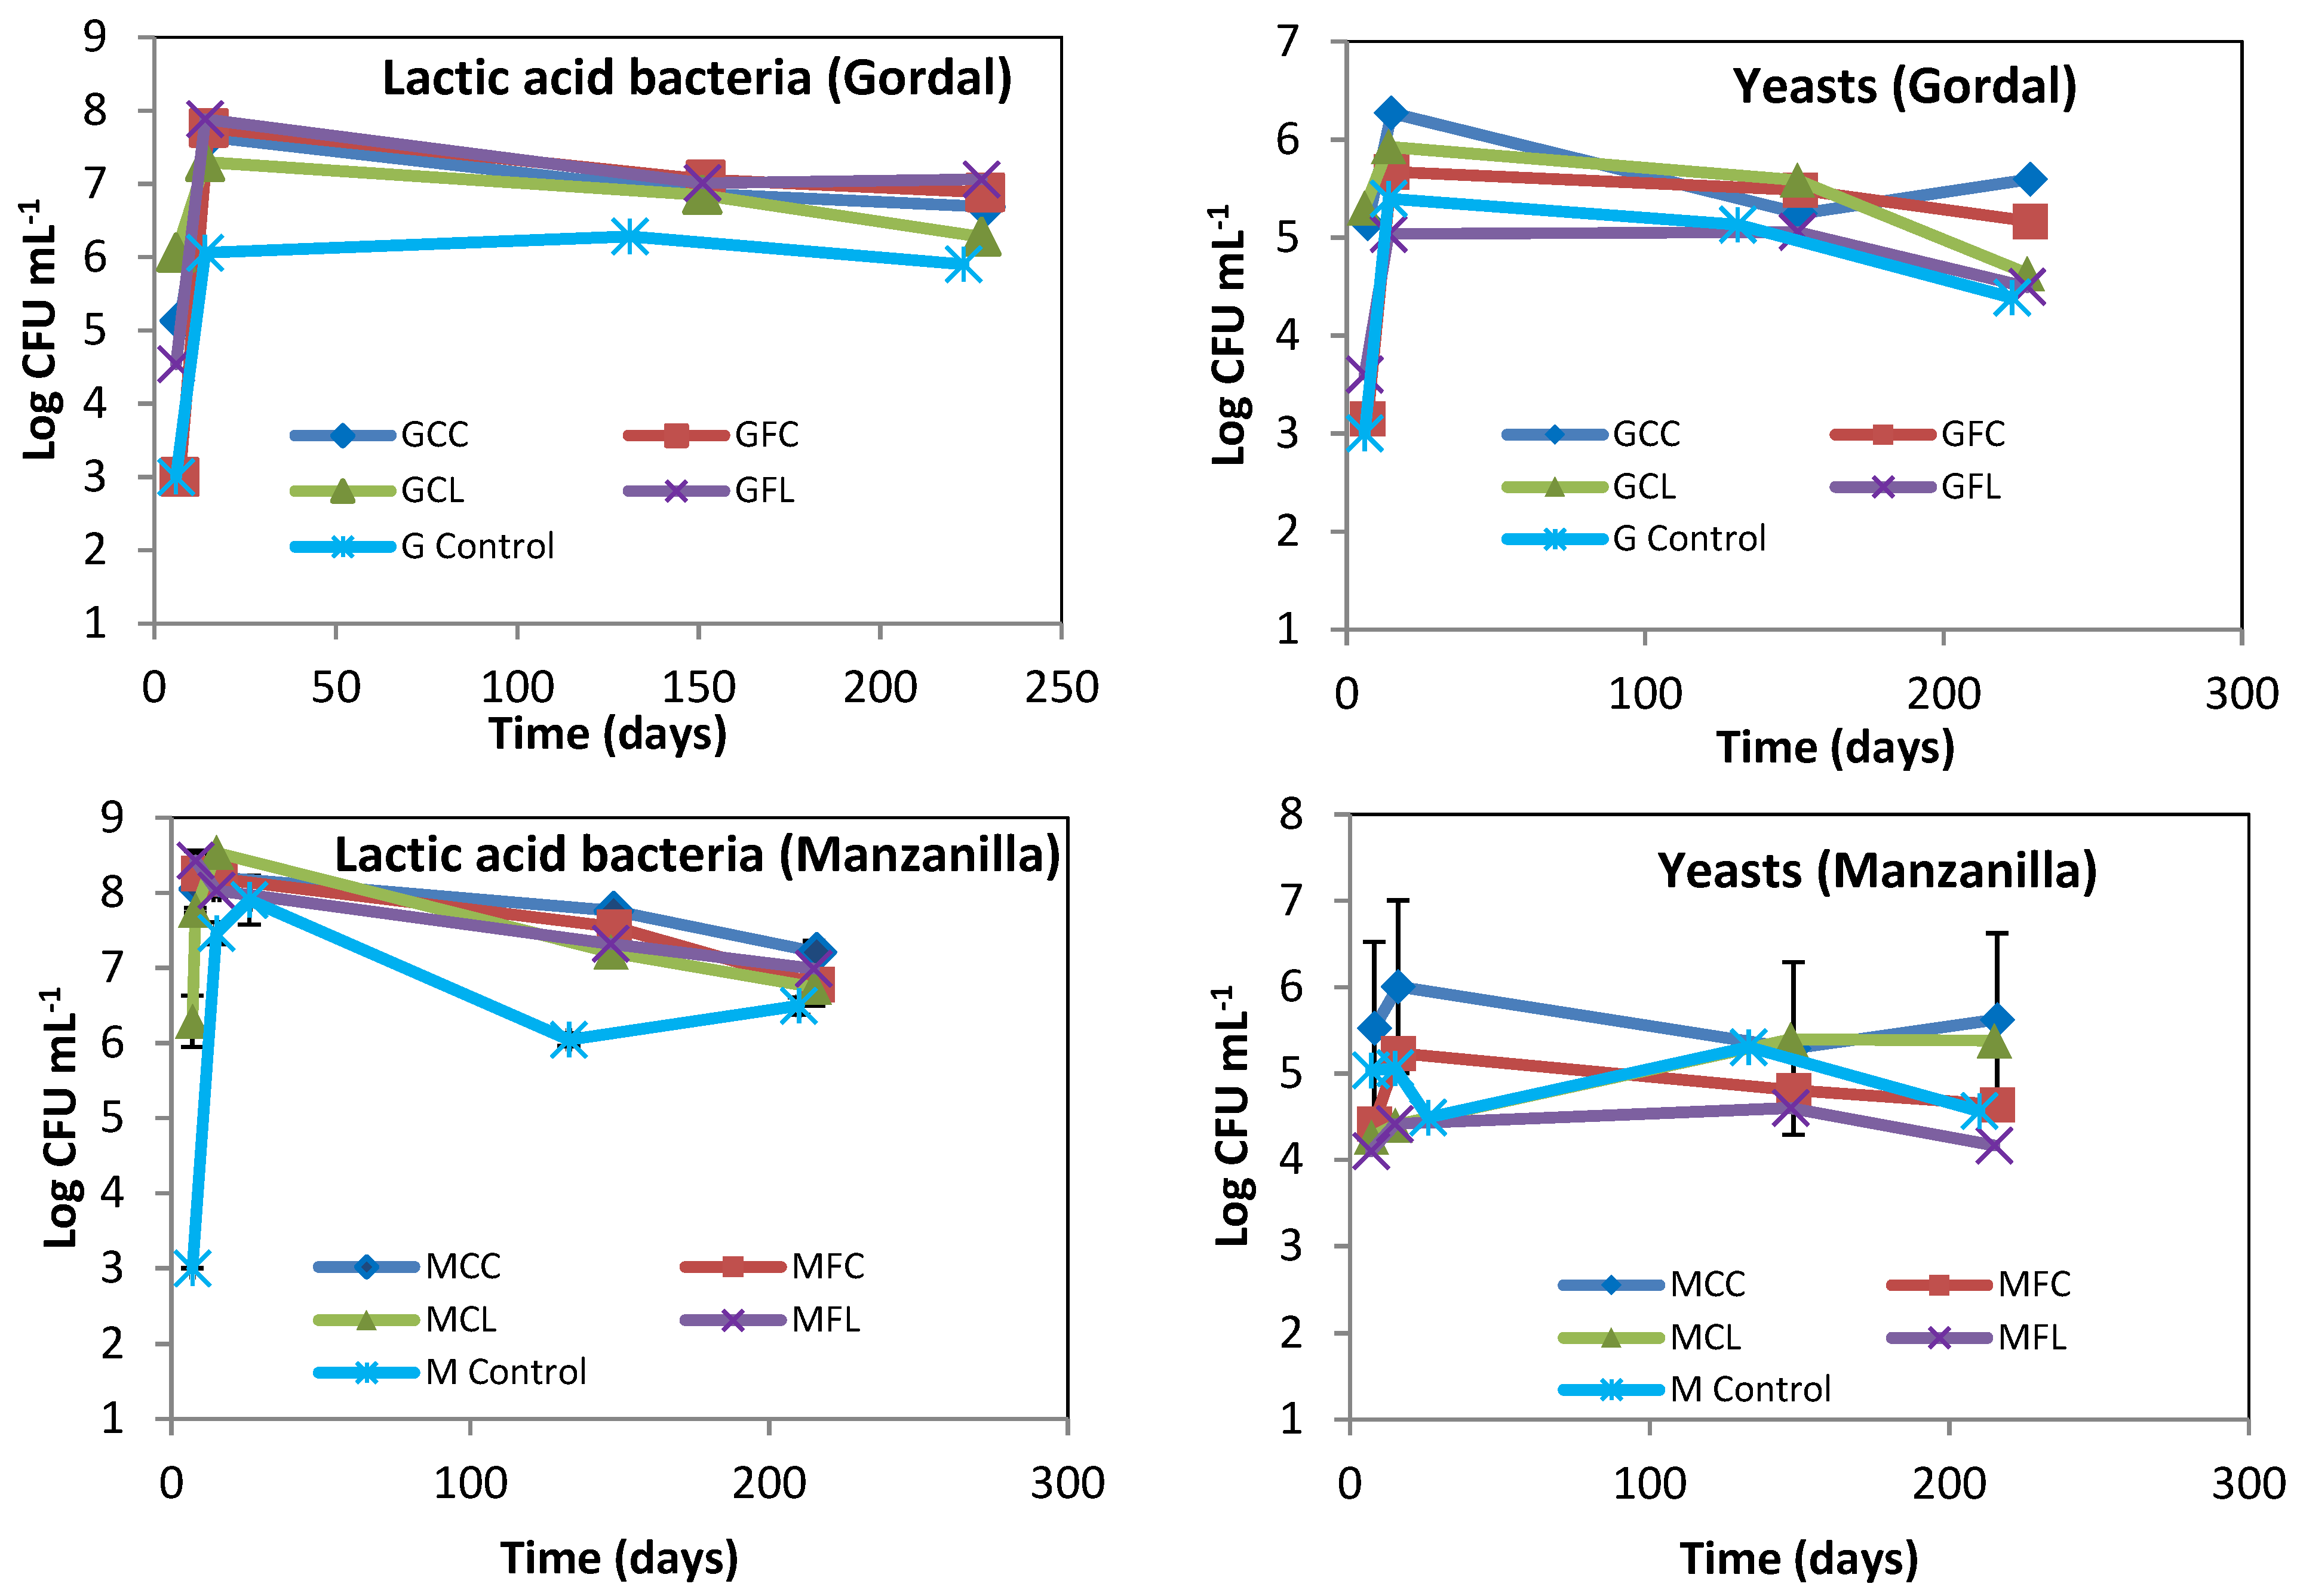
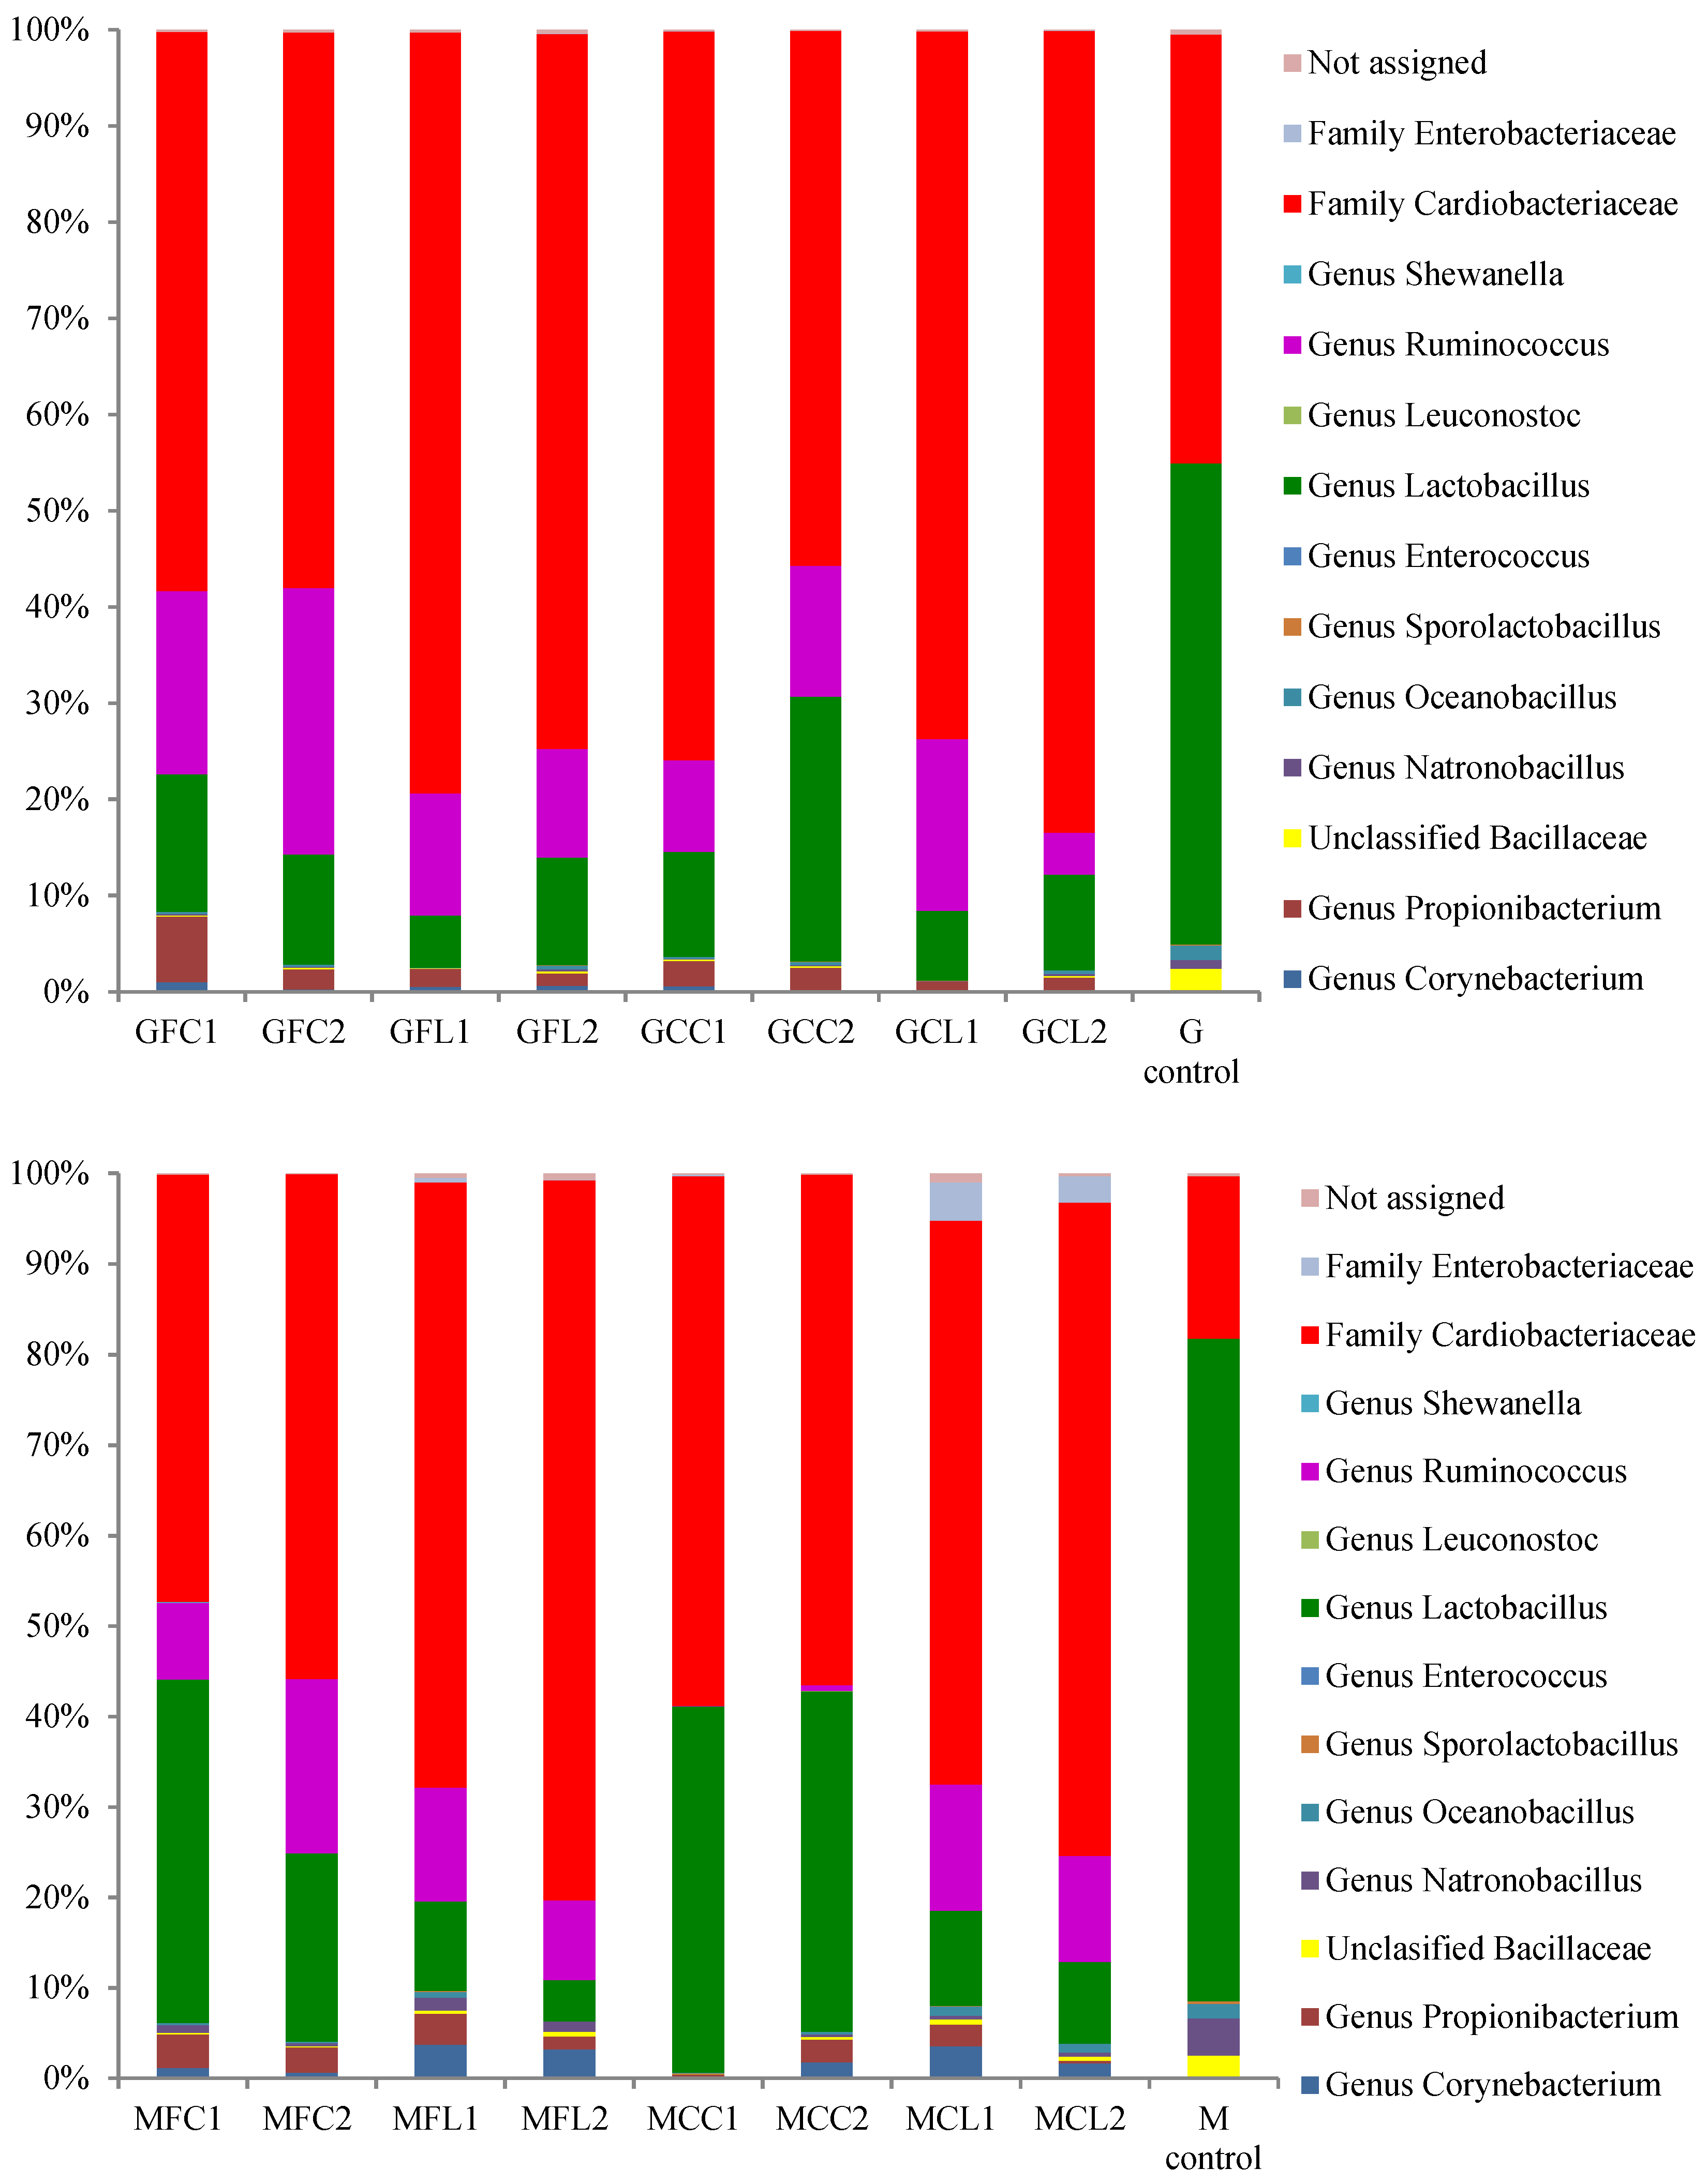
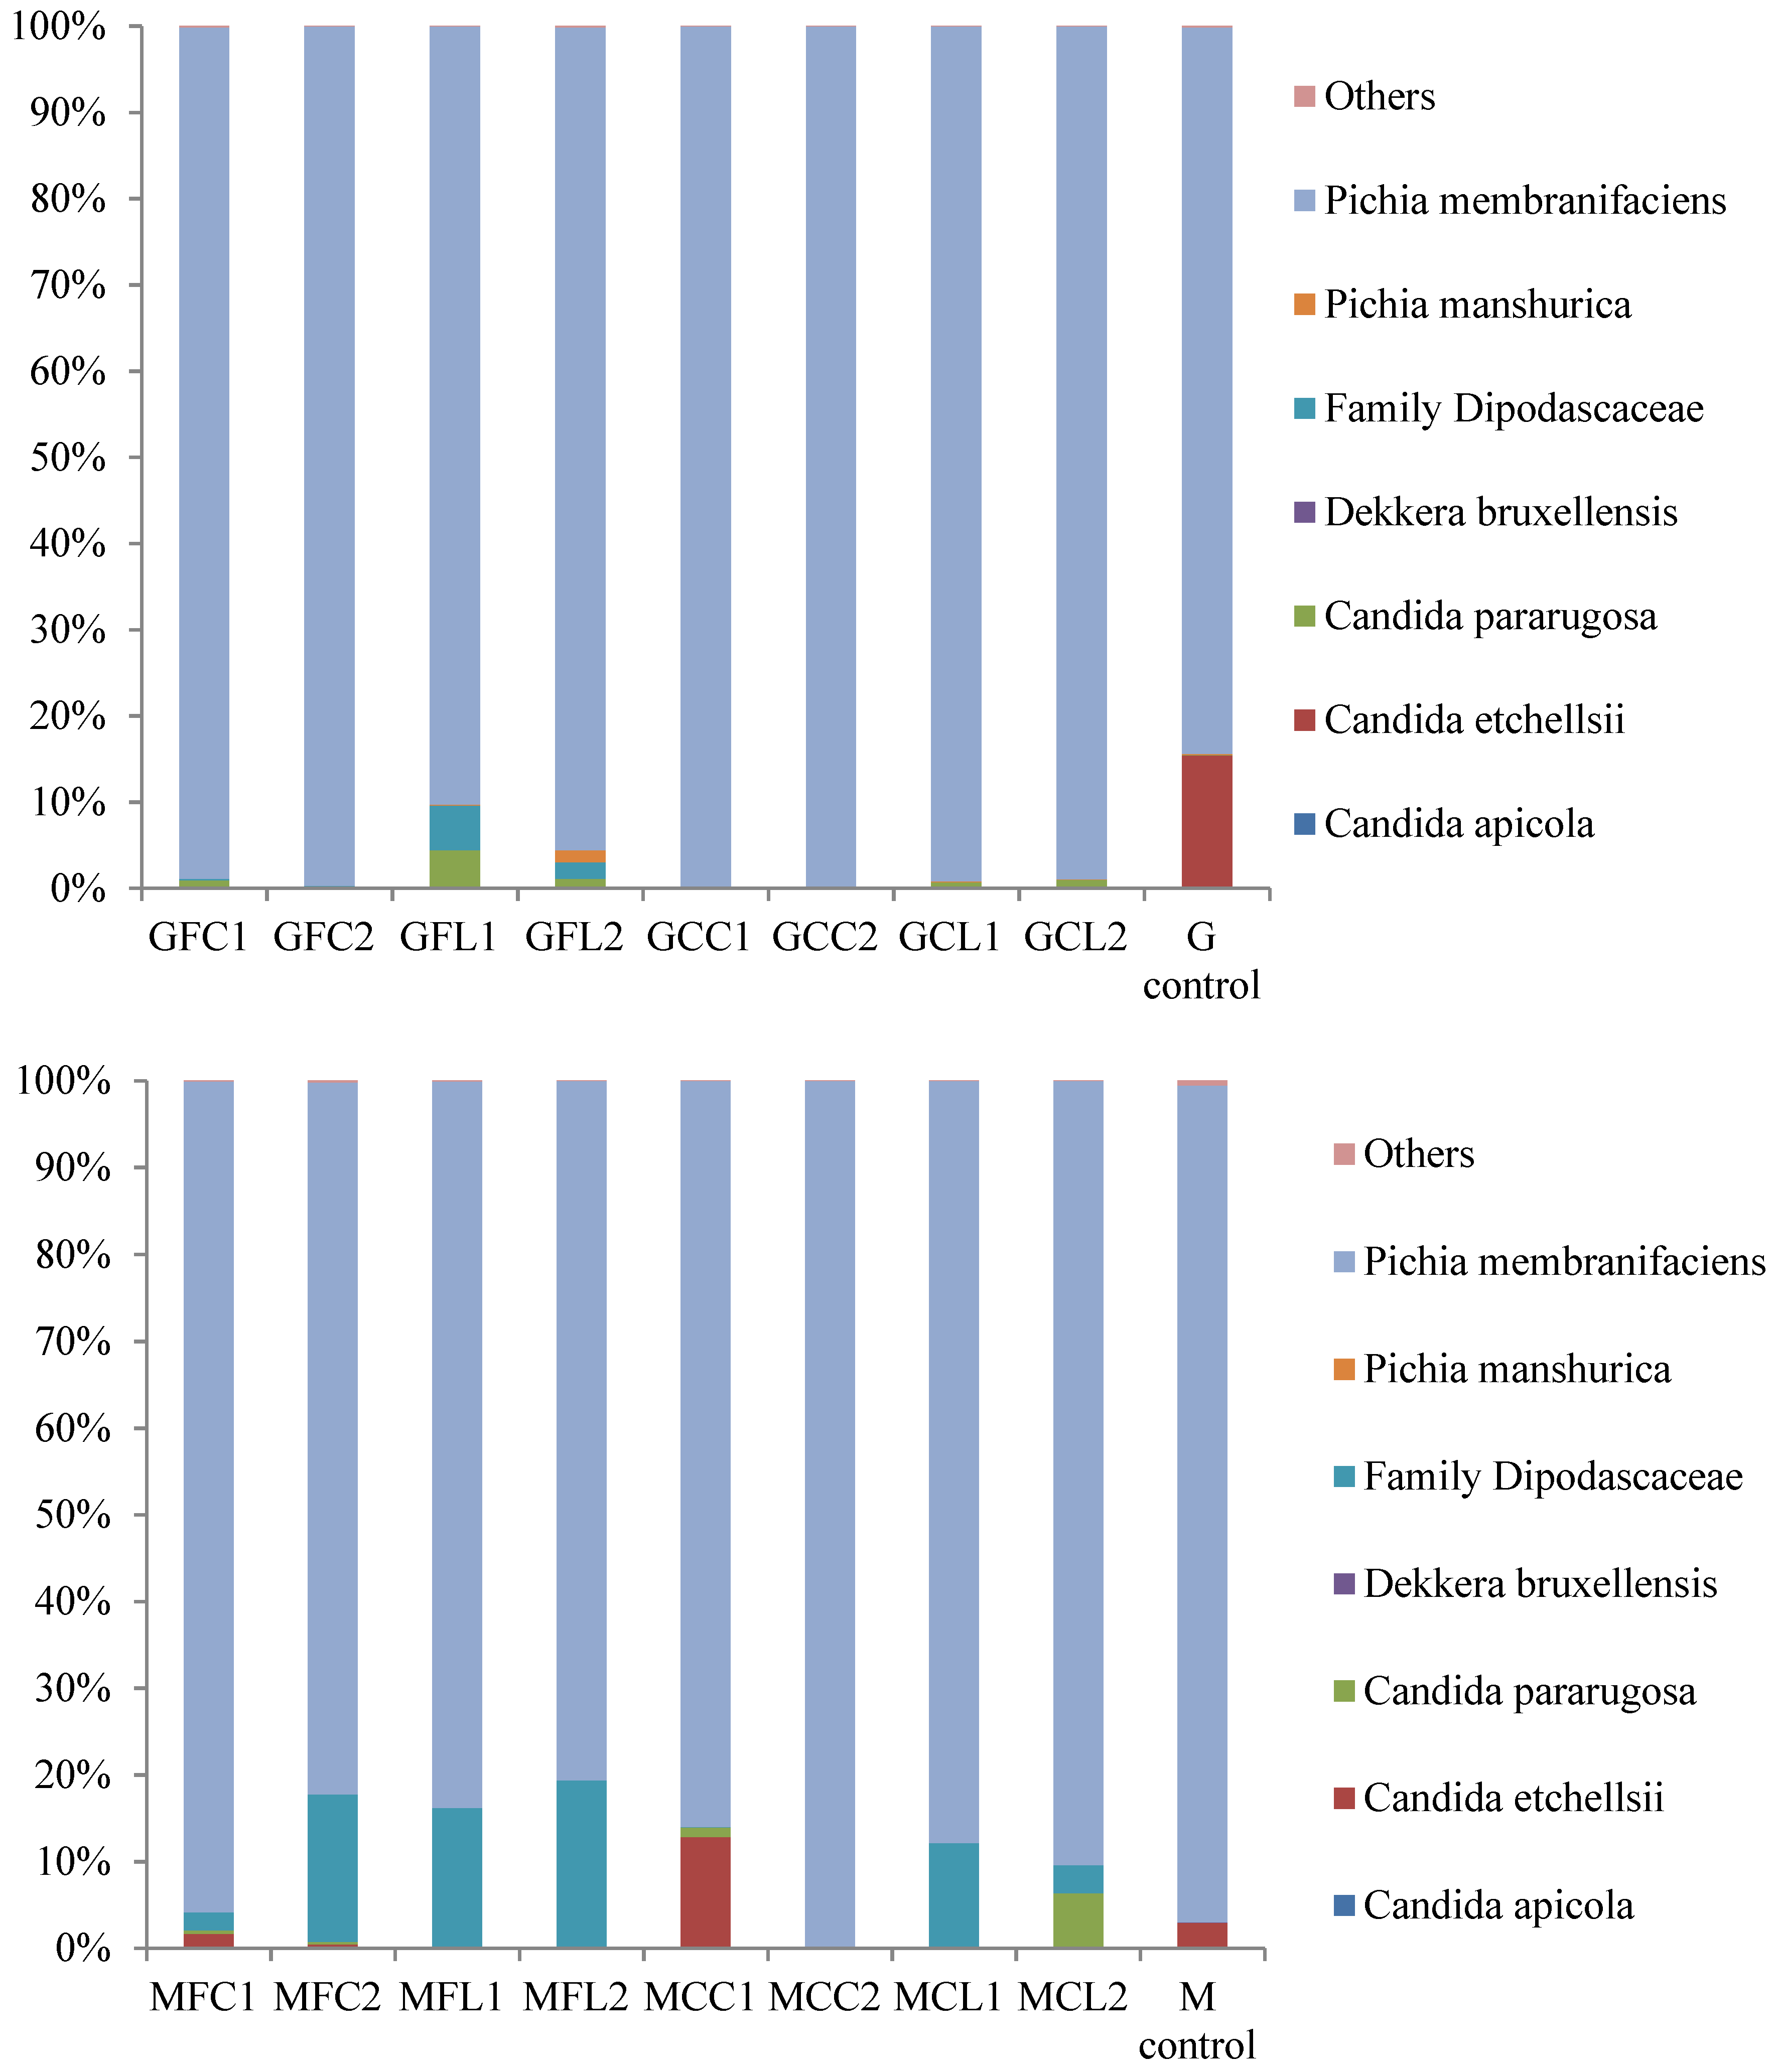
2.2. Microbiota in Brine Samples
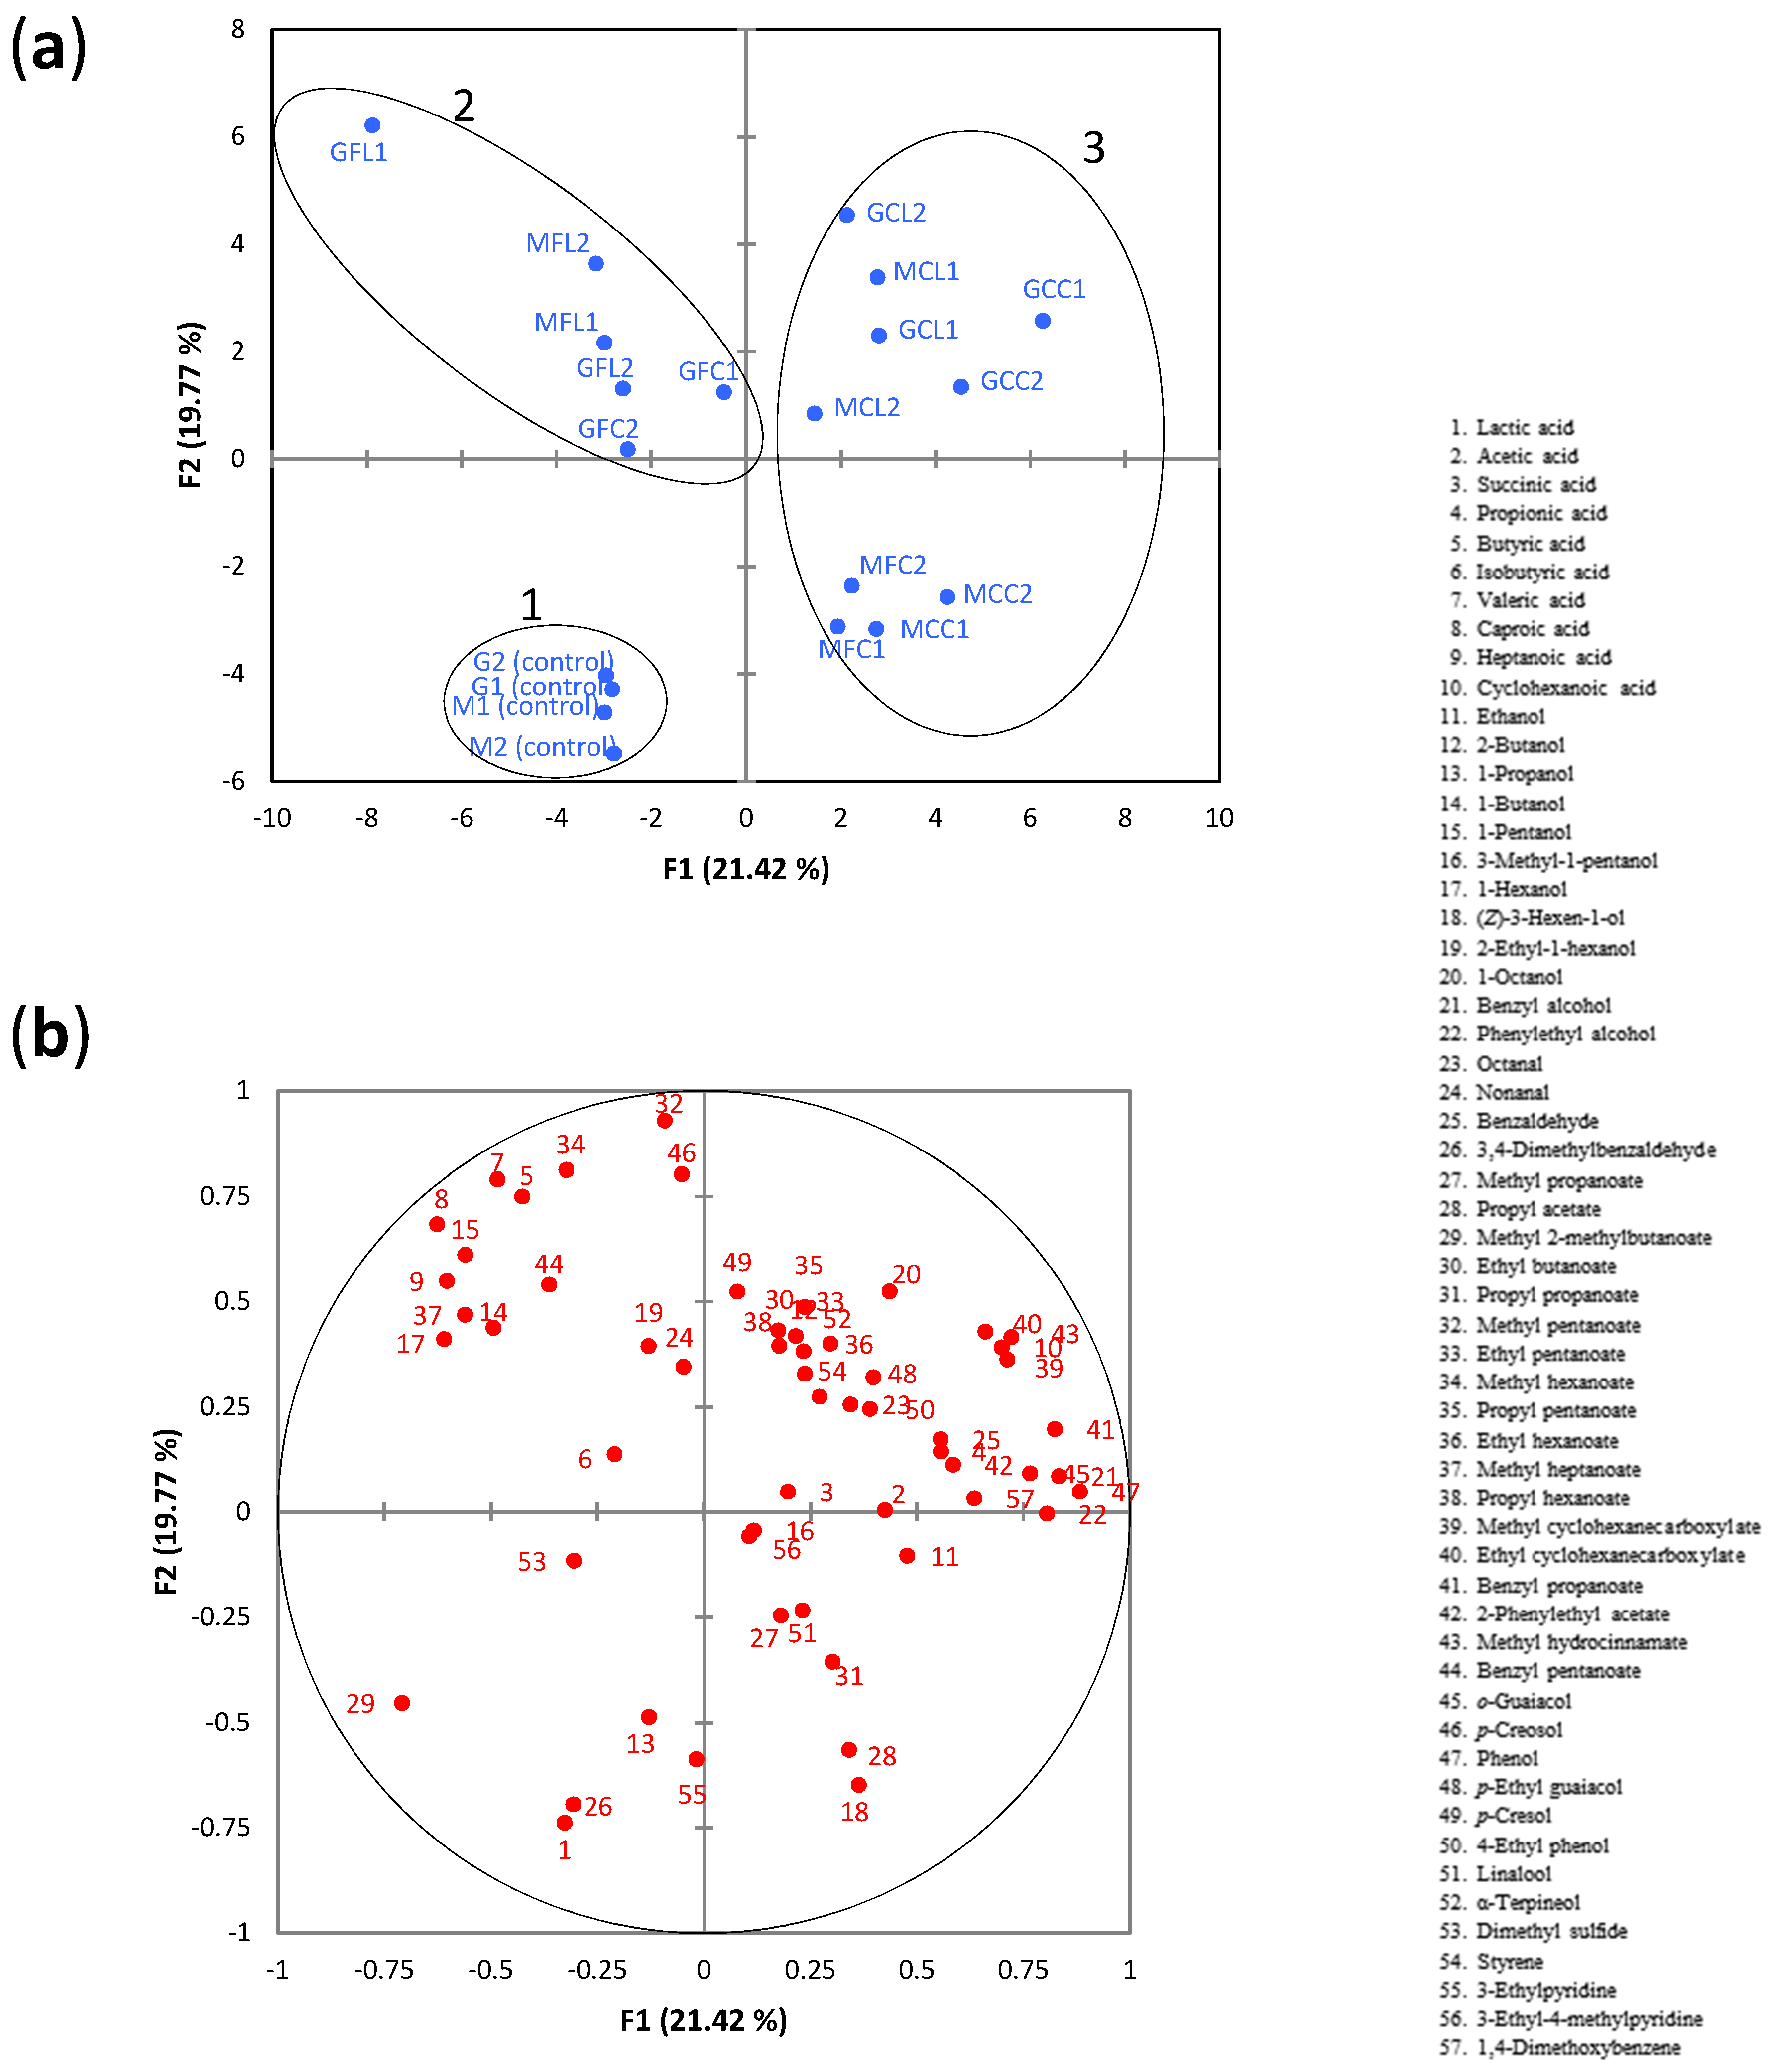
2.3. Metabolite Composition in Brine Samples
2.4. Evaluation of Sensory Data
2.5. Correlation between Microbial Communities and Sensory Spoilage Descriptors
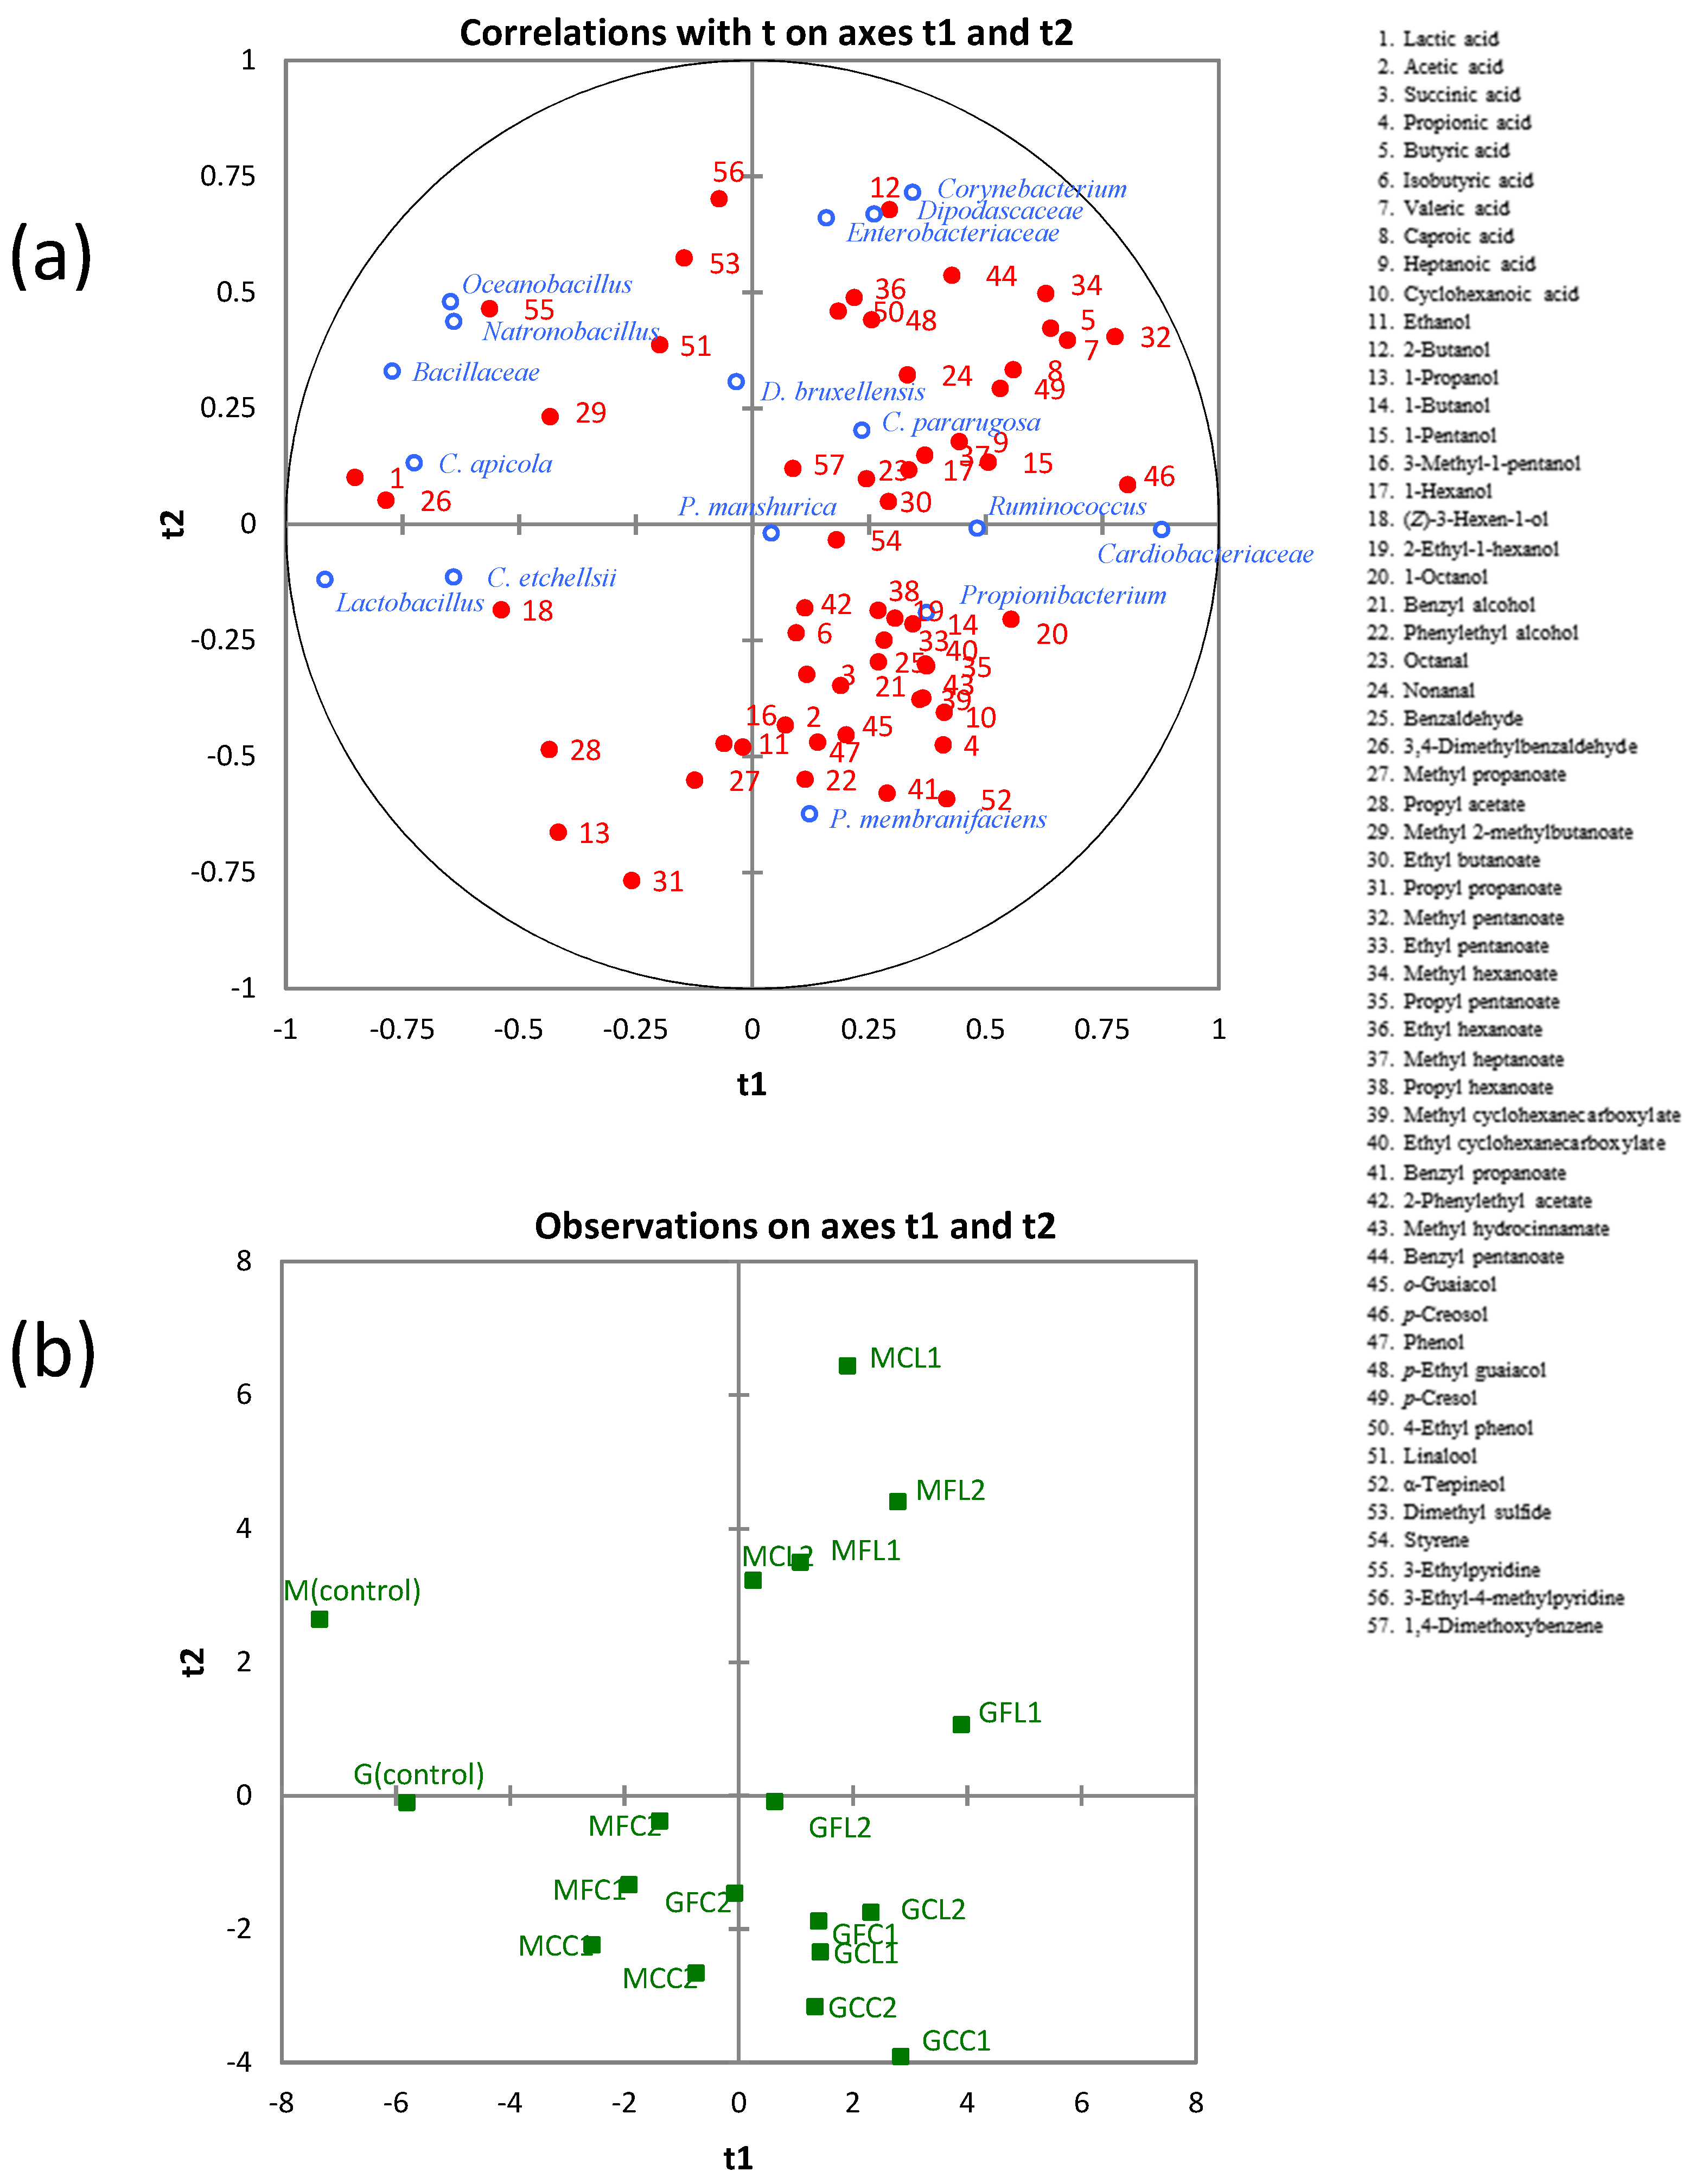
2.6. Correlation between Microbial Communities and Metabolites
3. Materials and Methods
3.1. Induction of Spoilage Fermentations
3.2. Chemical Analyses
3.3. Microbiological Analyses
3.4. Sensory Analysis
3.5. Statistical Analyses
4. Conclusions
Supplementary Materials
Author Contributions
Funding
Conflicts of Interest
References
- Association of Exporters and Industrialists of Table Olives (ASEMESA). Available online: http://www.asemesa.es (accessed on 1 October 2018).
- Heperkan, D. Microbiota of table olive fermentations and criteria of selection for their use as starters. Front. Microbiol. 2013, 4, 143. [Google Scholar] [CrossRef] [PubMed]
- Rejano, L.; Montaño, A.; Casado, F.J.; Sánchez, A.H.; de Castro, A. Table olives: Varieties and variations. In Olives and Olive Oil in Health and Disease Prevention; Preedy, V.R., Watson, R.R., Eds.; Elsevier: Amsterdam, The Netherlands, 2010; pp. 5–15. [Google Scholar]
- Garrido Fernández, A.; Fernández Díez, M.J.; Adams, M.R. Table Olives: Production and Processing; Chapman & Hall: London, UK, 1997. [Google Scholar]
- Montaño, A.; de Castro, A.; Rejano, L.; Sánchez, A.H. Analysis of zapatera olives by gas and high-performance liquid chromatography. J. Chromatogr. 1992, 594, 259–267. [Google Scholar] [CrossRef]
- IOC. Guidelines for Taster and Panel Leader Training in the Sensory Assessment of Table Olives and Panel Management According to Standard COI/OT/MO Doc. No 1—2011; International Olive Council: Madrid, Spain, 2011. [Google Scholar]
- Ercolini, D. High-throughput sequencing and metagenomics: Moving forward in the culture-independent analysis of food microbial ecology. Appl. Environ. Microbiol. 2013, 79, 3148–3155. [Google Scholar] [CrossRef] [PubMed]
- Golomb, B.L.; Morales, V.; Jung, A.; Yau, B.; Boundy-Mills, K.L.; Marco, M.L. Effects of pectinolytic yeast on the microbial composition and spoilage of olive fermentations. Food Microbiol. 2013, 33, 97–106. [Google Scholar] [CrossRef] [PubMed]
- Merkle, S.; Kleeberg, K.K.; Fritsche, J. Recent developments and applications of solid phase microextraction (SPME) in food and environmental analysis—A review. Chromatography 2015, 2, 293–381. [Google Scholar] [CrossRef]
- Cortés-Delgado, A.; Sánchez, A.H.; de Castro, A.; López-López, A.; Beato, V.M.; Montaño, A. Volatile profile of Spanish-style green table olives prepared from different cultivars grown at different locations. Food Res. Int. 2016, 83, 131–142. [Google Scholar] [CrossRef]
- Garrido-Fernández, A.; Montaño, A.; Sánchez-Gómez, A.H.; Cortés-Delgado, A.; López-López, A. Volatile profiles of green Spanish-style table olives: Application of compositional data analysis for the segregation of their cultivars and production areas. Talanta 2017, 169, 77–84. [Google Scholar] [CrossRef] [PubMed]
- Sánchez, A.H.; de Castro, A.; López-López, A.; Cortés-Delgado, A.; Beato, V.M.; Montaño, A. Retention of color and volatile compounds of Spanish-style green table olives pasteurized and stored in plastic containers under conditions of constant temperature. LWT-Food Sci. Technol. 2017, 75, 685–691. [Google Scholar] [CrossRef]
- López-López, A.; Sánchez, A.H.; Cortés-Delgado, A.; de Castro, A.; Montaño, A. Relating sensory analysis with SPME-GC-MS data for Spanish-style green table olive aroma profiling. LWT-Food Sci. Technol. 2018, 89, 725–734. [Google Scholar] [CrossRef]
- Sánchez, A.H.; López-López, A.; Cortés-Delgado, A.; Beato, V.M.; Medina, E.; de Castro, A.; Montaño, A. Effect of post-fermentation and packing stages on the volatile composition of Spanish-style green table olives. Food Chem. 2018, 239, 343–353. [Google Scholar] [CrossRef] [PubMed]
- de Castro, A.; Sánchez, A.H.; Cortés-Delgado, A.; López-López, A.; Montaño, A. Effect of Spanish-style processing steps and inoculation with Lactobacillus pentosus starter culture on the volatile composition of cv. Manzanilla green olives. Food Chem. 2019, 271, 543–549. [Google Scholar] [CrossRef] [PubMed]
- Moore, E.R.B.; Mihaylova, S.A.; Gomila, M. The Family Cardiobacteriaceae. In The Prokaryotes: Gammaproteobacteria; Rosenberg, E., DeLong, E.F., Lory, S., Stackebrandt, E., Thompson, F., Eds.; Springer: Berlin, Germany, 2014; pp. 135–146. [Google Scholar]
- Lima, N.; Rogers, T.; Acevedo-Whitehouse, K.; Brown, M.V. Temporal stability and species specificity in bacteria associated with the bottlenose dolphins respiratory system. Environ. Microbiol. Rep. 2012, 4, 89–96. [Google Scholar] [CrossRef] [PubMed]
- Godoy-Vitorino, F.; Rodriguez-Hilario, A.; Alves, A.L.; Gonçalves, F.; Cabrera-Colon, B.; Sousa-Mesquita, C.; Soares-Castro, P.; Ferreira, M.; Marçalo, A.; Vingada, J.; et al. The microbiome of a striped dolphin (Stenella coeruleoalba) stranded in Portugal. Res. Microbiol. 2017, 168, 85–93. [Google Scholar] [CrossRef] [PubMed]
- Yew, W.C.; Pearce, D.A.; Dunn, M.J.; Samah, A.A.; Convey, P. Bacterial community composition in Adélie (Pygoscelis adeliae) and Chinstrap (Pygoscelis antarctica) penguin stomach contents from Signy Island, South Orkney Islands. Polar Biol. 2017, 40, 2517–2530. [Google Scholar] [CrossRef]
- Lai, F.C.; Wang, Q.; Zhou, Y.P.; Mu, C.H.; Geng, S.N.; Zhang, Y.M.; Wang, Q.; Wei, D.; Qui, Y.R. Investigation of the bacteria in the seawater of Xisha in the South China Sea and their antibiotic sensitivity profile. Acad. J. First Med. Coll. PLA 2004, 24, 347–348. [Google Scholar]
- Breidt, F.; Medina, E.; Wafa, D.; Pérez-Díaz, I.; Franco, W.; Hsin-Yu Huang, H.-Y.; Johanningsmeier, S.D.; Kim, J.H. Characterization of cucumber fermentation spoilage bacteria by enrichment culture and 16S rDNA cloning. J. Food Sci. 2013, 78, M470–M476. [Google Scholar] [CrossRef] [PubMed]
- Lucena-Padrós, H.; Ruiz-Barba, J.L. Diversity and enumeration of halophilic and alkaliphilic bacteria in Spanish-style green table-olive fermentations. Food Microbiol. 2016, 53, 53–62. [Google Scholar] [CrossRef] [PubMed]
- Ezaki, T. Genus Ruminococcus. In Bergey’s Manual of Systematic Bacteriology; De Vos, P., Garrity, G.M., Jones, D., Krieg, N.R., Wolfganng, L., Rainey, F.A., Schleifer, K.H., Whitman, W.B., Aidan, C.P., Eds.; Springer: New York, NY, USA, 2009; Volume 3, pp. 1016–1018. [Google Scholar]
- Rowland, I.; Gibson, G.; Heinken, A.; Scott, K.; Swann, J.; Thiele, I.; Tuohy, K. Gut microbiota functions: Metabolism of nutrients and other food components. Eur. J. Nutr. 2018, 57, 1–24. [Google Scholar] [CrossRef] [PubMed]
- Rantsiou, K.; Urso, R.; Iacumin, L.; Cantoni, C.; Cattaneo, P.; Comi, G.; Cocolin, L. Culture-dependent and -independent methods to investigate the microbial ecology of Italian fermented sausages. Appl. Environ. Microbiol. 2005, 71, 1977–1986. [Google Scholar] [CrossRef] [PubMed]
- Wang, X.; Du, H.; Xu, Y. Source tracking of prokaryotic communities in fermented grain of Chinese strong-flavor liquor. Int. J. Food Microbiol. 2017, 244, 27–53. [Google Scholar] [CrossRef] [PubMed]
- Arroyo-López, F.N.; Querol, A.; Bautista-Gallego, J.; Garrido-Fernández, A. Role of yeasts in table olive production. Int. J. Food Microbiol. 2008, 128, 189–196. [Google Scholar] [CrossRef] [PubMed]
- Ruiz-Cruz, J.; González-Cancho, F. Metabolismo de levaduras aisladas de salmueras de aceitunas aderezadas estilo español. I. Asimilación de los ácidos láctico, acético y cítrico. Grasas Aceites 1969, 20, 6–11. [Google Scholar]
- Medina, E.; Brenes, M.; García-García, P.; Romero, C.; de Castro, A. Microbial ecology along the processing of Spanish olives darkened by oxidation. Food Control 2018, 86, 25–41. [Google Scholar] [CrossRef]
- Tamura, H.; Boonbumrung, S.; Yoshizawa, T.; Varanyanond, W. The volatile constituents in the peel and pulp of green Thai mango, Khieo Sawoei cultivar (Mangifera indica L.). Food Sci. Technol. Res. 2001, 7, 72–77. [Google Scholar] [CrossRef]
- Buttery, R.G.; Orts, W.J.; Takeoka, G.R.; Nam, Y. Volatile flavor components of rice cakes. J. Agric. Food Chem. 1999, 47, 4353–4356. [Google Scholar] [CrossRef] [PubMed]
- Montaño, A.; Sánchez, A.H.; López-López, A.; de Castro, A.; Rejano, L. Chemical composition of fermented green olives: Acidity, salt, moisture, fat, protein, ash, fiber, sugar, and polyphenol. In Olives and Olive Oil in Health and Disease Prevention; Preedy, V.R., Watson, R.R., Eds.; Elsevier: Amsterdam, The Netherlands, 2010; pp. 291–297. [Google Scholar]
- Vichi, S.; Romero, A.; Gallardo-Chacón, J.; Tous, J.; López-Tamames, E.; Buxaderas, S. Influence of olives’ storage conditions on the formation of volatile phenols and their role in off-odor formation in the oil. J. Agric. Food Chem. 2009, 57, 1449–1455. [Google Scholar] [CrossRef] [PubMed]
- Boonbumrung, S.; Tamura, H.; Mookdasanit, J.; Nakamoto, H.; Ishihara, M.; Yoshizawa, T.; Varanyanond, W. Characteristic aroma components of the volatile oil of yellow keaw mango fruits determined by limited odor unit method. Food Sci. Technol. Res. 2001, 7, 200–206. [Google Scholar] [CrossRef]
- Schnabel, K.-O.; Belitz, H.-D.; Von Ranson, C. Untersuchungen zur Struktur-Aktivitäts-Beziehung 1. Mitteilung: Wahrnehmungsschwellenwerte und Geruchsqualitäten von gesättigten aliphatischen und alicyclischen Verbindungen mit Sauerstoff-Funktion. Z. Lebensm. Unters. Forsch. 1988, 187, 215–223. [Google Scholar] [CrossRef]
- Chambers, E.; Koppel, K. Associations of volatile compounds with sensory aroma and flavor: The complex nature of flavor. Molecules 2013, 18, 4887–4905. [Google Scholar] [CrossRef] [PubMed]
- Lanza, B. Abnormal fermentations in table-olive processing: Microbial origin and sensory evaluation. Front. Microbiol. 2013, 4, 91. [Google Scholar] [CrossRef] [PubMed]
- Cancho, F.G.; Rejano, L.; Borbolla y Alcalá, J.M.R. La formación de ácido propiónico durante la conservación de las aceitunas verdes de mesa. III. Microorganismos responsables. Grasas Aceites 1980, 31, 245–250. [Google Scholar]
- Sánchez, A.H.; de Castro, A.; Rejano, L.; Montaño, A. Comparative study on chemical changes in olive juice and brine during green olive fermentation. J. Agric. Food Chem. 2000, 48, 5975–5980. [Google Scholar] [CrossRef] [PubMed]
- Medina, E.; Pérez-Díaz, I.M.; Breidt, F.; Hayes, J.; Franco, W.; Butz, N.; Azcarate-Pevil, M.A. Bacterial ecology of fermented cucumber rising pH spoilage as determined by nonculture-based methods. J. Food Sci. 2016, 81, M121–M129. [Google Scholar] [CrossRef] [PubMed]
- R Core Team. R: A Language and Environment for Statistical Computing; R Foundation for Statistical Computing: Vienna, Austria, 2012; ISBN 3-900051-07-0. [Google Scholar]
- Cole, J.R.; Wang, Q.; Cardenas, E.; Fish, J.; Chai, B.; Farris, R.J.; Kulam-Syed-Mohideen, A.S.; McGarrel, D.M.; Marsh, T.; Garrity, G.M.; et al. The ribosomal database project: Improved alignments and new tools for rRNA analysis. Nucleic Acids Res. 2009, 37, D141–D145. [Google Scholar] [CrossRef] [PubMed]
- Wang, Q.; Garrity, G.M.; Tiedje, J.M.; Cole, J.R. Naïve Bayesian classifier for rapid assignment of rRNA sequences into the new bacterial taxonomy. Appl. Environ. Microbiol. 2007, 73, 5261–5267. [Google Scholar] [CrossRef] [PubMed]


| Sample a | pH | Titratable Acidity (g L−1 Lactic Acid) | Combined Acidity (eq L−1) | Salt (g L−1 NaCl) | Total Phenols (g L−1 Gallic Acid) |
|---|---|---|---|---|---|
| Gordal Cultivar | |||||
| G1 (control) | 4.53 | 3.6 | 0.082 | 87 | 1.39 |
| G2 (control) | 4.67 | 3.6 | 0.080 | 88 | 1.39 |
| GFC1 | 4.99 | 4.3 | 0.130 | 38 | 1.72 |
| GFC2 | 5.05 | 4.4 | 0.127 | 37 | 2.17 |
| GFL1 | 5.10 | 2.4 | 0.086 | 37 | 1.57 |
| GFL2 | 4.86 | 4.5 | 0.097 | 37 | 1.50 |
| GCC1 | 5.06 | 3.9 | 0.121 | 38 | 2.48 |
| GCC2 | 4.95 | 4.8 | 0.119 | 38 | 2.54 |
| GCL1 | 4.83 | 3.8 | 0.076 | 35 | 1.74 |
| GCL2 | 4.84 | 4.0 | 0.081 | 39 | 1.64 |
| Manzanilla Cultivar | |||||
| M1 (control) | 4.27 | 4.5 | 0.081 | 87 | 2.00 |
| M2 (control) | 4.19 | 4.5 | 0.078 | 87 | 2.05 |
| MFC1 | 4.84 | 6.5 | 0.134 | 36 | 3.59 |
| MFC2 | 4.92 | 5.2 | 0.128 | 37 | 3.34 |
| MFL1 | 4.96 | 3.7 | 0.134 | 36 | 2.07 |
| MFL2 | 5.01 | 3.4 | 0.128 | 37 | 2.25 |
| MCC1 | 4.66 | 5.9 | 0.113 | 39 | 3.90 |
| MCC2 | 4.73 | 6.1 | 0.108 | 38 | 3.78 |
| MCL1 | 4.96 | 3.0 | 0.085 | 35 | 2.90 |
| MCL2 | 4.89 | 3.6 | 0.083 | 37 | 2.91 |
| Compounds | Samples a | |||||||||
|---|---|---|---|---|---|---|---|---|---|---|
| G1 (control) | G2 (control) | GFC1 | GFC2 | GFL1 | GFL2 | GCC1 | GCC2 | GCL1 | GCL2 | |
| Non-volatile acids b | ||||||||||
| Lactic acid | 5.20 ± 0.20 | 3.70 ± 0.08 | ND | ND | ND | ND | ND | ND | ND | ND |
| Succinic acid | 0.24 ± 0.09 | 0.16 ± 0.01 | 0.33 ± 0.03 | 0.27 ± 0.01 | 0.27 ± 0.01 | 0.22 ± 0.01 | 0.22 ± 0.01 | 0.23 ± 0.00 | 0.12 ± 0.00 | 0.12 ± 0.00 |
| Volatile acids c | ||||||||||
| Acetic acid | 891 ± 32 | 1244 ± 83 | 4558 ± 880 | 3528 ± 182 | 1392 ± 164 | 2322 ± 511 | 2161 ± 415 | 2446 ± 19 | 1782 ± 274 | 3107 ± 536 |
| Propionic acid | 1077 ± 22 | 1854 ± 125 | 5378 ± 850 | 5284 ± 240 | 3022 ± 98 | 3727 ± 391 | 4216 ± 109 | 4302 ± 192 | 2846 ± 127 | 3795 ± 115 |
| Isobutyric acid | 1.6 ± 0.3 | 3.1 ± 0.1 | ND | 5 ± 2 | 3.3 ± 0.3 | ND | 3.5 ± 0.0 | 2.3 ± 0.0 | ND | 1.9 ± 0.8 |
| Butyric acid | 6.6 ± 0.5 | 12 ± 4 | 603 ± 80 | 440 ± 12 | 630 ± 49 | 538 ± 16 | 185 ± 22 | 135 ± 1 | 164 ± 10 | 313 ± 3 |
| Valeric acid | 0.9 ± 0.5 | 1 ± 1 | 1068 ± 127 | 792 ± 73 | 1560 ± 26 | 1001 ± 62 | 386 ± 39 | 256 ± 2 | 350 ± 7 | 513 ± 50 |
| Caproic acid | 0.2 ± 0.0 | 0.2 ± 0.1 | 65 ± 7 | 38 ± 5 | 194 ± 6 | 59 ± 1 | 10 ± 1 | 6 ± 2 | 11.4 ± 0.4 | 25 ± 2 |
| Heptanoic acid | ND | ND | 2.2 ± 0.4 | 1.3 ± 0.3 | 11.1 ± 0.1 | 1.1 ± 0.2 | 0.2 ± 0.0 | 0.1 ± 0.0 | 0.2 ± 0.0 | 0.3 ± 0.0 |
| Cyclohexanoic acid | 1.0 ± 0.5 | 0.6 ± 0.5 | 422 ± 16 | 31 ± 10 | 61 ± 9 | 0.6 ± 0.8 | 841 ± 100 | 729 ± 31 | 401 ± 1 | 479 ± 56 |
| Alcohols d | ||||||||||
| Ethanol b | 0.12 ± 0.02 | 0.14 ± 0.03 | 0.44 ± 0.02 | 0.27 ± 0.07 | 0.15 ± 0.01 | 0.23 ± 0.05 | 0.28 ± 0.02 | 0.27 ± 0.03 | 0.46 ± 0.06 | 0.45 ± 0.01 |
| 2-Butanol | 8 ± 1 | 6.5 ± 0.2 | 14 ± 2 | 10.2 ± 0.1 | 14 ± 3 | 26.4 ± 0.3 | 55 ± 5 | 16.8 ± 0.8 | 26 ± 4 | 36.5 ± 0.8 |
| 1-Propanol | 46 ± 2 | 55.8 ± 0.5 | 42 ± 5 | 42.7 ± 0.2 | 31 ± 6 | 45 ± 1 | 43 ± 3 | 19 ± 2 | 36 ± 5 | 29.5 ± 0.5 |
| 1-Butanol | 1 ± 1 | 2.44 ± 0.01 | 3.83 ± 0.06 | 5.3 ± 0.2 | 9.6 ± 2 | 4.30 ± 0.05 | 2 ± 1 | 0.85 ± 0.04 | 4 ± 1 | 1.69 ± 0.07 |
| 1-Pentanol | ND | ND | 7.9 ± 0.5 | 17.5 ± 0.3 | 38 ± 8 | 8.69 ± 0.08 | 6 ± 3 | 2.15 ± 0.09 | 2.4 ± 0.4 | 2.79 ± 0.06 |
| 3-Methyl-1-pentanol | 0.3 ± 0.4 | 0.1 ± 0.1 | 0.62 ± 0.02 | 0.52 ± 0.07 | 0.37 ± 0.05 | 0.38 ± 0.01 | 0.2 ± 0.2 | 0.29 ± 0.08 | 0.32 ± 0.07 | 0.13 ± 0.06 |
| 1-Hexanol | 0.90 ± 0.09 | 0.91 ± 0.03 | 1.42 ± 0.03 | 1.58 ± 0.04 | 5.1 ± 0.7 | 1.40 ± 0.01 | 1.2 ± 0.6 | 0.5 ± 0.2 | 0.92 ± 0.09 | 0.80 ± 0.03 |
| (Z)-3-Hexen-1-ol | 3.00 ± 0.02 | 2.7 ± 0.1 | 3.8 ± 0.3 | 3.6 ± 0.2 | 2.1 ± 0.3 | 2.7 ± 0.1 | 4 ± 2 | 3.5 ± 0.2 | 3.7 ± 0.1 | 2.6 ± 0.1 |
| 2-Ethyl-1-hexanol | 5.8 ± 0.2 | 5.9 ± 0.3 | 3.40 ± 0.08 | 4.32 ± 0.05 | 15.5 ± 0.3 | 17.4 ± 0.1 | 4 ± 1 | 2.4 ± 0.1 | 28 ± 2 | 17.5 ± 0.3 |
| 1-Octanol | 0.53 ± 0.00 | 0.55 ± 0.01 | 0.81 ± 0.03 | 0.69 ± 0.02 | 0.86 ± 0.02 | 0.68 ± 0.04 | 1.0 ± 0.2 | 0.78 ± 0.02 | 1.1 ± 0.5 | 0.62 ± 0.06 |
| Benzyl alcohol | 4.41 ± 0.08 | 4.3 ± 0.3 | 7.6 ± 0.6 | 3.8 ± 0.1 | 4.4 ± 0.9 | 6.0 ± 0.1 | 14 ± 6 | 8.8 ± 0.5 | 9.3 ± 0.6 | 6.1 ± 0.1 |
| Phenylethyl alcohol | 7.97 ± 0.07 | 8.1 ± 0.5 | 12.8 ± 0.9 | 11.2 ± 0.3 | 7 ± 1 | 6.9 ± 0.2 | 33 ± 14 | 20 ± 1 | 15 ± 1 | 11.0 ± 0.2 |
| Aldehydes d | ||||||||||
| Octanal | 0.2 ± 0.2 | 0.21 ± 0.08 | 0.31 ± 0.04 | 0.3 ± 0.1 | ND | 0.3 ± 0.2 | 0.50 ± 0.02 | 0.51 ± 0.04 | 1.2 ± 0.5 | 0.4 ± 0.2 |
| Nonanal | 0.66 ± 0.06 | 0.68 ± 0.05 | 1.0 ± 0.2 | 1.13 ± 0.06 | 1.3 ± 0.5 | 0.9 ± 0.1 | 1.58 ± 0.08 | 1.6 ± 0.1 | 1.7 ± 0.4 | 1.34 ± 0.01 |
| Benzaldehyde | 7.6 ± 0.2 | 3.5 ± 0.2 | 7.2 ± 0.7 | 7.8 ± 0.5 | 1.8 ± 0.5 | 14.6 ± 0.1 | 17 ± 8 | 12.5 ± 0.3 | 16.4 ± 0.4 | 6 ± 1 |
| 3,4-Dimethylbenzaldehyde | 1.7 ± 0.2 | 1.49 ± 0.04 | ND | ND | ND | ND | 0.44 ± 0.06 | ND | 0.7 ± 0.6 | 0.15 ± 0.02 |
| Esters d | ||||||||||
| Methyl propanoate | 28 ± 2 | 28.26 ± 0.01 | 47.7 ± 0.3 | 33.6 ± 0.7 | 32 ± 7 | 19 ± 5 | 22 ± 4 | 43 ± 0.9 | 26 ± 5 | 15.9 ± 0.6 |
| Propyl acetate | 24 ± 3 | 19.9 ± 0.6 | 20 ± 1 | 12.35 ± 0.08 | 5 ± 1 | 14.4 ± 0.2 | 15 ± 1 | 8.3 ± 0.4 | 15 ± 2 | 9.7 ± 0.2 |
| Methyl 2-methylbutanoate | 3.2 ± 0.4 | 3.15 ± 0.03 | 2.5 ± 0.1 | 3.2 ± 0.2 | 3.6 ± 0.3 | 3.0 ± 0.1 | 1.1 ± 0.1 | 2.2 ± 0.1 | 2.5 ± 0.3 | 1.51 ± 0.07 |
| Ethyl butanoate | ND | ND | 10.27 ± 0.03 | ND | ND | ND | ND | ND | ND | 15.2 ± 0.2 |
| Propyl propanoate | 82 ± 5 | 88 ± 1 | 110 ± 4 | 67.20 ± 0.01 | 28 ± 2 | 63.4 ± 0.6 | 44 ± 5 | 58 ± 1 | 68 ± 6 | 62.8 ± 0.8 |
| Methyl pentanoate | 0.75 ± 0.00 | 0.53 ± 0.03 | 25 ± 5 | 21 ± 6 | 66 ± 5 | 31 ± 3 | 23 ± 3 | 36.0 ± 0.2 | 58 ± 2 | 70 ± 2 |
| Ethyl pentanoate | 0.4 ± 0.6 | 0.64 ± 0.09 | 1.6 ± 0.4 | ND | ND | ND | 10 ± 5 | 9.8 ± 0.2 | 37 ± 1 | 81 ± 6 |
| Methyl hexanoate | ND | ND | 8.3 ± 0.7 | 9 ± 2 | 88 ± 6 | 19 ± 2 | 6 ± 2 | 7.7 ± 0.1 | 19 ± 2 | 56.6 ± 0.4 |
| Propyl pentanoate | 0.3 ± 0.4 | 0.58 ± 0.01 | 74 ± 14 | 18 ± 3 | 9.0 ± 0.2 | 48.9 ± 0.9 | 36 ± 16 | 26.1 ± 0.4 | 84 ± 10 | 201 ± 14 |
| Ethyl hexanoate | ND | ND | ND | ND | ND | ND | ND | ND | ND | 4.5 ± 0.8 |
| Methyl heptanoate | ND | ND | ND | ND | 2.4 ± 0.3 | 0.2 ± 0.2 | ND | ND | ND | ND |
| Propyl hexanoate | ND | ND | 1.94 ± 0.09 | 0.2 ± 0.3 | 0.39 ± 0.09 | 1.3 ± 0.1 | 0.7 ± 0.4 | 0.42 ± 0.06 | 2.1 ± 0.5 | 10.0 ± 0.2 |
| Methyl cyclohexanecarboxylate | 0.43 ± 0.02 | 0.39 ± 0.02 | 13 ± 2 | 0.9 ± 0.2 | 2.3 ± 0.1 | 0.04 ± 0.01 | 54 ± 3 | 83.9 ± 0.4 | 48 ± 2 | 45.7 ± 0.7 |
| Ethyl cyclohexanecarboxylate | 0.34 ± 0.01 | 0.27 ± 0.01 | 1.11 ± 0.01 | ND | ND | ND | 26 ± 9 | 31.6 ± 0.4 | 33 ± 1 | 47 ± 4 |
| Benzyl propanoate | ND | ND | 0.82 ± 0.00 | 0.40 ± 0.03 | 0.36 ± 0.05 | 0.43 ± 0.01 | 1.9 ± 0.4 | 1.8 ± 0.1 | 0.98 ± 0.09 | 0.77 ± 0.04 |
| 2-Phenylethyl acetate | 1.23 ± 0.03 | 1.22 ± 0.04 | 1.97 ± 0.00 | 1.6 ± 0.2 | 0.5 ± 0.3 | 0.96 ± 0.08 | 6 ± 2 | 4.6 ± 0.3 | 3.53 ± 0.02 | 1.22 ± 0.02 |
| Methyl hydrocinnamate | ND | ND | 0.10 ± 0.04 | 0.05 ± 0.01 | 0.12 ± 0.03 | 0.09 ± 0.01 | 1.2 ± 0.5 | 1.09 ± 0.06 | 1.32 ± 0.08 | 1.54 ± 0.09 |
| Benzyl pentanoate | ND | ND | 0.62 ± 0.09 | ND | 0.55 ± 0.01 | 0.46 ± 0.01 | ND | ND | ND | ND |
| Phenols d | ||||||||||
| o-Guaiacol | ND | ND | 2.55 ± 0.03 | 0.94 ± 0.07 | 0.9 ± 0.2 | 3.07 ± 0.06 | 86 ± 4 | 69 ± 4 | 28 ± 3 | 11.1 ± 0.1 |
| p-Creosol | 70 ± 2 | 65 ± 4 | 134 ± 3 | 150 ± 7 | 196 ± 3 | 171 ± 3 | 185 ± 3 | 116 ± 6 | 124 ± 8 | 121.77 ± 0.03 |
| Phenol | 1.0 ± 0.1 | 0.95 ± 0.03 | 4.3 ± 0.2 | 1.21 ± 0.09 | 2.5 ± 0.4 | 2.98 ± 0.08 | 28 ± 11 | 18 ± 1 | 14 ± 1 | 10.1 ± 0.1 |
| p-Ethyl guaiacol | 0.15 ± 0.02 | 0.14 ± 0.03 | 0.35 ± 0.02 | 0.20 ± 0.09 | 0.15 ± 0.06 | 0.18 ± 0.07 | 0.6 ± 0.2 | 0.3 ± 0.1 | 0.51 ± 0.03 | 0.34 ± 0.00 |
| p-Cresol | 0.74 ± 0.00 | 0.71 ± 0.05 | 1.47 ± 0.05 | 1.92 ± 0.09 | 2.8 ± 0.5 | 1.8 ± 0.1 | 3 ± 1 | 1.81 ± 0.09 | 1.5 ± 0.1 | 1.51 ± 0.05 |
| 4-Ethyl phenol | 1.09 ± 0.06 | 1.1 ± 0.1 | 8.5 ± 0.4 | 2.1 ± 0.2 | 1.8 ± 0.4 | 1.84 ± 0.04 | 16 ± 6 | 4.6 ± 0.3 | 6.9 ± 0.3 | 5.15 ± 0.03 |
| Terpenes d | ||||||||||
| Linalool | ND | ND | 0.38 ± 0.02 | 0.2 ± 0.1 | 0.33 ± 0.03 | 0.35 ± 0.01 | ND | ND | ND | ND |
| α-Terpineol | 4.17 ± 0.09 | 4.1 ± 0.1 | 7.4 ± 0.1 | 7.12 ± 0.05 | 5.7 ± 0.3 | 5.5 ± 0.1 | 14 ± 5 | 8.0 ± 0.4 | 6.39 ± 0.08 | 5.99 ± 0.05 |
| Others d | ||||||||||
| Dimethyl sulfide | 1.3 ± 0.2 | 1.17 ± 0.09 | 1.6 ± 0.1 | 1.11 ± 0.05 | 1.4 ± 0.2 | 1.74 ± 0.05 | 0.6 ± 0.4 | 1.06 ± 0.02 | 1.42 ± 0.08 | 1.50 ± 0.03 |
| Styrene | 4.3 ± 0.1 | 2.29 ± 0.03 | 2 ± 3 | 2.8 ± 0.3 | 2.3 ± 0.6 | 4.1 ± 0.8 | 1.1 ± 1.5 | 9.5 ± 0.2 | 3.8 ± 0.9 | 10.9 ± 0.3 |
| 3-Ethylpyridine | 2.70 ± 0.02 | 2.2 ± 0.2 | 1.77 ± 0.03 | 1.5 ± 0.1 | 1.3 ± 0.2 | 0.84 ± 0.03 | 0.6 ± 0.9 | 0.84 ± 0.03 | 0.78 ± 0.01 | 1.01 ± 0.01 |
| 3-Ethyl-4-methylpyridine | 1.79 ± 0.06 | 1.3 ± 0.1 | 4.0 ± 0.1 | 1.8 ± 0.2 | 1.6 ± 0.2 | 1.05 ± 0.03 | 1.4 ± 0.7 | 0.9 ± 0.1 | 0.84 ± 0.01 | 1.1 ± 0.1 |
| 1,4-Dimethoxybenzene | 1.75 ± 0.07 | 1.90 ± 0.08 | 2 ± 0.2 | 2.1 ± 0.3 | 1.7 ± 0.1 | 2.13 ± 0.05 | 3 ± 1 | 2.1 ± 0.2 | 2.1 ± 0.1 | 1.96 ± 0.02 |
| Samples a | ||||||||||
|---|---|---|---|---|---|---|---|---|---|---|
| Compounds | M1 (control) | M2 (control) | MFC1 | MFC2 | MFL1 | MFL2 | MCC1 | MCC2 | MCL1 | MCL2 |
| Non-volatile acids b | ||||||||||
| Lactic acid | 7.11 ± 0.05 | 7.8 ± 0.2 | ND | ND | ND | ND | 3.9 ± 0.1 | ND | ND | ND |
| Succinic acid | 0.12 ± 0.01 | 0.09 ± 0.03 | 0.25 ± 0.01 | 0.21 ± 0.00 | 0.11 ± 0.00 | 0.09 ± 0.00 | 0.20 ± 0.01 | 0.31 ± 0.02 | 0.23 ± 0.01 | 0.25 ± 0.01 |
| Volatile acids c | ||||||||||
| Acetic acid | 1435 ± 372 | 882 ± 142 | 4809 ± 632 | 4411 ± 151 | 2589 ± 662 | 2762 ± 367 | 3206 ± 808 | 4236 ± 200 | 1510 ± 35 | 1367 ± 173 |
| Propionic acid | 858 ± 174 | 546 ± 78 | 5588 ± 236 | 5031 ± 54 | 3515 ± 647 | 3747 ± 55 | 2701 ± 284 | 5473 ± 603 | 2209 ± 4 | 3262 ± 635 |
| Isobutyric acid | 1 ± 1 | ND | ND | ND | 2.4 ± 0.8 | 1.5 ± 0.4 | 1.9 ± 2.6 | ND | ND | ND |
| Butyric acid | 2.8 ± 0.9 | 2.5 ± 0.3 | 12.4 ± 0.2 | 132 ± 2 | 769 ± 141 | 744 ± 6 | 13 ± 1 | 13.5 ± 0.9 | 402 ± 15 | 139 ± 4 |
| Valeric acid | 2 ± 1 | 0.5 ± 0.1 | 4.2 ± 0.2 | 177 ± 7 | 1215 ± 149 | 1407 ± 103 | 4 ± 3 | 1.1 ± 0.5 | 598 ± 10 | 482 ± 1 |
| Caproic acid | 0.2 ± 0.0 | 0.1 ± 0.0 | 0.3 ± 0.0 | 3.9 ± 0.4 | 76 ± 9 | 97.6 ± 0.3 | 0.8 ± 0.4 | 0.3 ± 0.1 | 32 ± 5 | 9 ± 2 |
| Heptanoic acid | ND | ND | ND | ND | 1.1 ± 0.1 | 2.7 ± 0.2 | ND | ND | 0.4 ± 0.0 | 0.2 ± 0.0 |
| Cyclohexanoic acid | 2 ± 1 | ND | 89 ± 1 | 508 ± 32 | 48 ± 8 | 2.6 ± 0.4 | 1.6 ± 0.2 | 72 ± 6 | 280 ± 37 | 370 ± 12 |
| Alcohols d | ||||||||||
| Ethanol | 0.22 ± 0.03 | 0.23 ± 0.05 | 0.12 ± 0.02 | 0.13 ± 0.01 | 0.07 ± 0.00 | 0.08 ± 0.01 | 0.95 ± 0.07 | 0.89 ± 0.05 | 0.34 ± 0.05 | 0.06 ± 0.02 |
| 2-Butanol | 6 ± 2 | 12.3 ± 0.8 | 10.7 ± 0.5 | 14.4 ± 0.4 | 45 ± 13 | 83 ± 1 | 15 ± 1 | 20.9 ± 0.9 | 259 ± 13 | 190 ± 5 |
| 1-Propanol | 42 ± 16 | 46 ± 7 | 20 ± 1 | 24.2 ± 0.6 | 3.0 ± 0.3 | 2.7 ± 0.1 | 49 ± 4 | 35 ± 1 | ND | 3.0 ± 0.2 |
| 1-Butanol | 0.7 ± 0.3 | 0.5 ± 0.7 | ND | 1.05 ± 0.03 | 2.2 ± 0.4 | ND | 2.0 ± 0.3 | 1.0 ± 0.2 | ND | ND |
| 1-Pentanol | ND | ND | ND | 4.44 ± 0.09 | 6 ± 1 | 11.16 ± 0.05 | ND | ND | 4 ± 2 | 3.1 ± 0.1 |
| 3-Methyl-1-pentanol | ND | ND | ND | ND | ND | 0.2 ± 0.2 | 1.28 ± 0.02 | 0.64 ± 0.04 | ND | ND |
| 1-Hexanol | 0.8 ± 0.1 | 1.48 ± 0.01 | 0.69 ± 0.02 | 1.16 ± 0.03 | 1.2 ± 0.1 | 1.87 ± 0.02 | 1.38 ± 0.06 | 1.2 ± 0.1 | 0.9 ± 0.3 | 0.47 ± 0.08 |
| (Z)-3-Hexen-1-ol | 8 ± 1 | 10.8 ± 0.7 | 9.2 ± 0.3 | 10.6 ± 0.2 | 3.2 ± 0.5 | 2 ± 2 | 11.1 ± 0.5 | 12 ± 1 | 6 ± 2 | 4.7 ± 0.3 |
| 2-Ethyl-1-hexanol | 5.0 ± 0.5 | 5.32 ± 0.07 | 2.7 ± 0.2 | 2.42 ± 0.01 | 2.93 ± 0.09 | 2.8 ± 0.1 | 2.4 ± 0.2 | 3.9 ± 0.5 | 2.6 ± 0.4 | 5.2 ± 0.1 |
| 1-Octanol | 0.5 ± 0.1 | 0.4 ± 0.2 | 0.6 ± 0.1 | 0.68 ± 0.06 | 0.66 ± 0.00 | 0.9 ± 0.4 | 1.00 ± 0.03 | 0.9 ± 0.1 | 0.8 ± 0.3 | 0.76 ± 0.05 |
| Benzyl alcohol | 5.0 ± 0.5 | 6.5 ± 0.1 | 11 ± 1 | 8.29 ± 0.07 | 7.7 ± 0.1 | 6.1 ± 0.5 | 8.5 ± 0.6 | 11 ± 1 | 8.8 ± 0.7 | 7.6 ± 0.3 |
| Phenylethyl alcohol | 10 ± 1 | 12.9 ± 0.2 | 14 ± 1 | 11.15 ± 0.02 | 9.0 ± 0.1 | 8.8 ± 0.4 | 20 ± 1 | 22 ± 4 | 14.2 ± 0.9 | 11.72 ± 0.06 |
| Aldehydes d | ||||||||||
| Octanal | 0.2 ± 0.1 | 0.50 ± 0.09 | 0.3 ± 0.1 | 0.4 ± 0.1 | 0.6 ± 0.1 | 1 ± 1 | 0.4 ± 0.1 | 0.41 ± 0.03 | 0.5 ± 0.4 | 0.37 ± 0.03 |
| Nonanal | 1.9 ± 0.8 | 0.97 ± 0.07 | 1.1 ± 0.3 | 1.3 ± 0.4 | 1.3 ± 0.1 | 4 ± 4 | 1.11 ± 0.02 | 1 ± 1 | 1.3 ± 0.1 | 1.11 ± 0.05 |
| Benzaldehyde | 2.5 ± 0.4 | 4 ± 2 | 14.9 ± 0.8 | 13.5 ± 0.8 | 11.7 ± 0.6 | 13 ± 2 | 3.2 ± 0.7 | 17 ± 3 | 9.1 ± 0.2 | 5.8 ± 0.4 |
| 3,4-Dimethylbenzaldehyde | 1.8 ± 0.1 | 2.1 ± 0.3 | 0.61 ± 0.03 | ND | 0.3 ± 0.1 | ND | 0.19 ± 0.09 | 0.1 ± 0.1 | ND | ND |
| Esters d | ||||||||||
| Methyl propanoate | 14 ± 5 | 25 ± 2 | 55 ± 5 | 41 ± 1 | 12 ± 2 | 24 ± 1 | 32 ± 3 | 36.7 ± 0.4 | 10 ± 7 | 22 ± 1 |
| Propyl acetate | 15 ± 3 | 16 ± 1 | 30 ± 2 | 48 ± 1 | 2.0 ± 0.5 | 1.79 ± 0.08 | 73 ± 3 | 51 ± 2 | 1.2 ± 0.6 | 1.0 ± 0.1 |
| Methyl 2-methylbutanoate | 3.1 ± 0.7 | 3.6 ± 1.0 | 3.0 ± 0.5 | 3.1 ± 0.1 | 3.1 ± 0.4 | 3.36 ± 0.04 | 3.37 ± 0.08 | 2.8 ± 0.3 | 1.7 ± 0.7 | 2.6 ± 0.2 |
| Ethyl butanoate | ND | ND | ND | ND | ND | ND | ND | ND | 9 ± 3 | ND |
| Propyl propanoate | 16 ± 3 | 13 ± 1 | 98 ± 8 | 94 ± 2 | 4.9 ± 0.7 | 4.79 ± 0.04 | 102 ± 4 | 98 ± 10 | 4 ± 1 | 8.34 ± 0.08 |
| Methyl pentanoate | ND | ND | 0.56 ± 0.02 | 12.3 ± 0.1 | 52 ± 4 | 66 ± 1 | 0.41 ± 0.02 | 0.1 ± 0.1 | 59 ± 19 | 42.3 ± 0.1 |
| Ethyl pentanoate | ND | ND | 0.9 ± 0.1 | ND | 3.6 ± 0.1 | 0.34 ± 0.01 | 0.52 ± 0.01 | 0.1 ± 0.1 | ND | 12.4 ± 0.1 |
| Methyl hexanoate | ND | ND | ND | 3.39 ± 0.01 | 40 ± 5 | 42.1 ± 0.2 | 1.35 ± 0.05 | 0.59 ± 0.03 | 65 ± 9 | 11.1 ± 0.4 |
| Propyl pentanoate | ND | ND | 0.3 ± 0.4 | 7.0 ± 0.1 | 7.4 ± 0.4 | 3.9 ± 0.4 | 0.2 ± 0.2 | ND | 17 ± 2 | 7.6 ± 0.2 |
| Ethyl hexanoate | ND | ND | ND | 0.37 ± 0.00 | 0.24 ± 0.00 | ND | 0.41 ± 0.03 | ND | 11.7 ± 0.9 | 0.69 ± 0.08 |
| Methyl heptanoate | ND | ND | ND | ND | ND | 0.4 ± 0.5 | ND | ND | ND | ND |
| Propyl hexanoate | ND | ND | ND | ND | 0.49 ± 0.00 | ND | ND | ND | 0.8 ± 0.1 | ND |
| Methyl cyclohexanecarboxylate | 0.21 ± 0.06 | 0.10 ± 0.00 | 11.9 ± 0.4 | 37 ± 2 | 3.51 ± 0.01 | 0.1 ± 0.1 | 0.2 ± 0.2 | 8.0 ± 0.7 | 26 ± 1 | 31 ± 1 |
| Ethyl cyclohexanecarboxylate | 0.19 ± 0.04 | ND | 5.2 ± 0.1 | 18.2 ± 0.1 | 0.29 ± 0.03 | ND | 0.2 ± 0.2 | 6.1 ± 0.4 | 22.3 ± 0.7 | 8.3 ± 0.7 |
| Benzyl propanoate | ND | ND | 1.6 ± 0.1 | 1.29 ± 0.01 | 0.57 ± 0.01 | 0.25 ± 0.03 | 0.89 ± 0.02 | 1.3 ± 0.7 | 0.68 ± 0.03 | 0.81 ± 0.05 |
| 2-Phenylethyl acetate | 1.8 ± 0.1 | 2.30 ± 0.07 | ND | 2.08 ± 0.01 | 1.73 ± 0.00 | ND | 4.79 ± 0.01 | ND | 4.69 ± 0.02 | 2.28 ± 0.02 |
| Methyl hydrocinnamate | 0.07 ± 0.03 | 0.07 ± 0.01 | 0.3 ± 0.2 | 0.27 ± 0.04 | 0.03 ± 0.03 | 0.01 ± 0.01 | 0.52 ± 0.05 | 0.38 ± 0.01 | 0.60 ± 0.01 | 0.92 ± 0.09 |
| Benzyl pentanoate | ND | ND | ND | ND | 0.64 ± 0.03 | 0.2 ± 0.2 | ND | ND | 0.54 ± 0.00 | 0.3 ± 0.1 |
| Phenols d | ||||||||||
| o-Guaiacol | ND | ND | 42 ± 2 | 39.0 ± 0.3 | 18.6 ± 0.7 | 39.9 ± 0.8 | 49.0 ± 0.7 | 58 ± 9 | 12 ± 1 | 20.2 ± 0.4 |
| p-Creosol | 64 ± 6 | 78 ± 5 | 99 ± 6 | 96 ± 1 | 164 ± 3 | 185 ± 3 | 128 ± 2 | 131 ± 20 | 131 ± 9 | 128 ± 3 |
| Phenol | 0.58 ± 0.03 | 0.8 ± 0.1 | 20 ± 1 | 18.1 ± 0.2 | 3.9 ± 0.1 | 5.8 ± 0.4 | 21.2 ± 0.8 | 24 ± 3 | 12 ± 1 | 13.59 ± 0.07 |
| p-Ethyl guaiacol | 0.08 ± 0.00 | 0.09 ± 0.00 | 0.28 ± 0.04 | 0.30 ± 0.00 | 0.19 ± 0.00 | 0.18 ± 0.03 | 0.35 ± 0.03 | 0.30 ± 0.03 | 2.33 ± 0.05 | 0.65 ± 0.02 |
| p-Cresol | 0.8 ± 0.1 | 0.93 ± 0.04 | 1.9 ± 0.1 | 1.81 ± 0.02 | 2.89 ± 0.04 | 4.7 ± 0.1 | 2.85 ± 0.09 | 2.9 ± 0.5 | 2.3 ± 0.1 | 2.37 ± 0.01 |
| 4-Ethyl phenol | 0.77 ± 0.07 | 0.53 ± 0.03 | 2.0 ± 0.2 | 3.40 ± 0.02 | 1.65 ± 0.01 | 12.9 ± 0.7 | 30 ± 1 | 7 ± 1 | 59 ± 4 | 43 ± 1 |
| Terpenes d | ||||||||||
| Linalool | 0.74 ± 0.05 | 0.88 ± 0.03 | 1.44 ± 0.03 | 1.63 ± 0.00 | 1.08 ± 0.04 | 1.09 ± 0.00 | 1.92 ± 0.04 | 1.9 ± 0.2 | 1.7 ± 0.1 | 1.60 ± 0.07 |
| α-Terpineol | 0.77 ± 0.06 | 0.70 ± 0.09 | 0.74 ± 0.02 | 0.72 ± 0.03 | 0.57 ± 0.00 | 0.71 ± 0.02 | 0.62 ± 0.01 | 0.6 ± 0.1 | 0.64 ± 0.03 | 1.89 ± 0.08 |
| Others d | ||||||||||
| Dimethyl sulfide | 1.4 ± 0.4 | 2 ± 1 | 1.99 ± 0.04 | 2.3 ± 0.2 | 1.7 ± 0.2 | 2.5 ± 0.2 | 1.5 ± 0.1 | 1.14 ± 0.04 | 1.5 ± 0.7 | 1.86 ± 0.04 |
| Styrene | 2.1 ± 0.1 | 4.2 ± 0.8 | 3.14 ± 0.05 | 2.4 ± 0.2 | 3.9 ± 0.3 | 4 ± 1 | 4.5 ± 0.2 | 3.6 ± 0.7 | 5 ± 1 | 4.6 ± 0.3 |
| 3-Ethylpyridine | 4.3 ± 0.3 | 5.87 ± 0.01 | 2.89 ± 0.06 | 4.5 ± 0.2 | 1.7 ± 0.1 | 1.1 ± 0.1 | 2.4 ± 0.9 | 3.4 ± 0.7 | 5 ± 1 | 2.95 ± 0.09 |
| 3-Ethyl-4-methylpyridine | 4.4 ± 0.8 | 6.5 ± 0.6 | 3.7 ± 0.6 | 5.5 ± 0.3 | 2.8 ± 0.2 | 4 ± 1 | 2.3 ± 0.3 | 3.0 ± 0.6 | 13 ± 1 | 6 ± 1 |
| 1,4-Dimethoxybenzene | 1.8 ± 0.1 | 2.1 ± 0.1 | 2.02 ± 0.05 | 2.92 ± 0.08 | 2.2 ± 0.2 | 2.43 ± 0.02 | 3.2 ± 0.1 | 3.4 ± 0.5 | 3.4 ± 0.1 | 3.06 ± 0.06 |
| Sample | |||||||||
|---|---|---|---|---|---|---|---|---|---|
| Descriptor | GFC1 | GFL1 | GCC1 | GCL2 | MFC2 | MFL1 | MCC2 | MCL2 | M1 (control) |
| Zapatera | 5.7 ± 0.7 * | 5.0 ± 0.6 * | 4.9 ± 0.6 * | 4.6 ± 0.6 * | 5.3 ± 0.5 * | 4.3 ± 0.5 | 5.0 ± 0.5 * | 3.6 ± 0.4 | 2.4 ± 0.4 |
| Butyric | 4.5 ± 0.6 * | 3.7 ± 0.6 | 2.7 ± 0.4 | 3.4 ± 0.5 | 3.5 ± 0.5 | 4.6 ± 0.7 * | 2.5 ± 0.3 | 4.3 ± 0.6 * | 2.3 ± 0.3 |
| Putrid | 2.8 ± 0.4 | 2.7 ± 0.5 | 3.0 ± 0.5 | 3.1 ± 0.6 | 2.3 ± 0.4 | 2.6 ± 0.5 | 2.0 ± 0.3 | 2.7 ± 0.4 | 1.4 ± 0.2 |
| Sample a | Duration (h:min) | Initial Brine (g L−1 NaCl) | |
|---|---|---|---|
| Lye Treatment | Washing | ||
| G1, G2 (control) | 8:10 | 15:00 | 122 |
| GFC1, GFC2 | 8:30 | 0:50 | 71 |
| GFL1, GFL2 | 8:30 | 14:00 | 71 |
| GCC1, GFL2 | 5:00 | 0:50 | 71 |
| GCL1, GCL2 | 5:00 | 14:00 | 71 |
| M1, M2 (control) | 5:55 | 17:20 | 122 |
| MFC1, MFC2 | 6:05 | 1:05 | 71 |
| MFL1, MFL2 | 6:05 | 17:05 | 71 |
| MCC1, MCC2 | 3:15 | 1:05 | 71 |
| MCL1, MCL2 | 3:15 | 17:05 | 71 |
© 2018 by the authors. Licensee MDPI, Basel, Switzerland. This article is an open access article distributed under the terms and conditions of the Creative Commons Attribution (CC BY) license (http://creativecommons.org/licenses/by/4.0/).
Share and Cite
De Castro, A.; Sánchez, A.H.; López-López, A.; Cortés-Delgado, A.; Medina, E.; Montaño, A. Microbiota and Metabolite Profiling of Spoiled Spanish-Style Green Table Olives. Metabolites 2018, 8, 73. https://doi.org/10.3390/metabo8040073
De Castro A, Sánchez AH, López-López A, Cortés-Delgado A, Medina E, Montaño A. Microbiota and Metabolite Profiling of Spoiled Spanish-Style Green Table Olives. Metabolites. 2018; 8(4):73. https://doi.org/10.3390/metabo8040073
Chicago/Turabian StyleDe Castro, Antonio, Antonio Higinio Sánchez, Antonio López-López, Amparo Cortés-Delgado, Eduardo Medina, and Alfredo Montaño. 2018. "Microbiota and Metabolite Profiling of Spoiled Spanish-Style Green Table Olives" Metabolites 8, no. 4: 73. https://doi.org/10.3390/metabo8040073
APA StyleDe Castro, A., Sánchez, A. H., López-López, A., Cortés-Delgado, A., Medina, E., & Montaño, A. (2018). Microbiota and Metabolite Profiling of Spoiled Spanish-Style Green Table Olives. Metabolites, 8(4), 73. https://doi.org/10.3390/metabo8040073