Tackling CASMI 2012: Solutions from MetFrag and MetFusion


Abstract
:
1. Introduction
2. Methods
2.1. Spectra Processing and Neutral Mass Heuristics
2.2. Eliminating Redundant Candidates
2.3. In silico Fragmentation with MetFrag
2.4. MetFusion: Integration of MetFrag with Spectral Libraries
3. Results and Discussion
 where BC and WC are the number of candidates ranked better and worse than the correct solution, and TC is the number of total candidates, respectively. See [16] for more details.
 3.1. MetFrag

| Natural Product Challenges | Environmental Challenges | ||||||||
|---|---|---|---|---|---|---|---|---|---|
| Chall. | #Cand. | Rank | RRP | MLS | RRP | Chall. | #Cand. | Rank | RRP |
| 10 | 447 | 260 | 0.441 | ||||||
| 1 | 994 | 5 | 0.996 | 4 | 0.997 | 11 | 465 | 23 | 0.976 |
| 2 | 248 | 3 | 0.992 | 3 | 0.992 | 12 | 1531 | 36 | 0.978 |
| 3 | 1094 | 12 | 0.990 | 9 | 0.993 | 13 | 1031 | 5 | 0.998 |
| 4 | 2234 | 547 | 0.757 | 454 | 0.797 | 14 | 125 | 27 | 0.810 |
| 5 | 2891 | 988 | 0.679 | 1238 | 0.573 | 15 | 1825 | 173 | 0.907 |
| 6 | 1860 | 1860 | 0.439 | 281 | 0.850 | 16 | 1948 | 1948 | 0.453 |
| 17 | 475 | 15 | 0.970 | ||||||
| Median | 1477 | 280 | 0.874 | 145 | 0.921 | 753 | 32 | 0.939 | |
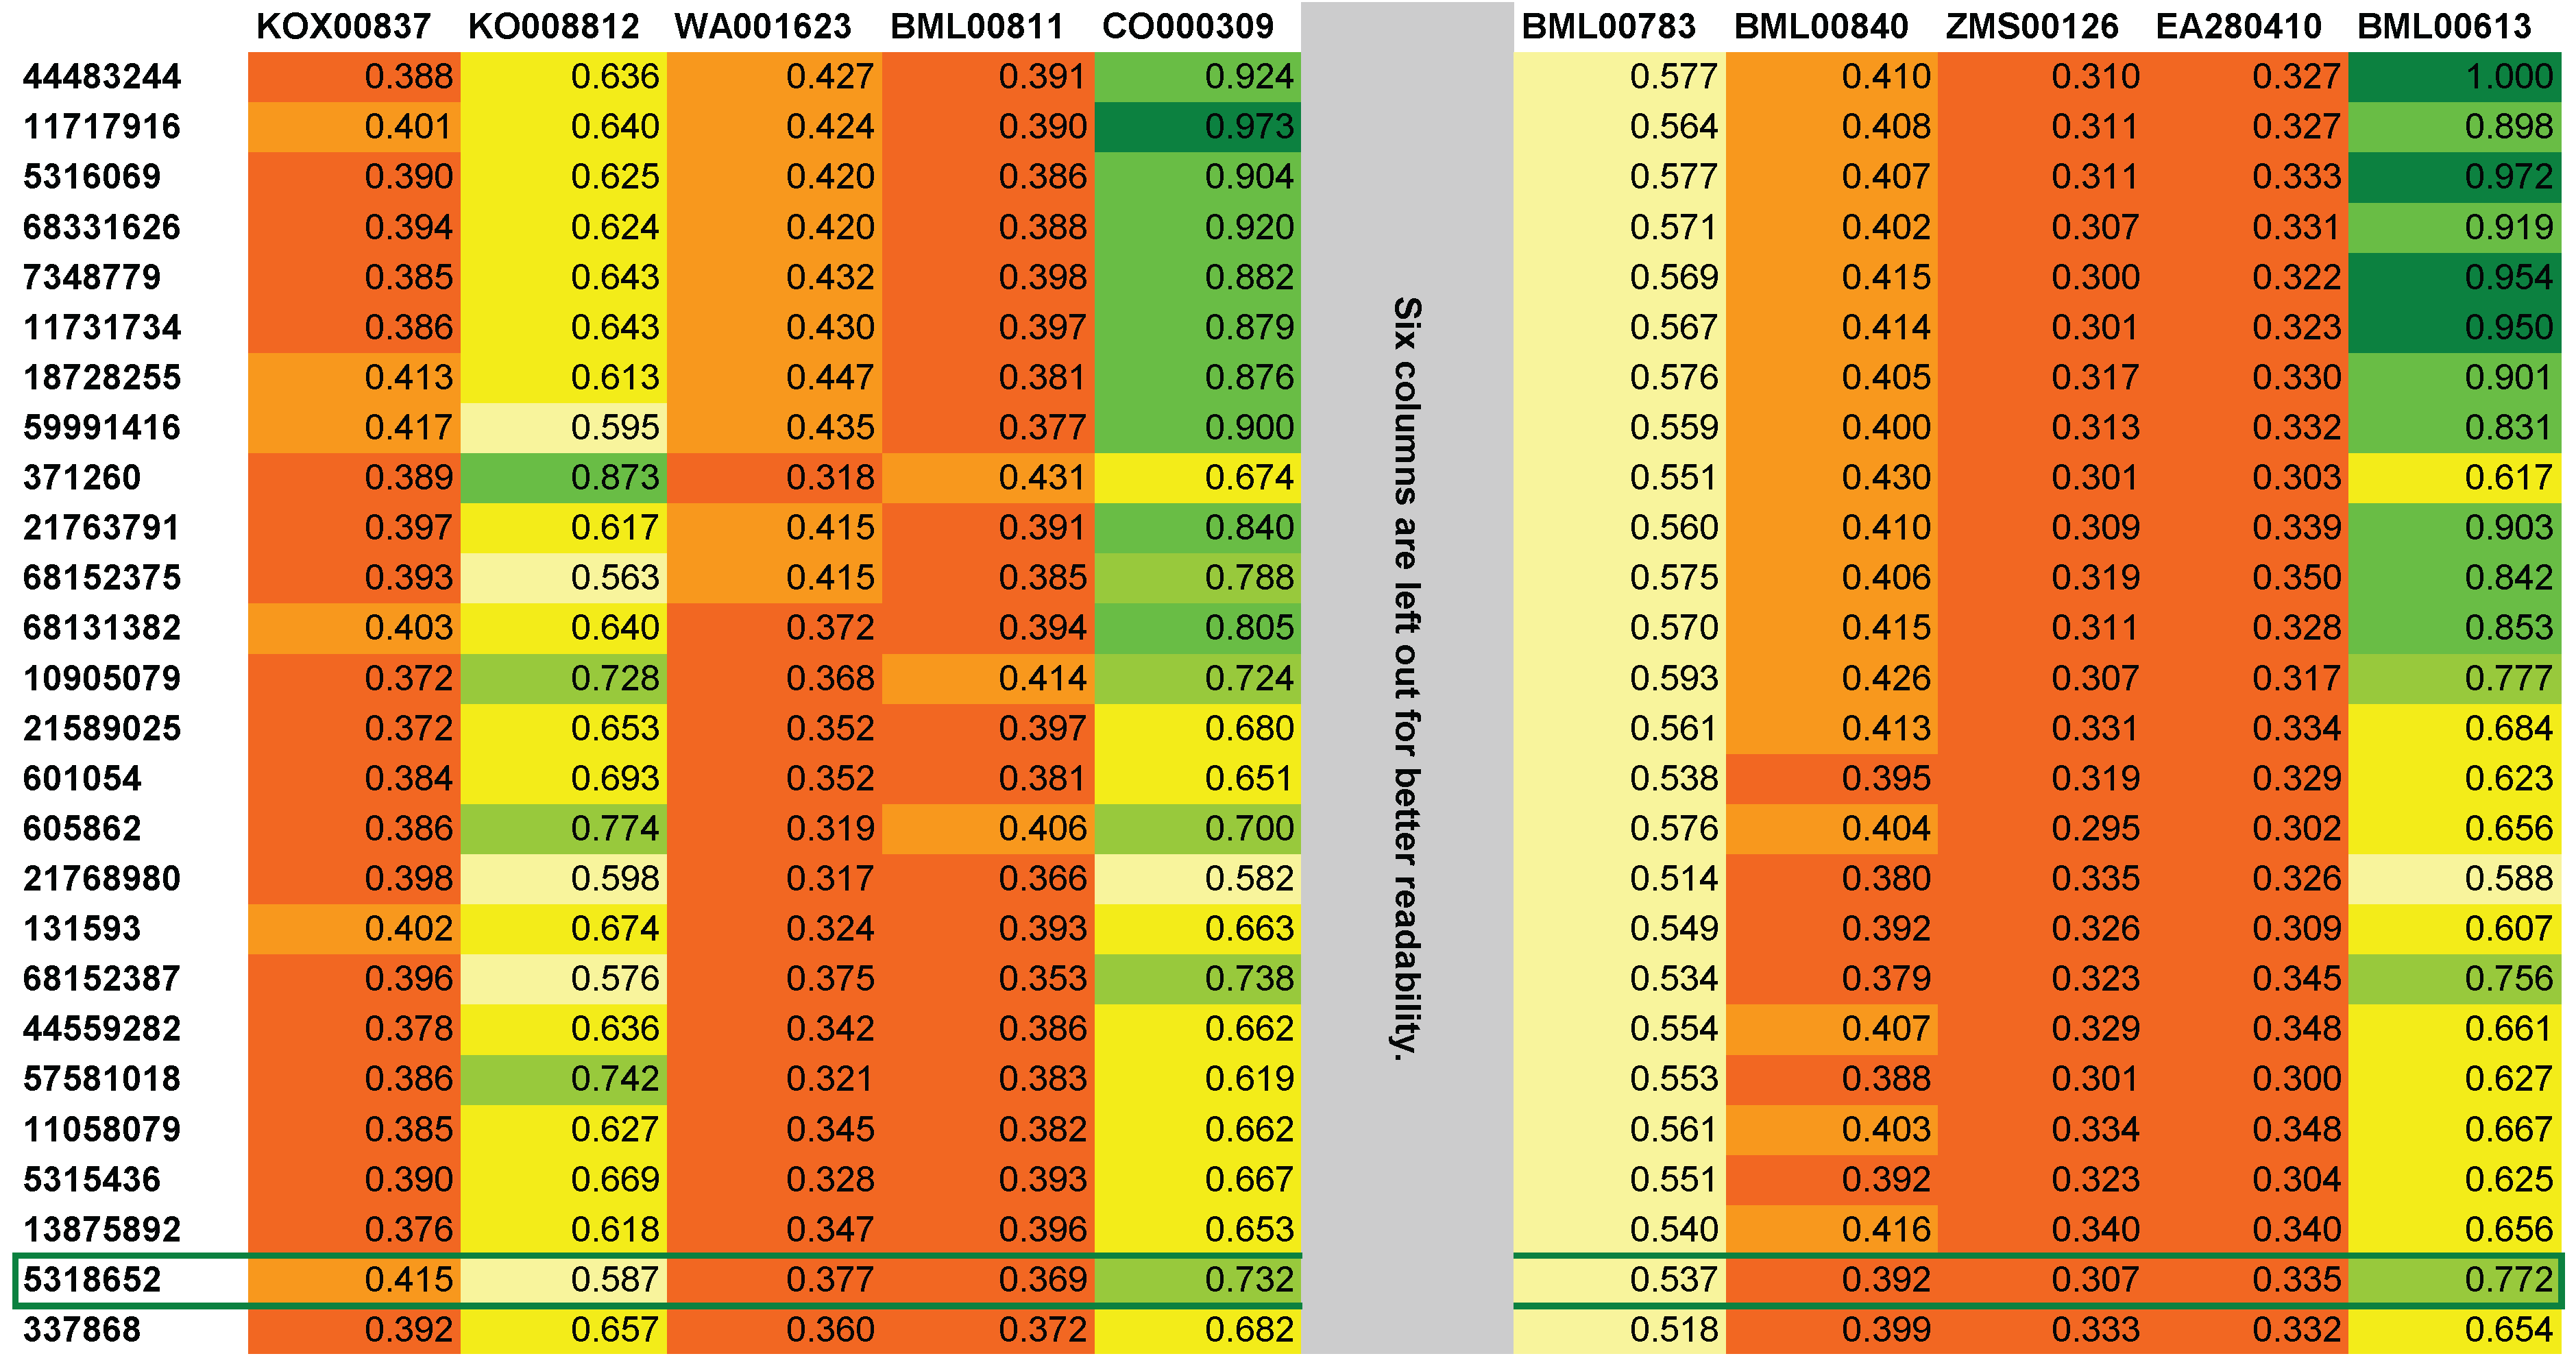
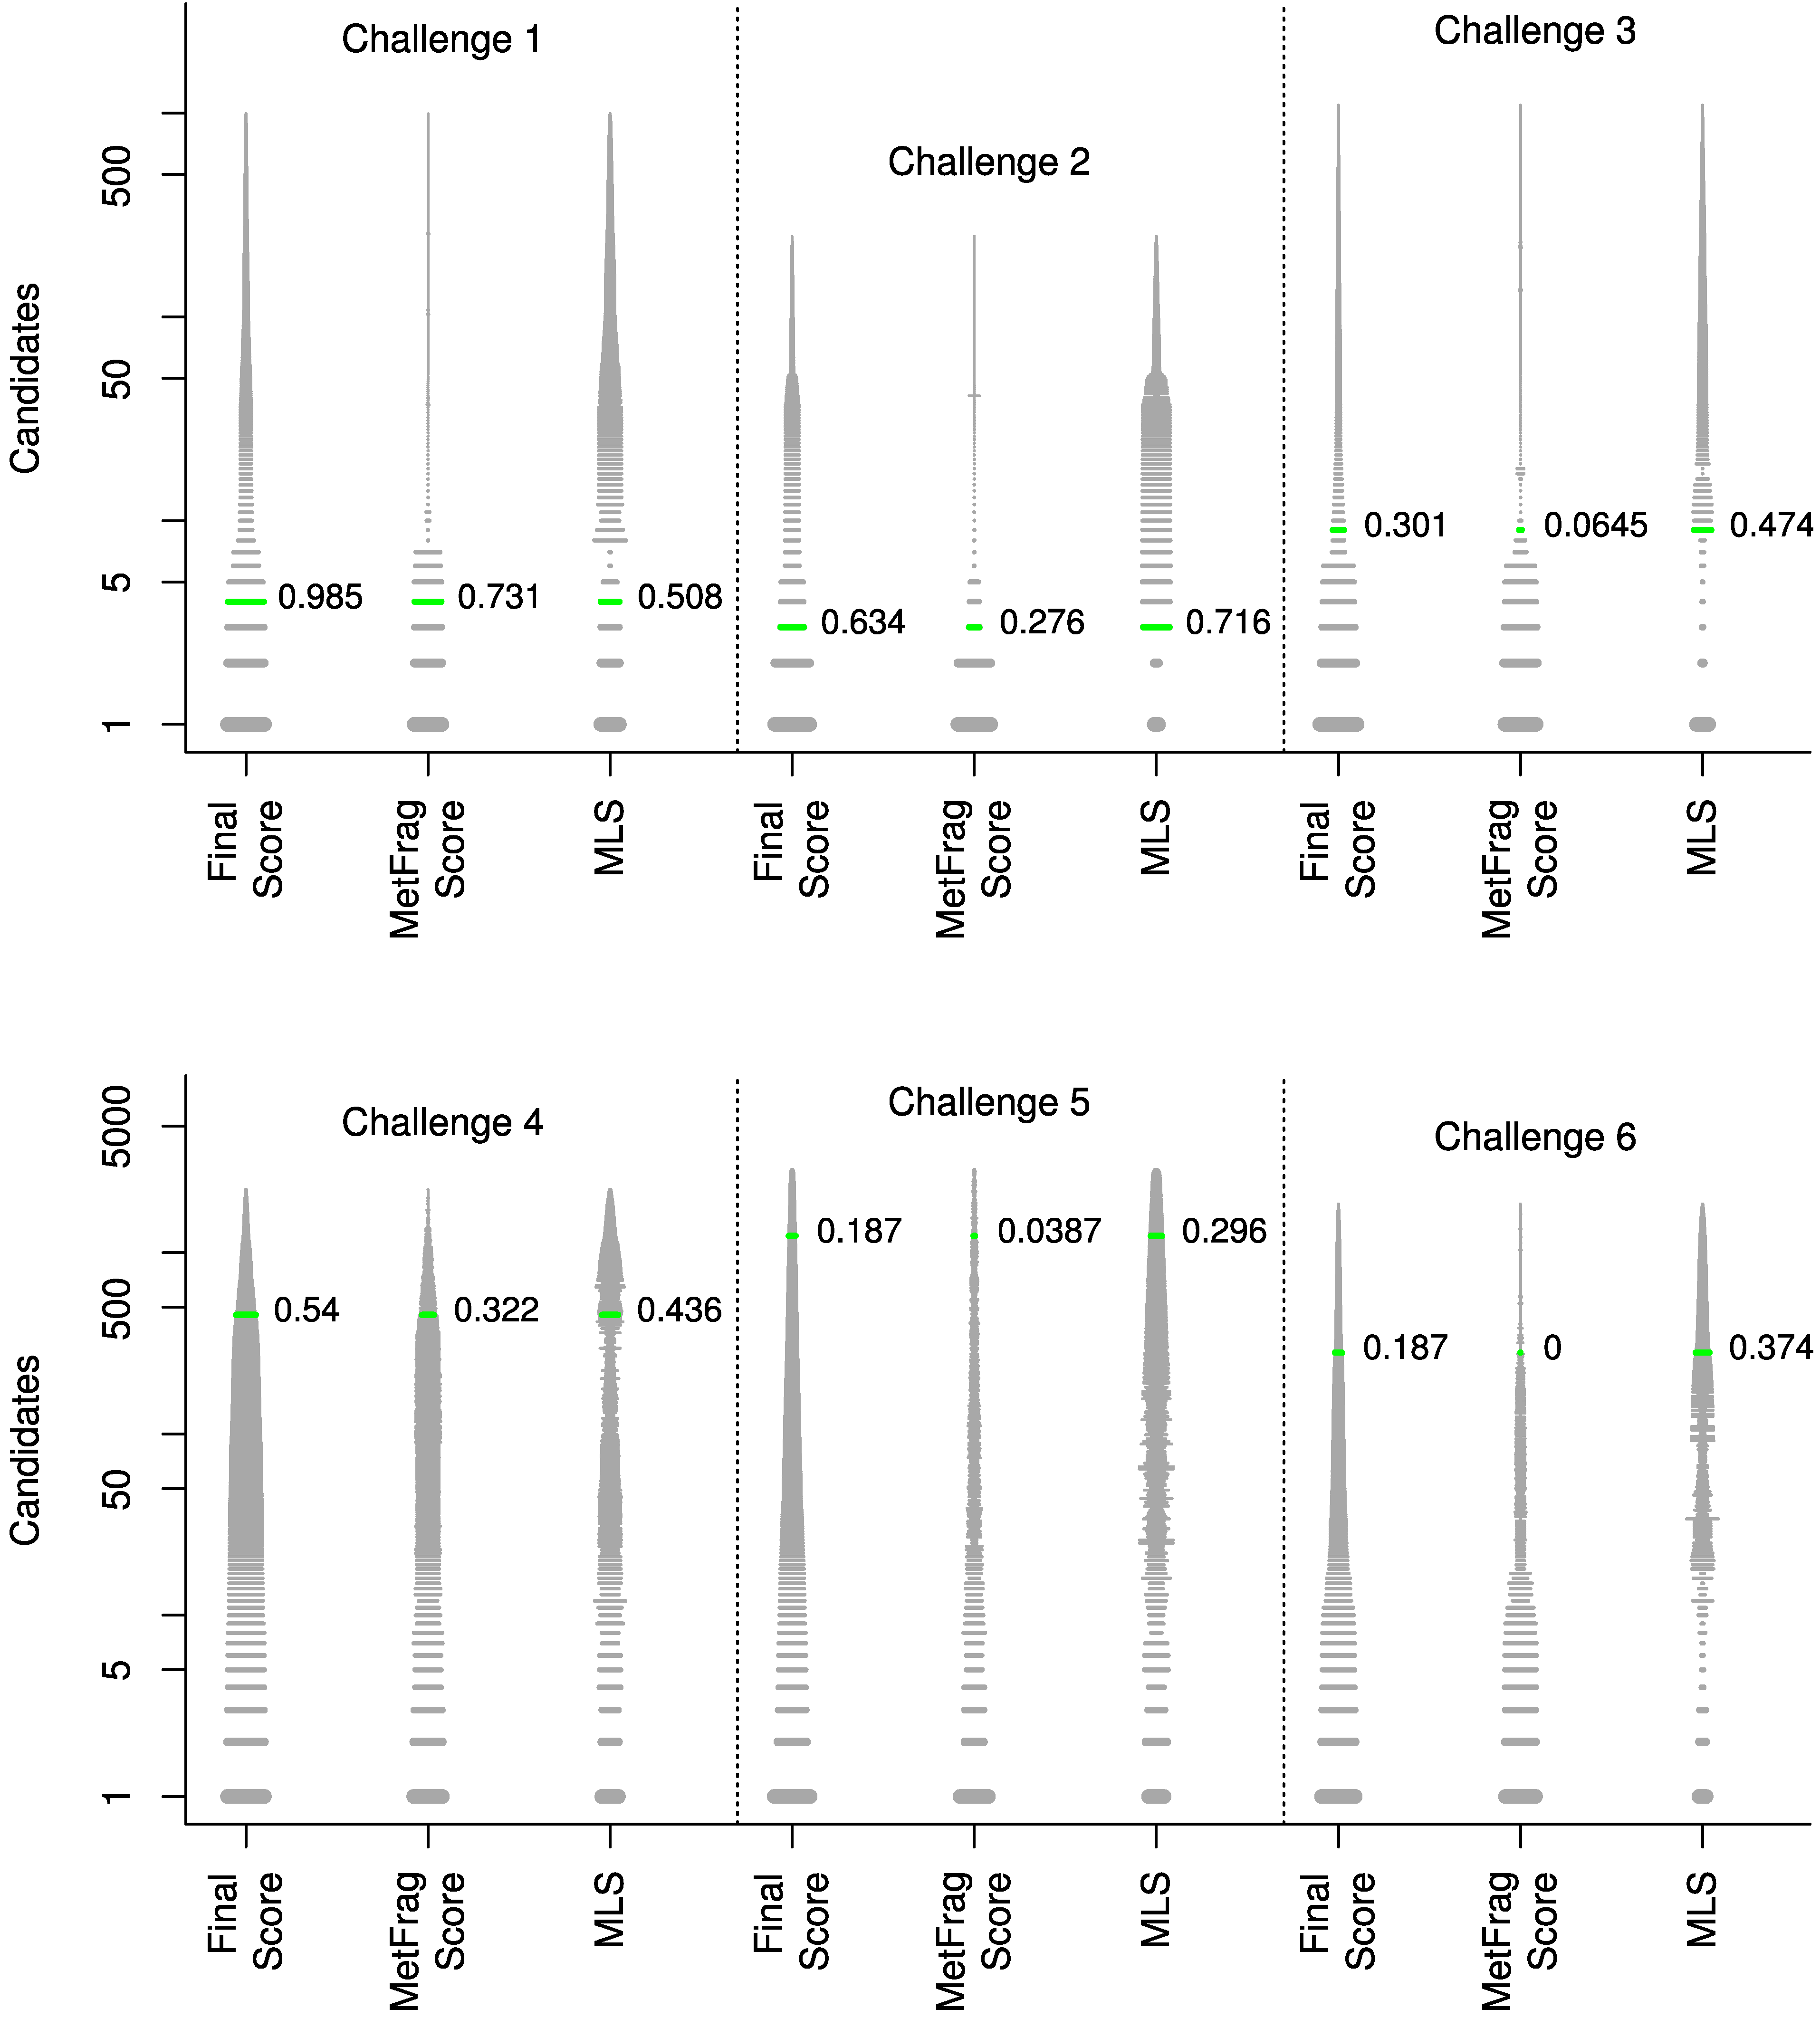
| Challenge | Trivial name | InChIKey (first block) | MLS | MLS rank |
|---|---|---|---|---|
| 1 | Kanamycin A | SBUJHOSQTJFQJX | 0.508 | 47 |
| 2 | 1,2-Bis-O-sinapoyl-beta-D-glucoside | KQDOTXAUJBODDM | 0.716 | 35 |
| 3 | Glucolesquerellin | ZAKICGFSIJSCSF | 0.474 | 3 |
| 4 | Escholtzine | PGINMPJZCWDQNT | 0.436 | 439 |
| 5 | Reticuline | BHLYRWXGMIUIHG | 0.296 | 1209 |
| 6 | Rhoeadine | XRBIHOLQAKITPP | 0.374 | 132 |
3.2. MetFusion
| Natural Product Challenges | Environmental Challenges | ||||||||
|---|---|---|---|---|---|---|---|---|---|
| Chall. | #Cand. | Rank | Max. TS | RRP | Chall. | #Cand. | Rank | Max. TS | RRP |
| 10 | 1085 | 981 | 0.40 | 0.096 | |||||
| 1 | 2229 | 1 | 1.0 | 1.0 | 11 | 1444 | 170 | 0.28 | 0.883 |
| 2 | 625 | 4 | 0.93 | 0.995 | 12 | 3772 | 136 | 0.28 | 0.964 |
| 3 | 2945 | 14 | 0.99 | 0.995 | 13 | 3344 | 1 | 1.0 | 1.0 |
| 4 | 4219 | 74 | 0.84 | 0.983 | 14 | 507 | 3 | 1.0 | 0.996 |
| 5 | 4280 | 1426 | 0.42 | 0.667 | 15 | 3394 | 1 | 1.0 | 1.0 |
| 6 | 6175 | 25 | 0.79 | 0.996 | 16 | 4427 | 1351 | 0.33 | 0.695 |
| 17 | 1848 | 88 | 0.35 | 0.953 | |||||
| Median | 3582 | 20 | 0.89 | 0.995 | 2596 | 112 | 0.38 | 0.959 | |

4. Conclusions
Acknowledgements
Conflict of Interest
References
- Wolf, S.; Schmidt, S.; Müller-Hannemann, M.; Neumann, S. In silico fragmentation for computer assisted identification of metabolite mass spectra. BMC Bioinforma. 2010, 11, 148. [Google Scholar] [CrossRef]
- Schymanski, E.L.; Gallampois, C.M.J.; Krauss, M.; Meringer, M.; Neumann, S.; Schulze, T.; Wolf, S.; Brack, W. Consensus structure elucidation combining GC/EI-MS, structure generation, and calculated properties. Anal. Chem. 2012, 84, 3287–3295. [Google Scholar] [CrossRef]
- Bolton, Evan E.; Wang, Y.; Thiessen, Paul A.; Bryant, Stephen H.; Wheeler, Ralph A.; Spellmeyer, David C. Chapter 12 PubChem: Integrated Platform of Small Molecules and Biological Activities. Elsevier 2008, 4, 217–241. [Google Scholar]
- Horai, H.; Arita, M.; Kanaya, S.; Nihei, Y.; Ikeda, T.; Suwa, K.; Ojima, Y.; Tanaka, K.; Tanaka, S.; Aoshima, K.; et al. MassBank: A public repository for sharing mass spectral data for life sciences. J. Mass. Spectrom. 2010, 45, 703–714. [Google Scholar] [CrossRef]
- Gerlich, M.; Neumann, S. MetFusion: Integration of compound identification strategies. J. Mass Spectrom. 2013, 48, 291–298. [Google Scholar] [CrossRef]
- Smith, C.; Want, E.; O’Maille, G.; Abagyan, R.; Siuzdak, G. XCMS: Processing mass spectrometry data for metabolite profiling using nonlinear peak alignment, matching and identification. Anal. Chem. 2006, 78, 779–787. [Google Scholar] [CrossRef]
- Kazmi, S.; Ghosh, S.; Shin, D.; Hill, D.; Grant, D. Alignment of high resolution mass spectra: Development of a heuristic approach for metabolomics. Metabolomics 2006, 2, 75–83. [Google Scholar] [CrossRef]
- Heller, S.; McNaught, A.; Stein, S.; Tchekhovskoi, D.; Pletnev, I. InChI-the worldwide chemical structure identifier standard. J. Cheminf. 2013, 5, 7. [Google Scholar] [CrossRef]
- Bolton, E.E.; Wang, Y.; Thiessen, P.A.; Bryant, S.H.; Wheeler, R.A.; Spellmeyer, D.C. Chapter 12 PubChem: Integrated platform of small molecules and biological activities. Ann. Rep. Comput. Chem. 2008, 4, 217–241. [Google Scholar] [CrossRef]
- Kind, T.; Fiehn, O. Seven Golden Rules for heuristic filtering of molecular formulas obtained by accurate mass spectrometry. BMC Bioinformatics 2007, 8, 105. [Google Scholar] [CrossRef]
- Peironcely, J.E.; Reijmers, T.; Coulier, L.; Bender, A.; Hankemeier, T. Understanding and classifying metabolite space and metabolite-likeness. PLoS One 2011, 6, e28966. [Google Scholar]
- Liaw, A.; Wiener, M. Classification and regression by randomforest. R News 2002, 2, 18–22. [Google Scholar]
- Wishart, D.S.; Tzur, D.; Knox, C.; Eisner, R.; Guo, A.C.; Young, N.; Cheng, D.; Jewell, K.; Arndt, D.; Sawhney, S.; et al. HMDB: The human metabolome database. Nucleic Acids Res. 2007, 35, D521–D526. [Google Scholar] [CrossRef]
- Irwin, J.J.; Sterling, T.; Mysinger, M.M.; Bolstad, E.S.; Coleman, R.G. ZINC: A free tool to discover chemistry for biology. J. Chem. Inf. Model 2012, 52, 1757–1768. [Google Scholar] [CrossRef]
- Steinbeck, C.; Han, Y.; Kuhn, S.; Horlacher, O.; Luttmann, E.; Willighagen, E. The chemistry development kit (CDK): An open-source java library for chemo-and bioinformatics. J. Chem. Inf. Comput. Sci. 2003, 43, 493–500. [Google Scholar] [CrossRef]
- Schymanski, E.L.; Neumann, S. CASMI: And the winner is …. Metabolites 2013, 3, 412–439. [Google Scholar] [CrossRef]
- Allwood, J.W.; Weber, R.J.; Zhou, J.; He, S.; Viant, M.R.; Dunn, W.B. CASMI–The small molecule identification process from a Birmingham perspective. Metabolites 2013, 3, 397–411. [Google Scholar] [CrossRef]
- Gerlich, M.; Neumann, S. KEGG: Kyoto Encyclopedia of Genes and Genomes. Nucleic Acids Res 27 1999, 1, 29–34. [Google Scholar]
- Meringer, M.; Schymanski, E.L. Small molecule identification with MOLGEN and mass spectrometry. Metabolites 2013, 3, 440–462. [Google Scholar] [CrossRef]
Appendix
A. Additional MetFrag Results
| Natural Product Challenges | Environmental Challenges | ||||||||
|---|---|---|---|---|---|---|---|---|---|
| Chall. | #Cand. | Rank | RRP | MLS | RRP | Chall. | #Cand. | Rank | RRP |
| 10 | 257 | 170 | 0.377 | ||||||
| 1 | 9 | 5 | 0.500 | 4 | 0.625 | 11 | 104 | 9 | 0.961 |
| 2 | 43 | 1 | 1.000 | 1 | 1.000 | 12 | 950 | 26 | 0.975 |
| 3 | 2 | 2 | 0.500 | 1 | 1.000 | 13 | 22 | 4 | 0.929 |
| 4 | 2005 | 534 | 0.735 | 444 | 0.779 | 14 | 111 | 19 | 0.859 |
| 5 | 2429 | 754 | 0.714 | 920 | 0.623 | 15 | 1789 | 172 | 0.905 |
| 6 | 1250 | 1250 | 0.416 | 234 | 0.814 | 16 | 1397 | 1397 | 0.438 |
| 17 | 415 | 15 | 0.966 | ||||||
| Median | 646 | 270 | 0.607 | 119 | 0.797 | 336 | 22.5 | 0.917 | |

B. Spectral Merging

© 2013 by the authors; licensee MDPI, Basel, Switzerland. This article is an open access article distributed under the terms and conditions of the Creative Commons Attribution license (http://creativecommons.org/licenses/by/3.0/).
Share and Cite
Ruttkies, C.; Gerlich, M.; Neumann, S. Tackling CASMI 2012: Solutions from MetFrag and MetFusion. Metabolites 2013, 3, 623-636. https://doi.org/10.3390/metabo3030623
Ruttkies C, Gerlich M, Neumann S. Tackling CASMI 2012: Solutions from MetFrag and MetFusion. Metabolites. 2013; 3(3):623-636. https://doi.org/10.3390/metabo3030623
Chicago/Turabian StyleRuttkies, Christoph, Michael Gerlich, and Steffen Neumann. 2013. "Tackling CASMI 2012: Solutions from MetFrag and MetFusion" Metabolites 3, no. 3: 623-636. https://doi.org/10.3390/metabo3030623
APA StyleRuttkies, C., Gerlich, M., & Neumann, S. (2013). Tackling CASMI 2012: Solutions from MetFrag and MetFusion. Metabolites, 3(3), 623-636. https://doi.org/10.3390/metabo3030623