Development of a Direct Headspace Collection Method from Arabidopsis Seedlings Using HS-SPME-GC-TOF-MS Analysis

Abstract

1. Introduction
2. Results and Discussion
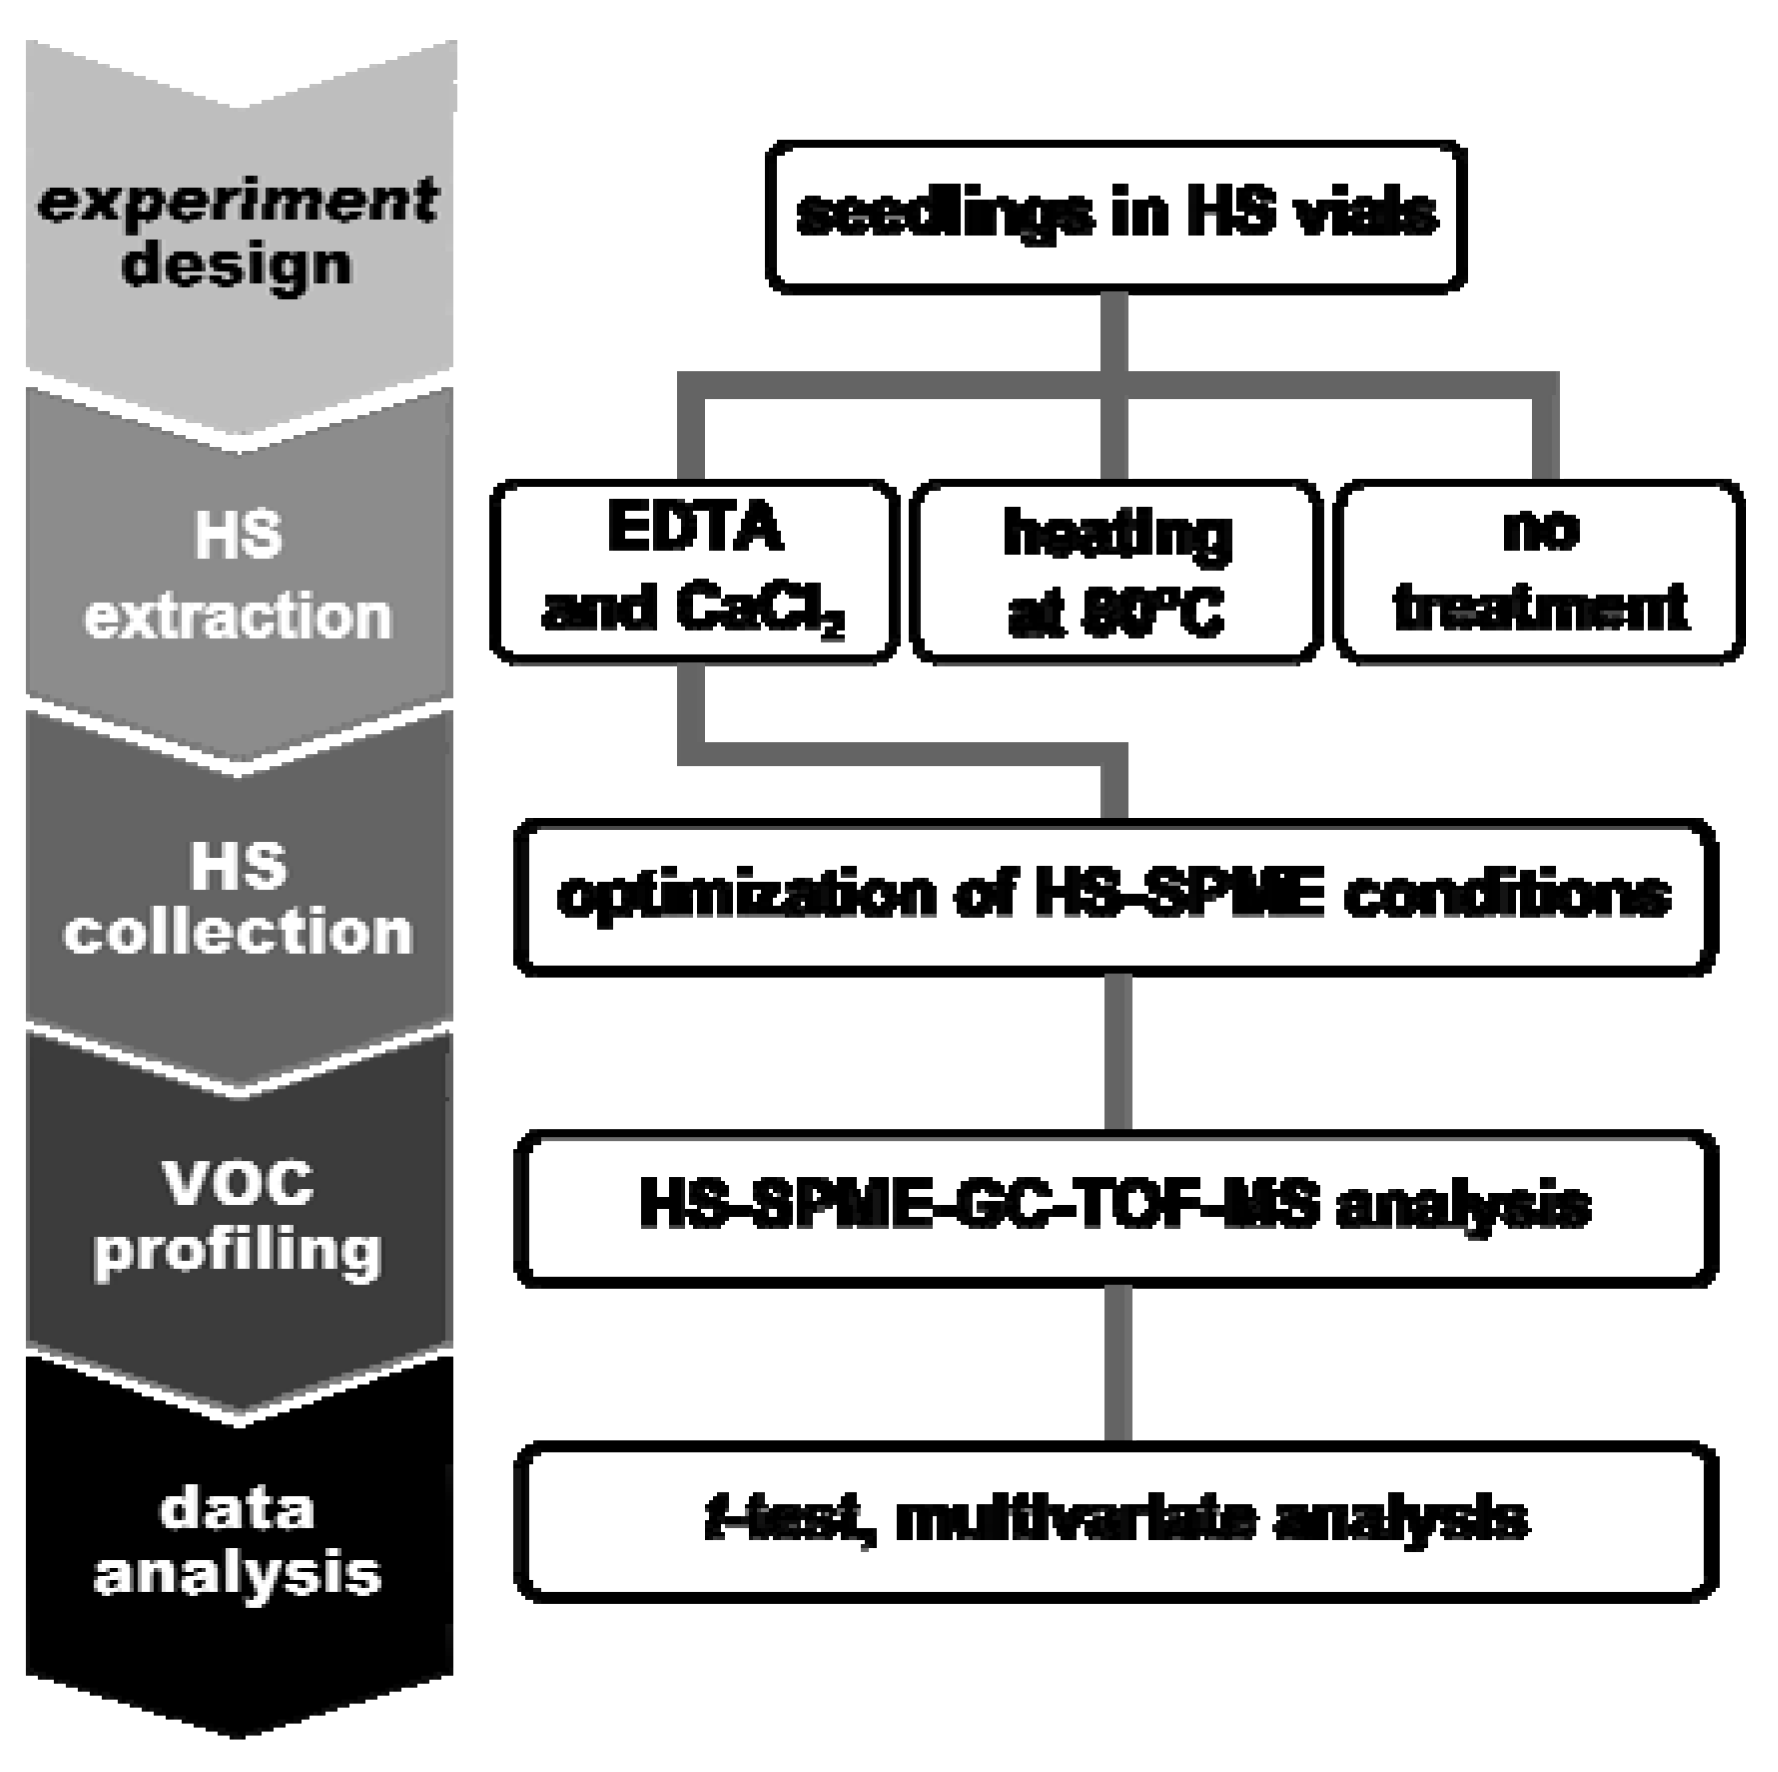
2.1. Experiment Design for VOC Profiling in the HS of Arabidopsis Seedlings
2.2. Optimization of HS Collection for VOC Profiling
2.2.1. HS Extraction
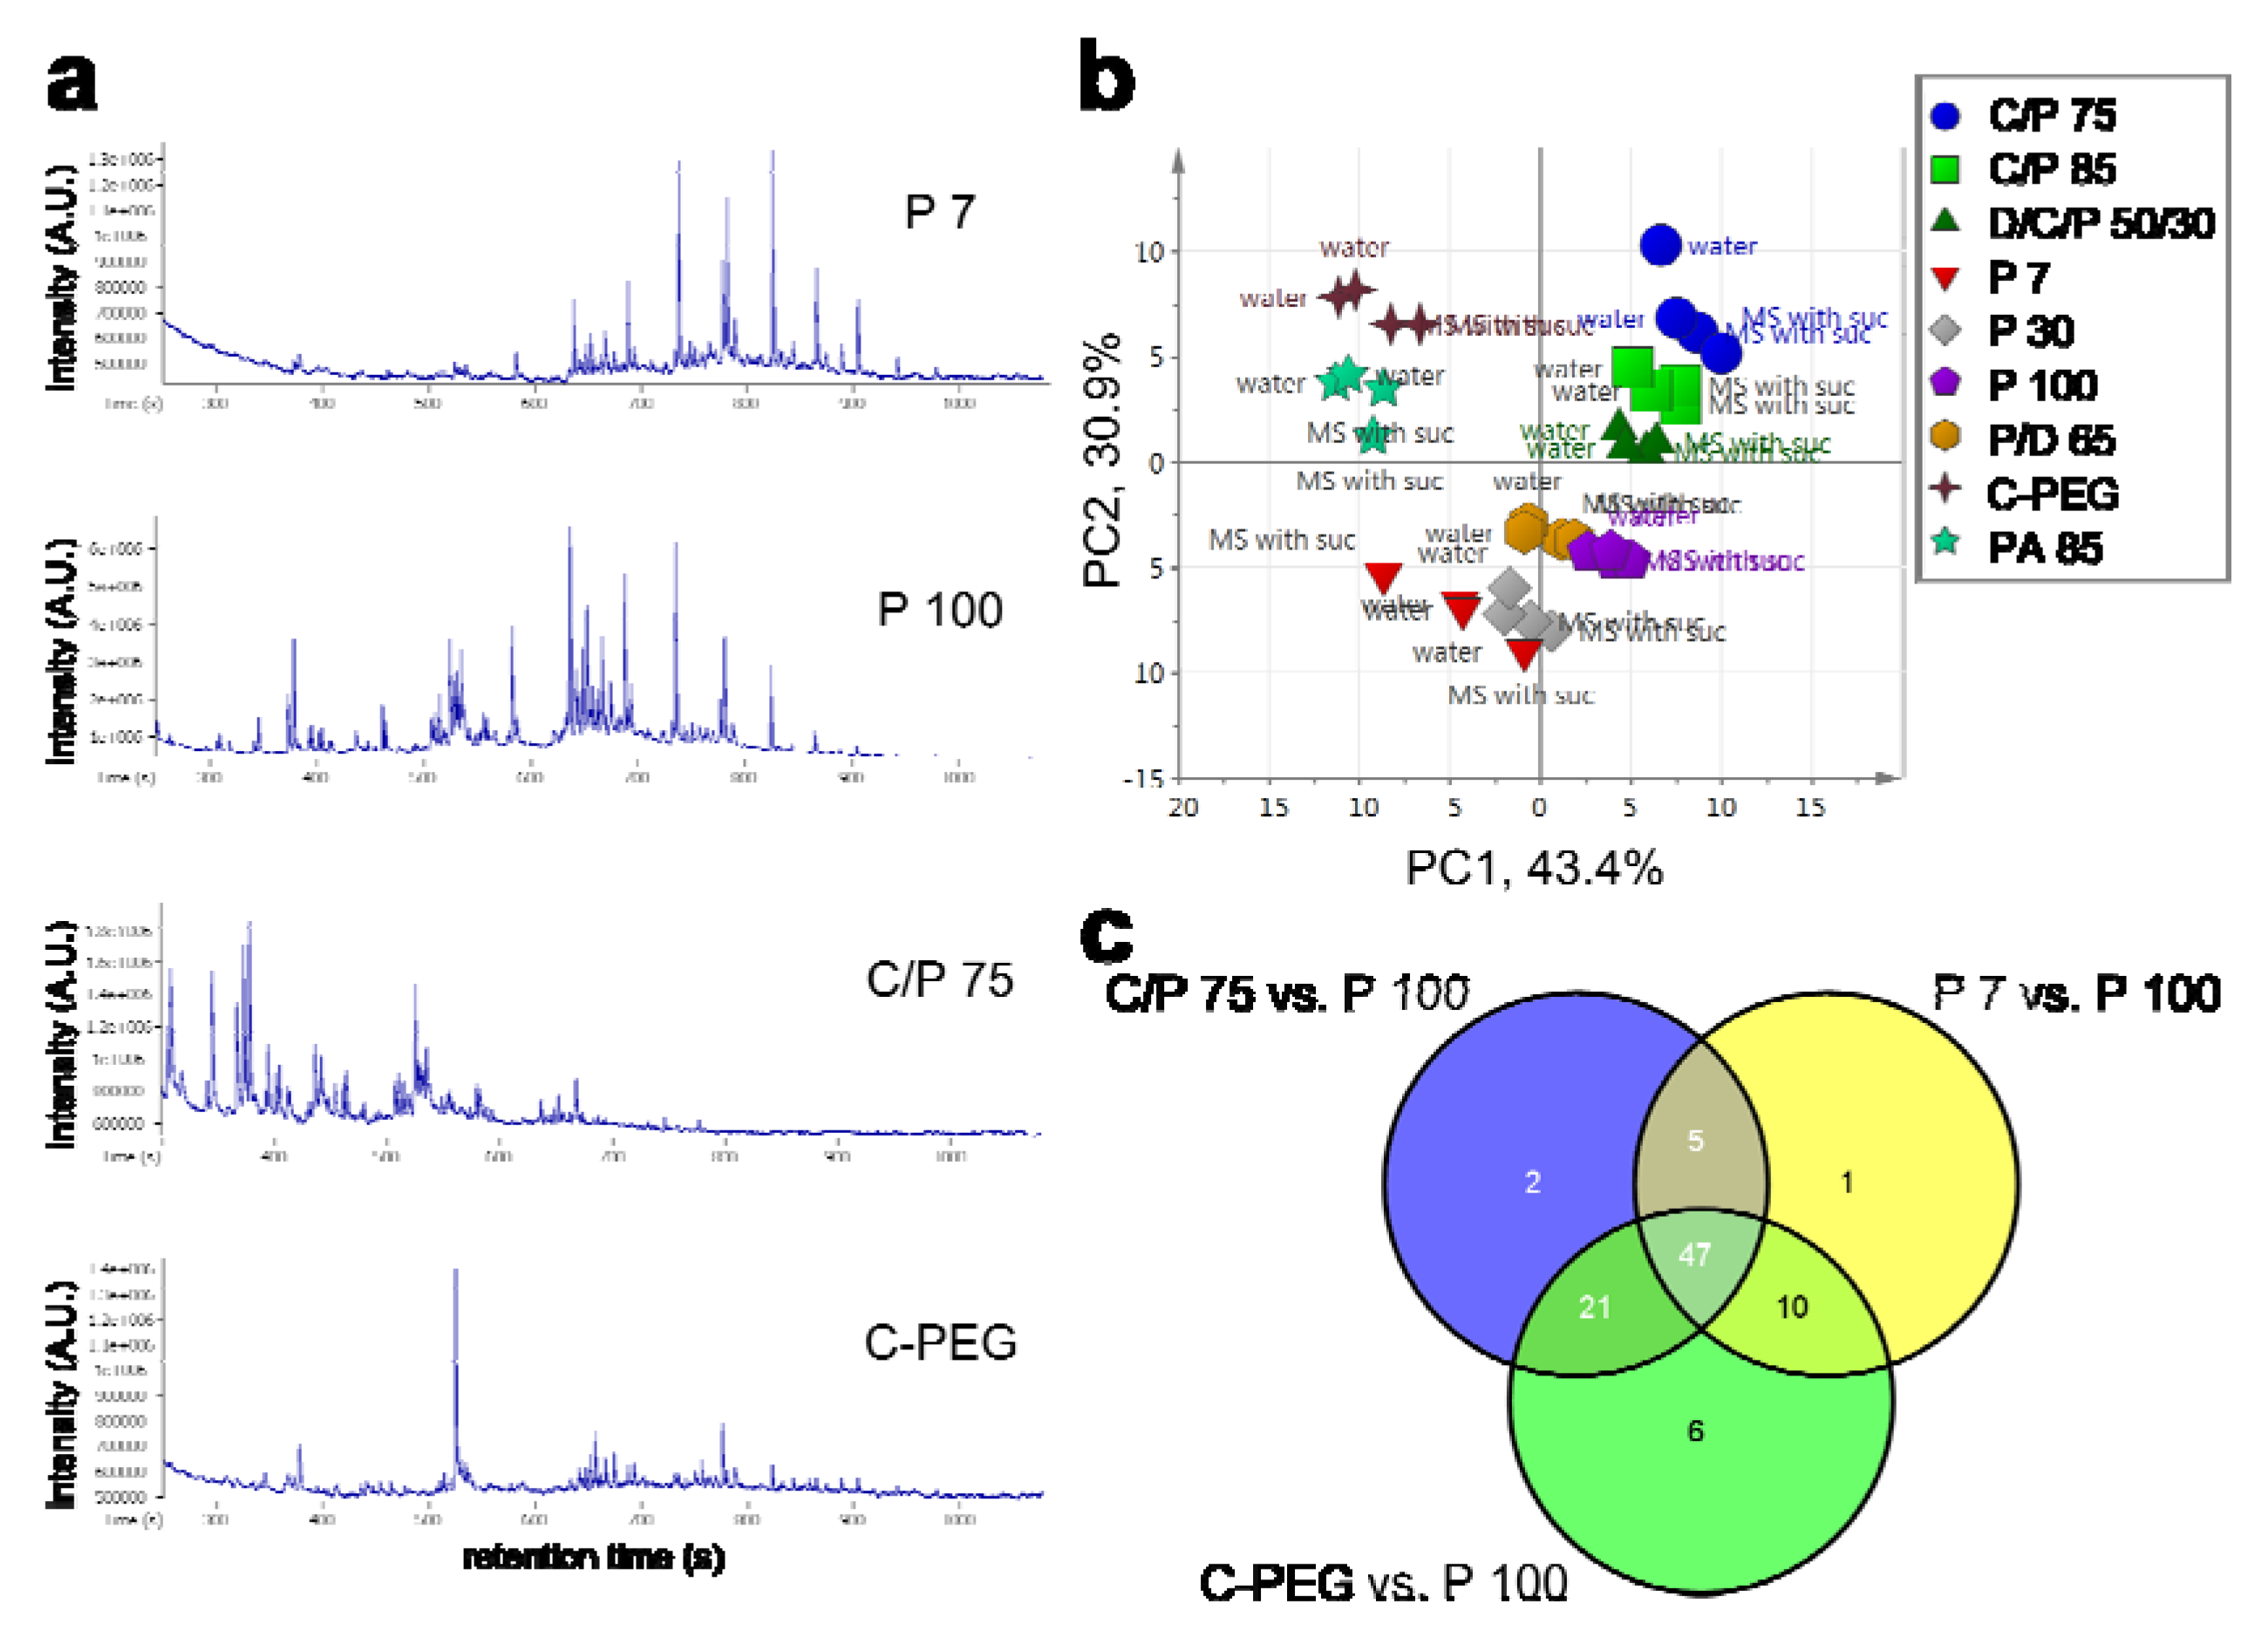
2.2.2. SPME Fiber Selection

| Compound annotation | log2-FC (C/P 75 vs. P 100) | FDR | log2-FC (P 7 vs. P 100) | FDR | log2-FC (C-PEG vs. P 100) | FDR |
|---|---|---|---|---|---|---|
| Heptane, 5-ethyl-2-methyl- | 3.8 | 0.0000 | n.s. | n.s. | ||
| Dodecane, 4,6-dimethyl- | 2.5 | 0.0046 | n.s. | n.s. | ||
| 45514 | n.s. | 4.6 | 0.0139 | n.s. | ||
| 1H-Indole, 1-methoxy- | n.s. | n.s. | 4.5 | 0.0090 | ||
| 2-Undecanone | n.s. | n.s. | 4.4 | 0.0000 | ||
| Undecanal | n.s. | n.s. | 3.7 | 0.0001 | ||
| Biphenyl | n.s. | n.s. | 6.6 | 0.0000 | ||
| Dodecanal | n.s. | n.s. | 3.9 | 0.0000 | ||
| n-Tridecan-1-ol | n.s. | n.s. | 5.4 | 0.0010 |
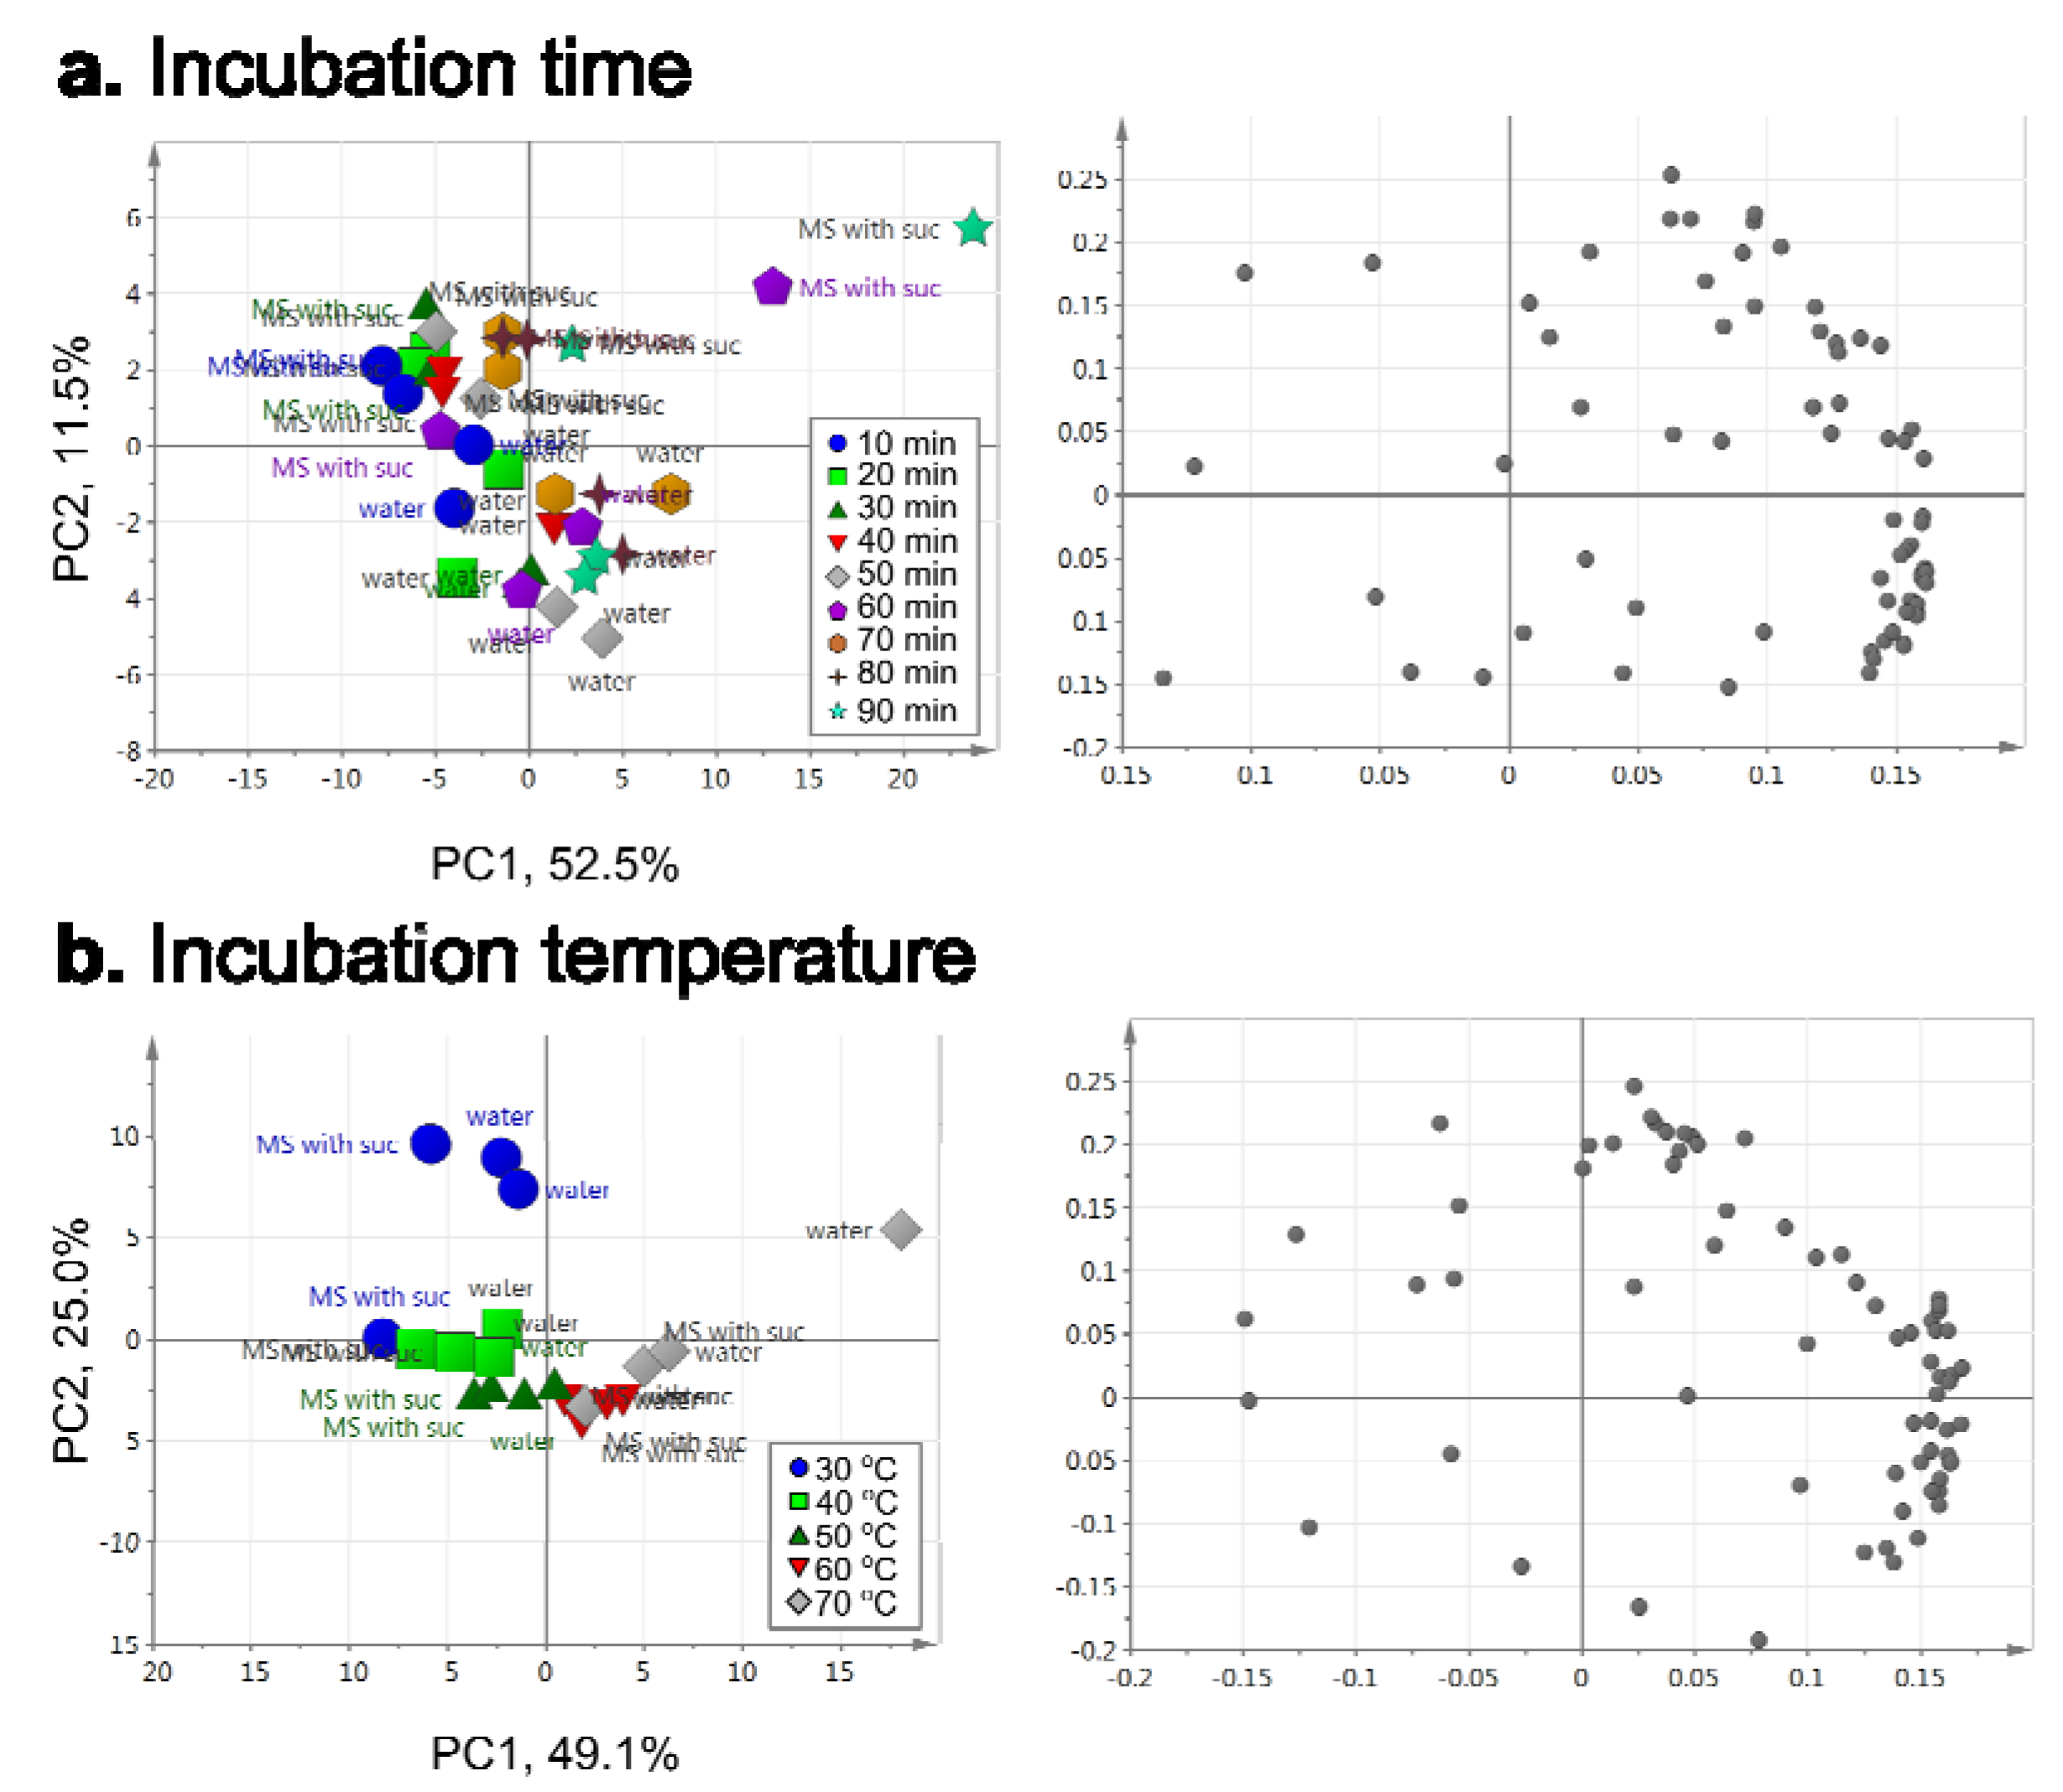
2.2.3. Optimization of Incubation Conditions
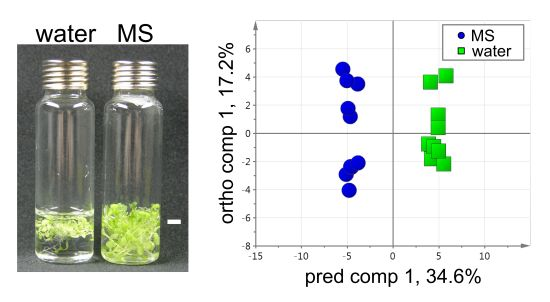
2.3. VOC Profiling by Using a Developed Workflow – A Case Example
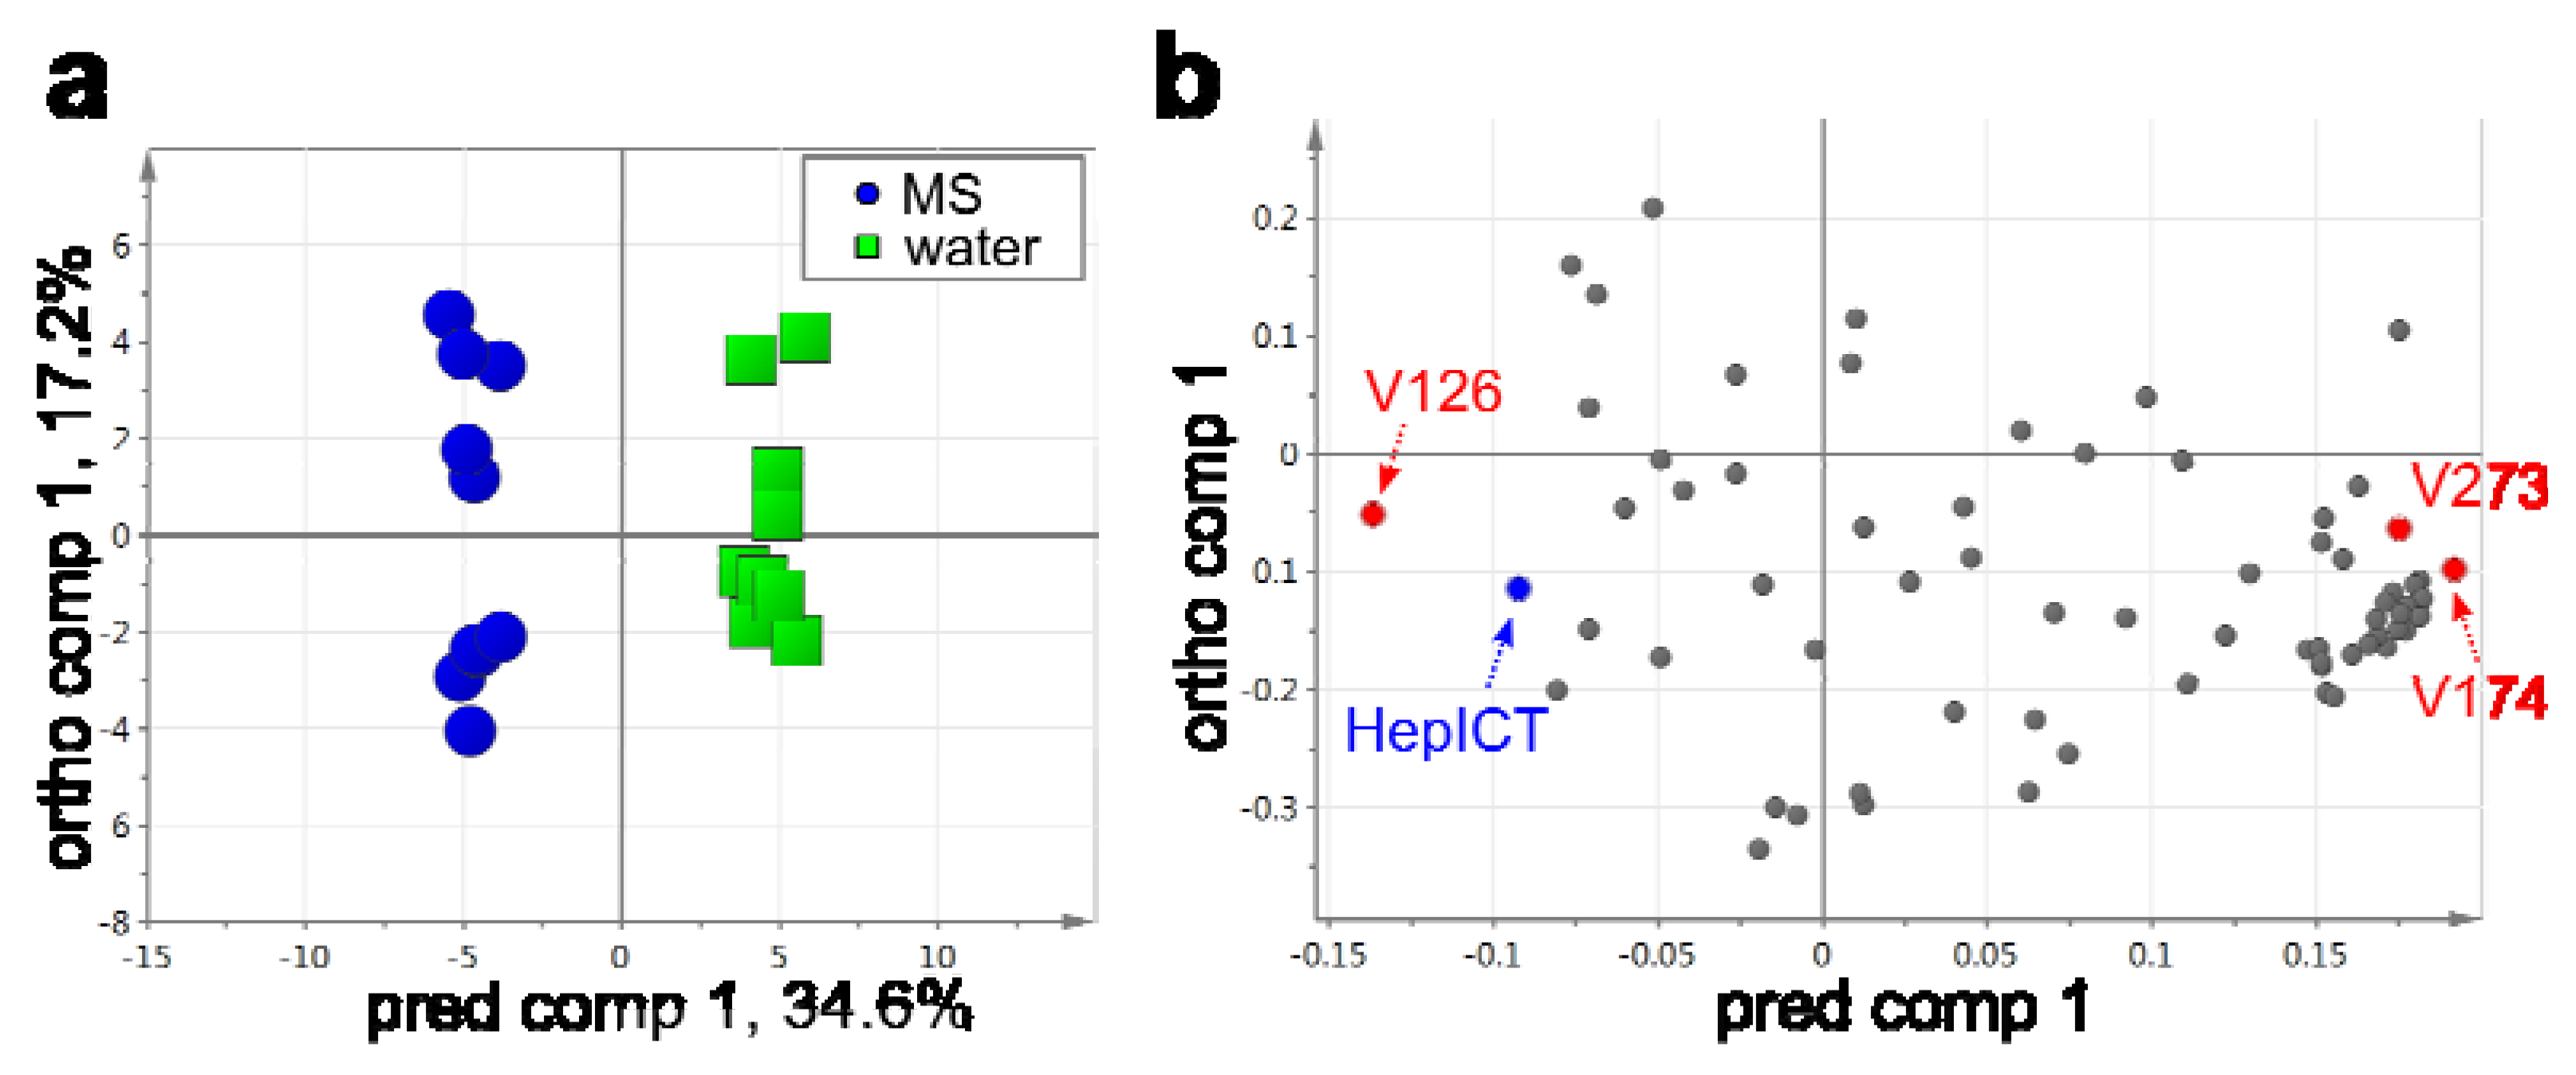
| Peak ID | Compound annotation | log2-FC (water vs. MS) | FDR |
|---|---|---|---|
| V126 | 3-Buten-2-one, 4-(2,6,6-trimethyl-1-cyclohexen-1-yl)-, (E)- | -4.1 | 0.0000 |
| V130 | Phenol, 2,4-bis(1,1-dimethylethyl)- | 3.4 | 0.0000 |
| V143 | 47409 | 1.3 | 0.0160 |
| V154 | 45485 | 2.1 | 0.0126 |
| V172 | Hexadecanal | 1.3 | 0.0239 |
| V173 | 1,1'-Biphenyl, 2,2',5,5'-tetramethyl- | 1.6 | 0.0069 |
| V174 | calamenen-10-one | 1.7 | 0.0126 |
| V194 | Phthalic acid, decyl isobutyl ester | 1.6 | 0.0307 |
| V273 | 1-Phenanthrenecarboxylic acid, 1,2,3,4,4a,9,10,10a-octahydro-1,4a-dimethyl-7-(1-methylethyl)-, methyl ester, [1R-(1π4aπ10aπ]- | 2.2 | 0.0261 |
3. Experimental Section
3.1. Chemicals
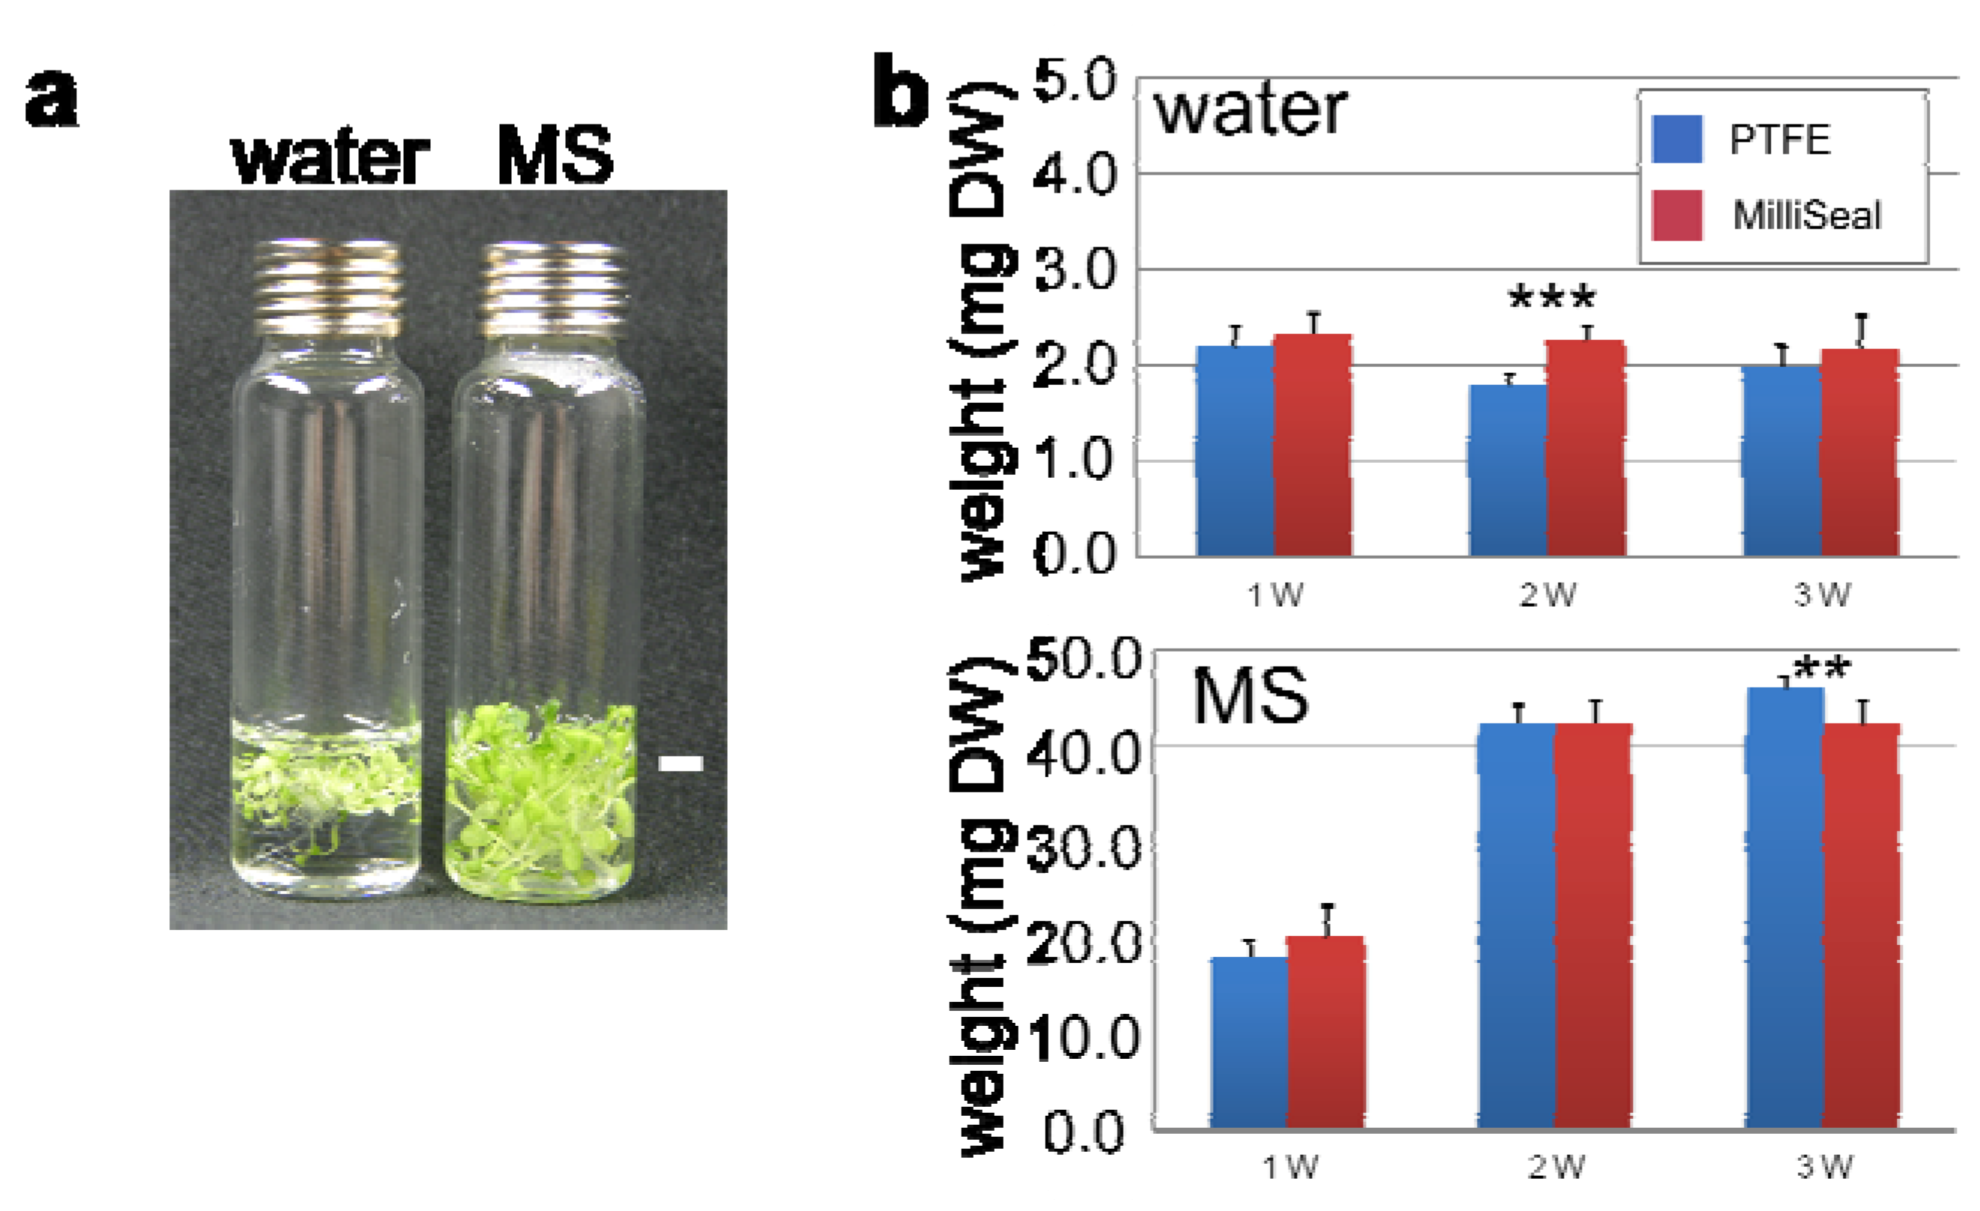
3.2. Plant Material
3.3. Headspace Collection and HS-SPME-GC-MS Analysis
| SPME fiber | Conditioning temperature ( °C) | Conditioning time (h) | Inlet temperature ( °C) |
| 100-μm PDMS | 250 | 0.5 | 220 |
| 30-μm PDMS | 250 | 0.5 | 220 |
| 7-μm PDMS | 320 | 0.5 | 220 |
| 85-μm polyacrylate | 280 | 1 | 220 |
| 60-μm PEG | 240 | 0.5 | 220 |
| 75-μm CAR/PDMS | 300 | 1 | 280 |
| 85-μm CAR/PDMS | 300 | 1 | 280 |
| 65-μm PDMS/DVB | 250 | 0.5 | 250 |
| 50/30-μm DVB/CAR/PDMS | 270 | 0.5 | 250 |
3.4. Data Processing
3.5. Data Analysis
4. Conclusions
Acknowledgments
Conflict of Interest
References and Notes
- Hakim, M.; Broza, Y.Y.; Barash, O.; Peled, N.; Phillips, M.; Amann, A.; Haick, H. Volatile Organic Compounds of Lung Cancer and Possible Biochemical Pathways. Chem. Rev. 2012, 112, 5949–5966. [Google Scholar] [CrossRef]
- Peled, N.; Hakim, M.; Bunn, P.A.; Miller, Y.E.; Kennedy, T.C.; Mattei, J.; Mitchell, J.D.; Hirsch, F.R.; Haick, H. Non-invasive Breath Analysis of Pulmonary Nodules. J. Thorac. Oncol. 2012, 7, 1528–1533. [Google Scholar] [CrossRef]
- Buszewski, B.; Ligor, T.; Jezierski, T.; Wenda-Piesik, A.; Walczak, M.; Rudnicka, J. Identification of volatile lung cancer markers by gas chromatography-mass spectrometry: comparison with discrimination by canines. Anal. Bioanal. Chem. 2012, 404, 141–146. [Google Scholar] [CrossRef]
- Phillips, M.; Cataneo, R.N.; Saunders, C.; Hope, P.; Schmitt, P.; Wai, J. Volatile biomarkers in the breath of women with breast cancer. J. Breath Res. 2010, 4. [Google Scholar]
- de Gennaro, G.; Dragonieri, S.; Longobardi, F.; Musti, M.; Stallone, G.; Trizio, L.; Tutino, M. Chemical characterization of exhaled breath to differentiate between patients with malignant plueral mesothelioma from subjects with similar professional asbestos exposure. Anal. Bioanal. Chem. 2010, 398, 3043–3050. [Google Scholar] [CrossRef]
- Abaffy, T.; Duncan, R.; Riemer, D.D.; Tietje, O.; Elgart, G.; Milikowski, C.; DeFazio, R.A. Differential Volatile Signatures from Skin, Naevi and Melanoma: A Novel Approach to Detect a Pathological Process. PLoS One 2010, 5. [Google Scholar]
- Barash, O.; Peled, N.; Hirsch, F.R.; Haick, H. Sniffing the unique "odor print" of non-small-cell lung cancer with gold nanoparticles. Small 2009, 5, 2618–2624. [Google Scholar] [CrossRef]
- Gordon, S.M.; Szidon, J.P.; Krotoszynski, B.K.; Gibbons, R.D.; Oneill, H.J. Volatile organic-compounds in exhaled air from patients with lung-cancer. Clin. Chem. 1985, 31, 1278–1282. [Google Scholar]
- Haick, H.; Hakim, M.; Patrascu, M.; Levenberg, C.; Shehada, N.; Nakhoul, F.; Abassi, Z. Sniffing chronic renal failure in rat model by an array of random networks of single-walled carbon nanotubes. Acs. Nano. 2009, 3, 1258–1266. [Google Scholar] [CrossRef]
- Peled, N.; Ionescu, R.; Nol, P.; Barash, O.; McCollum, M.; VerCauteren, K.; Koslow, M.; Stahl, R.; Rhyan, J.; Haick, H. Detection of volatile organic compounds in cattle naturally infected with Mycobacterium bovis. Sensor Actuat. B-Chem. 2012, 171, 588–594. [Google Scholar] [CrossRef]
- Leff, J.W.; Fierer, N. Volatile organic compound (VOC) emissions from soil and litter samples. Soil Biol. Biochem. 2008, 40, 1629–1636. [Google Scholar] [CrossRef]
- Ryu, C.M.; Farag, M.A.; Hu, C.H.; Reddy, M.S.; Kloepper, J.W.; Pare, P.W. Bacterial volatiles induce systemic resistance in Arabidopsis. Plant Physiol. 2004, 134, 1017–1026. [Google Scholar] [CrossRef]
- Ryu, C.M.; Farag, M.A.; Hu, C.H.; Reddy, M.S.; Wei, H.X.; Pare, P.W.; Kloepper, J.W. Bacterial volatiles promote growth in Arabidopsis. Proc. Natl. Acad. Sci. USA 2003, 100, 4927–4932. [Google Scholar]
- Kai, M.; Haustein, M.; Molina, F.; Petri, A.; Scholz, B.; Piechulla, B. Bacterial volatiles and their action potential. Appl. Microbiol. Biot. 2009, 81, 1001–1012. [Google Scholar] [CrossRef]
- Weise, T.; Kai, M.; Gummesson, A.; Troeger, A.; von Reuss, S.; Piepenborn, S.; Kosterka, F.; Sklorz, M.; Zimmermann, R.; Francke, W.; Piechulla, B. Volatile organic compounds produced by the phytopathogenic bacterium Xanthomonas campestris pv. vesicatoria 85–10. Beilstein J. Org. Chem. 2012, 8, 579–596. [Google Scholar] [CrossRef]
- Knudsen, J.T.; Eriksson, R.; Gershenzon, J.; Stahl, B. Diversity and distribution of floral scent. Botanical Rev. 2006, 72, 1–120. [Google Scholar] [CrossRef]
- Dudareva, N.; Negre, F.; Nagegowda, D.A.; Orlova, I. Plant volatiles: Recent advances and future perspectives. Crit Rev. Plant Sci. 2006, 25, 417–440. [Google Scholar] [CrossRef]
- D'Alessandro, M.; Turlings, T.C.J. Advances and challenges in the identification of volatiles that mediate interactions among plants and arthropods. Analyst 2006, 131, 24–32. [Google Scholar] [CrossRef]
- Loreto, F.; Schnitzler, J.P. Abiotic stresses and induced BVOCs. Trends Plant Sci. 2010, 15, 154–166. [Google Scholar] [CrossRef]
- Kegge, W.; Pierik, R. Biogenic volatile organic compounds and plant competition. Trends Plant Sci. 2010, 15, 126–132. [Google Scholar] [CrossRef]
- Dicke, M.; van Loon, J.J.; Soler, R. Chemical complexity of volatiles from plants induced by multiple attack. Nat. Chem. Biol. 2009, 5, 317–324. [Google Scholar] [CrossRef]
- Tholl, D.; Boland, W.; Hansel, A.; Loreto, F.; Rose, U.S.; Schnitzler, J.P. Practical approaches to plant volatile analysis. Plant J. 2006, 45, 540–560. [Google Scholar] [CrossRef]
- Badoil, L.; Benanou, D. Characterization of volatile and semivolatile compounds in waste landfill leachates using stir bar sorptive extraction-GC/MS. Anal. Bioanal. Chem. 2009, 393, 1043–1054. [Google Scholar] [CrossRef]
- Tredoux, A.; de Villiers, A.; Majek, P.; Lynen, F.; Crouch, A.; Sandra, P. Stir bar sorptive extraction combined with GC-MS analysis and chemometric methods for the classification of south African wines according to the volatile composition. J. Agric. Food Chem. 2008, 56, 4286–4296. [Google Scholar]
- Ridgway, K.; Lalljie, S.P.D.; Smith, R.M. Comparison of in-tube sorptive extraction techniques for non-polar volatile organic compounds by gas chromatography with mass spectrometric detection. J. Chromatogr. A 2006, 1124, 181–186. [Google Scholar] [CrossRef]
- Rasanen, I.; Viinamaki, J.; Vuori, E.; Ojanpera, I. Headspace In-Tube Extraction Gas Chromatography-Mass Spectrometry for the Analysis of Hydroxylic Methyl-Derivatized and Volatile Organic Compounds in Blood and Urine. J. Anal. Toxicol. 2010, 34, 113–121. [Google Scholar]
- Tisch, U.; Haick, H. Arrays of chemisensitive monolayer-capped metallic nanoparticles for diagnostic breath testing. Rev. Chem. Eng. 2010, 26, 171–179. [Google Scholar]
- Tisch, U.; Haick, H. Nanomaterials for cross-reactive sensor arrays. Mrs Bull. 2010, 35, 797–803. [Google Scholar] [CrossRef]
- Qualley, A.V.; Dudareva, N. Metabolomics of plant volatiles. Methods Mol. Biol. 2009, 553, 329–343. [Google Scholar] [CrossRef]
- Saito, K.; Matsuda, F. Metabolomics for functional genomics, systems biology, and biotechnology. Annu. Rev. Plant Biol. 2010, 61, 463–489. [Google Scholar] [CrossRef]
- Roessner, U.; Willmitzer, L.; Fernie, A.R. Metabolic profiling and biochemical phenotyping of plant systems. Plant Cell. Rep. 2002, 21, 189–196. [Google Scholar] [CrossRef]
- Fiehn, O.; Kopka, J.; Dormann, P.; Altmann, T.; Trethewey, R.N.; Willmitzer, L. Metabolite profiling for plant functional genomics. Nat. Biotechnol. 2000, 18, 1157–1161. [Google Scholar] [CrossRef]
- Veriotti, T.; Sacks, R. High speed GC/MS of gasoline-range hydrocarbon compounds using a pressure-tunable column ensemble and time-of-flight detection. Anal. Chem. 2000, 72, 3063–3069. [Google Scholar] [CrossRef]
- Stein, S.E.; Ausloos, P.; Clifton, C.L.; Klassen, J.K.; Lias, S.G.; Mikaya, A.I.; Sparkman, O.D.; Tchekhovskoi, D.V.; Zaikin, V.; Zhu, D. Evaluation of the NIST/EPA/NIH Mass Spectral Library. Abstr. Pap. Am. Chem. Soc. 1999, 218, U368–U368. [Google Scholar]
- Adams, R.P. Identification of Essential Oil Components by Gas Chromatography/Quadrupole Mass Spectroscopy, 4th ed; Allured Pub. Corporation: Carol Stream, IL, USA, 2007. [Google Scholar]
- Skogerson, K.; Wohlgemuth, G.; Barupal, D.K.; Fiehn, O. The volatile compound BinBase mass spectral database. BMC Bioinformatics 2011, 12, 321. [Google Scholar]
- Wagner, C.; Sefkow, M.; Kopka, J. Construction and application of a mass spectral and retention time index database generated from plant GC/EI-TOF-MS metabolite profiles. Phytochemistry 2003, 62, 887–900. [Google Scholar] [CrossRef]
- Aprea, E.; Gika, H.; Carlin, S.; Theodoridis, G.; Vrhovsek, U.; Mattivi, F. Metabolite profiling on apple volatile content based on solid phase microextraction and gas-chromatography time of flight mass spectrometry. J. Chromatogr. A 2011, 1218, 4517–4524. [Google Scholar] [CrossRef]
- Tikunov, Y.; Lommen, A.; de Vos, C.H.; Verhoeven, H.A.; Bino, R.J.; Hall, R.D.; Bovy, A.G. A novel approach for nontargeted data analysis for metabolomics. Large-scale profiling of tomato fruit volatiles. Plant Physiol. 2005, 139, 1125–1137. [Google Scholar] [CrossRef]
- Tikunov, Y.M.; de Vos, R.C.; Gonzalez Paramas, A.M.; Hall, R.D.; Bovy, A.G. A role for differential glycoconjugation in the emission of phenylpropanoid volatiles from tomato fruit discovered using a metabolic data fusion approach. Plant Physiol. 2010, 152, 55–70. [Google Scholar] [CrossRef]
- Roze, L.V.; Chanda, A.; Laivenieks, M.; Beaudry, R.M.; Artymovich, K.A.; Koptina, A.V.; Awad, D.W.; Valeeva, D.; Jones, A.D.; Linz, J.E. Volatile profiling reveals intracellular metabolic changes in Aspergillus parasiticus: veA regulates branched chain amino acid and ethanol metabolism. BMC Biochem. 2010, 11, 33. [Google Scholar] [CrossRef]
- Abel, C.; Clauss, M.; Schaub, A.; Gershenzon, J.; Tholl, D. Floral and insect-induced volatile formation in Arabidopsis lyrata ssp petraea, a perennial, outcrossing relative of A. thaliana. Planta 2009, 230, 1–11. [Google Scholar] [CrossRef]
- Aharoni, A.; Giri, A.P.; Deuerlein, S.; Griepink, F.; de Kogel, W.J.; Verstappen, F.W.; Verhoeven, H.A.; Jongsma, M.A.; Schwab, W.; Bouwmeester, H.J. Terpenoid metabolism in wild-type and transgenic Arabidopsis plants. Plant Cell. 2003, 15, 2866–2884. [Google Scholar] [CrossRef]
- Chen, F.; Tholl, D.; D'Auria, J.C.; Farooq, A.; Pichersky, E.; Gershenzon, J. Biosynthesis and emission of terpenoid volatiles from Arabidopsis flowers. Plant Cell. 2003, 15, 481–494. [Google Scholar] [CrossRef]
- Salas, J.J.; Garcia-Gonzalez, D.L.; Aparicio, R. Volatile compound biosynthesis by green leaves from an Arabidopsis thaliana hydroperoxide lyase knockout mutant. J. Agric. Food Chem 2006, 54, 8199–8205. [Google Scholar] [CrossRef]
- Huang, M.S.; Abel, C.; Sohrabi, R.; Petri, J.; Haupt, I.; Cosimano, J.; Gershenzon, J.; Tholl, D. Variation of Herbivore-Induced Volatile Terpenes among Arabidopsis Ecotypes Depends on Allelic Differences and Subcellular Targeting of Two Terpene Synthases, TPS02 and TPS03. Plant Physiol 2010, 153, 1293–1310. [Google Scholar] [CrossRef]
- Lee, S.; Badieyan, S.; Bevan, D.R.; Herde, M.; Gatz, C.; Tholl, D. Herbivore-induced and floral homoterpene volatiles are biosynthesized by a single P450 enzyme (CYP82G1) in Arabidopsis. Proc. Natl. Acad. Sci. USA 2010, 107, 21205–21210. [Google Scholar]
- Snoeren, T.A.; Kappers, I.F.; Broekgaarden, C.; Mumm, R.; Dicke, M.; Bouwmeester, H.J. Natural variation in herbivore-induced volatiles in Arabidopsis thaliana. J. Exp. Bot. 2010, 61, 3041–3056. [Google Scholar] [CrossRef]
- Huang, M.; Sanchez-Moreiras, A.M.; Abel, C.; Sohrabi, R.; Lee, S.; Gershenzon, J.; Tholl, D. The major volatile organic compound emitted from Arabidopsis thaliana flowers, the sesquiterpene (E)-β-caryophyllene, is a defense against a bacterial pathogen. New Phytologist 2012, 193, 997–1008. [Google Scholar] [CrossRef]
- Farag, M.A.; Ryu, C.M.; Sumner, L.W.; Pare, P.W. GC-MS SPME profiling of rhizobacterial volatiles reveals prospective inducers of growth promotion and induced systemic resistance in plants. Phytochemistry 2006, 67, 2262–2268. [Google Scholar] [CrossRef]
- Kusano, M.; Fukushima, A.; Arita, M.; Jonsson, P.; Moritz, T.; Kobayashi, M.; Hayashi, N.; Tohge, T.; Saito, K. Unbiased characterization of genotype-dependent metabolic regulations by metabolomic approach in Arabidopsis thaliana. BMC Syst. Biol. 2007, 1, 53. [Google Scholar] [CrossRef]
- Scheible, W.R.; Morcuende, R.; Czechowski, T.; Fritz, C.; Osuna, D.; Palacios-Rojas, N.; Schindelasch, D.; Thimm, O.; Udvardi, M.K.; Stitt, M. Genome-wide reprogramming of primary and secondary metabolism, protein synthesis, cellular growth processes, and the regulatory infrastructure of Arabidopsis in response to nitrogen. Plant Physiol. 2004, 136, 2483–2499. [Google Scholar] [CrossRef]
- Verdonk, J.C.; Ric de Vos, C.H.; Verhoeven, H.A.; Haring, M.A.; van Tunen, A.J.; Schuurink, R.C. Regulation of floral scent production in petunia revealed by targeted metabolomics. Phytochemistry 2003, 62, 997–1008. [Google Scholar] [CrossRef]
- Mandelli, J.; Wajner, A.; Pires, R.; Giugliani, R.; Coelho, J.C. Effect of CuCl2, NaCl and EDTA on the enzyme alpha-L-iduronidase in the plasma of normal individuals and heterozygotes for MPS I. Clinica Chimica Acta 2002, 318, 83–89. [Google Scholar] [CrossRef]
- Yang, W.C.; Schultz, R.D. Inhibitory Effect of Ethylenediaminetetraacetate (Edta) on the Porcine Lymphocyte-Response to Mitogens and Reversal of the Effect with Metal-Ions. Biol. Trace Elem. Res. 1982, 4, 175–182. [Google Scholar] [CrossRef]
- Ortiz-Serrano, P.; Gil, J.V. Quantitation of free and glycosidically bound volatiles in and effect of glycosidase addition on three tomato varieties (Solanum lycopersicum L.). J. Agric. Food Chem. 2007, 55, 9170–9176. [Google Scholar] [CrossRef]
- Obara, N.; Hasegawa, M.; Kodama, O. Induced volatiles in elicitor-treated and rice blast fungus-inoculated rice leaves. Biosci. Biotechnol. Biochem. 2002, 66, 2549–2559. [Google Scholar] [CrossRef]
- Rohloff, J.; Bones, A.M. Volatile profiling of Arabidopsis thaliana - Putative olfactory compounds in plant communication. Phytochemistry 2005, 66, 1941–1955. [Google Scholar] [CrossRef]
- Agger, S.A.; Lopez-Gallego, F.; Hoye, T.R.; Schmidt-Dannert, C. Identification of sesquiterpene synthases from Nostoc punctiforme PCC 73102 and Nostoc sp. strain PCC 7120. J. Bacteriol. 2008, 190, 6084–6096. [Google Scholar] [CrossRef]
- Quintana, A.; Reinhard, J.; Faure, R.; Uva, P.; Bagneres, A.G.; Massiot, G.; Clement, J.L. Interspecific variation in terpenoid composition of defensive secretions of European Reticulitermes termites. J. Chem. Ecol. 2003, 29, 639–652. [Google Scholar] [CrossRef]
- Bylesjo, M.; Rantalainen, M.; Cloarec, O.; Nicholson, J.K.; Holmes, E.; Trygg, J. OPLS discriminant analysis: combining the strengths of PLS-DA and SIMCA classification. J. Chemom. 2006, 20, 341–351. [Google Scholar] [CrossRef]
- Trygg, J.; Holmes, E.; Lundstedt, T. Chemometrics in metabonomics. J. Proteome Res. 2007, 6, 469–479. [Google Scholar] [CrossRef]
- Vercammen, J.; Pham-Tuan, H.; Arickx, I.; Van der Straeten, D.; Sandra, P. Monitoring of isothiocyanates emanating from Arabidopsis thaliana upon paraquat spraying. J. Chromatogr. A 2001, 912, 127–134. [Google Scholar] [CrossRef]
- Lambrix, V.; Reichelt, M.; Mitchell-Olds, T.; Kliebenstein, D.J.; Gershenzon, J. The Arabidopsis epithiospecifier protein promotes the hydrolysis of glucosinolates to nitriles and influences Trichoplusia ni herbivory. Plant Cell 2001, 13, 2793–2807. [Google Scholar]
- Simkin, A.J.; Schwartz, S.H.; Auldridge, M.; Taylor, M.G.; Klee, H.J. The tomato carotenoid cleavage dioxygenase 1 genes contribute to the formation of the flavor volatiles beta-ionone, pseudoionone, and geranylacetone. Plant J. 2004, 40, 882–892. [Google Scholar] [CrossRef]
- Caja, M.D.; Preston, C.; Kempf, M.; Schreier, P. Flavor authentication studies of alpha-ionone, beta-ionone, and alpha-ionol from various sources. J. Agr. Food Chem. 2007, 55, 6700–6704. [Google Scholar] [CrossRef]
- Prochazkova, D.; Haisel, D.; Wilhelmova, N. Content of carotenoids during ageing and senescence of tobacco leaves with genetically modulated life-span. Photosynthetica 2009, 47, 409–414. [Google Scholar] [CrossRef]
- Thomas, H.; deVilliers, L. Gene expression in leaves of Arabidopsis thaliana induced to senesce by nutrient deprivation. J. Exp. Bot. 1996, 47, 1845–1852. [Google Scholar] [CrossRef]
- Al-Shwyeh, H.A.; Mirghani, M.E.S.; Jamal, P. Antibacterial activity of Malaysian mango kernel. Afr J. Biotechnol. 2011, 10, 18739–18748. [Google Scholar]
- Miklosy, E.; Kerenyi, Z. Comparison of the volatile aroma components in noble rotted grape berries from two different locations of the Tokaj wine district in Hungary. Anal. Chim. Acta 2004, 513, 177–181. [Google Scholar] [CrossRef]
- Nikbakhtzadeh, M.R.; Tirgari, S.; Fakoorziba, M.R.; Alipour, H. Two volatiles from the venom gland of the Samsum ant, Pachycondyla senaarensis. Toxicon. 2009, 54, 80–82. [Google Scholar] [CrossRef]
- Sathya, A.; Ramasubramaniaraja, R.; Brindha, P. Pharmacognostical, phytochemical and GC-MS investigation of successive extracts of Gymnema syvestre R.Br. J. Pharm. Res. 2010, 3, 984–987. [Google Scholar]
- Maggi, F.; Lucarini, D.; Tirillini, B.; Vittori, S.; Sagratini, G.; Papa, F. Essential oil composition of Ephedra nebrodensis Tineo ex Guss. subsp. nebrodensis from central Italy. J. Essent. Oil Res. 2010, 22, 354–357. [Google Scholar] [CrossRef]
- Velasco-Negueruela, A.; Perez-Alonso, M.J.; Perez de Paz, P.L.; Pala-Paul, J.; Sanz, J. Analysis by gas chromatography-mass spectrometry of the volatiles from the fruits of Ammodaucus leucotrichus subsp. leucotrichus and subsp. nanocarpus grown in North Africa and the Canary Islands, respectively. J. Chromatogr. A 2006, 1108, 273–275. [Google Scholar] [CrossRef]
- Radulovic, N.; Dekic, M.; Stojanovic-Radic, Z.; Palic, R. Volatile constituents of Erodium cicutarium (L.) L' H,rit. (Geraniaceae). Centr Eur J. Biol. 2009, 4, 404–410. [Google Scholar] [CrossRef]
- Silva, D.R.; Endo, E.H.; Dias, B.P.; Nakamura, C.V.; Svidzinski, T.I.E.; de Souza, A.; Young, M.C.M.; Ueda-Nakamura, T.; Cortez, D.A.G. Chemical Composition and Antimicrobial Properties of Piper ovatum Vahl. Molecules 2009, 14, 1171–1182. [Google Scholar] [CrossRef]
- Chaverri, C.; Diaz, C.; Ciccio, J.F. Chemical Analysis of Essential Oils from Ocotea gomezii WC Burger and Ocotea morae Gomez-Laur. (Lauraceae) Collected at "Reserva Biologica Alberto M. Brenes" in Costa Rica and their Cytotoxic Activity on Tumor Cell Lines. J. Braz Chem. Soc. 2011, 22, S1–S4. [Google Scholar] [CrossRef]
- Fiehn, O.; Robertson, D.; Griffin, J.; van der Werf, M.; Nikolau, B.; Morrison, N.; Sumner, L.W.; Goodacre, R.; Hardy, N.W.; Taylor, C.; Fostel, J.; Kristal, B.; Kaddurah-Daouk, R.; Mendes, P.; van Ommen, B.; Lindon, J.C.; Sansone, S.A. The metabolomics standards initiative (MSI). Metabolomics 2007, 3, 175–178. [Google Scholar] [CrossRef]
- Jonsson, P.; Johansson, E.S.; Wuolikainen, A.; Lindberg, J.; Schuppe-Koistinen, I.; Kusano, M.; Sjostrom, M.; Trygg, J.; Moritz, T.; Antti, H. Predictive metabolite profiling applying hierarchical multivariate curve resolution to GC-MS data--a potential tool for multi-parametric diagnosis. J. Proteome Res. 2006, 5, 1407–1414. [Google Scholar] [CrossRef]
- Redestig, H.; Kusano, M.; Fukushima, A.; Matsuda, F.; Saito, K.; Arita, M. Consolidating metabolite identifiers to enable contextual and multi-platform metabolomics data analysis. BMC Bioinformatics 2010, 11, 214. [Google Scholar]
- Smyth, G.K. Linear models and empirical bayes methods for assessing differential expression in microarray experiments. Stat. Appl Genet. Mol. Biol. 2004, 3, Article 3. [Google Scholar]
- Eriksson, L.; Trygg, J.; Wold, S. CV-ANOVA for significance testing of PLS and OPLS (R) models. J. Chem. 2008, 22, 594–600. [Google Scholar] [CrossRef]
Supplementary Files
© 2013 by the authors; licensee MDPI, Basel, Switzerland. This article is an open access article distributed under the terms and conditions of the Creative Commons Attribution license (http://creativecommons.org/licenses/by/3.0/).
Share and Cite
Kusano, M.; Iizuka, Y.; Kobayashi, M.; Fukushima, A.; Saito, K. Development of a Direct Headspace Collection Method from Arabidopsis Seedlings Using HS-SPME-GC-TOF-MS Analysis. Metabolites 2013, 3, 223-242. https://doi.org/10.3390/metabo3020223
Kusano M, Iizuka Y, Kobayashi M, Fukushima A, Saito K. Development of a Direct Headspace Collection Method from Arabidopsis Seedlings Using HS-SPME-GC-TOF-MS Analysis. Metabolites. 2013; 3(2):223-242. https://doi.org/10.3390/metabo3020223
Chicago/Turabian StyleKusano, Miyako, Yumiko Iizuka, Makoto Kobayashi, Atsushi Fukushima, and Kazuki Saito. 2013. "Development of a Direct Headspace Collection Method from Arabidopsis Seedlings Using HS-SPME-GC-TOF-MS Analysis" Metabolites 3, no. 2: 223-242. https://doi.org/10.3390/metabo3020223
APA StyleKusano, M., Iizuka, Y., Kobayashi, M., Fukushima, A., & Saito, K. (2013). Development of a Direct Headspace Collection Method from Arabidopsis Seedlings Using HS-SPME-GC-TOF-MS Analysis. Metabolites, 3(2), 223-242. https://doi.org/10.3390/metabo3020223