Characterisation of the Metabolites of 1,8-Cineole Transferred into Human Milk: Concentrations and Ratio of Enantiomers

Abstract
:1. Introduction
2. Results
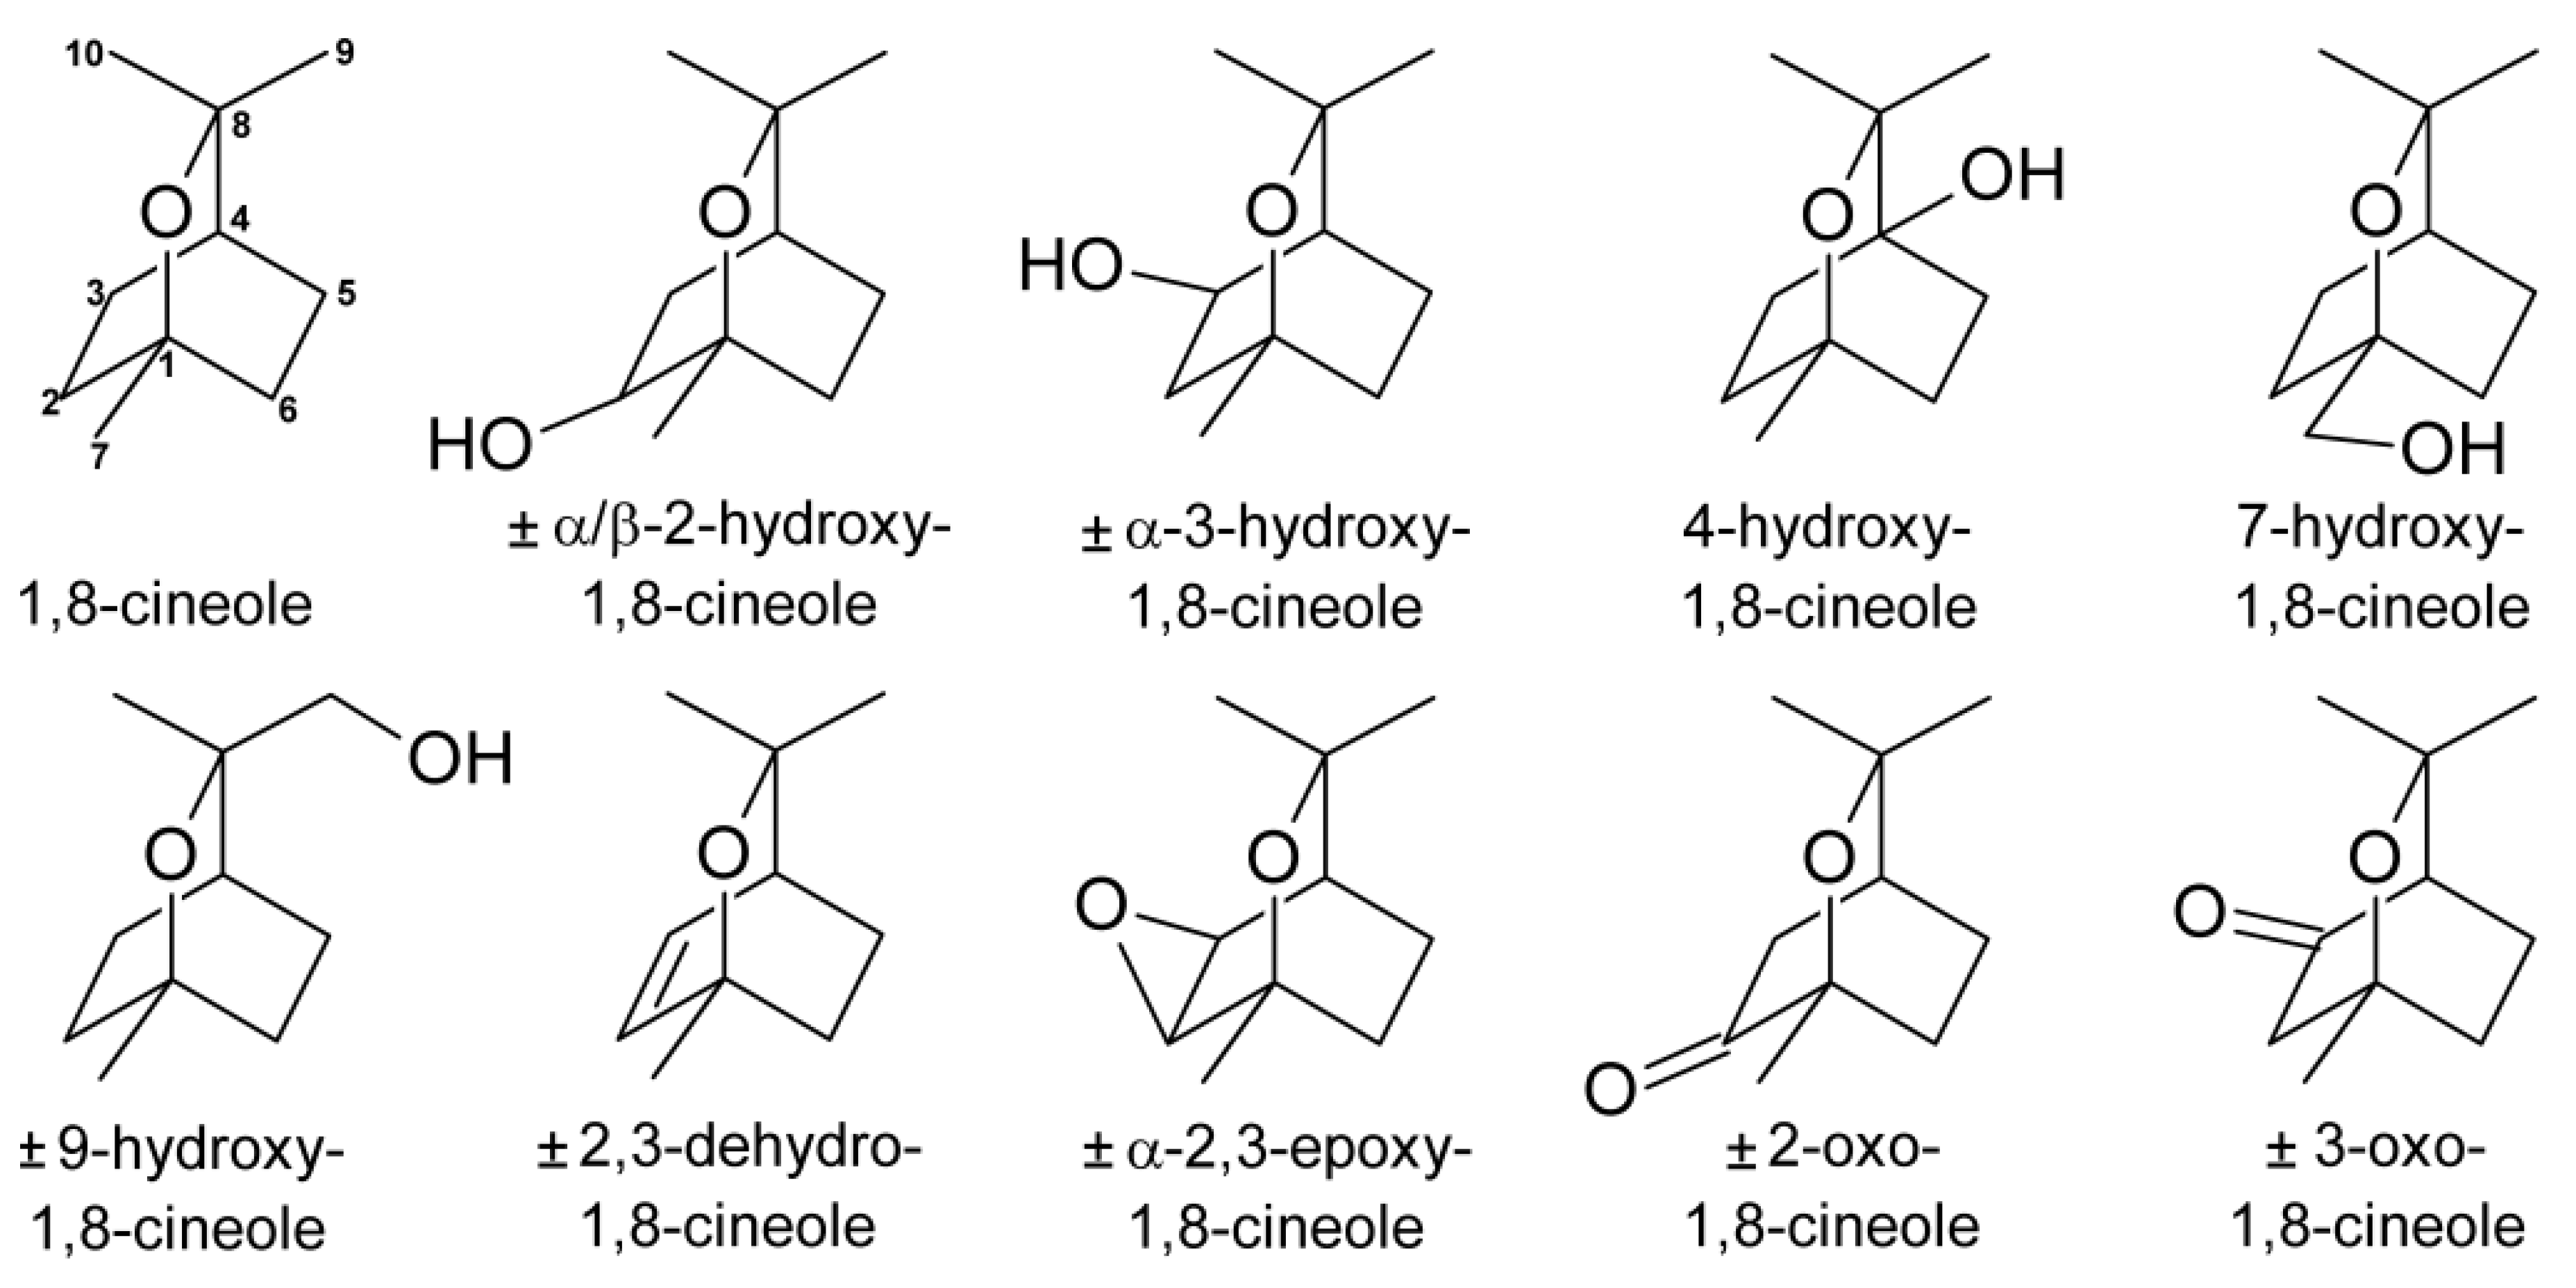
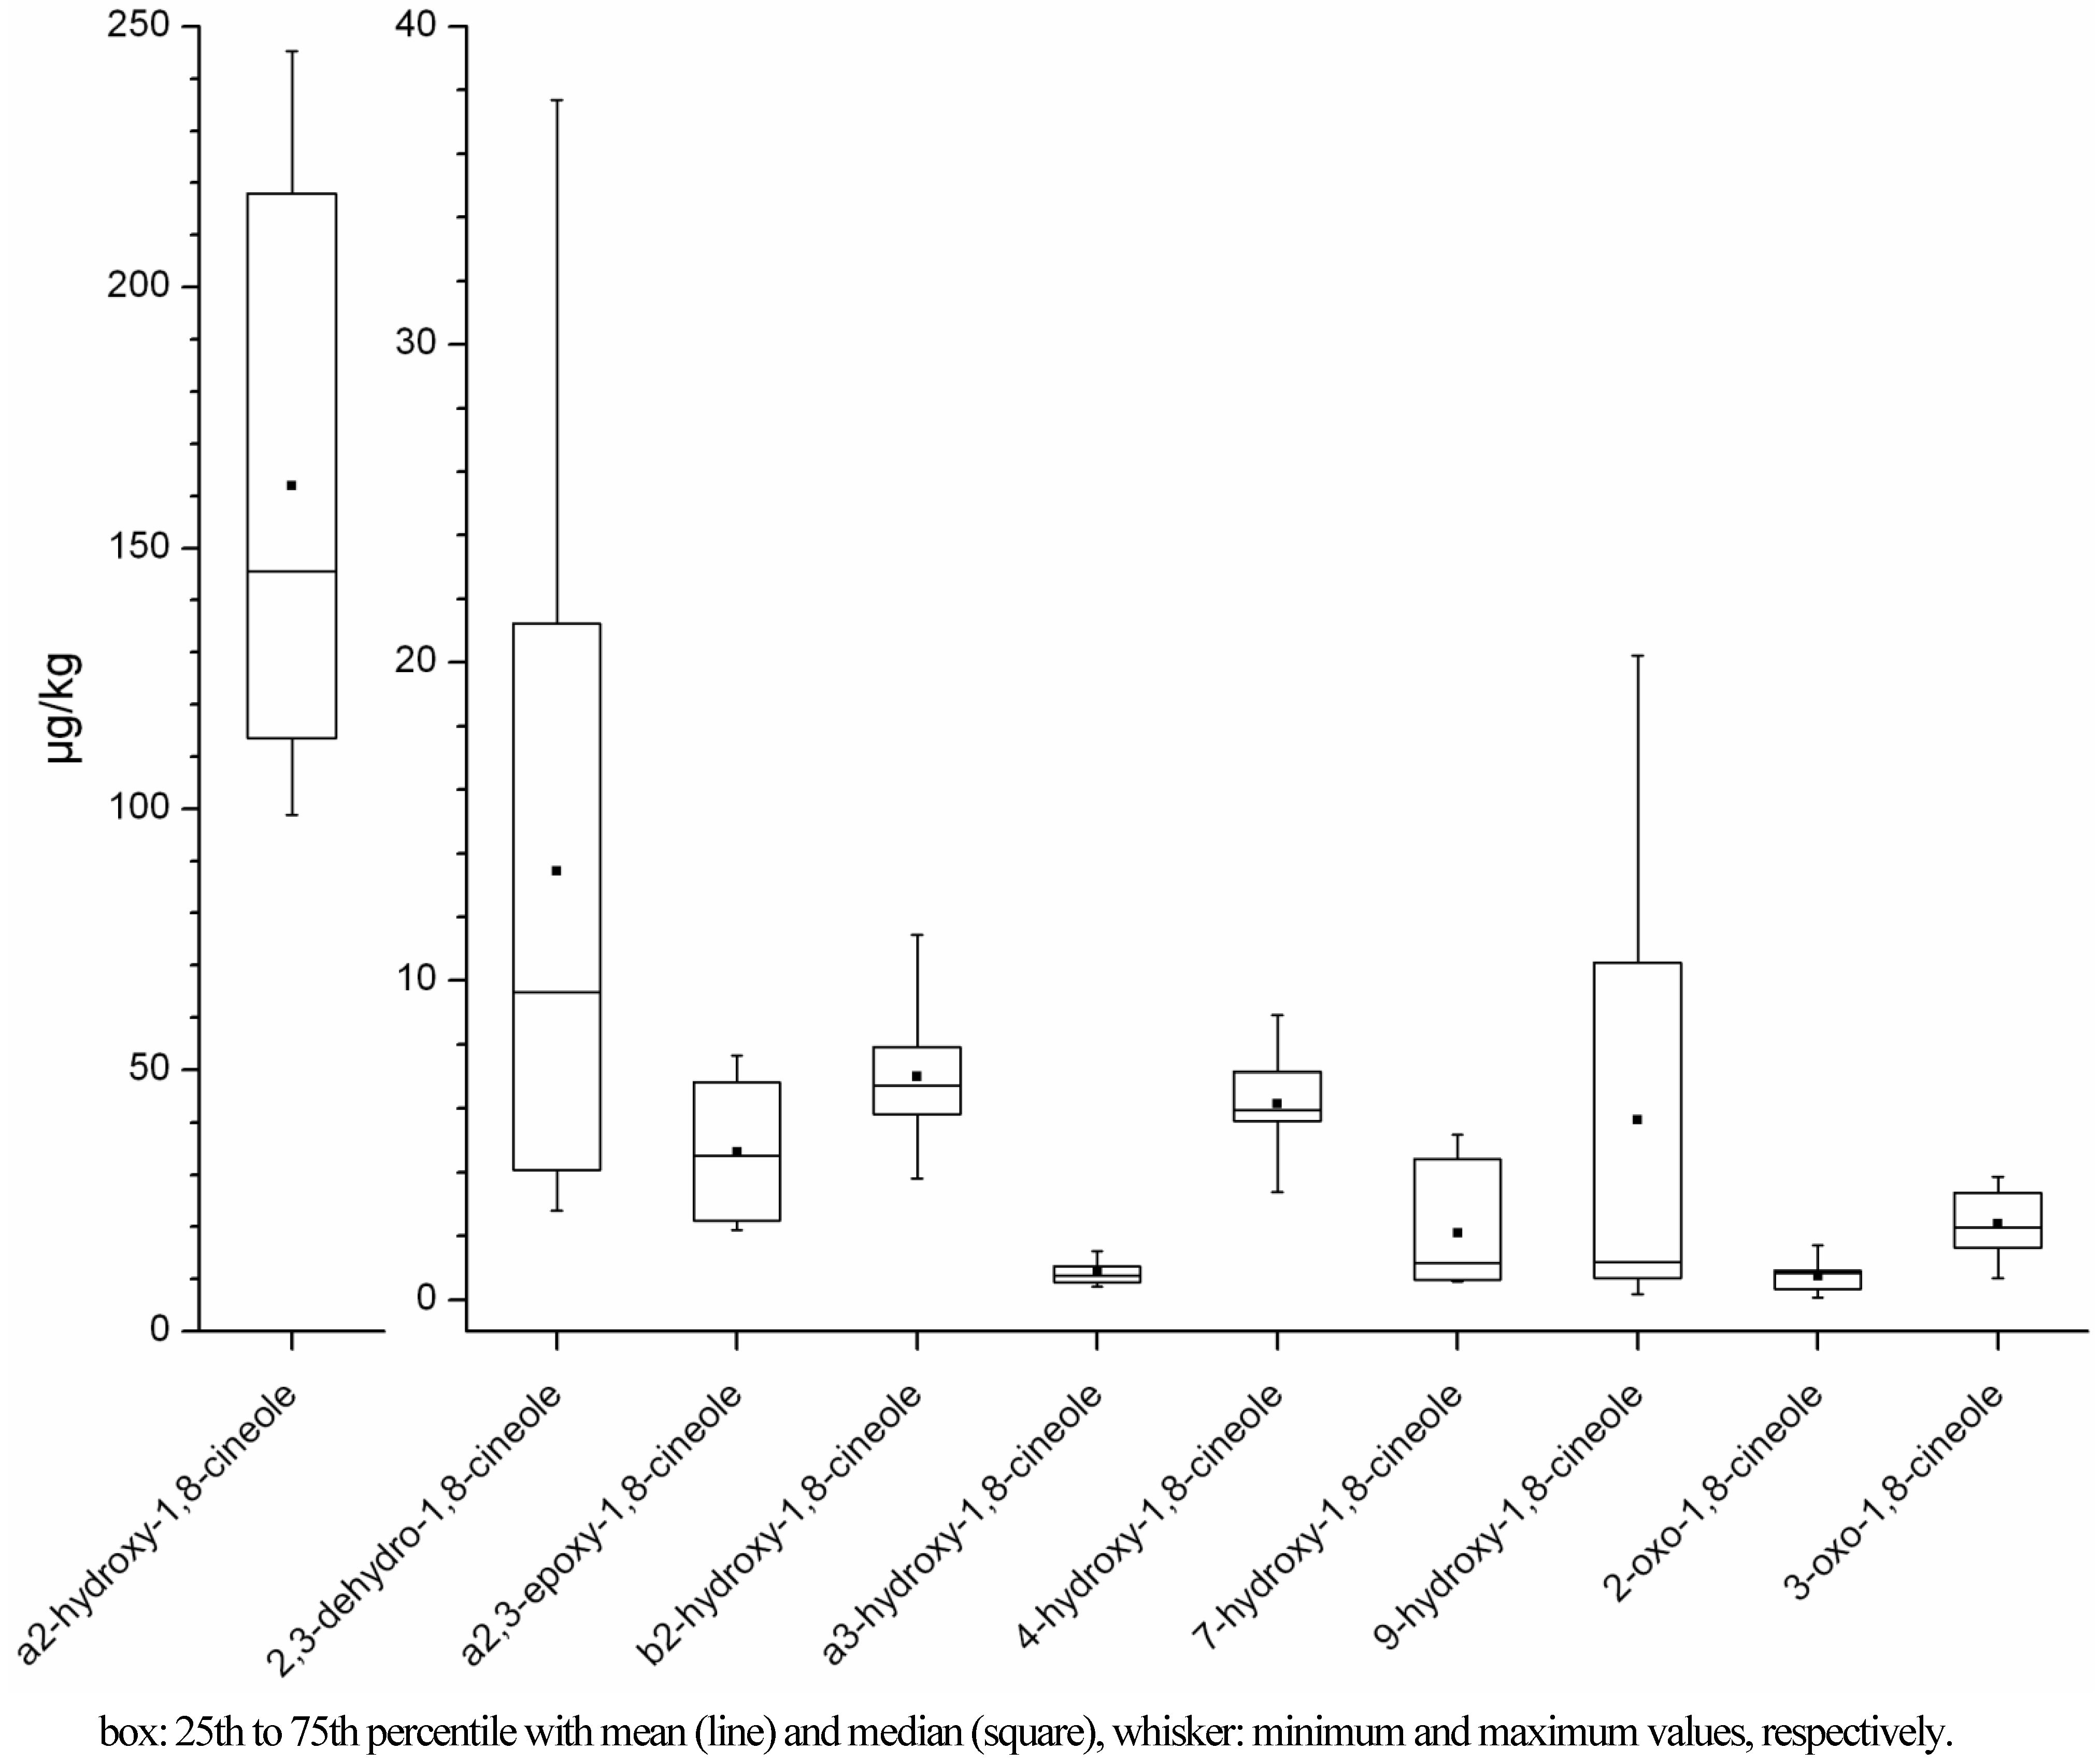
2.1. Quantification of the Metabolites of 1,8-Cineole in Human Milk
2.1.1. Concentration Ranges in Human Milk Samples

| Sample (odoura yes/no) | 1,8-cineole (µg/kg)d | 2,3-dehydro-1,8-cineole (µg/kg) | a2,3-epoxy-1,8-cineole (µg/kg) | a2-hydroxy-1,8-cineole (µg/kg) | b2-hydroxy-1,8-cineole (µg/kg) | a3-hydroxy-1,8-cineole (µg/kg) |
|---|---|---|---|---|---|---|
| A-1a (no) | 2.43 (<13.65) | 0.28 (<1.26) | nd | 0.65(<1.37) | nd | nd |
| A-1b (yes) | 134.72 | 4.07 | 2.48 | 138.10 | 6.00 | 0.77 (<1.14) |
| B-1 (yes) | 399.39 | 13.65 | 7.65 | 176.30 | 6.72 | 1.06 (<1.65) |
| B-2a (no) | 0.98 | 0.07 | nd | 0.61 | nd | nd |
| B-2b (yes) | 70.97 | 2.80 | 2.18 (<2.45) | 113.55 | 5.82 | 0.54 (<2.07) |
| B-2c (no) | 14.82 | 0.57 | 0.66 | 29.25 | 1.71 | 0.05 |
| C (nob) | 13.56 | 0.73 (<0.88) | nd | 7.68 | 0.33 (<0.96) | 0.05 (<0.96) |
| D-1 (no) | 5.75 (<10.59) | 0.45 (<0.97) | 1.35 | 15.08 | 1.42 | 0.03 (<1.06) |
| D-2 (yes) | 226.09 | 5.13 | 4.13 | 135.98 | 7.35 | 0.41 (<1.92) |
| E-1 (no) | 3.19 (<13.18) | 0.19 (<1.21) | nd | 2.02 | nd | nd |
| E-2 (yes) | 504.93 | 9.63 | 4.65 | 233.31 | 11.44 | 0.96 (<1.78) |
| Fc (no) | 20.23 (<26.14) | 0.59 (<2.40) | nd | 3.16 | nd | nd |
| G (yes) | 194.46 | 21.24 | 4.52 | 98.83 | 3.80 | 0.72 (<3.51) |
| H (yes) | 2089.54 (>1897.53) | 37.69 | 6.82 | 206.09 | 7.90 | 1.53 (<1.96) |
| Sample (odoura yes/no) | 4-hydroxy-1,8-cineole (µg/kg) | 7-hydroxy-1,8-cineole (µg/kg) | 9-hydroxy-1,8-cineole (µg/kg) | 2-oxo-1,8-cineole (µg/kg) | 3-oxo-1,8-cineole (µg/kg) |
|---|---|---|---|---|---|
| A-1a (no) | nd | nd | nd | 0.13 (<1.57) | 0.01 (<1.57) |
| A-1b (yes) | 5.96 | 0.56 | 0.46 (<1.08) | 0.53 (<1.31) | 1.80 |
| B-1 (yes) | 6.35 | 1.14 | 0.87 (<1.57) | 0.91 (<1.89) | 3.32 |
| B-2a (no) | nd | 0.21 | 0.18 | nd | nd |
| B-2b (yes) | 5.62 | 4.42 | 15.52 | 0.34 (<2.37) | 1.47 (<2.37) |
| B-2c (no) | 2.32 | 0.18 | 0.15 | 0.07 | 0.68 |
| C (nob) | nd | nd | nd | nd | 0.14 (<1.10) |
| D-1 (no) | 2.24 | nd | nd | nd | 0.77 (<1.22) |
| D-2 (yes) | 7.13 | 0.62 | 0.46 (<1.82) | 0.85 (<2.20) | 2.12 (<2.20) |
| E-1 (no) | nd | nd | nd | nd | nd |
| E-2 (yes) | 8.92 | 5.19 | 16.95 | 1.71 (<2.03) | 2.41 |
| Fc (no) | 3.62 | nd | nd | 2.71 (<3.00) | 0.07 (<3.00) |
| G (yes) | 3.39 | 0.84 (<1.06) | 0.73 (<3.33) | nd | 3.38 (<4.02) |
| H (yes) | 5.66 | 1.87 | 1.83 (<1.86) | 0.86 (<2.24) | 3.85 |
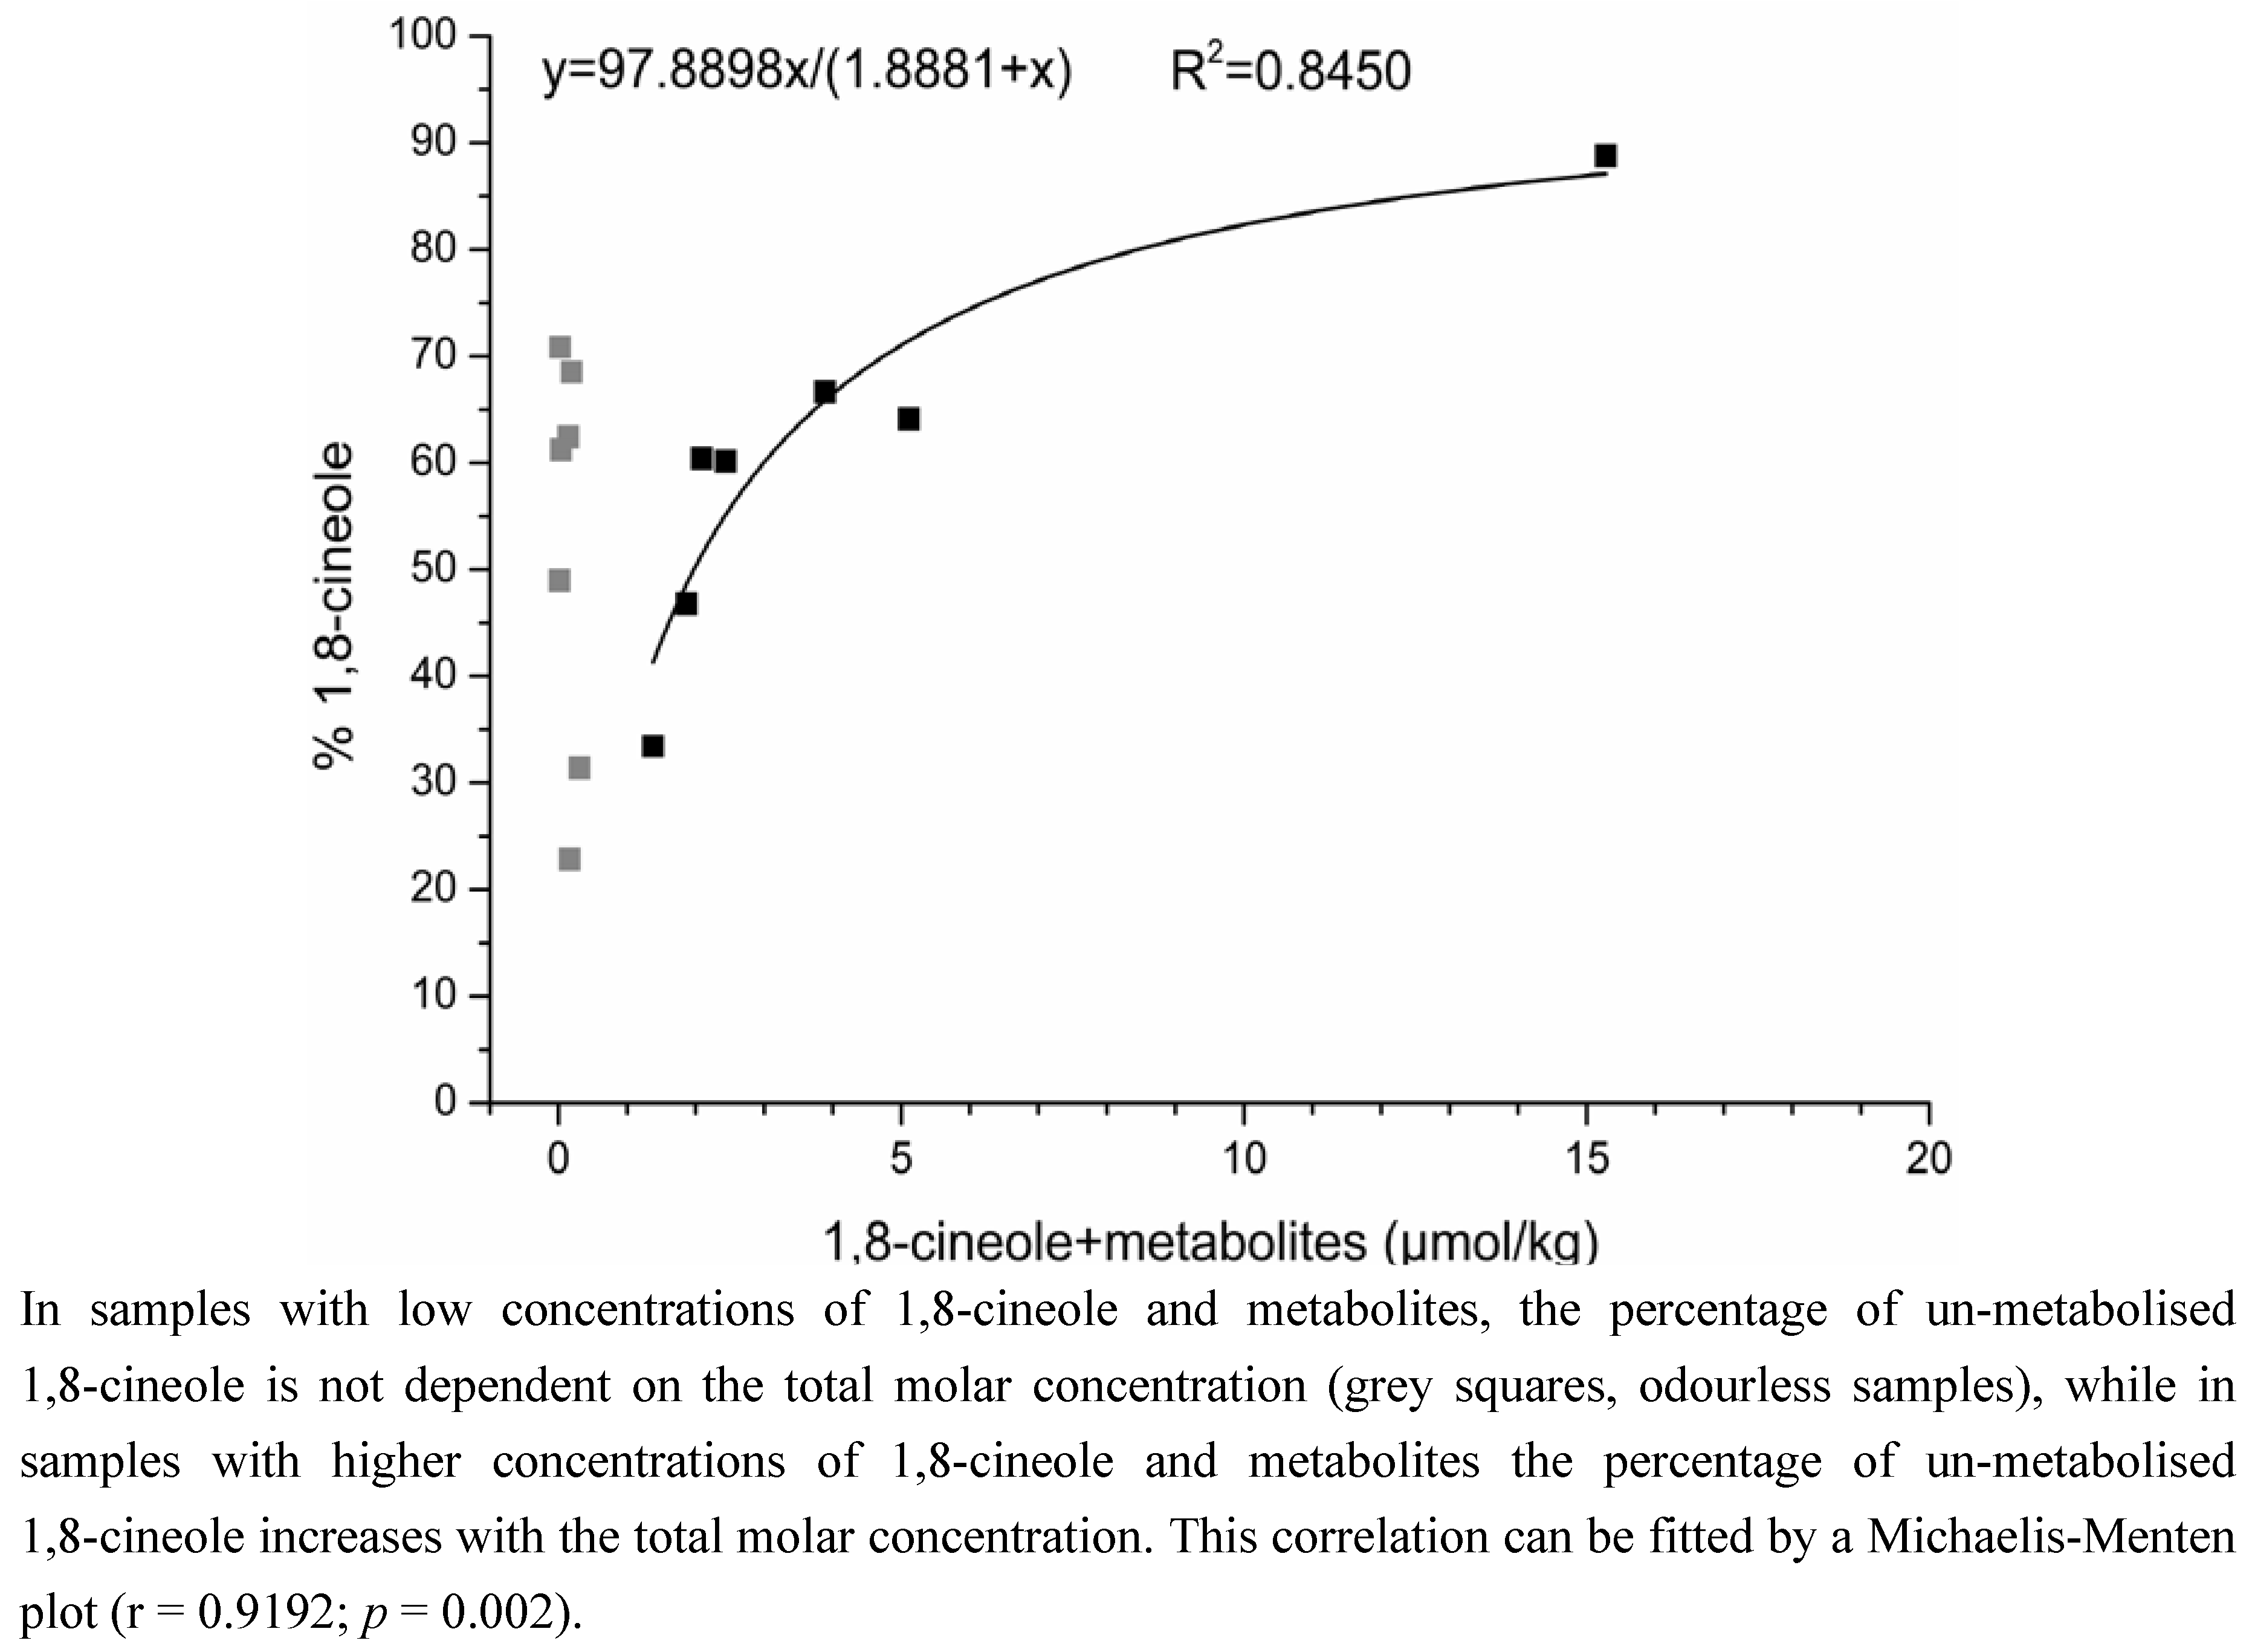
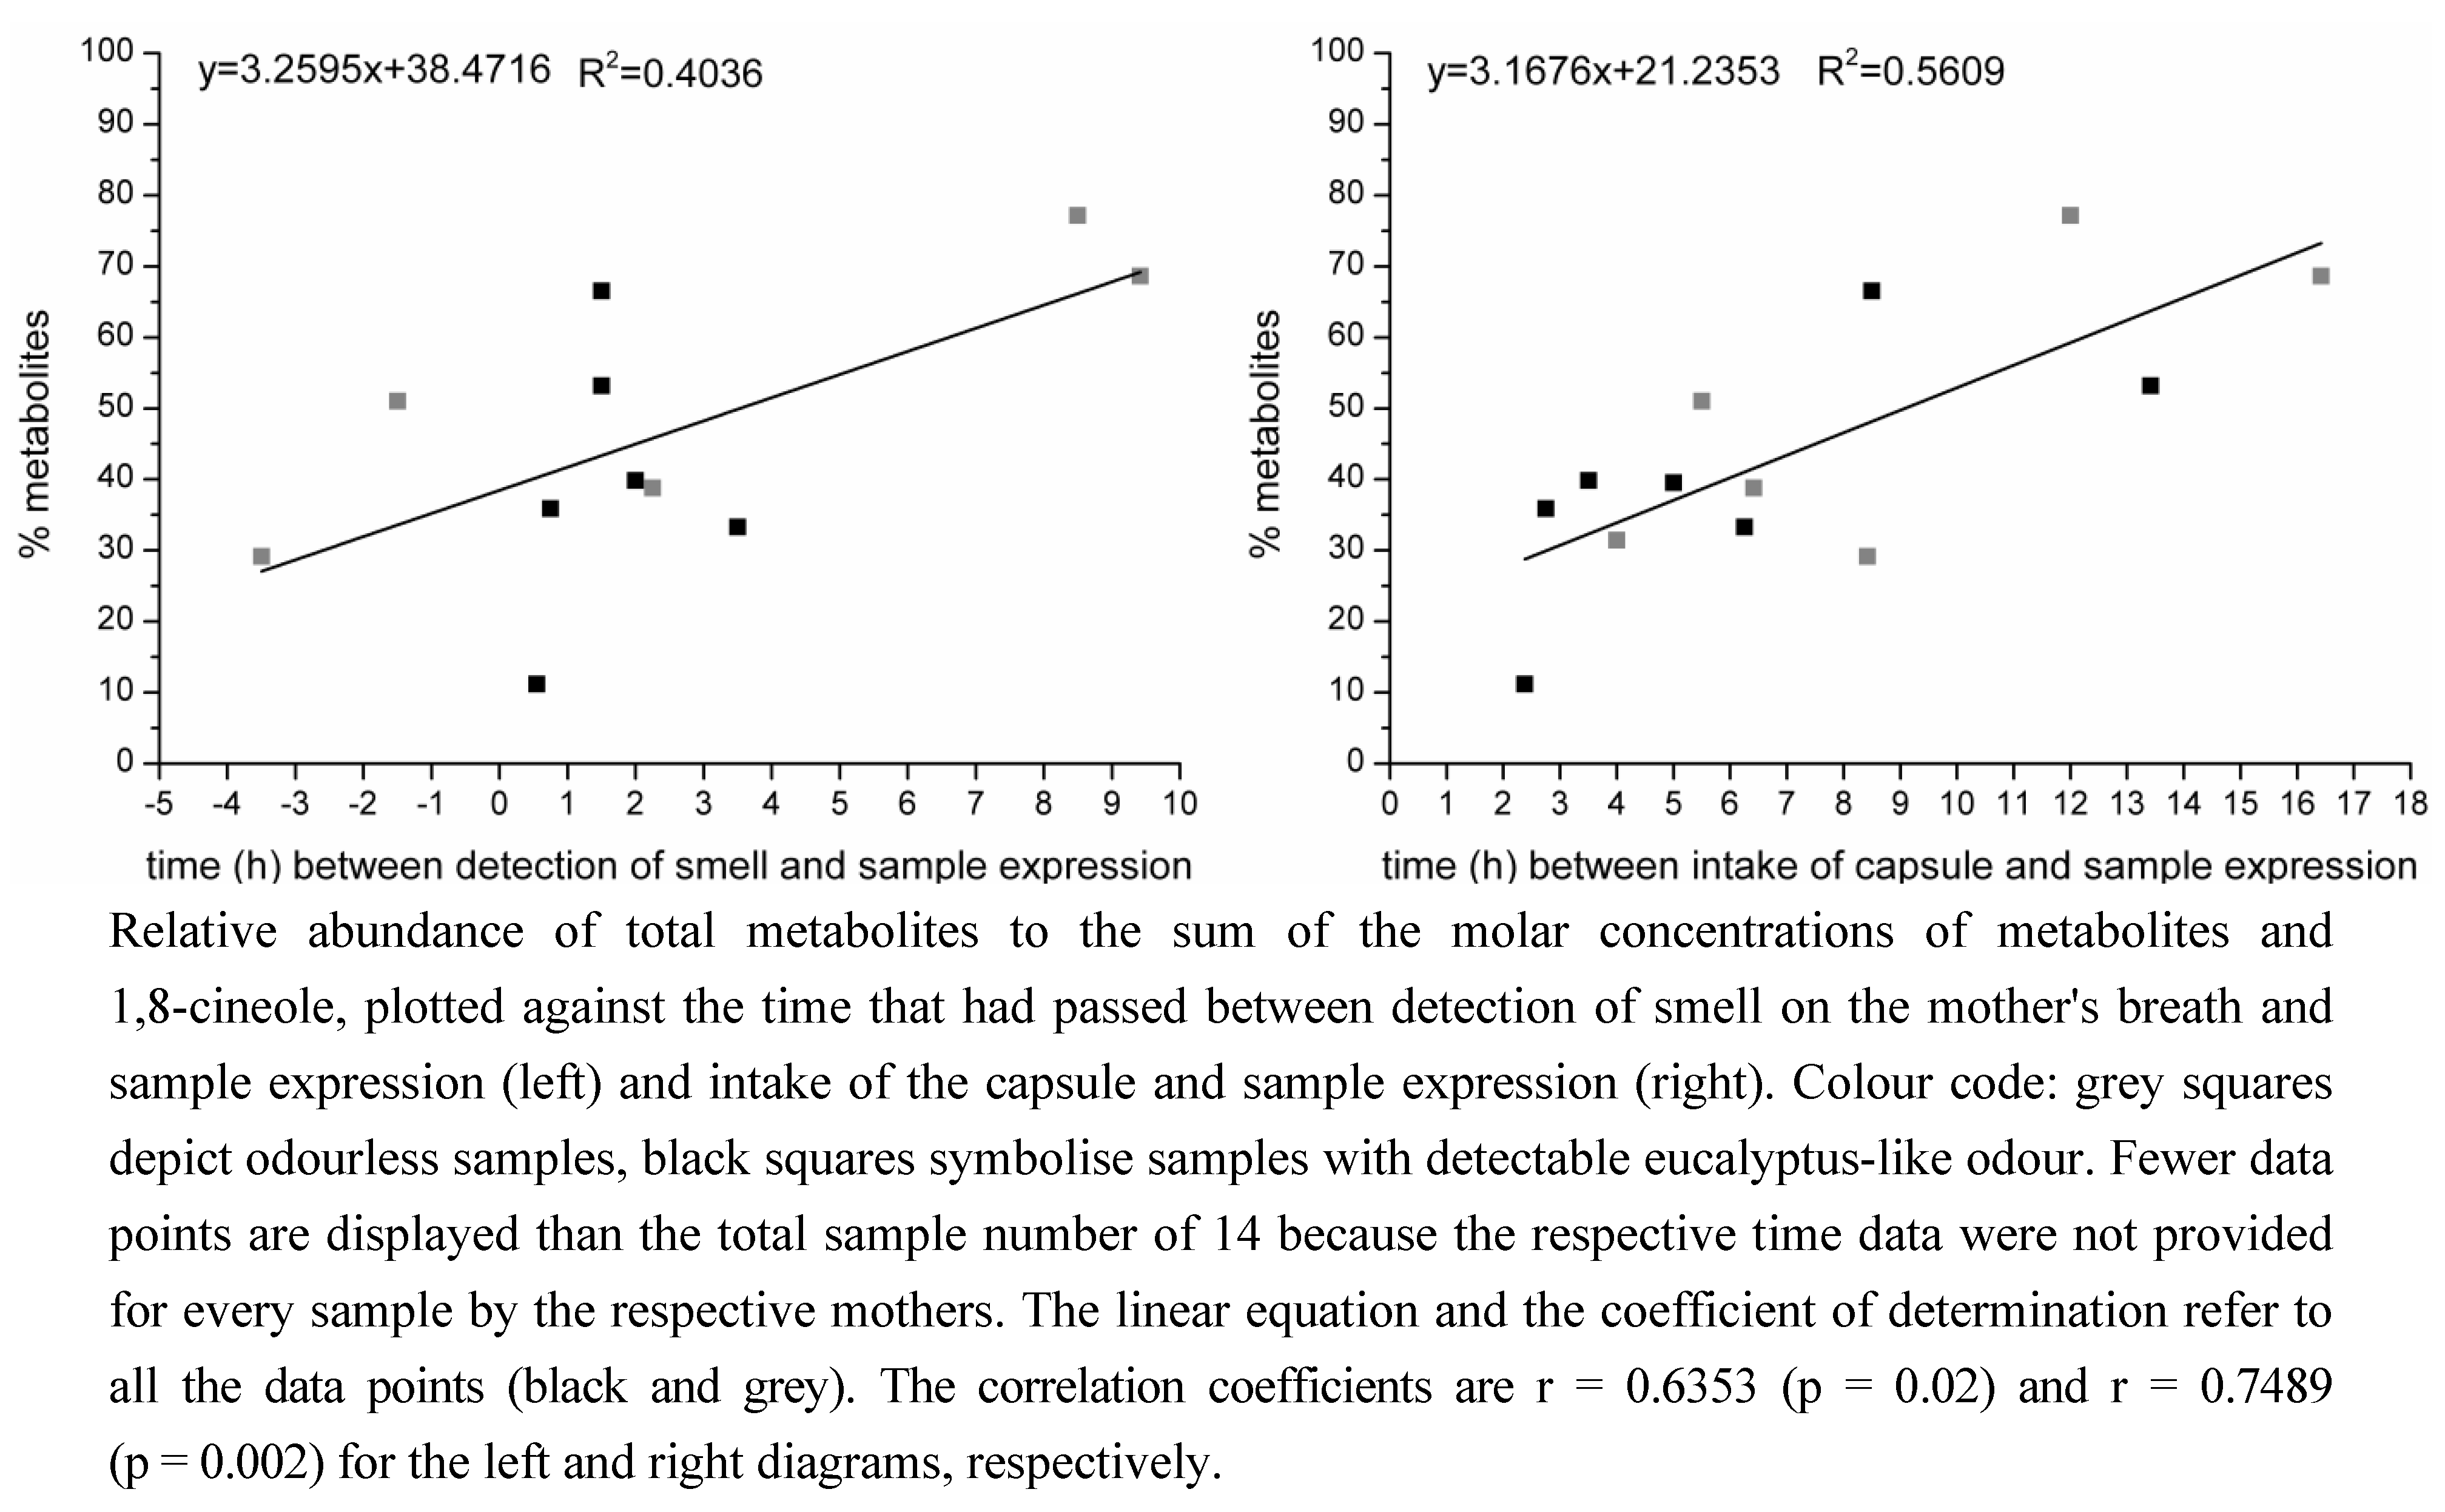
2.1.2. Time-Dependency of 1,8-Cineole Metabolism

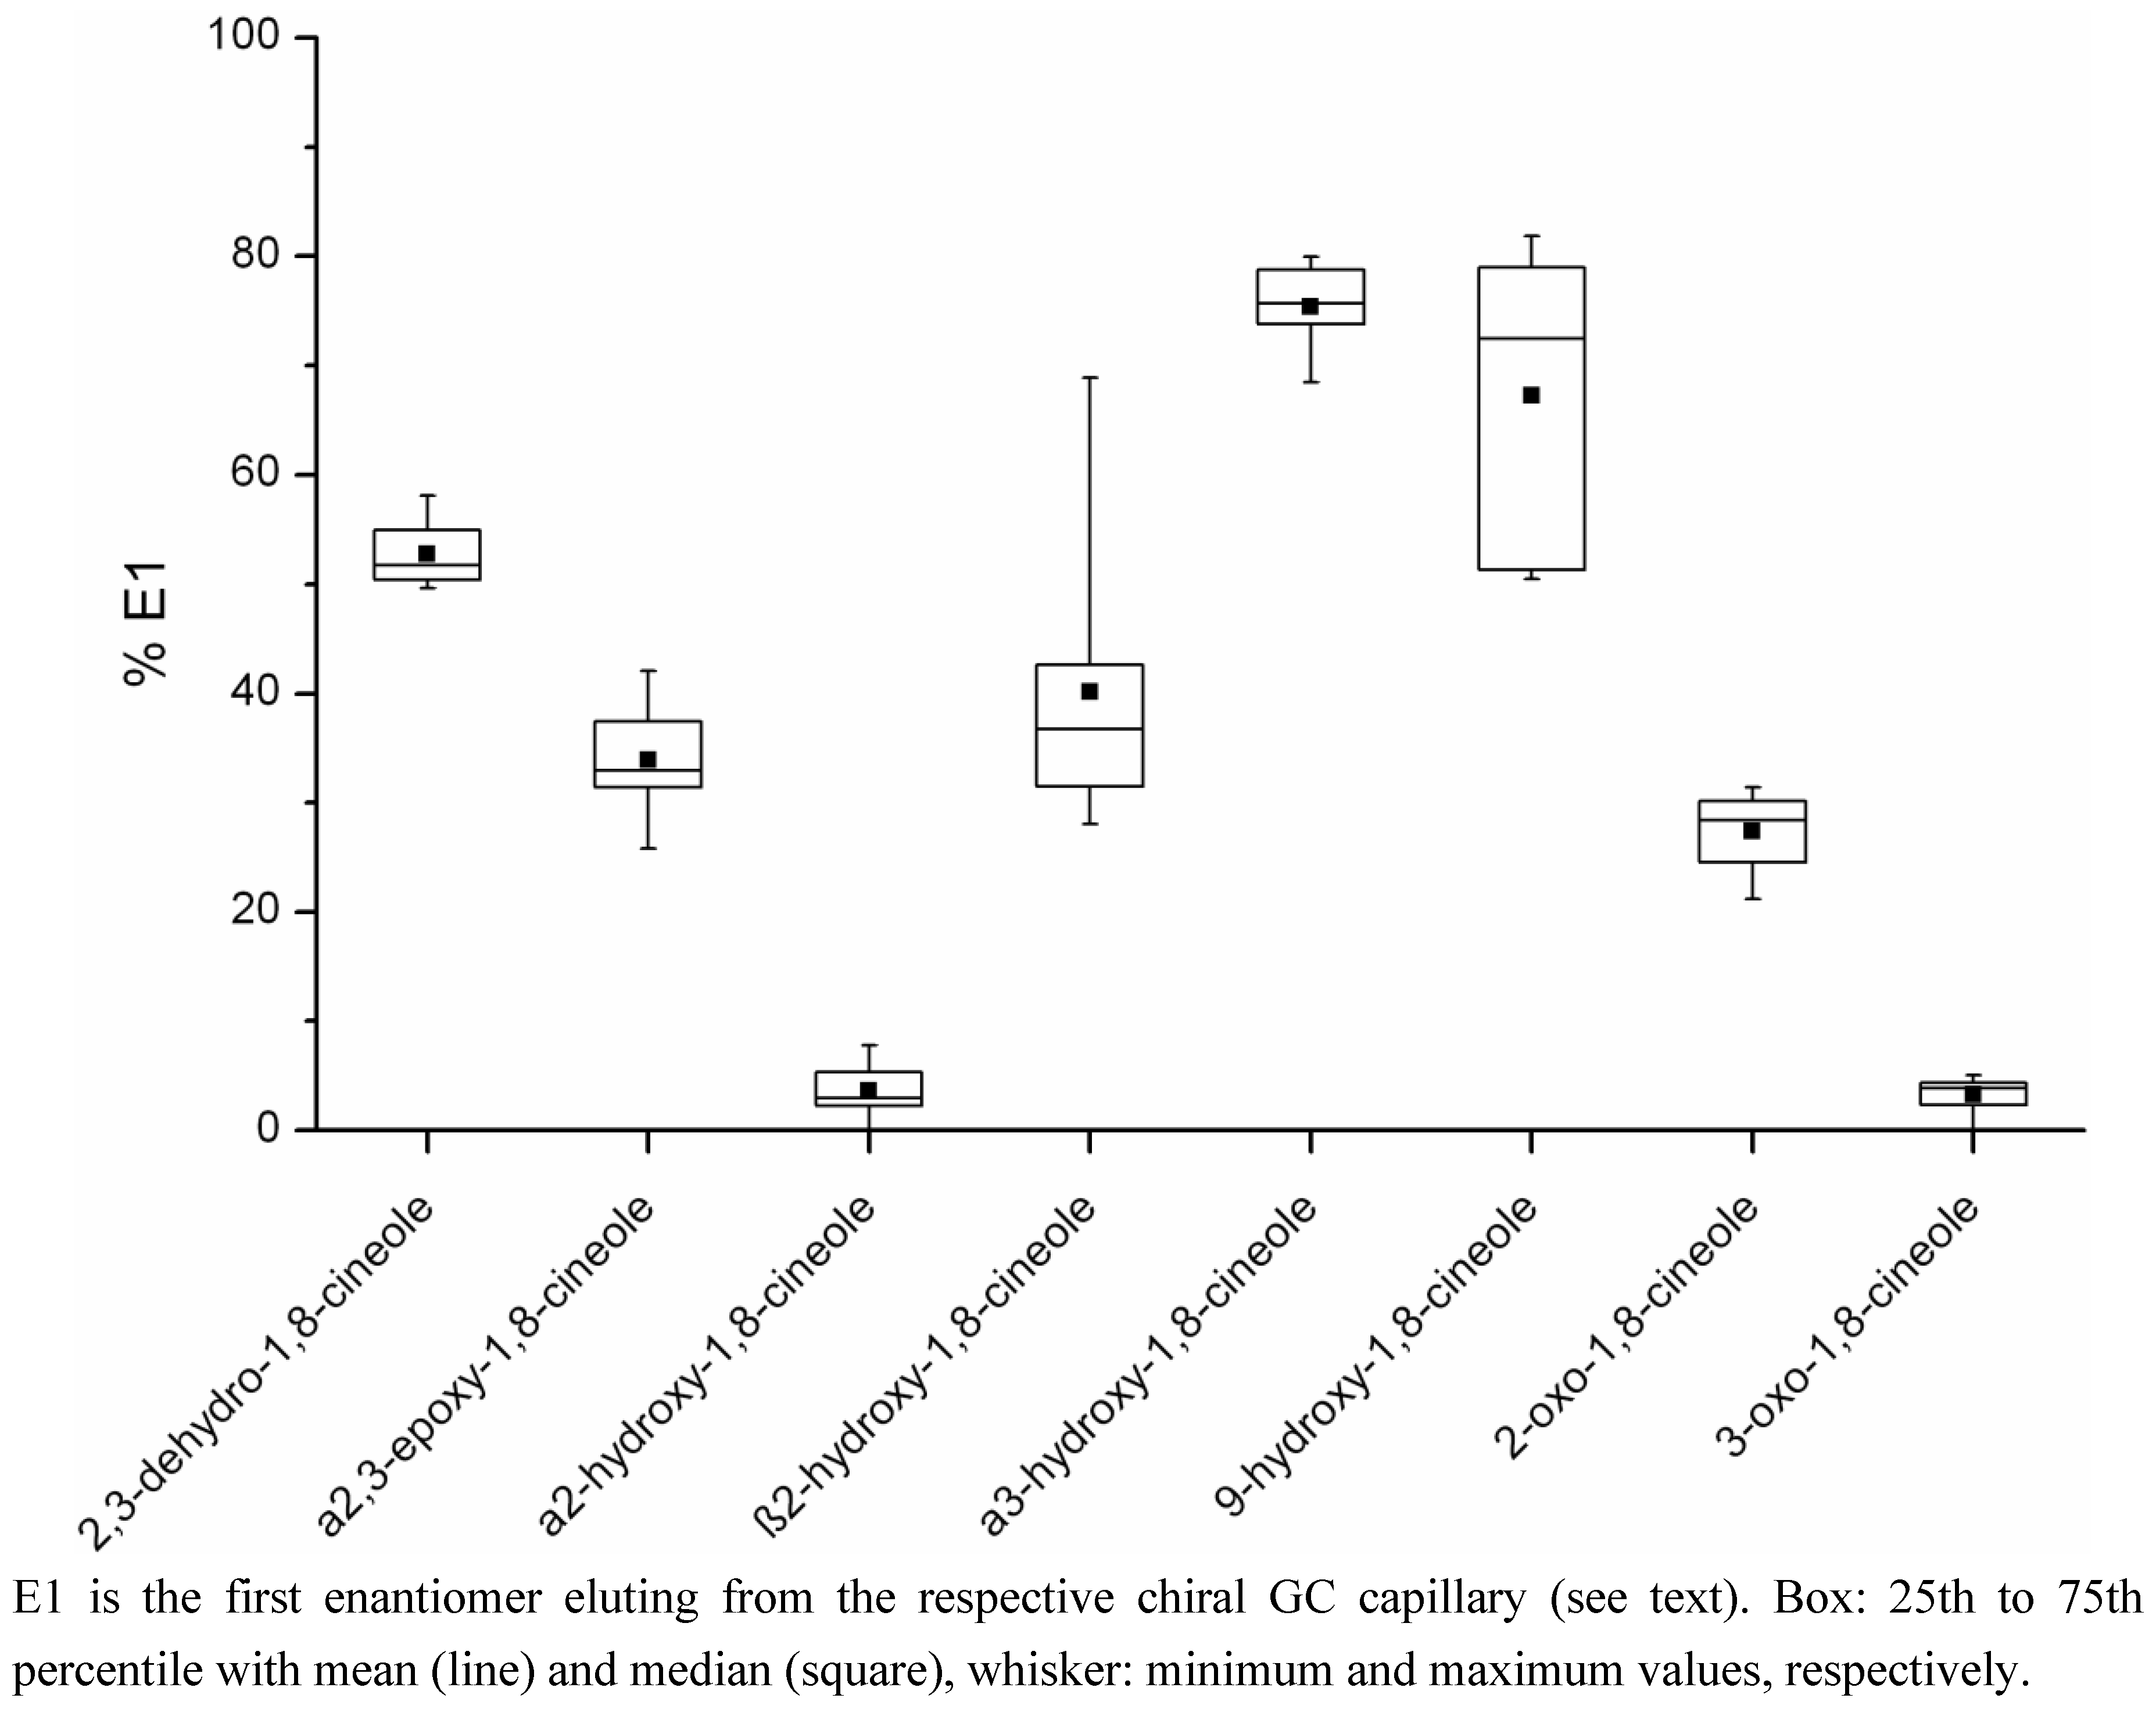
2.2. Determination of the Ratios of Enantiomers
| Metabolite | Percentage E1a Mean (range) | Concentration E1a (µg/kg) Mean (range)c | Percentage E2b Mean (range) | Concentration E2b (µg/kg) Mean (range)c | Number of Samplesd |
|---|---|---|---|---|---|
| 2,3-dehydro-1,8-cineole | 52.8 (49.6–58.1) | 4.08 (0.11–18.70) | 47.2 (41.9–50.4) | 3.98 (0.08–18.99) | 12 |
| a2,3-epoxy-1,8-cineole | 33.9 (25.8–42.0) | 1.29 (0.28–2.09) | 66.1 (58.0–74.2) | 2.74 (0.38–5.67) | 8 |
| a2-hydroxy-1,8-cineole | 3.6 (0–7.8) | 4.31 (0–15.99) | 96.4 (92.2–100) | 92.31 (1.91–219.65) | 12 |
| b2-hydroxy-1,8-cineole | 40.1 (28.1–68.9) | 2.01 (0.89–3.21) | 59.9 (31.1–71.9) | 3.79 (0.44–8.23) | 9 |
| a3-hydroxy-1,8-cineole | 75.4 (68.5–80.0) | 0.46 (0.02–1.16) | 24.6 (20.0–31.5) | 0.15 (0.01–0.37) | 10 |
| 9-hydroxy-1,8-cineole | 67.2 (50.4–81.9) | 2.51 (0.09–8.65) | 32.8 (18.1–49.6) | 2.11 (0.08–8.30) | 8 |
| 2-oxo-1,8-cineole | 27.3 (21.2–31.5) | 0.41 (0.24–0.78) | 72.7 (68.5–78.7) | 1.12 (0.59–1.93) | 4 |
| 3-oxo-1,8-cineole | 3.3 (0–5.0) | 0.08 (0–0.19) | 96.7 (95.0–100) | 1.74 (0.07–3.65) | 11 |

3. Discussion
3.1. Quantification of the Metabolites of 1,8-Cineole in Human Milk
3.1.1. Quantification Method Using Matrix Calibration
3.1.2. Time-Dependency of 1,8-Cineole Metabolism
3.2. Possible Influences on the Enantiomeric Ratios of the Metabolites
3.3. Comparison with Other Studies on Human 1,8-Cineole Metabolites
4. Experimental Section
4.1. Chemicals/Materials
4.2. Human Milk Samples
4.3. Sample Preparation for GC Analysis by Solvent Assisted Flavour Evaporation
4.4. Gas Chromatography-Mass Spectrometry (GC-MS)
4.5. Determination of the Ratios of Enantiomers
4.6. Quantification with Internal Standard and Matrix Calibration
| Metabolite | m/z for Data Analysis | Equation of Calibration Curve | Correlation Coefficient |
|---|---|---|---|
| 2,3-dehydro-1,8-cineole (low rangea) | 109 | y=6.5814x-0.0004 | 0.9988 |
| a2,3-epoxy-1,8-cineole (low rangea) | 95 | y=1.8892x-0.0002 | 0.9996 |
| a2-hydroxy-1,8-cineole (high rangeb) | 108 | y=2.0255x-0.0069 | 0.9938 |
| a2-hydroxy-1,8-cineole (low rangea) | 108 | y=1.8600x-0.0007 | 0.9988 |
| 7-hydroxy-1,8-cineole (low rangea) | 111 | y=0.2487x-0.0001 | 0.9926 |
| 9-hydroxy-1,8-cineole (low rangea) | 139 | y=9.4586x-0.0001 | 0.9961 |
| 4-hydroxy-1,8-cineole (high rangeb) | 112 | y=2.1108x-0.0282 | 0.9996 |
| 4-hydroxy-1,8-cineole (low rangea) | 112 | y=1.9539x-0.0010 | 0.9965 |
| 2-oxo-1,8-cineole (low rangea) | 82 | y=4.5637x-0.0002 | 0.9995 |
| 3-oxo-1,8-cineole (high rangeb) | 153 | y=15.6904x-0.0002 | 0.9964 |
| 3-oxo-1,8-cineole (low rangea) | 153 | y=15.9449x-0.0001 | 0.9995 |
| a3-hydroxy-1,8-cineole (low rangea) | 108 | y=15.2720x-0.0001 | 0.9962 |
5. Conclusions
Acknowledgments
Conflict of Interest
References
- Opdyke, D.L.J. Monographs of fragrance raw materials: Eucalyptol. Food Cosmet. Toxicol. 1975, 13, 105–106. [Google Scholar] [CrossRef]
- de Vincenzi, M.; Silano, M.; de Vincenzi, A.; Maialetti, F.; Scazzocchio, B. Constituents of aromatic plants: Eucalyptol. Fitoterapia 2002, 73, 269–275. [Google Scholar] [CrossRef]
- Opinion of the scientific committee on food on eucalyptol, 2002. Available online: http://ec.europa.eu/food/fs/sc/scf/out126_en.pdf accessed on 29 January 2013.
- Iqbal, Z.; Akhtar, M.; Qureshi, T.M.; Akhter, J.; Ahmad, R. Variation in composition and yield of foliage oil of eucalyptus polybractea. J. Chem. Soc. Pak. 2011, 33, 183–187. [Google Scholar]
- Barton, A.F.M.; Tjandra, J.; Nicholas, P.G. Chemical evaluation of volatile oils in eucalyptus species. J. Agric. Food Chem. 1989, 37, 1253–1257. [Google Scholar] [CrossRef]
- Juergens, U.R.; Dethlefsen, U.; Steinkamp, G.; Gillissen, A.; Repges, R.; Vetter, H. Anti-inflammatory activity of 1.8-cineol (eucalyptol) in bronchial asthma: A double-blind placebo-controlled trial. Respir. Med. 2003, 97, 250–256. [Google Scholar] [CrossRef]
- Worth, H.; Schacher, C.; Dethlefsen, U. Concomitant therapy with cineole (eucalyptole) reduces exacerbations in COPD: A placebo-controlled double-blind trial. Respir. Res. 2009, 10, 69. [Google Scholar] [CrossRef]
- Nilberto, R.N.F.; Refosco, R.M.C.; Vasconcelos, E.C.F.; Kerntopf, M.R.; Santos, C.F.; Batista, F.J.A.; de Sousa, C.M.; Fonteles, M.C. 1,8-Cineole induces relaxation in rat and guinea-pig airway smooth muscle. J. Pharm. Pharmacol. 2009, 61, 361–366. [Google Scholar] [CrossRef]
- Juergens, U.R.; Stober, M.; Schmidt-Schilling, L.; Kleuver, T.; Vetter, H. Antiinflammatory effects of eucalyptol (1.8-cineole) in bronchial asthma: Inhibition of arachidonic acid metabolism in human blood monocytes ex vivo. Eur. J. Med. Res. 1998, 3, 407–412. [Google Scholar]
- Matthys, H.; de Mey, C.; Carls, C.; Rys, A.; Geib, A.; Wittig, T. Efficacy and tolerability of myrtol standardized in acute bronchitis - a multi-centre, randomised, double-blind, placebo-controlled parallel group clinical trial vs. cefuroxime and ambroxol. Arzneimittel-Forsch. 2000, 50, 700–711. [Google Scholar]
- Federspil, P.; Wulkow, R.; Zimmermann, T. Efficacy of myrtol standardized in the therapy of acute sinusitis—Results of a double blind, randomized, placebo-controlled multicentered trial. Laryngo-Rhino-Otologie 1997, 76, 23–27. [Google Scholar]
- Kohlert, C.; van Rensen, I.; Marz, R.; Schindler, G.; Graefe, E.U.; Veit, M. Bioavailability and pharmacokinetics of natural volatile terpenes in animals and humans. Planta Med. 2000, 66, 495–505. [Google Scholar] [CrossRef]
- Ishida, T. Biotransformation of terpenoids by mammals, microorganisms, and plant-cultured cells. Chem. Biodiversity 2005, 2, 569–590. [Google Scholar] [CrossRef]
- Breitmaier, E. Terpenes: Importance, general structure, and biosynthesis. In Terpenes—Flavors, Fragrances, Pharmaca, Pheromones; WILEY-VCH: Weinheim, Germany, 2006. [Google Scholar]
- Homburger, F.; Boger, E. Carcinogenicity of essential oils, flavors and spices—A review. Cancer Res. 1968, 28, 2372–2374. [Google Scholar]
- Waddell, W.J. Thresholds of carcinogenicity of flavors. Toxicol. Sci. 2002, 68, 275–279. [Google Scholar] [CrossRef]
- Opinion of the scientific committee on food on the safety of the presence of safrole in flavourings and other food ingredients with flavouring properties, 2002.
- Opinion of the scientific committee on food on estragole (1-allyl-4-methoxybenzene), 2001.
- Smith, R.L.; Adams, T.B.; Doull, J.; Feron, V.J.; Goodman, J.I.; Marnett, L.J.; Portoghese, P.S.; Waddell, W.J.; Wagner, B.M.; Rogers, A.E.; et al. Safety assessment of allylalkoxybenzene derivatives used as flavouring substances—Methyl eugenol and estragole. Food Chem. Toxicol. 2002, 40, 851–870. [Google Scholar] [CrossRef]
- Smith, R.L.; Cohen, S.M.; Doull, J.; Feron, V.J.; Goodman, J.I.; Marnett, L.J.; Munro, I.C.; Portoghese, P.S.; Waddell, W.J.; Wagner, B.M.; et al. Criteria for the safety evaluation of flavoring substances. The expert panel of the flavor and extract manufacturers association. Food Chem. Toxicol. 2005, 43, 1141–1177. [Google Scholar] [CrossRef]
- Opinion of the scientific committee on food on methyleugenol (4-allyl-1,2-dimethoxybenzene), 2001.
- Jenner, P.M.; Hagan, E.C.; Taylor, J.M.; Cook, E.L.; Fitzhugh, O.G. Food flavourings and compounds of related structure I. Acute oral toxicity. Food Cosmet. Toxicol. 1964, 2, 327–343. [Google Scholar] [CrossRef]
- Engel, W. In vivo studies on the metabolism of the monoterpenes S-(+)- and R-(-)-carvone in humans using the metabolism of ingestion-correlated amounts (mica) approach. J. Agric. Food Chem. 2001, 49, 4069–4075. [Google Scholar] [CrossRef]
- Jager, W.; Mayer, M.; Platzer, P.; Reznicek, G.; Dietrich, H.; Buchbauer, G. Stereoselective metabolism of the monoterpene carvone by rat and human liver microsomes. J. Pharm. Pharmacol. 2000, 52, 191–197. [Google Scholar] [CrossRef]
- Engel, W. Detection of a "nonaromatic" NIH shift during in vivo metabolism of the monoterpene carvone in humans. J. Agric. Food Chem. 2002, 50, 1686–1694. [Google Scholar] [CrossRef]
- Zeller, A.; Horst, K.; Rychlik, M. Study of the metabolism of estragole in humans consuming fennel tea. Chem. Res. Toxicol. 2009, 22, 1929–1937. [Google Scholar] [CrossRef]
- Pass, G.J.; McLean, S.; Stupans, I.; Davies, N. Microsomal metabolism of the terpene 1,8-cineole in the common brushtail possum (trichosurus vulpecula), koala (phascolarctos cinereus), rat and human. Xenobiotica 2001, 31, 205–221. [Google Scholar] [CrossRef]
- Duisken, M.; Sandner, F.; Blomeke, B.; Hollender, J. Metabolism of 1,8-cineole by human cytochrome P450 enzymes: Identification of a new hydroxylated metabolite. BBA—Gen. Subjects 2005, 1722, 304–311. [Google Scholar] [CrossRef]
- Horst, K.; Rychlik, M. Quantification of 1,8-cineole and of its metabolites in humans using stable isotope dilution assays. Mol. Nutr. Food Res. 2010, 54, 1515–1529. [Google Scholar] [CrossRef]
- Kirsch, F.; Horst, K.; Röhrig, W.; Rychlik, M.; Buettner, A. Tracing metabolite profiles in human milk: Studies on the odorant 1,8-cineole transferred into breast milk after oral intake. Metabolomics 2012, 1–14. [Google Scholar]
- Engel, W.; Bahr, W.; Schieberle, P. Solvent assisted flavour evaporation - a new and versatile technique for the careful and direct isolation of aroma compounds from complex food matrices. Eur. Food Res. Technol. 1999, 209, 237–241. [Google Scholar] [CrossRef]
- McManaman, J.L.; Neville, M.C. Mammary physiology and milk secretion. Adv. Drug Delivery. Rev. 2003, 55, 629–641. [Google Scholar] [CrossRef]
- Berlin, C.M.; Briggs, G.G. Drugs and chemicals in human milk. Semin. Fetal. Neonatal Med. 2005, 10, 149–159. [Google Scholar] [CrossRef]
- Arena, J.M. Contamination of the ideal food. Nutrition Today 1970, 5, 2–8. [Google Scholar] [CrossRef]
- Committee on Drugs. The transfer of drugs and other chemicals into human milk. Pediatrics 2001, 108, 776–789. [CrossRef]
- Kroemer, H.K.; Fromm, M.F.; Eichelbaum, M. Stereoselectivity in drug metabolism and action: Effects of enzyme inhibition and induction. Ther. Drug Monit. 1996, 18, 388–392. [Google Scholar] [CrossRef]
- Brocks, D.R. Drug disposition in three dimensions: An update on stereoselectivity in pharmacokinetics. Biopharm. Drug Dispos. 2006, 27, 387–406. [Google Scholar] [CrossRef]
- Lu, H. Stereoselectivity in drug metabolism. Expert Opin. Drug Metab. Toxicol. 2007, 3, 149–158. [Google Scholar] [CrossRef]
- Kirsch, F.; Beauchamp, J.; Buettner, A. Time-dependent aroma changes in breast milk after oral intake of a pharamcological preparation containing 1,8-cineole. Clin. Nutr. 2012, 31, 682–692. [Google Scholar] [CrossRef]
- van den Dool, H.; Kratz, P.D. A generalization of retention index system including linear temperature programmed gas-liquid partition chromatography. J. Chromatogr. 1963, 11, 463–471. [Google Scholar] [CrossRef]
- Schaffarczyk, M.; Balaban, T.S.; Rychlik, M.; Buettner, A. Syntheses of chiral 1,8-cineole-metabolites and determination of their enantiomeric composition in human urine after ingestion of 1,8-cineole-containing capsules. Chem. Plus Chem. 2012, 10–1002. [Google Scholar] [CrossRef]
- Kent, J.C.; Mitoulas, L.R.; Cregan, M.D.; Ramsay, D.T.; Doherty, D.A.; Hartmann, P.E. Volume and frequency of breastfeedings and fat content of breast milk throughout the day. Pediatrics 2006, 117, e387–e395. [Google Scholar] [CrossRef]
- Lee, I.S.; Kim, D. Polymorphic metabolism by functional alterations of human cytochrome P450 enzymes. Arch. Pharm. Res. 2011, 34, 1799–1816. [Google Scholar] [CrossRef]
- Daly, A.K.; Cholerton, S.; Gregory, W.; Idle, J.R. Metabolic polymorphisms. Pharmacol. Ther. 1993, 57, 129–160. [Google Scholar] [CrossRef]
- Daly, A.K. Pharmacogenetics of the major polymorphic metabolizing enzymes. Fundam. Clin. Pharmacol. 2003, 17, 27–41. [Google Scholar] [CrossRef]
- Guengerich, F.P. Polymorphism of cytochrome-p-450 in humans. Trends Pharmacol. Sci. 1989, 10, 107–109. [Google Scholar] [CrossRef]
- Caldwell, J. Stereochemical determinants of the nature and consequences of drug metabolism. J. Chromatogr. A 1995, 694, 39–48. [Google Scholar] [CrossRef]
- Guengerich, F.P. Common and uncommon cytochrome P450 reactions related to metabolism and chemical toxicity. Chem. Res. Toxicol. 2001, 14, 611–650. [Google Scholar] [CrossRef]
- Testa, B.; Krämer, S. The biochemistry of drug metabolism—An introduction. Part 2. Redox reactions and their enzymes. Chem. Biodiversity 2007, 4, 257–405. [Google Scholar] [CrossRef]
- Malatkova, P.; Maser, E.; Wsol, V. Human carbonyl reductases. Curr. Drug MeTable 2010, 11, 639–658. [Google Scholar] [CrossRef]
- Prasad, B.; Rojubally, A.; Plettner, E. Identification of camphor oxidation and reduction products in pseudomonas putida: New activity of the cytochrome p450(cam) system. J. Chem. Ecol. 2011, 37, 657–667. [Google Scholar] [CrossRef]
- Pilka, E.S.; Niesen, F.H.; Lee, W.H.; El-Hawari, Y.; Dunford, J.E.; Kochan, G.; Wsol, V.; Martin, H.J.; Maser, E.; Oppermann, U. Structural basis for substrate specificity in human monomeric carbonyl reductases. PLoS One 2009. [Google Scholar] [CrossRef]
- Ishida, T.; Toyota, M.; Asakawa, Y. Terpenoid biotransformation in mammals. V. Metabolism of (+)-citronellal, (±)-7-hydroxycitronellal, citral, (-)-perillaldehyde, (-)-myrtenal, cuminaldehyde, thujone, and (±)-carvone in rabbits. Xenobiotica 1989, 19, 843–855. [Google Scholar] [CrossRef]
- Miyazawa, M.; Shindo, M. Biotransformation of 1,8-cineole by human liver microsomes. Natural Product Letters 2001, 15, 49–53. [Google Scholar] [CrossRef]
- Miyazawa, M.; Shindo, M.; Shimada, T. Oxidation of 1,8-cineole, the monoterpene cyclic ether originated from eucalyptus polybractea, by cytochrome P450 3A enzymes in rat and human liver microsomes. Drug Metab. Dispos. 2001, 29, 200–205. [Google Scholar]
- Wahlström, A.; Pacifici, G.M.; Lindstrom, B.; Hammar, L.; Rane, A. Human-liver morphine UDP-glucuronyl transferase enantioselectivity and inhibition by opioid congeners ans oxazepam. Br. J. Pharmacol. 1988, 94, 864–870. [Google Scholar] [CrossRef]
- Fournel-Gigleux, S.; Hamar-Hansen, C.; Motassim, N.; Antoine, B.; Mothe, O.; Decolin, D.; Caldwell, J.; Siest, G. Substrate specificity and enantioselectivity of arylcarboxylic acid glucuronidation. Drug Metab. Dispos. 1988, 16, 627–634. [Google Scholar]
- Bemelmans, J.M.H. Rewiev of isolation and concentration techniques. In Progress in Flavour Research; Land, D.G., Nursten, H.E., Eds.; Applied Science Publishers: London, UK, 1979; pp. 79–88. [Google Scholar]
Supplementary Files
© 2013 by the authors; licensee MDPI, Basel, Switzerland. This article is an open access article distributed under the terms and conditions of the Creative Commons Attribution license (http://creativecommons.org/licenses/by/3.0/).
Share and Cite
Kirsch, F.; Buettner, A. Characterisation of the Metabolites of 1,8-Cineole Transferred into Human Milk: Concentrations and Ratio of Enantiomers. Metabolites 2013, 3, 47-71. https://doi.org/10.3390/metabo3010047
Kirsch F, Buettner A. Characterisation of the Metabolites of 1,8-Cineole Transferred into Human Milk: Concentrations and Ratio of Enantiomers. Metabolites. 2013; 3(1):47-71. https://doi.org/10.3390/metabo3010047
Chicago/Turabian StyleKirsch, Frauke, and Andrea Buettner. 2013. "Characterisation of the Metabolites of 1,8-Cineole Transferred into Human Milk: Concentrations and Ratio of Enantiomers" Metabolites 3, no. 1: 47-71. https://doi.org/10.3390/metabo3010047
APA StyleKirsch, F., & Buettner, A. (2013). Characterisation of the Metabolites of 1,8-Cineole Transferred into Human Milk: Concentrations and Ratio of Enantiomers. Metabolites, 3(1), 47-71. https://doi.org/10.3390/metabo3010047