The Metabolic Interplay between Plants and Phytopathogens

Abstract
:
1. Introduction
2. Methods
2.1. Plant-Pathogen pairs, Sequence Information

| Pathogen | Plant | Pathogen type | Unicellular/multicellular | Tissue colonisation | Obligate pathogen |
|---|---|---|---|---|---|
| Pseudomonas syringae pv. tomato (323) | Arabidopsis thaliana (3702) [1] | Bacterium/hemi-biotrophic [6] | unicellular | apoplast | no |
| Xanthomonas oryzae pv. Oryzae(64187) | Oryza sativa (4530) [25] | Bacterium/biotrophic [29] | unicellular | apoplast | no |
| Ustilago maydis (5270) | Zea mays (4577) [27] | Fungus/biotrophic [27] | multicellular | apoplast and cells | yes |
| Melampsora larici-populina (203908) | Populus trichocarpa (3694) [30] | Fungus/biotrophic [30] | multicellular | apoplast and cells | yes |
| Sclerotinia sclerotiorum (5180) | Glycine max (3847) [31] | Fungus/necrotrophic [32] | multicellular | apoplast | no |
| Organism pair | Abbreviation | Number of proteins |
|---|---|---|
| Arabidopsis thaliana [33] | At | 221,677 |
| Pseudomonas syringae pv. Tomato [34] | Ps | 41,274 |
| Oryza sativa [35] | Os | 257,407 |
| Xanthomonas oryzae pv. Oryzae [25,36] | Xo | 29,011 |
| Zea mays [37] | Zm | 101,421 |
| Ustilago maydis [38] | Um | 14,433 |
| Populus trichocarpa [39] | Pt | 87,553 |
| Melampsora larici-populina [40] | Ml | 16,384 |
| Glycine max [41] | Gm | 35,645 |
| Sclerotinia sclerotiorum | Ss | 30,901 |
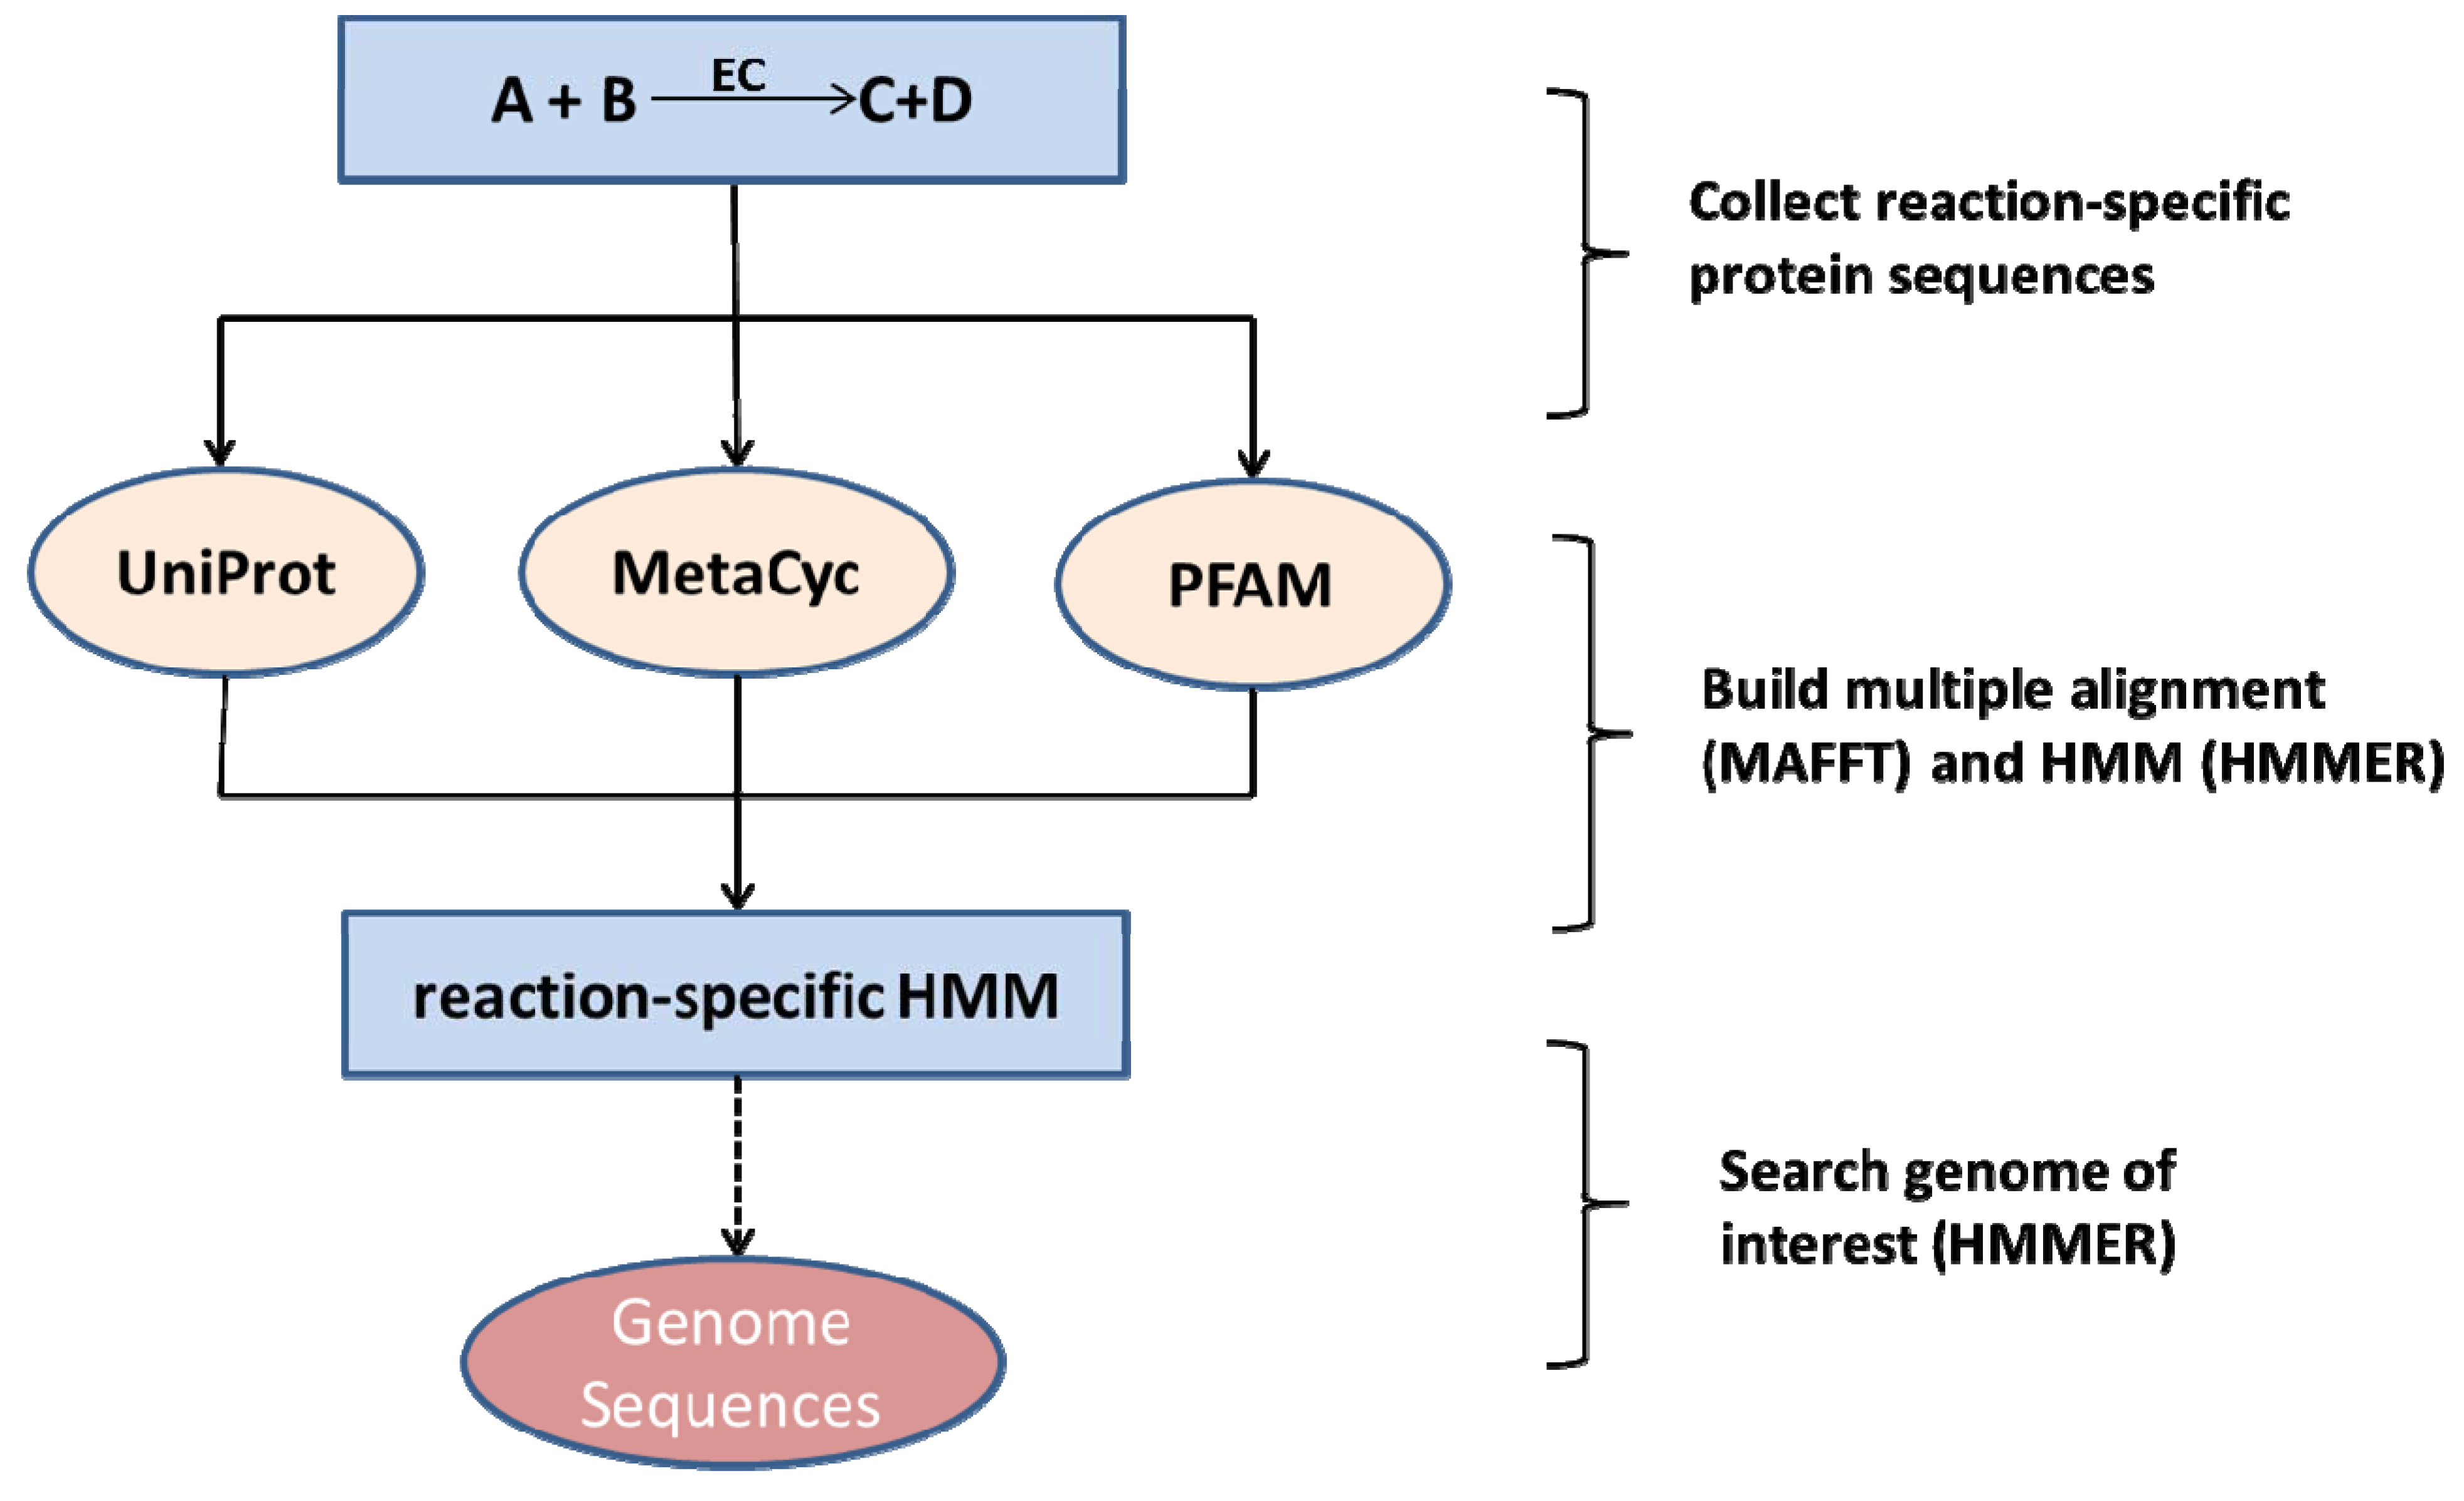
2.2. Species-Independent Reaction Models
2.3. Network Curation and Gap-Filling
2.4. Interaction Analysis of Metabolic Networks
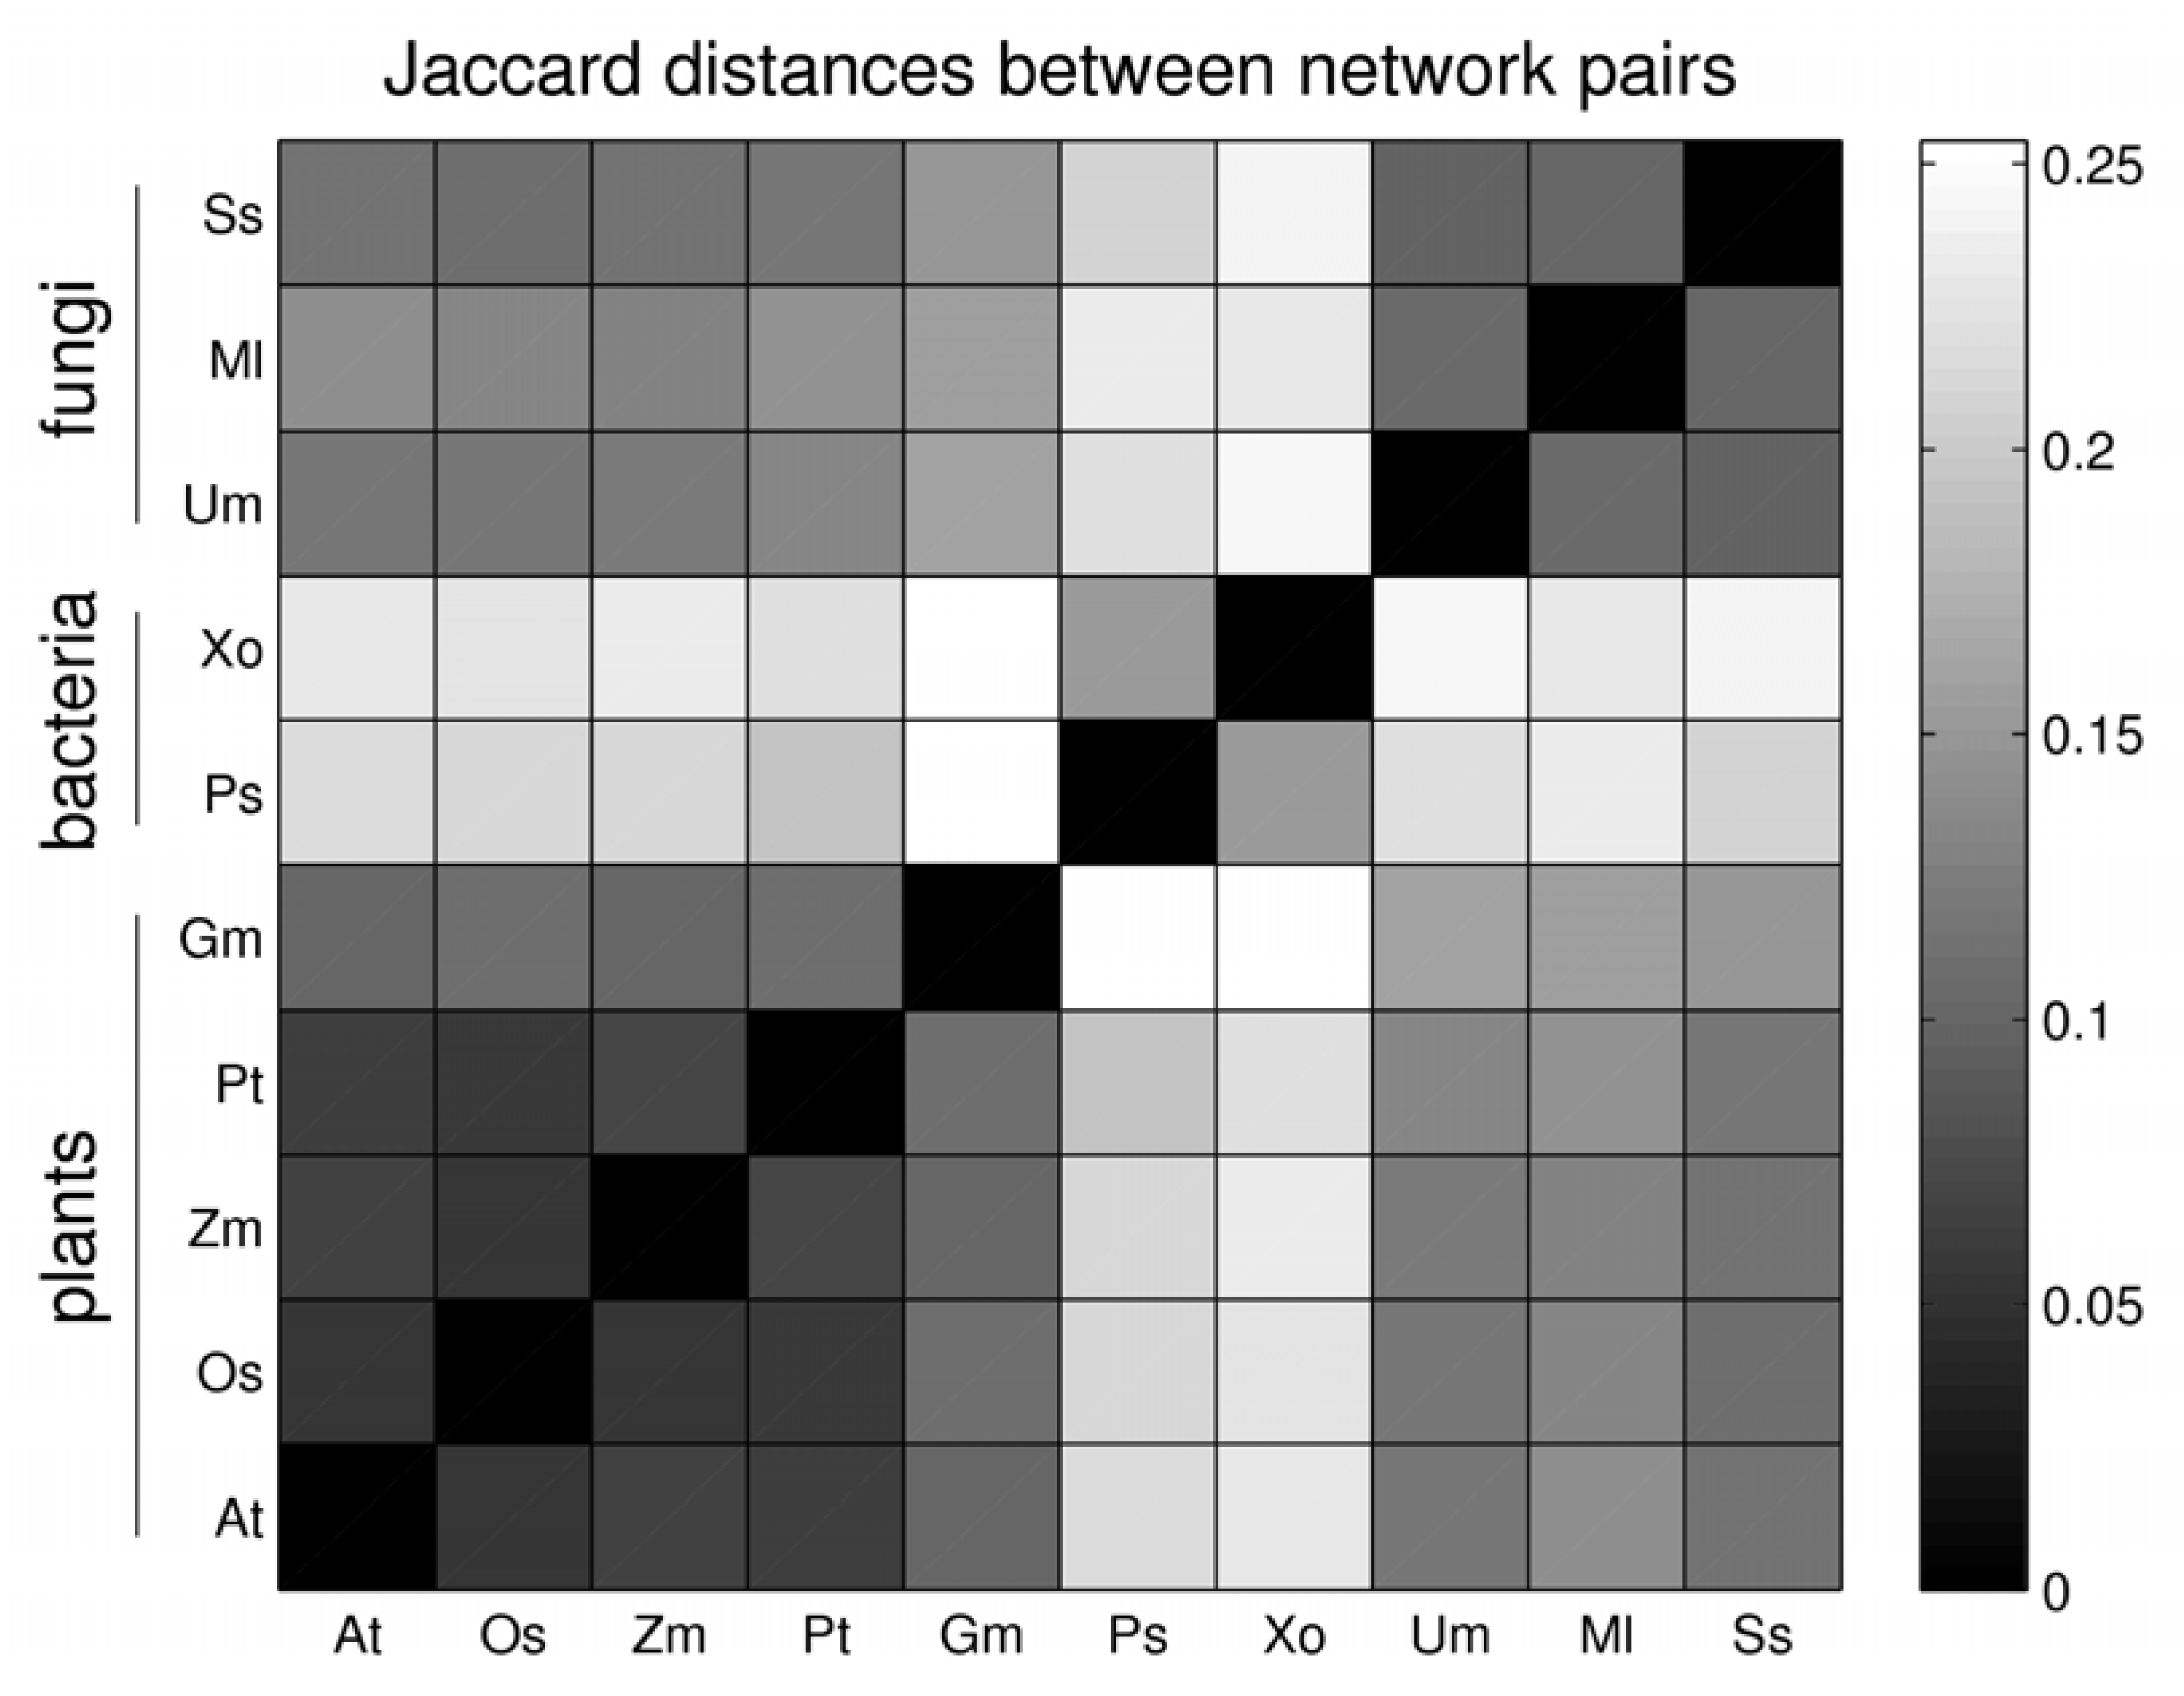
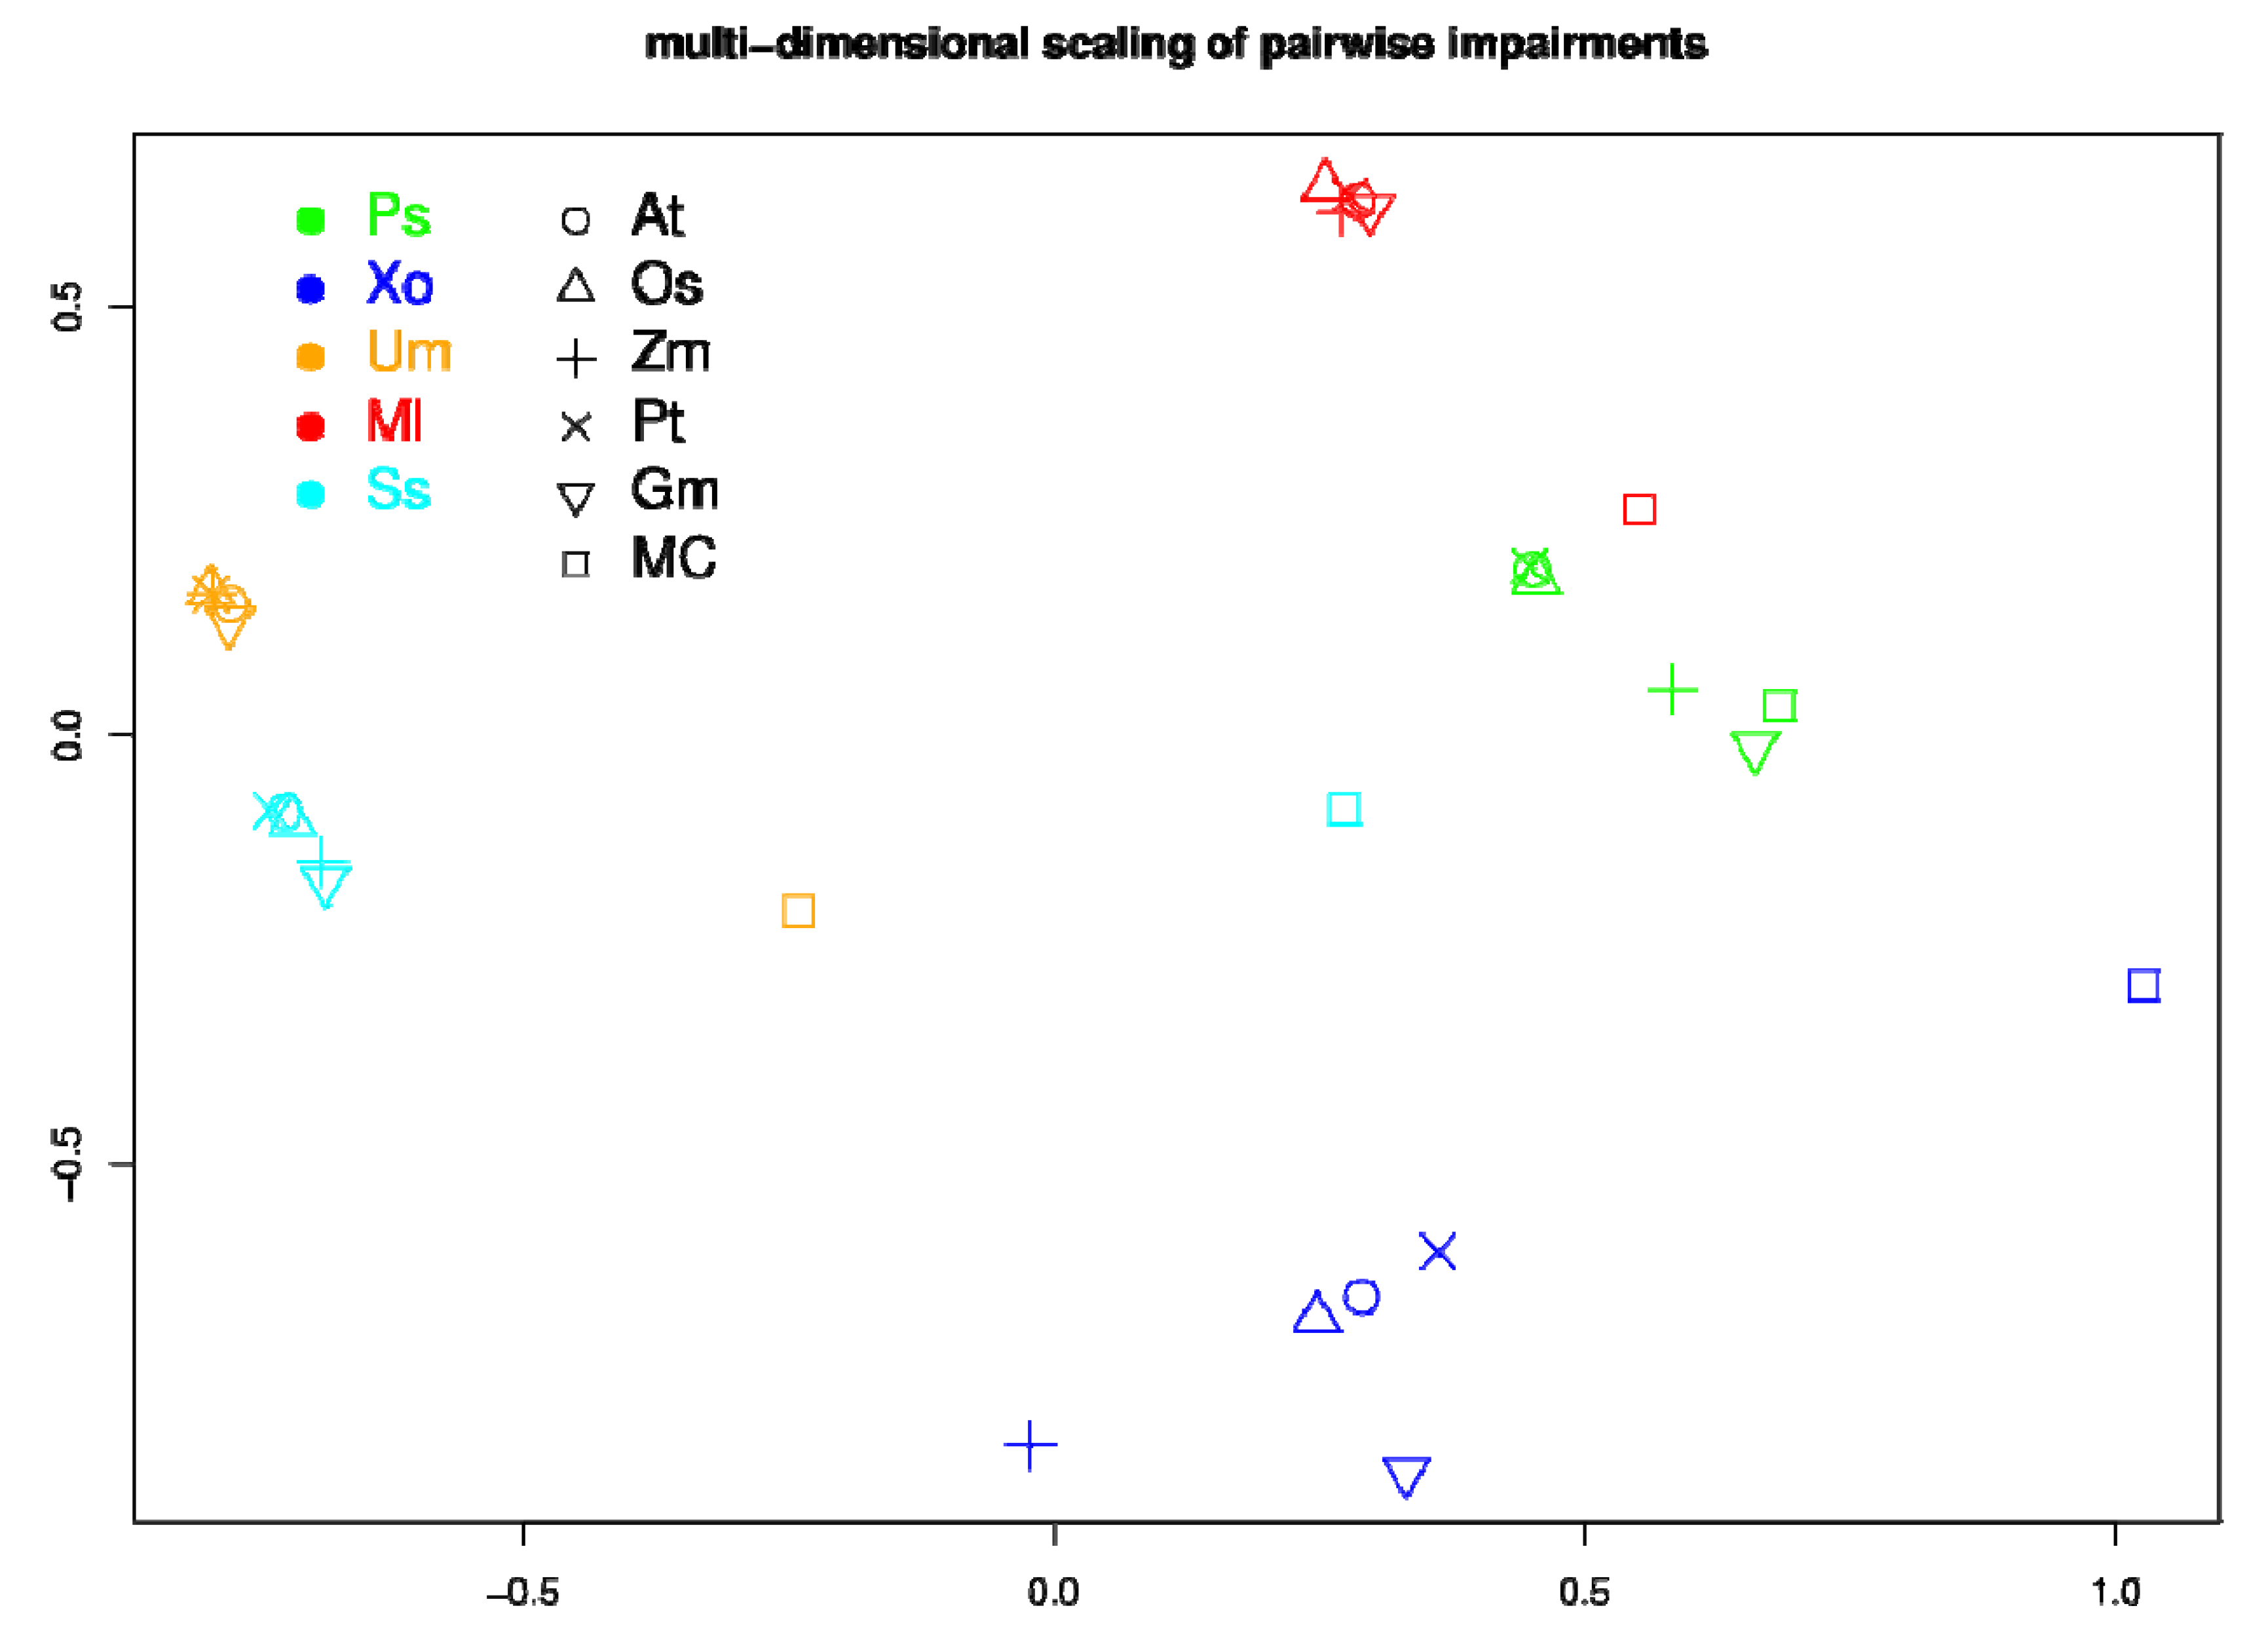
2.5. Network Comparison and Multidimensional Scaling (MDS)
2.6. Network Visualization
3. Results
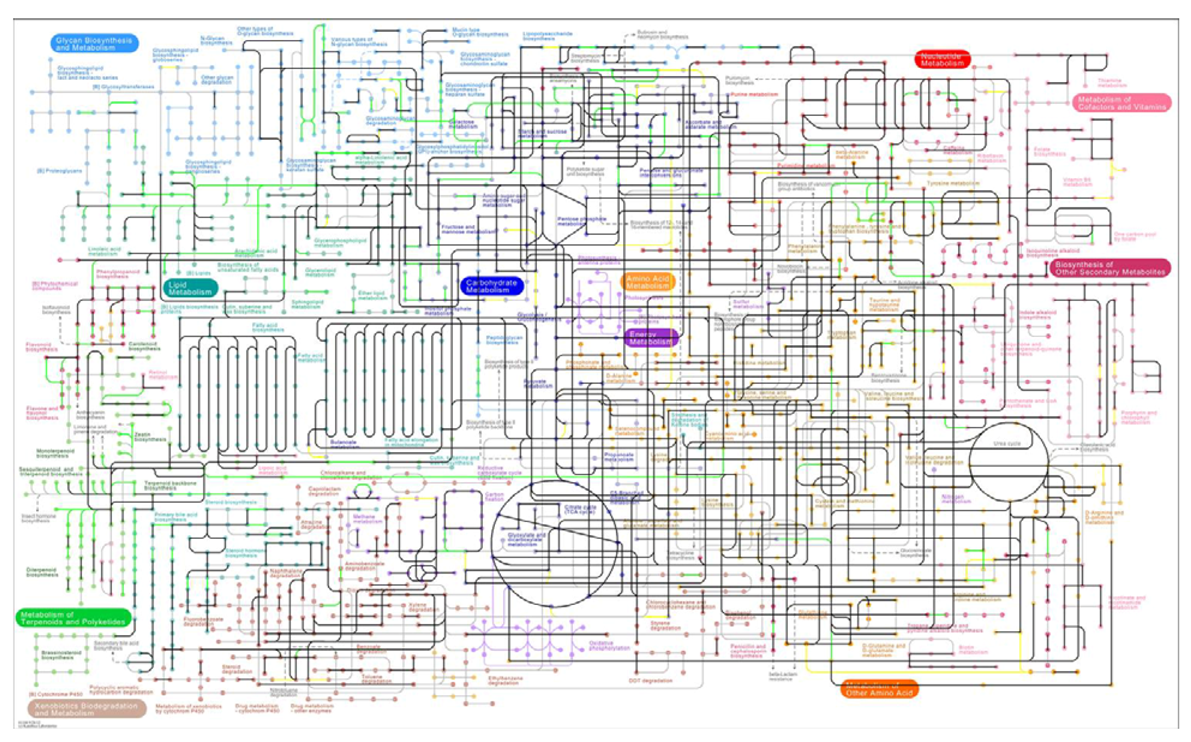
3.1. The Genome-Scale Metabolic Networks
| Organism | Kingdom | No. reactions (annotated) | No. reactions (curated) | No. metabolites (curated) | No. of added extension reactions |
| At | Planta | 3,608 | 3,316 (91.9%) | 3,560 | 2 |
| Ps | Bactera | 3,223 | 2,964 (92.0%) | 3,175 | NA |
| Os | Planta | 3,680 | 3,357 (91.2%) | 3,617 | 1 |
| Xo | Bacteria | 3,026 | 2,799 (92.5%) | 3,064 | NA |
| Zm | Planta | 3,606 | 3,315 (91.9%) | 3,596 | 4 |
| Um | Fungi | 3,398 | 3,107 (91.4%) | 3,398 | NA |
| Pt | Planta | 3,758 | 3,442 (91.6%) | 3,653 | 1 |
| Ml | Fungi | 3,368 | 3,084 (91.6%) | 3,356 | NA |
| Gm | Planta | 3,380 | 3,130 (92.6%) | 3,446 | 4 |
| Ss | Fungi | 3,505 | 3,200 (91.3%) | 3,493 | NA |
| MC | 9,531 | 8,780 (92.1%) | 7,755 | NA |
3.2. Visualization of Pathogen-Plant Metabolic Networks

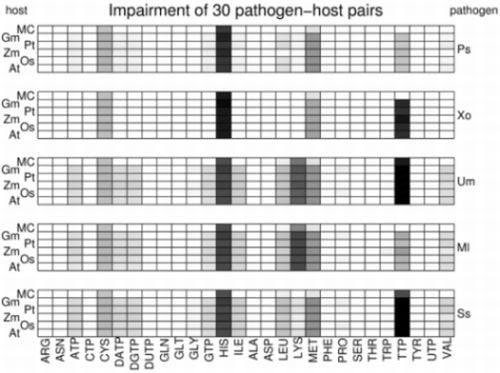
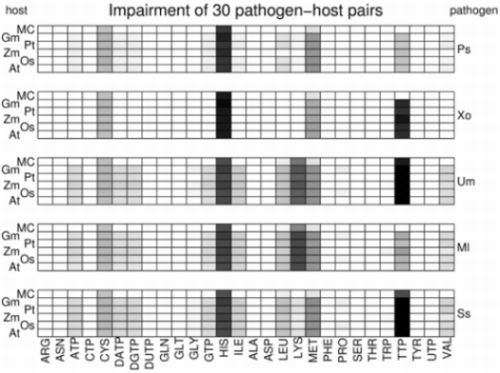
3.3. Network Analysis of Plant-Pathogen Network Pairs
| gain | asymmetric gain plant | asymmetric gain pathogen | Jaccard distance | |
| At - Ps | 1 | 34 | 146 | 0.216 |
| Gm– Ss | 191 | 238 | 220 | 0.145 |
| Os– Xo | 21 | 68 | 214 | 0.223 |
| Pt– Ml | 2 | 14 | 301 | 0.140 |
| Zm –Um | 8 | 19 | 308 | 0.122 |

4. Discussion and Conclusions
Supplementary Material
- (1)
- Navigable metabolic network maps for the plant-pathogen pairs At-Ps, Gm-Ss, Os-Xo, Pt-Ml, and Zm-Um.
- (2)
- The reactions list for all the species used in this research and MetaCyc.
- (3)
- Various plant-pathogen impairment profile plots.
Acknowledgments
Conflict of Interest
References
- De Vos, M.; Van Oosten, V.R.; Van Poecke, R.M. P.; Van Pelt, J.A.; Pozo, M.J.; Mueller, M.J.; Buchala, A.J.; Métraux, J.-P.; Van Loon, L.C.; Dicke, M.; et al. Signal signature and transcriptome changes of Arabidopsis during pathogen and insect attack. Mol. Plant Microbe Interact. 2005, 18, 923–937. [Google Scholar] [CrossRef]
- Jones, J.D. G.; Dangl, J.L. The plant immune system. Nature 2006, 444, 323–329. [Google Scholar]
- Ward, J.L.; Forcat, S.; Beckmann, M.; Bennett, M.; Miller, S.J.; Baker, J.M.; Hawkins, N.D.; Vermeer, C.P.; Lu, C.; Lin, W.; et al. The metabolic transition during disease following infection of Arabidopsis thaliana by Pseudomonas syringae pv. tomato. Plant J. 2010, 443–457. [Google Scholar]
- Allwood, J.W.; Clarke, A.; Goodacre, R.; Mur, L.A. J. Dual metabolomics: A novel approach to understanding plant-pathogen interactions. Phytochemistry 2010, 71, 590–597. [Google Scholar]
- Berger, S.; Sinha, A.K.; Roitsch, T. Plant physiology meets phytopathology: plant primary metabolism and plant-pathogen interactions. J. Exp. Bot. 2007, 58, 4019–4026. [Google Scholar] [CrossRef]
- Glazebrook, J. Contrasting mechanisms of defense against biotrophic and necrotrophic pathogens. AnnuRev Phytopathol 2005, 43, 205–207. [Google Scholar] [CrossRef]
- Batut, J.; Andersson, S.G. E.; O’Callaghan, D. The evolution of chronic infection strategies in the alpha-proteobacteria. Nat. Rev. Microbiol. 2004, 2, 933–945. [Google Scholar] [CrossRef]
- Moran, N.A. Microbial minimalism: Genome reduction in bacterial pathogens. Cell 2002, 108, 583–586. [Google Scholar] [CrossRef]
- Lee, M.-C.; Marx, C.J. Repeated, Selection-Driven Genome Reduction of Accessory Genes in Experimental Populations. PLoSGenet. 2012, 8, e1002651. [Google Scholar]
- Thilmony, R.; Underwood, W.; He, S.Y. Genome-wide transcriptional analysis of the Arabidopsis thaliana interaction with the plant pathogen Pseudomonas syringae pv. tomato DC3000 and the human pathogen Escherichia coli O157:H7. Plant J. 2006, 46, 34–53. [Google Scholar] [CrossRef]
- Rinaldi, C.; Kohler, A.; Frey, P.; Duchaussoy, F.; Ningre, N.; Couloux, A.; Wincker, P.; Le Thiec, D.; Fluch, S.; Martin, F.; et al. Transcript profiling of poplar leaves upon infection with compatible and incompatible strains of the foliar rust Melampsoralarici-populina. Plant Physiol. 2007, 144, 347–366. [Google Scholar]
- Raghunathan, A.; Reed, J.; Shin, S.; Palsson, B.; Daefler, S. Constraint-based analysis of metabolic capacity of Salmonella typhimurium during host-pathogen interaction. BMC Syst. Biol 2009, 3, 38. [Google Scholar] [CrossRef]
- Raghunathan, A.; Price, N.D.; Galperin, M.Y.; Makarova, K.S.; Purvine, S.; Picone, A.F.; Cherny, T.; Xie, T.; Reilly, T.J.; Munson, R.; et al. In Silico Metabolic Model and Protein Expression of Haemophilus influenzae Strain Rd KW20 in Rich Medium. OMICS 2004, 8, 25–41. [Google Scholar] [CrossRef]
- Pinzón, A.; Rodriguez-R, L.M.; González, A.; Bernal, A.; Restrepo, S. Targeted metabolic reconstruction: a novel approach for the characterization of plant-pathogen interactions. Brief. Bioinformatics 2011, 12, 151–162. [Google Scholar] [CrossRef]
- Shendure, J.; Mitra, R.D.; Varma, C.; Church, G.M. Advanced sequencing technologies: methods and goals. Nat. Rev. Genet. 2004, 5, 335–344. [Google Scholar]
- Kanehisa, M.; Goto, S.; Kawashima, S.; Nakaya, A. The KEGG databases at GenomeNet. Nucleic. Acids Res. 2002, 30, 42–46. [Google Scholar] [CrossRef]
- Krieger, C.J.; Zhang, P.; Mueller, L.a; Wang, A.; Paley, S.; Arnaud, M.; Pick, J.; Rhee, S.Y.; Karp, P.D. MetaCyc: a multiorganism database of metabolic pathways and enzymes. Nucleic. Acids Res. 2004, 32, D438–D442. [Google Scholar]
- Rico, A.; Preston, G.M. Pseudomonas syringae pv. tomato DC3000 uses constitutive and apoplast-induced nutrient assimilation pathways to catabolize nutrients that are abundant in the tomato apoplast. Mol. Plant Microbe Interact. 2008, 21, 269–282. [Google Scholar]
- Handorf, T.; Ebenhöh, O.; Heinrich, R. Expanding metabolic networks: scopes of compounds, robustness, and evolution. J. Mol. Evol. 2005, 61, 498–512. [Google Scholar] [CrossRef]
- Christian, N.; Handorf, T.; Ebenhöh, O. Metabolic synergy: increasing biosynthetic capabilities by network cooperation. Genome Inform 2007, 18, 320–329. [Google Scholar]
- Freilich, S.; Kreimer, A.; Meilijson, I.; Gophna, U.; Sharan, R.; Ruppin, E. The large-scale organization of the bacterial network of ecological co-occurrence interactions. Nucleic Acids Res. 2010, 38, 3857–3868. [Google Scholar]
- Borenstein, E.; Feldman, M.W. Topological signatures of species interactions in metabolic networks. J. Comput. Biol. 2009, 16, 191–200. [Google Scholar] [CrossRef]
- kreimer, A.; Doron, A.; Borenstein, E.; Freilich, S. NetCmpt: A network-based tool for calculating the metabolic competition between bacterial species. Bioinformatics 2012, 28, 2195–2197. [Google Scholar] [CrossRef]
- Pinon, J.; Frey, P. Interactions between poplar clones and Melampsora populations and their implications for breeding for durable resistance. In Rust Diseases of Willow and Poplar; Pei, M.H., McCracken, A.R., Eds.; CABI: Wallingford, UK, 2005; pp. 139–154. [Google Scholar]
- Salzberg, S.L.; Sommer, D.D.; Schatz, M.C.; Phillippy, A.M.; Rabinowicz, P.D.; Tsuge, S.; Furutani, A.; Ochiai, H.; Delcher, A.L.; Kelley, D.; et al. Genome sequence and rapid evolution of the rice pathogen Xanthomonas oryzae pv. oryzae PXO99A. BMC genomics 2008, 9, 204. [Google Scholar]
- Saharan, G.S.; Mehta, N. Sclerotinia Diseases of Crop Plants: Biology, Ecology and Disease Management; Springer-Verlag GmbH: Heidelberg, Germany, 2008. [Google Scholar]
- Mueller, O.; Kahmann, R.; Aguilar, G.; Trejo-Aguilar, B.; Wu, A.; de Vries, R.P. The secretome of the maize pathogen Ustilago maydis. Fungal Genet. Biol. 2008, 45 Suppl. 1, S63–S70. [Google Scholar] [CrossRef]
- Altschul, S.F.; Madden, T.L.; Schäffer, a a; Zhang, J.; Zhang, Z.; Miller, W.; Lipman, D.J. Gapped BLAST and PSI-BLAST: a new generation of protein database search programs. Nucleic Acids Res. 1997, 25, 3389–3402. [Google Scholar] [CrossRef]
- Hammond-Kosack, K.E.; Jones, J.D. G. Plant disease resistance genes. Annu. Rev. Plant Physiol. Plant Mol. Biol. 1997, 48, 575–607. [Google Scholar] [CrossRef]
- Hacquard, S.; Joly, D.L.; Lin, Y.-C.; Tisserant, E.; Feau, N.; Delaruelle, C.; Legué, V.; Kohler, A.; Tanguay, P.; Petre, B.; et al. A comprehensive analysis of genes encoding small secreted proteins identifies candidate effectors in Melampsora larici-populina (poplar leaf rust). Mol. Plant Microbe Interact. 2012, 25, 279–293. [Google Scholar] [CrossRef]
- Malenčić, D.; Kiprovski, B.; Popović, M.; Prvulović, D.; Miladinović, J.; Djordjević, V. Changes in antioxidant systems in soybean as affected by Sclerotinia sclerotiorum (Lib.) de Bary. Plant Physiol. Biochem. 2010, 48, 903–908. [Google Scholar] [CrossRef]
- Amselem, J.; Cuomo, C.A.; van Kan, J.A. L.; Viaud, M.; Benito, E.P.; Couloux, A.; Coutinho, P.M.; de Vries, R.P.; Dyer, P.S.; Fillinger, S.; et al. Genomic analysis of the necrotrophic fungal pathogens Sclerotinia sclerotiorum and Botrytis cinerea. PLoS Genet. 2011, 7, e1002230. [Google Scholar]
- Initiative, T.A. G. Analysis of the genome sequence of the flowering plant Arabidopsis thaliana. Nature 2000, 408, 796–815. [Google Scholar]
- Buell, C.R.; Joardar, V.; Lindeberg, M.; Selengut, J.; Paulsen, I.T.; Gwinn, M.L.; Dodson, R.J.; Deboy, R.T.; Durkin, A.S.; Kolonay, J.F.; et al. The complete genome sequence of the Arabidopsis and tomato pathogen Pseudomonas syringae pv. tomato DC3000. Proc. Natl. Acad. Sci. USA 2003, 100, 10181–10186. [Google Scholar]
- Yu, J.; Hu, S.; Wang, J.; Wong, G.K.-S.; Li, S.; Liu, B.; Deng, Y.; Dai, L.; Zhou, Y.; Zhang, X.; et al. A draft sequence of the rice genome (Oryza sativa L. ssp. indica). Science 2002, 296, 79–92. [Google Scholar]
- Ochiai, H.; Inoue, Y.; Takeya, M.; Sasaki, A.; Kaku, H. Genome sequence of Xanthomonas oryzae pv. oryzae suggests contribution of large numbers of effector genes and insertion sequences to its race diversity. JARQ. Jpn. Agric. Res. Q. 2005, 39, 275–287. [Google Scholar]
- Schnable, P.S.; Ware, D.; Fulton, R.S.; Stein, J.C.; Wei, F.; Pasternak, S.; Liang, C.; Zhang, J.; Fulton, L.; Graves, T.A.; et al. The B73 maize genome: complexity, diversity, and dynamics. Science 2009, 326, 1112–1115. [Google Scholar]
- Kämper, J.; Kahmann, R.; Bölker, M.; Ma, L.-J.; Brefort, T.; Saville, B.J.; Banuett, F.; Kronstad, J.W.; Gold, S.E.; Müller, O.; et al. Insights from the genome of the biotrophic fungal plant pathogen Ustilago maydis. Nature 2006, 444, 97–101. [Google Scholar]
- Tuskan, G. a; Difazio, S.; Jansson, S.; Bohlmann, J.; Grigoriev, I.; Hellsten, U.; Putnam, N.; Ralph, S.; Rombauts, S.; Salamov, A.; et al. The genome of black cottonwood, Populus trichocarpa (Torr. & Gray). Science 2006, 313, 1596–1604. [Google Scholar]
- Duplessis, S.; Cuomo, C.A.; Lin, Y.-C.; Aerts, A.; Tisserant, E.; Veneault-Fourrey, C.; Joly, D.L.; Hacquard, S.; Amselem, J.; Cantarel, B.L.; et al. Obligate biotrophy features unraveled by the genomic analysis of rust fungi. Proc. Natl. Acad. Sci. USA 2011, 108, 9166–9171. [Google Scholar]
- Schmutz, J.; Cannon, S.B.; Schlueter, J.; Ma, J.; Mitros, T.; Nelson, W.; Hyten, D.L.; Song, Q.; Thelen, J.J.; Cheng, J.; et al. a Genome sequence of the palaeopolyploid soybean. Nature 2010, 463, 178–183. [Google Scholar]
- Caspi, R.; Altman, T.; Dale, J.M.; Dreher, K.; Fulcher, C.A.; Gilham, F.; Kaipa, P.; Karthikeyan, A.S.; Kothari, A.; Krummenacker, M.; et al. The MetaCyc database of metabolic pathways and enzymes and the BioCyc collection of pathway/genome databases. Nucleic Acids Res. 2010, 38, D473–D479. [Google Scholar]
- Punta, M.; Coggill, P.C.; Eberhardt, R.Y.; Mistry, J.; Tate, J.; Boursnell, C.; Pang, N.; Forslund, K.; Ceric, G.; Clements, J.; et al. The Pfam protein families database. Nucleic Acids Res. 2011, 1–12. [Google Scholar]
- Consortium, T.U. Reorganizing the protein space at the Universal Protein Resource (UniProt). Nucleic Acids Res. 2011, 1–5. [Google Scholar]
- Katoh, K.; Kuma, K.; Toh, H.; Miyata, T. MAFFT version 5: improvement in accuracy of multiple sequence alignment. Nucleic Acids Res. 2005, 33, 511–518. [Google Scholar] [CrossRef]
- Eddy, S.R. Profile hidden Markov models. Bioinformatics 1998, 14, 755–763. [Google Scholar]
- Christian, N.; May, P.; Kempa, S.; Handorf, T.; Ebenhöh, O. An integrative approach towards completing genome-scale metabolic networks. Mol Biosyst 2009, 5, 1889–1903. [Google Scholar] [CrossRef]
- Kanehisa, M.; Araki, M.; Goto, S.; Hattori, M.; Hirakawa, M.; Itoh, M.; Katayama, T.; Kawashima, S.; Okuda, S.; Tokimatsu, T.; et al. KEGG for linking genomes to life and the environment. Nucleic Acids Res. 2008, 36, D480–D484. [Google Scholar]
- Handorf, T.; Christian, N.; Ebenhöh, O.; Kahn, D. An environmental perspective on metabolism. J. Theor. Biol. 2008, 252, 530–537. [Google Scholar] [CrossRef]
- Preston, G.M.; Bertrand, N.; Rainey, P.B. Type III secretion in plant growth-promoting Pseudomonas fluorescens SBW25. Mol. Microbiol. 2001, 41, 999–1014. [Google Scholar]
- Sachs, J.L.; Mueller, U.G.; Wilcox, T.P.; Bull, J.J. The Evolution of Cooperation. Q Rev Biol 2004, 79, 135–160. [Google Scholar] [CrossRef]
- Caspi, R.; Altman, T.; Dreher, K.; Fulcher, C.A.; Subhraveti, P.; Keseler, I.M.; Kothari, A.; Krummenacker, M.; Latendresse, M.; Mueller, L.A.; et al. The MetaCyc database of metabolic pathways and enzymes and the BioCyc collection of pathway/genome databases. Nucleic Acids Res. 2011, 1–12. [Google Scholar]
- Cox, T.F.; M.A.A. Cox Multidimensional Scaling; CRC Press: Boca Raton, FL, USA, 2001. [Google Scholar]
- Keseler, I.M.; Collado-Vides, J.; Santos-Zavaleta, A.; Peralta-Gil, M.; Gama-Castro, S.; Muñiz-Rascado, L.; Bonavides-Martinez, C.; Paley, S.; Krummenacker, M.; Altman, T.; et al. EcoCyc: a comprehensive database of Escherichia coli biology. Nucleic Acids Res. 2011, 39, D583–D590. [Google Scholar]
- May, P.; Christian, J.-O.; Kempa, S.; Walther, D. ChlamyCyc: an integrative systems biology database and web-portal for Chlamydomonas reinhardtii. BMC Genomics 2009, 10, 209. [Google Scholar] [CrossRef]
- May, P.; Wienkoop, S.; Kempa, S.; Usadel, B.; Christian, N.; Rupprecht, J.; Weiss, J.; Recuenco-Munoz, L.; Ebenhöh, O.; Weckwerth, W.; et al. Metabolomics- and proteomics-assisted genome annotation and analysis of the draft metabolic network of Chlamydomonas reinhardtii. Genetics 2008, 179, 157–166. [Google Scholar] [CrossRef]
- Mueller, L.A.; Zhang, P.; Rhee, S.Y. AraCyc: A Biochemical Pathway Database for Arabidopsis. Plant Physiol. 2003, 132, 453–460. [Google Scholar]
- Sloan, D.B.; Moran, N.A. Endosymbiotic bacteria as a source of carotenoids in whiteflies. Biol. Lett. 2012, 8, 986–989. [Google Scholar]
- Karp, P.D.; Paley, S.M.; Krummenacker, M.; Latendresse, M.; Dale, J.M.; Lee, T.J.; Kaipa, P.; Gilham, F.; Spaulding, A.; Popescu, L.; et al. Pathway Tools version 13.0: integrated software for pathway/genome informatics and systems biology. Brief. Bioinformatics 2010, 11, 40–79. [Google Scholar] [CrossRef]
- Matthäus, F.; Salazar, C.; Ebenhöh, O. Biosynthetic potentials of metabolites and their hierarchical organization. PLoSComput. Biol. 2008, 4, e1000049. [Google Scholar]
- Raman, K.; Chandra, N. Flux balance analysis of biological systems: applications and challenges. Brief. Bioinformatics 2009, 10, 435–449. [Google Scholar] [CrossRef]
© 2013 by the authors; licensee MDPI, Basel, Switzerland. This article is an open access article distributed under the terms and conditions of the Creative Commons Attribution license (http://creativecommons.org/licenses/by/3.0/).
Share and Cite
Duan, G.; Christian, N.; Schwachtje, J.; Walther, D.; Ebenhöh, O. The Metabolic Interplay between Plants and Phytopathogens. Metabolites 2013, 3, 1-23. https://doi.org/10.3390/metabo3010001
Duan G, Christian N, Schwachtje J, Walther D, Ebenhöh O. The Metabolic Interplay between Plants and Phytopathogens. Metabolites. 2013; 3(1):1-23. https://doi.org/10.3390/metabo3010001
Chicago/Turabian StyleDuan, Guangyou, Nils Christian, Jens Schwachtje, Dirk Walther, and Oliver Ebenhöh. 2013. "The Metabolic Interplay between Plants and Phytopathogens" Metabolites 3, no. 1: 1-23. https://doi.org/10.3390/metabo3010001
APA StyleDuan, G., Christian, N., Schwachtje, J., Walther, D., & Ebenhöh, O. (2013). The Metabolic Interplay between Plants and Phytopathogens. Metabolites, 3(1), 1-23. https://doi.org/10.3390/metabo3010001