Review

Content of Vitamin D2 in Alternative Biological and Nutritional Sources and Its Effectiveness as Compared to Vitamin D3—A Narrative Review

1
Department of Food Chemistry and Nutrition, Faculty of Pharmacy, Medical College, Jagiellonian University, 30-688 Kraków, Poland
2
Department of Pharmacognosy, Faculty of Pharmacy, Medical College, Jagiellonian University, 30-688 Kraków, Poland
3
Laboratory of Ecophysiology and Microalgae, Department of Basic Sciences, Faculty of Science, University of Bío-Bío, Chillán 3780247, Chile
4
Institute for Drug Research, School of Pharmacy, Faculty of Medicine, The Hebrew University of Jerusalem, Jerusalem 9112001, Israel
*
Author to whom correspondence should be addressed.
Metabolites 2026, 16(7), 485; https://doi.org/10.3390/metabo16070485
Submission received: 28 May 2026 / Revised: 7 July 2026 / Accepted: 8 July 2026 / Published: 10 July 2026
(This article belongs to the Special Issue Vitamin D Metabolism and Human Health, 2nd Edition)

Abstract

Background/Objectives: Interest in alternative, non-animal sources of vitamin D has increased due to the global prevalence of its deficiency and the growing demand for plant-based dietary options. Mushrooms and algae have emerged as potential sustainable sources of vitamin D2 and, in selected cases, vitamin D3 following ultraviolet (UV) exposure. However, the comparative bioavailability and clinical effectiveness of vitamin D2 relative to vitamin D3 remain controversial. This review aims to evaluate the content of vitamin D2 in mushrooms and algae, the impact of UV irradiation on its synthesis, and the effectiveness of vitamin D2 supplementation compared with vitamin D3 in humans. Methods: PubMed, ScienceDirect, and Google Scholar were searched (1996–2026). Only human intervention studies were included when assessing clinical efficacy. Data on natural sources and pharmaceutical formulations were analyzed. Results: UV irradiation markedly increases vitamin D2 content in mushrooms, as compared to cultivated products. Algal vitamin D content varies, depending on species and UV exposure, with no robust clinical trials confirming improvement of serum 25(OH)D after algal supplementation. Across multiple randomized controlled trials, vitamin D2 consistently increased circulating 25(OH)D2 but frequently reduced 25(OH)D3 and demonstrated lower efficacy in raising total 25(OH)D compared with vitamin D3, as confirmed by a recent meta-analysis. Conclusions: Although UV-enhanced mushrooms represent a quantifiable dietary source of vitamin D2, clinical evidence consistently indicates lower efficacy of vitamin D2 compared with vitamin D3. Algae cannot currently be considered a validated source of vitamin D for improving human vitamin D status. Further mechanistic and long-term clinical studies are required.

1. Introduction

Interest in vitamin D in modern pharmacy and dietetics has grown considerably in recent years. This trend is driven not only by the ongoing search for natural sources of vitamin D but also by the rising global prevalence of vitamin D deficiency, which remains a major public health concern affecting populations across different age groups and geographic regions [1,2]. At the same time, the expanding population of vegans and vegetarians increasingly expects new vitamin D-rich non-animal sources. This group has become particularly sensitive to nutritional deficiencies of compounds that are not normally present in edible plant-based foods. These include vitamin D3 and vitamin B12, as well as nutrients that are present in lower amounts (e.g., iodine), which may have long-term health consequences if not adequately supplemented or monitored [3,4].
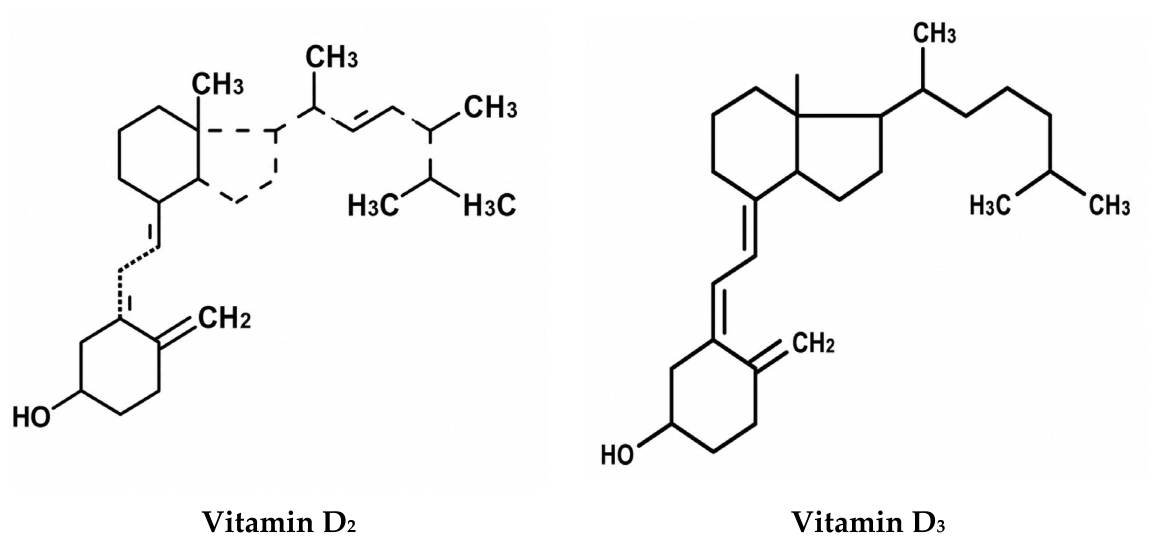
Vitamin D plays a crucial role in maintaining calcium and phosphate homeostasis, thereby supporting bone mineralization and preventing disorders such as rickets, osteomalacia, and osteoporosis. Beyond skeletal health, it modulates immune function, regulates cell proliferation and differentiation, and has been implicated in the prevention of autoimmune diseases, infections, and certain cancers [5]. Among the vitamin D group, vitamin D3 (cholecalciferol) and D2 (ergocalciferol) are the most important from the perspective of human health. Structural differences (Figure 1) between these two vitamins may influence their affinity for vitamin D-binding protein, metabolic stability, and circulating half-life, which in turn can affect their biological activity and clinical effectiveness [6,7].
Traditionally, vitamin D3 has been derived primarily from animal-based foods such as fatty marine fish (e.g., salmon, mackerel, herring, and sardines), cod liver oil and other fish oils, fish and animal liver, egg yolk, butter, and full-fat dairy products. In addition, vitaminD3-fortified products such as milk, plant-based beverages, margarines and other spreadable fats as vegetable oils, and breakfast cereals are also available [8]. In contrast, growing attention has been directed toward expanding the range of foods that can naturally provide vitamin D2 or produce vitamin D3 following ultraviolet (UV) exposure. Mushrooms and algae are particularly promising in this context and are increasingly recognized as potential components of functional and sustainable dietary patterns [9].
Despite decades of research, the relative efficacy of vitamin D2 compared with vitamin D3 remains a subject of scientific debate. Therefore, the aim of this review is to comprehensively evaluate the actual content of vitamin D2 in alternative natural sources, i.e., mushrooms, algae, and microalgae, also in terms of the enhancement of its synthesis following UV irradiation. Additionally, this review focuses on critical analysis of the bioavailability and effectiveness of vitamin D2 supplementation, as compared to vitamin D3, based on the existing evidence from human studies.

2. Materials and Methods

An extensive literature search was performed to identify relevant publications concerning vitamin D2 and vitamin D3 in biological, nutritional, pharmaceutical, and clinical contexts. The review was designed as a narrative review based on a structured search strategy. The search covered scientific literature published in English between 1996 and 2026, and was conducted using PubMed, ScienceDirect, and Google Scholar. These databases were selected to provide broad coverage of biomedical, nutritional, food science, biochemical, analytical, and clinical studies relevant to vitamin D2 sources, metabolism, bioavailability, potency, and stability.
The literature search was structured according to two main objectives of the review. The first objective was to identify biological and nutritional sources of vitamin D2 and vitamin D3, particularly edible mushrooms, macroalgae, and microalgae, and to summarize reported concentrations, UV-mediated formation, and stability in different matrices. The second objective was to compare vitamin D2 and vitamin D3 in terms of metabolism, bioavailability, potency, stability, and effectiveness in human studies when delivered as medicinal products, dietary supplements, or vitamin D-rich food products.
For the first objective, the following search strings were applied: (“vitamin D2” OR ergocalciferol) AND (source OR occurrence OR concentration OR content OR level) AND (mushroom* OR fungi OR yeast OR algae OR seaweed OR microalgae OR lichen OR “fortified food*” OR “fermented food*” OR “plant-based food*”) (“vitamin D2” OR ergocalciferol) AND (ergosterol OR “provitamin D2”) AND (ultraviolet OR UV OR UVB OR irradiation OR “UV irradiation” OR “UV-B exposure”)
For the second objective, the following search strings were applied: (“vitamin D2” OR ergocalciferol) AND (“vitamin D3” OR cholecalciferol) AND (metabolism OR bioavailability OR potency OR efficacy OR stability OR degradation) (“vitamin D2” OR ergocalciferol) AND (“vitamin D3” OR cholecalciferol) AND (“25-hydroxyvitamin D” OR “25(OH)D” OR “vitamin D status” OR supplementation OR trial OR intervention).
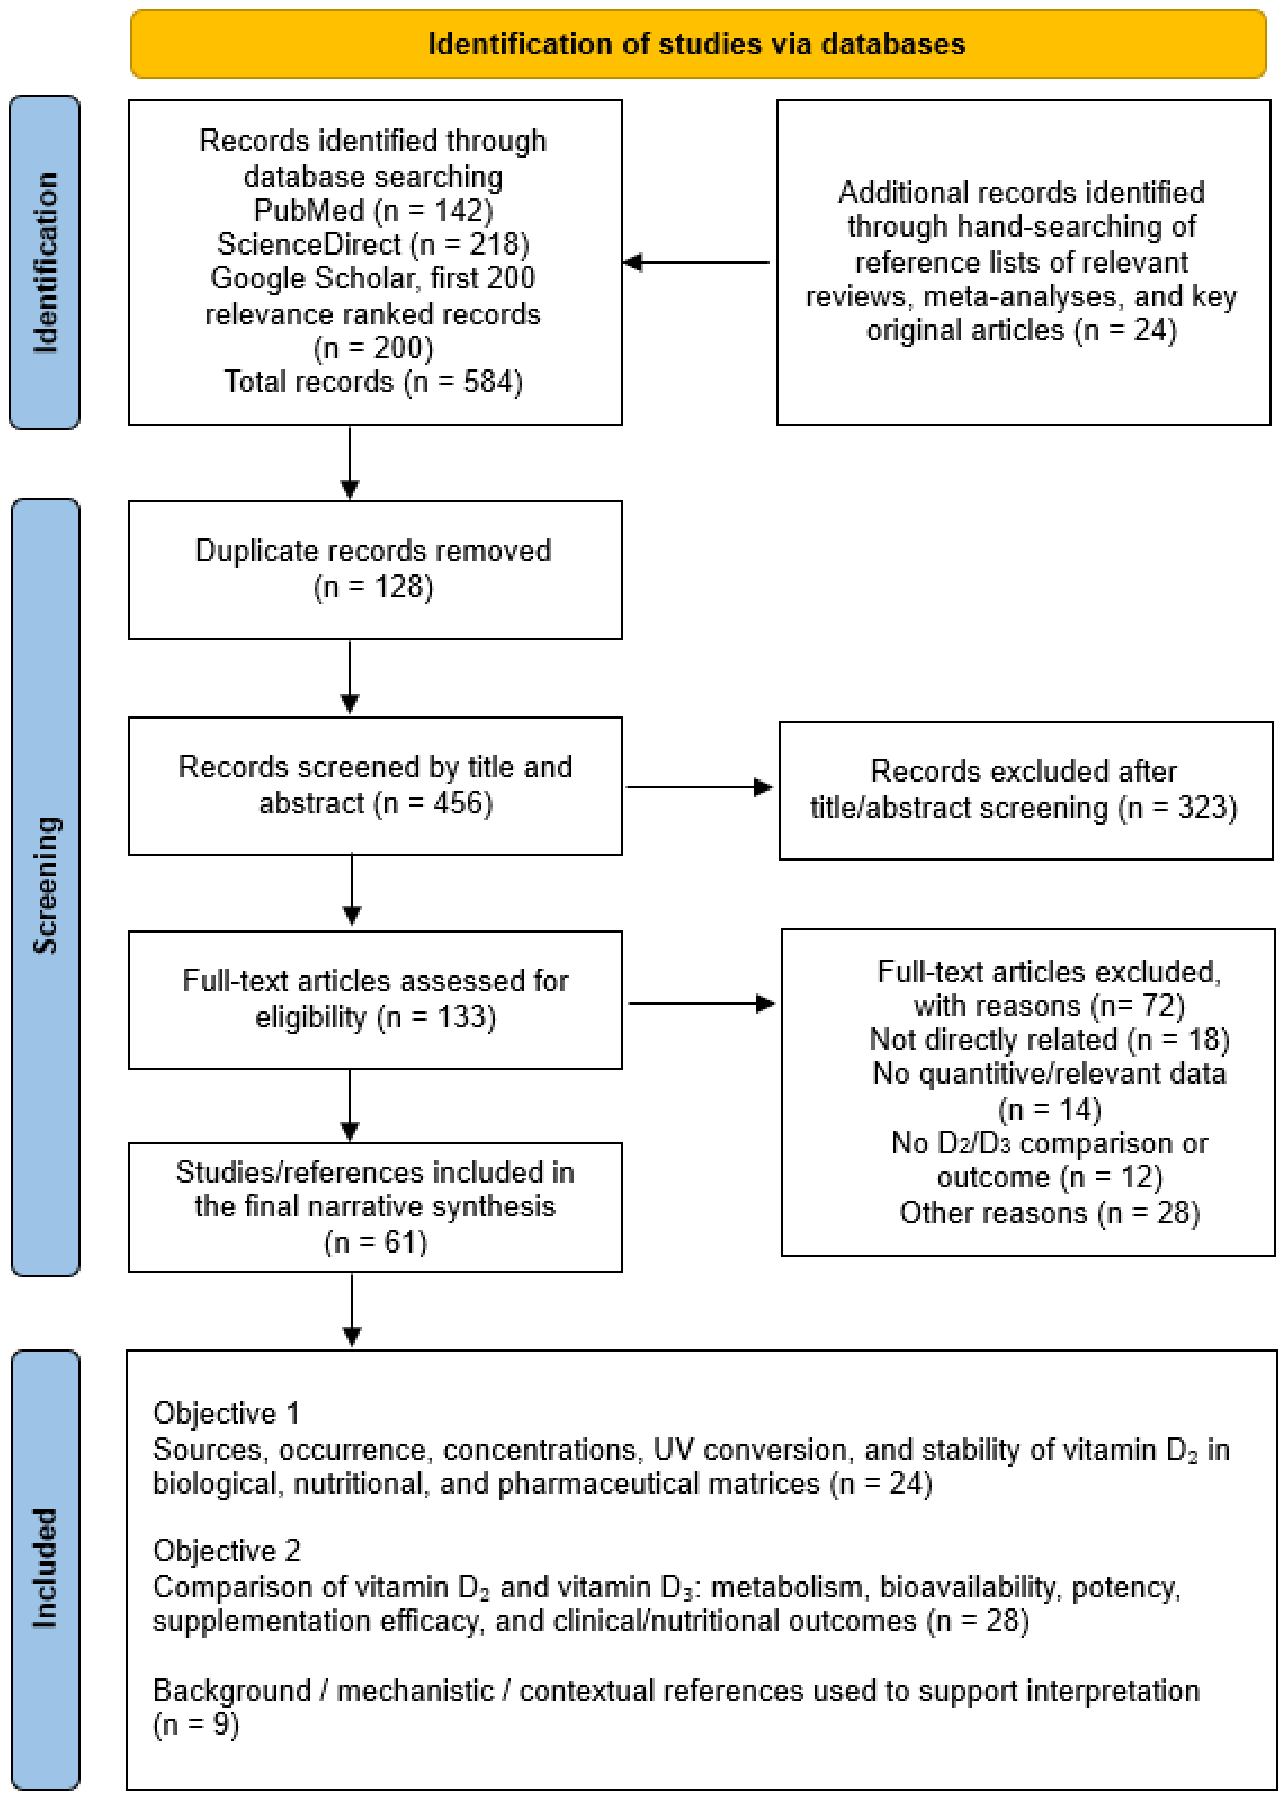
The study selection process was performed in several stages, presented in Figure 2. For the first objective, eligible publications included analytical, nutritional, food composition, technological, and experimental studies reporting vitamin D2 or vitamin D3 content in edible mushrooms, macroalgae, microalgae, or related biological and nutritional matrices. Studies addressing ergosterol conversion, UV exposure, irradiation conditions, processing, storage, or stability of vitamin D2 were also considered eligible.
For the second objective, eligible publications included human intervention studies, randomized or controlled trials, feeding studies, and clinically relevant studies comparing vitamin D2 and vitamin D3 or evaluating the effect of vitamin D2 supplementation on serum 25(OH)D2, 25(OH)D3, and total 25(OH)D concentrations. Studies involving vitamin D2 delivered as medicinal products, dietary supplements, fortified foods, or vitamin D2-rich food products were included when they provided relevant information on bioavailability, potency, or effectiveness. In vitro, in silico, and animal studies were excluded as not relevant. However, mechanistic and biochemical studies were considered where necessary to support interpretation of differences in metabolism, transport, hydroxylation, catabolism, and stability between vitamin D2 and vitamin D3.
Articles were excluded if they were not directly related to vitamin D2, vitamin D3, or ergosterol-derived vitamin D formation; did not provide relevant information on vitamin D content, metabolism, bioavailability, potency, stability, or clinical/nutritional effectiveness; lacked sufficient methodological or analytical detail; or were not available in full text. Reviews, systematic reviews, and meta-analyses were used mainly to identify additional primary studies and to support the interpretation of the evidence, but they were not treated as primary evidence in the tabulated synthesis unless directly relevant to the narrative discussion.
The complete identification and selection process, including the number of records identified, duplicates removed, records screened, full-text articles assessed, excluded articles, and studies included in the final synthesis, is summarized in the PRISMA-style flow diagram presented in Figure 2.

3. Results

3.1. Vitamin D and Edible Mushrooms

Edible mushrooms are increasingly recognized as one of the few non-animal dietary sources of vitamin D, specifically vitamin D2. Unlike plants, fungi contain substantial amounts of ergosterol in their cell membranes, where it plays a structural role, analogous to cholesterol in animals, contributing to membrane integrity, fluidity, and intracellular transport [10,11]. Upon exposure to ultraviolet (UV) radiation, ergosterol undergoes photochemical conversion to pre-vitamin D2, which is subsequently thermally isomerized to ergocalciferol (vitamin D2). No data exists on the ability of edible mushrooms to synthesize vitamin D3.

3.1.1. Content of Vitamin D2

Wild mushrooms exposed naturally to sunlight may contain nutritionally significant amounts of vitamin D2 (Table 1). Finnish funnel chanterelles (Cantharellus tubaeformis) collected in late summer and early autumn were reported to contain between 3 and 30 µg vitamin D2 per 100 g fresh weight (FW), whereas retail button mushrooms (Agaricus bisporus) typically contained less than 1 µg/100 g FW [12]. Subsequent analyses identified high vitamin D2 levels in other wild species, including Boletus edulis (up to 58.7 µg/100 g FW) and Cantharellus cibarius (10.7 µg/100 g FW) [13]. These findings highlight the strong influence of natural UV exposure on vitamin D2 accumulation in wild-harvested mushrooms. Commercially cultivated mushrooms are generally grown in controlled environments without sunlight exposure. As a result, their vitamin D2 content is usually negligible (<1 µg/100 g FW), as documented for button, shiitake, and oyster mushrooms in multiple food composition databases [11,14].

3.1.2. Influence of UV Exposure to Enhance Vitamin D2 Content

Intentional exposure to UV radiation markedly enhances vitamin D2 content. Controlled exposure of fresh mushrooms to midday sunlight for 15–60 min has been shown to increase vitamin D2 concentrations to 10–30 µg/100 g FW, approaching or meeting daily intake recommendations in many countries [10,13]. Jasinghe & Perera’s [15] analysis of ergosterol content in different tissues of Shiitake mushrooms showed a significant difference in its distribution, with the highest content found in button mushrooms (7.80 ± 0.35 mg/g DM) and the lowest in enoki mushrooms (0.68 ± 0.14 mg/g DM). The conversion of ergosterol to vitamin D2 was about four times higher for the gills exposed to UV-A irradiation than the outer caps. The lowest conversion of ergosterol to vitamin D2 (12.5 ± 0.28 μg/g DM) was observed for button mushrooms, while the highest (45.1 ± 3.07 μg/g DM) was observed for oyster mushrooms. Even higher concentrations can be achieved under controlled UV-B lamp irradiation. Post-harvest UV-B treatment has produced vitamin D2 concentrations ranging from 40 to over 200 µg/g DM, depending on the exposure time, irradiance intensity, temperature, moisture content, and mushroom morphology [11]. Pulsed UV systems have been demonstrated to be particularly efficient. Short exposures (few seconds) using high-energy pulsed UV lamps can generate nutritionally relevant vitamin D2 levels comparable to those achieved with longer fluorescent UV exposure [11,16]. Huang et al. [17] evaluated eleven species of fresh mushroom fruiting bodies, including species from six genera, Agaricus, Agrocybe, Auricularia, Hypsizigus, Lentinula and Pholiota, and five species from the Pleurotus genus, irradiated with UV-B light for 2 h. For three species of mushroom fruiting bodies with excellent vitamin D2 yield, their mycelia were obtained by liquid culture and subjected to the same UV-B irradiation. Vitamin D2 content of irradiated fruiting bodies significantly increased from 0–3.9 to 15.1–208.6 μg/g, of which the amount in golden oyster mushroom increased by a maximum of 204.7 μg/g. Vitamin D2 content in irradiated mycelia of golden oyster, oyster and pink oyster mushrooms increased from 0.3–5.9 to 66–82 μg/g, respectively. Freeze-drying combined with UV irradiation may further enhance conversion efficiency due to improved UV penetration into porous tissue structures [10].
Table 1. Reported vitamin D2 content of edible mushrooms across the reviewed studies.
Mushroom Species/TypeCountryTreatment/ConditionVitamin D2
Content
Reference
Funnel chanterelle (Cantharellus tubaeformis)FinlandWild, natural sunlight (late summer/early autumn)3–30 µg/100 g FW[12]
Button mushroom (Agaricus bisporus)FinlandRetail, no UV exposure<1 µg/100 g FW[12]
Cep (Boletus edulis)SwedenWildUp to 58.7 µg/100 g FW[13]
Chanterelle (Cantharellus cibarius)SwedenWild10.7 µg/100 g FW[13]
Button, shiitake (Lentinula edodes), oyster (Pleurotus ostreatus) mushroomsAustraliaCommercially cultivated, no sunlight<1 µg/100 g FW (negligible)[11,14]
Fresh mushrooms (general)Singapore/SwedenMidday sunlight, 15–60 min10–30 µg/100 g FW[10,13]
Button mushroomSingaporeUV-A irradiation (315–400 nm), 3.5 W/m2 at 15 cm, 2 h (dose 25.2 kJ/m2), 27 °C, 65% RH; lowest conversion12.5 ± 0.28 µg/g DM[15]
Oyster mushroomSingaporeUV-A irradiation (315–400 nm), 3.5 W/m2 at 15 cm, 2 h (dose 25.2 kJ/m2), 27 °C, 65% RH; highest conversion45.1 ± 3.07 µg/g DM[15]
Mushrooms (general)AustraliaPost-harvest UV-B lamp treatment, UV-B (280–315 nm); e.g., 1.14 W/m2, 90 min, 28 °C40 to >200 µg/g DM[11]
Fruiting bodies, 11 species (6 genera)TaiwanUV-B (280–360 nm), 0.36 mW/cm2 at 19 cm, 2 h (dose 25.9 kJ/m2), 25 °C, fresh/moist (87–90% moisture)From 0–3.9 to 15.1–208.6 µg/g[17]
Golden oyster mushroom (fruiting body)TaiwanUV-B (280–360 nm), 0.36 mW/cm2 at 19 cm, 2 h (dose 25.9 kJ/m2), 25 °C, fresh/moist (87–90% moisture) (maximum increase)+204.7 µg/g (increase)[17]
Golden oyster, oyster, pink oyster (mycelia)TaiwanUV-B (280–360 nm), 0.36 mW/cm2 at 19 cm, 2 h (dose 25.9 kJ/m2), 25 °C, fresh/moist (87–90% moisture)From 0.3–5.9 to 66–82 µg/g[17]
FW, fresh weight; DM, dry matter; RH, relative humidity.

3.1.3. Influence of Technological and Culinary Processes on Vitamin D2 Content

The stability of vitamin D2 in UV-enhanced mushrooms during storage has been examined under refrigeration and dry storage conditions. Fresh UV-exposed mushrooms stored at 2–4 °C generally retain nutritionally relevant amounts of vitamin D2 for up to one week, although some studies report gradual declines following first-order kinetics. In contrast, other investigations observed minimal degradation over 7–14 days of refrigerated storage [18,19,20]. Variability likely reflects differences in moisture content, packaging, and initial vitamin D2 concentration. In dried mushrooms stored in dark, dry conditions at room temperature, vitamin D2 retention remains relatively high for up to eight months, followed by gradual losses during prolonged storage [11]. Nevertheless, even after extended storage, concentration may remain nutritionally meaningful. Thermal processing can influence vitamin D2 retention, although losses are generally moderate. Frying without oil for short durations (approximately 5 min) preserves 85–88% of vitamin D2 content after adjusting for moisture loss. Boiling and oven-baking results in somewhat greater losses, with retention rates of approximately 60% [21,22]. The method and duration of cooking appear to be critical determinants of vitamin D2 preservation (Table 2).

3.2. Vitamin D and Algae

Macro- and microalgae represent diverse groups of photosynthetic organisms classified primarily according to their size and structural organization—macroalgae are multicellular and visible to the naked eye (e.g., wakame Undaria pinnatifida, kombu Saccharina japonica, nori Pyropia spp., e.g., Pyropia yezoensis), whereas microalgae are microscopic and typically unicellular (e.g., Chlorella, Spirulina, Dunaliella). Both groups started to play an important role in nutrition and medicine.
Evidence regarding the occurrence and synthesis of vitamin D in algae remains limited and heterogeneous. Reported concentrations of vitamin D2 and vitamin D3 in microalgae vary considerably across studies, likely reflecting differences in taxonomy, environmental exposure (particularly UV radiation), analytical methodology, and seasonal variability. The significant determinant appears to be the sterol composition of algal membranes, as vitamin D formation depends on the presence of specific sterol precursors. In biological systems, vitamin D is generated via a non-enzymatic photochemical reaction triggered by UV-B radiation, as described previously (ergosterol into vitamin D2), but in the case of some algae, 7-dehydrocholesterol (7-DHC) may be converted into vitamin D3. This transformation involves photoconversion to previtamin D followed by thermal isomerization. As emphasized by Göring [9], vitamin D in natural systems may represent either a physiologically relevant metabolite or a photochemical by-product of membrane sterol degradation. Algae exhibit extraordinary sterol diversity [23] with clear taxonomic trends: (i) Rhodophyta (red algae): predominantly cholesterol; some species rich in desmosterol; (ii) Phaeophyta (brown algae): fucosterol as the dominant sterol; (iii) Chlorophyta (green algae): highly variable; contain 24-ethyl sterols, cholesterol, and in some species ergosterol. This biochemical heterogeneity complicates generalizations regarding algal vitamin D production.

3.2.1. Synthesis and Content of Vitamin D

Several studies have reported measurable amounts of vitamin D in micro- and macroalgae [24,25,26,27,28,29,30], with the available quantitative data summarized in Table 3. However, the reported concentrations vary considerably, and in some studies vitamin D was not detected or was present below the limit of detection or quantification. These discrepancies may reflect differences in algal species, cultivation and environmental conditions, sample processing, and analytical methodology, and they indicate that the occurrence and nutritional relevance of vitamin D in algae require further systematic investigation. Rao and Raghuramulu [24] reported elevated levels of ergosterol (390 µg/100 g dw), 7-DHC (2400 µg/100 g dw), vitamin D2 (5.3 µg/100 g dw), and vitamin D3 (80 µg/100 g dw) in freshwater microalgae consisted of green (Pediastrum, Scenedesmus, Crucigenia, Coelastrum, Chlorella, and Cosmarium), blue green (Gomphosphaeria and Oscillatoria), and brown (Synedra, Navicula, and Cyclotella) algae. In contrast, Brown et al. [25] found vitamin D2 and D3 concentrations below the detection limit (≤0.45 μg/g) in four Australian microalgae species (Nannochloropsis-like sp., Pavlova pinguis, Stichococcus sp., and Tetraselmis sp.). These discrepancies likely arise from differences in analytical sensitivity (e.g., HPLC vs. earlier methods), seasonal UV exposure, cultivation conditions, and intrinsic species variability.

3.2.2. Influence of UV Irradiation on Vitamin D Content

Experimental evidence shows that UV-B exposure can stimulate vitamin D3 production in selected microalgae, supporting a sunlight-dependent mechanism. Of the four species, Nannochloropsis oceanica was able to produce vitamin D3 (up to 1 ± 0.3 µg/g DM), and the production was significantly enhanced by increasing the dose of the UVB. In contrast, Chlorella minutissima, Arthrospira maxima and Rhodomonas salina were not able to produce vitamin D3. These findings suggest that N. oceanica exposed to artificial UVB could be used as a new natural source of vitamin D3 [26]. Schneider et al. [27] evaluated the induction of vitamin D3 synthesis in different algae after UV radiation and found that its highest levels of synthesis were found in Porphyra umbilicalis, Sargassum vulgare, and Ulva lactuca.
Recent investigations in vitamin D metabolism in microalgae, particularly in the coccolithophore Emiliania huxleyi, a globally abundant marine species, revealed that the species contains ergosterol and 7-DHC, enabling potential synthesis of both vitamin D2 and D3. Eliason et al. [28] demonstrated that UV-B exposure stimulates vitamin D production in E. huxleyi and showed that vitamin D2 was significantly increased in UV-exposed cultures, with levels of approximately ∼4 ng/mg DM, while it was barely detected in cultures that were not exposed to UV. The D2 precursor ergosterol was found in both UV-treated and control cultures. Lower amounts of vitamin D3 (~0.04 ng/mg DM) were detected in both UV-treated and control cultures.
Claims regarding vitamin D3 in green macroalgae, particularly Ulva species, are increasingly common in non-scientific sources. Analytical studies using HPLC have detected vitamin D3 in some Ulva samples; however, concentrations often increase following UV exposure, indicating photochemical formation rather than constitutive biosynthesis [29]. Hughes et al. [30], who used a highly sensitive analytical method (LC-QQQ), noted very low levels of vitamin D2 and D3 and their hydroxy derivatives in Australian wakame, and kombu.
At present, definitive evidence supporting a conserved and regulated vitamin D metabolic pathway in algae remains incomplete. The biological significance of vitamin D in these organisms, as well as their potential application in human nutrition and pharmaceutical development, therefore, remains an open question. As recently emphasized by several authors, analytical methods used to quantify vitamin D2 and vitamin D3 in micro- and macroalgae must be highly sensitive and selective, since these compounds may co-elute or interfere with chlorophylls and other lipophilic pigments [30]. The reliable quantification of vitamin D in algae is further challenged by its low concentrations and the inconsistent detection of vitamin D3, which has prompted the use of chromatographic separation coupled with tandem mass spectrometry to improve sensitivity and selectivity [28]. Further research integrating sterol profiling, controlled UV-exposure experiments, transcriptomic analyses, and metabolomic approaches is necessary to determine whether vitamin D production in algae represents an evolutionary adaptation or merely incidental photochemical transformation. Table 3 summarizes the reported vitamin D2 and vitamin D3 contents of selected micro- and macroalgae across the cited studies.

3.3. Pharmaceutical Products and Dietary Supplements Containing Vitamin D2

Vitamin D2 is available as medicines and dietary supplements. Prescription-only medicines are indicated mainly for the treatment of confirmed vitamin D deficiency. These products are marketed in several pharmaceutical forms, including oral tablets and capsules, oil-based oral solutions, and intermittent high-dose formulations, most commonly providing single doses in the range of 20,000–50,000 IU. Interestingly, vitamin D2 (300,000 IU) is also available in solution for injection, as high-dose parenteral formulation intended for the rapid correction of severe vitamin D deficiency, typically administered via the intramuscular route. This formulation bypasses gastrointestinal absorption and is therefore particularly suitable for patients with malabsorption syndromes, severe deficiency states, or poor adherence to oral therapy. The injectable form provides a depot effect, releasing ergocalciferol slowly over time [31]. It should be emphasized that vitamin D2 is also available in multivitamin and multimineral combinations designed for daily supplementation rather than therapeutic correction of deficiency. The presence of dietary fats and minerals in the capsule matrix supports absorption; however, the dose of vitamin D2 is relatively low and intended to contribute to maintenance of vitamin D status as part of overall nutritional support [32]. Oral liquid multivitamins in which ergocalciferol is included as vitamin D are specifically designed for populations with swallowing difficulties, including pediatric patients and individuals requiring enteral feeding. The product is commonly used in clinical settings such as metabolic disorders, restrictive diets (e.g., ketogenic diets), or conditions associated with limited nutritional intake. As with other oral D2 formulations, the pharmacokinetic profile is characterized by a shorter duration of action compared with vitamin D3, which is acknowledged in clinical guidance and reflected in dosing recommendations [33].
Beyond medicinal products, vitamin D2 is also marketed as a dietary supplement, targeting individuals who avoid animal-derived ingredients. The source of vitamin D2 used in supplements is non-animal and includes UV-irradiated mushrooms, fermented yeast, or laboratory synthesis from ergosterol. Such supplements are commonly available as capsules or tablets frequently labeled as suitable for vegan diets. Typical doses in dietary supplements range from 400 to 2000 IU per day, which aligns with nutritional supplementation.

3.4. Effectiveness and Bioavailability of Vitamin D2 in Comparison to Vitamin D3

To facilitate comparison of the available human evidence, the main characteristics of intervention studies comparing vitamin D2 and vitamin D3, including study design, population, intervention, analytical method, and principal outcomes, are summarized in Table 4.

3.4.1. Daily Treatment of Vitamin D2

  • 200–400 IU
Nimitphong et al. [34] investigated whether genetic variation in vitamin D-binding protein (DBP, rs4588) affects serum 25-hydroxyvitamin D [25(OH)D] response to vitamin D supplementation. Thirty-nine healthy adults received 400 IU/day of either vitamin D3 or D2 for three months. Vitamin D3 supplementation significantly increased 25(OH)D3 (+16.2 ± 4.2 nmol/L), whereas vitamin D2 raised 25(OH)D2 (+22.0 ± 2.1 nmol/L) but reduced 25(OH)D3 (−14.2 ± 2.0 nmol/L). After three months, total 25(OH)D tended to be higher with vitamin D3 than D2 (67.8 ± 3.9 vs. 61.0 ± 3.0 nmol/L). Individuals carrying CA or AA alleles showed a significantly smaller increase in total 25(OH)D and 25(OH)D3 compared with CC homozygotes following vitamin D3 supplementation, while no genotype-related differences were observed with vitamin D2. These findings indicate that DBP rs4588 polymorphism influences responsiveness to vitamin D3, but not vitamin D2 supplementation.
An interesting study was conducted by Gallo et al. [35], who evaluated healthy breast-fed infants (n = 52) receiving 400 IU/day of D2 or D3 for 3 months. The increase in total 25(OH)D did not differ between groups (D2: 17.6 ± 26.7 nmol/L; D3: 22.2 ± 20.2 nmol/L). Nevertheless, 75% of infants in the D2 group vs. 96% in the D3 group achieved ≥50 nmol/L (p < 0.05). The final conclusion highlighted that both forms are acceptable in early infancy, although D3 may improve attainment of sufficiency thresholds.
  • 1000 IU
Randomized, double-blind, placebo-controlled trial assessed whether vitamin D2 is as effective as vitamin D3 in maintaining serum 25-hydroxyvitamin D in healthy adults aged 18–84 years supplemented for 11 weeks at the end of winter. At baseline, 60% of participants were vitamin D-deficient. Serum 25(OH)D increased similarly with 1000 IU/day of vitamin D2 (16.9 ± 10.5 to 26.8 ± 9.6 ng/mL), vitamin D3 (19.6 ± 11.1 to 28.9 ± 11.0 ng/mL), and a combined dose of 500 IU D2 plus 500 IU D3 (20.2 ± 10.4 to 28.4 ± 7.7 ng/mL). Importantly, daily vitamin D2 did not reduce circulating 25(OH)D3 concentrations; however, neither form raised levels above 30 ng/mL in deficient individuals. These findings indicate that vitamin D2 is comparable to vitamin D3 for maintaining vitamin D status at a dose of 1000 IU/day [36].
Biancuzzo et al. [37], in a double-blind placebo-controlled study, evaluated thirty-four adults receiving 1000 IU/day of D2 or D3 for 11 weeks. Both forms raised total 25(OH)D to a similar extent. Vitamin D2 increased 1,25(OH)2D2 by 7.4 pg/mL but caused a 9.9 pg/mL decrease in 1,25(OH)2D3, leaving total active vitamin D unchanged. Both isoform maintained total vitamin D, although D2 shifted the balance between active metabolites.
In another randomized, double-blind trial, 95 hip fracture in patients with vitamin D insufficiency (<50 nmol/L) received 1000 IU/day of either vitamin D2 or D3 for three months. Among the 70 participants who completed the study, vitamin D3 produced a significantly greater increase in serum 25OHD than D2 (31% higher by HPLC and 52% higher by RIA), while changes in parathyroid hormone (PTH) levels did not differ between groups. These findings indicate that vitamin D3 is more effective at improving vitamin D status in this high-risk population, although the clinical relevance remains uncertain due to similar PTH responses [38].
  • 2000 IU
Lehmann et al. [39] in the double-blind randomized trial evaluated supplementation with 50 µg/day (2000 IU) of vitamin D2 or D3 for 8 weeks in 107 adults, with measurements at baseline, 4, and 8 weeks. After 8 weeks, total 25(OH)D increased by +30.2 ± 20.1 nmol/L with D2 vs. +45.5 ± 21.7 nmol/L with D3 (p = 0.001). 25(OH)D3 decreased by −19.8 nmol/L in the D2 group but increased by +46.5 nmol/L in the D3 group (p = 0.001). The major explanation for D3 superiority was a substantial decline in endogenous 25(OH)D3 after D2 supplementation, despite similar hydroxylation of both vitamins. It was concluded that vitamin D3 raises vitamin D status more effectively than D2; the reduction in 25(OH)D3 during D2 therapy questions the usefulness of D2 for supplementation.
  • 4000 IU
A sole study compared the efficacy of equal doses of vitamins D2 and D3 in increasing serum 25-hydroxyvitamin D among healthy adults (n = 72), including 17 participants receiving vitamin D2 and 55 receiving vitamin D3. Subjects were supplemented with 4000 IU daily for 14 days, and total 25(OH)D was measured using an assay detecting both forms. Vitamin D3 produced a significantly greater rise in 25(OH)D than vitamin D2 (23.3 vs. 13.7 nmol/L), corresponding to approximately 1.7-fold higher efficacy, with the strongest responses observed in individuals with lower baseline vitamin D levels. These results question the presumed equivalence of vitamins D2 and D3 and indicate that D3 is more effective for improving vitamin D status [40].

3.4.2. Weekly Treatment of Vitamin D2

Heaney et al. [41], in a single-blind randomized trial, compared the potency of vitamins D2 and D3 in 33 healthy adults receiving 50,000 IU weekly for 12 weeks. Vitamin D3 produced a significantly greater increase in serum 25(OH)D than D2 (area under the curve: 2136 vs. 1366 ng·d/mL; steady-state increments: 45 vs. 24 ng/mL) and resulted in substantially higher accumulation in subcutaneous fat. Overall, D3 was estimated to be about 87% more potent than D2 in raising and maintaining vitamin D status, supporting its preferential use in the treatment of deficiency.

3.4.3. Monthly Treatment of Vitamin D2

In a sole randomized clinical trial, 64 community-dwelling adults aged ≥65 years received vitamin D2 or D3 either daily (1600 IU) or once monthly (50,000 IU) for 12 months to compare dosing strategies. At baseline, 40% of participants had serum 25(OH)D levels below 30 ng/mL; after one year, deficiency persisted in 19% (n = 12; seven in the daily group and five in the monthly group) despite adherence exceeding 91%. Both regimens significantly increased circulating 25(OH)D without altering serum calcium, 24 h urinary calcium, parathyroid hormone, or bone turnover markers, and the highest observed concentration reached 72.5 ng/mL. Vitamin D3 was slightly but significantly more effective than D2, whereas D2 supplementation increased 25(OH)D2 but significantly reduced 25(OH)D3. Overall, the findings indicate that both daily and monthly dosing safely improves vitamin D status, although responses vary considerably between individuals [42].

3.4.4. Single High Dose of Vitamin D Administered Orally or Intramuscularly

Hammami et al. [43], in two blinded randomized studies with approximately 100 volunteers receiving 50,000 IU of vitamin D2 or D3, monitored serum metabolites for 56 days. Compared with placebo, vitamin D2 administration significantly reduced 25(OH)D3 by 13.2 nmol/L at day 28 and 10.8 nmol/L at day 56, whereas vitamin D3 supplementation produced a comparable but shorter-lived decrease in 25(OH)D2 (9.8 nmol/L at day 28; 1.7 nmol/L at day 56). Strong inverse correlations between changes in the two metabolites suggest a common regulatory process governing vitamin D metabolism. These findings indicate that reciprocal reductions in 25(OH)D2 and 25(OH)D3 are likely driven by the overall increases in circulating vitamin D rather than being specific to either form. Relative efficacy is time-dependent and influenced by dosing frequency; in addition, daily dosing may mask the shorter half-life of D2. Romagnoli et al. [44], in a prospective randomized study, evaluated the potency of a single high dose (300,000 IU) of vitamins D2 and D3 administered orally or intramuscularly to 32 vitamin D-deficient elderly women (66–97 years) residing in a nursing home. Serum 25(OH)D increased rapidly by day 3 only after oral administration, with significantly higher levels at day 30 following oral vitamin D3 (47.8 ± 7.3 ng/mL), compared with intramuscular vitamin D3 (15.9 ± 11.3 ng/mL), oral vitamin D2 (17.3 ± 4.7 ng/mL), and intramuscular vitamin D2 (5.0 ± 4.4 ng/mL) administration. The area under the curve over 60 days confirmed greater efficacy of D3 versus D2 for both oral (3193 ± 759 vs. 1820 ± 512 ng·d/mL) and intramuscular routes (1361 ± 492 vs. 728 ± 195 ng·d/mL). Higher 25(OH)D concentrations were associated with significant reductions in parathyroid hormone at multiple time points, with cholecalciferol producing a stronger PTH-lowering effect by day 60. Vitamin D3 was nearly twice as potent as D2 regardless of the route of administration.

3.4.5. Supplementation of Vitamin D-Fortified Products

Fisk et al. [45], in a double-blind randomized trial in 40 healthy adults, tested fortified milk containing 5 (200 IU) or 10 (400 IU) µg/day of D2 or D3 as malted in milk drink for 4 weeks. It should be highlighted that this study was conducted in period of minimal UV-B exposure in the United Kingdom. Both vitamins produced dose-dependent increases in their respective metabolites without significant differences between groups. At low dietary doses, D2 and D3 appear equipotent for increasing 25(OH)D.
Tripkovic et al. [46], in a double-blind, randomized, placebo-controlled trial, examined whether daily fortification with biscuits and juice enriched in vitamin D2 or vitamin D3 (15 µg/day; 600 IU) could improve wintertime vitamin D status in 335 healthy South Asian and non-Asian, European women aged 20–64 years. Serum total 25-hydroxyvitamin D [25(OH)D] concentrations were assessed at baseline, week 6, and week 12. When data from both ethnic groups were combined, fortification with vitamin D2 resulted in moderate but significant increases in total 25(OH)D, with rises of 33 and 34% in the juice and biscuit groups, respectively. In contrast, vitamin D3 fortification produced markedly greater effects, with increases of 75 and 74% in the corresponding juice and biscuit groups. Absolute changes from baseline were significantly higher in both vitamin D3 groups compared with vitamin D2 and placebo groups, while no differences were observed between juice and biscuit formats within the same vitamin D form, indicating equivalent bioavailability of the food vehicles. At the end of the 12-week intervention, all non-Asian European women receiving vitamin D3 achieved serum 25(OH)D concentrations above 50 nmol/L, compared with approximately 90% of those receiving vitamin D2. Among South Asian women—who exhibited lower baseline 25(OH)D concentrations (<30 nmol/L)—72.7% of participants receiving vitamin D3 reached the 50 nmol/L threshold, whereas only 55.6% of those receiving vitamin D2 achieved sufficiency. Notably, South Asian women consuming vitamin D2 did not, on average, reach 50 nmol/L, in contrast to those receiving vitamin D3. Analysis of vitamin D metabolites showed that vitamin D2 fortification led to a pronounced increase in serum 25(OH)D2 but was accompanied by the reduction in circulating 25(OH)D3. In contrast, vitamin D3 fortification resulted in substantial increases in 25(OH)D3 concentrations. These findings support mechanistic explanations involving competitive metabolism between vitamin D2 and D3, differences in affinity for vitamin D-binding protein, hepatic hydroxylation efficiency, and the shorter half-life of 25(OH)D2. The authors concluded that vitamin D3 is significantly more efficacious than vitamin D2 in improving and maintaining wintertime vitamin D status at nutritionally relevant doses, particularly in populations at higher risk of deficiency.
A double-blind, randomized feeding trial evaluated whether daily consumption of UV-treated white button mushrooms (Agaricus bisporus) increases serum vitamin D status in healthy adults, aged 20–59 years (n~40, ≈10 per group). Participants consumed one serving (½ cup; 87.9 g) of cooked mushrooms daily for 6 weeks. Two levels of UV-treated mushrooms were compared with vitamin D2 capsules and untreated mushrooms. The study aimed to determine whether the intake would: (i) increase serum 25-hydroxyergocalciferol [25(OH)D2], and (ii) improve total 25(OH)D, the marker of vitamin D status. The work demonstrates that food-based vitamin D2 can serve as a dietary strategy to improve vitamin D intake. No direct comparison with D3 efficacy was performed; therefore, relative potency cannot be inferred from this study [47].
In a separate, double-blind randomized placebo-controlled trial, including 90 healthy adults aged 40–65 years, the participants received either 15 µg/day of vitamin D2 from a commercially available, UV-enhanced button mushroom (Agaricus bisporus) powder or 15 µg/day of vitamin D3 in capsule form for four weeks. At baseline, over half of the cohort was vitamin D-deficient (<50 nmol/L). The intake of vitamin D2 resulted in a 128% increase in serum 25(OH)D2, rising from 3.9 ± 1.9 nmol/L to final concentrations of 8.9 ± 5.8 nmol/L. Despite this substantial relative increase, neither serum 25(OH)D3 nor total 25(OH)D changed significantly. Conversely, vitamin D3 supplementation elevated serum 25(OH)D3 by 55% from a baseline of 44.0 ± 17.1 nmol/L, leading to significantly higher total 25(OH)D levels compared with placebo (57.3 ± 17.7 vs. 41.7 ± 20.1 nmol/L). An additional observation was a reduction in plasminogen activator inhibitor-1 following vitamin D2 intake, suggesting a possible effect on fibrinolytic pathways; however, this did not translate into improved vitamin D status. The authors concluded that each isoform increased its respective hydroxylated metabolite, but only vitamin D3 produced a clinically meaningful improvement in overall vitamin D concentrations [48].
A recent and comprehensive systematic review with meta-analysis of randomized controlled trials provides important insight into the metabolic differences between vitamin D2 and vitamin D3. The analysis, covering studies published between 1975 and 2023, evaluated the impact of vitamin D2 supplementation on circulating concentrations of 25-hydroxyvitamin D3 [25(OH)D3] [49]. The pooled results demonstrate that individuals receiving vitamin D2 experienced a significant decline in serum 25(OH)D3 compared with non-supplemented controls. This reduction was observed both in end-of-intervention comparisons between groups and in analyses of changes from baseline. These findings suggest that vitamin D2 supplementation does not simply add to total vitamin D status but may also influence the metabolism or clearance of the D3-derived metabolite. Several mechanisms may explain this interaction. Available evidence suggests that the lower efficacy of vitamin D2 is unlikely to result mainly from poorer intestinal absorption, as vitamin D2 and vitamin D3 appear to be absorbed with similar efficiency in human studies and intestinal cell models [50]. Therefore, the key differences seem to occur after the absorption, particularly during transport, hydroxylation, and catabolism [50]. The structural features of vitamin D2, including a double bond between C22 and C23 and a methyl group at C24, reduce the affinity of vitamin D-binding protein (DBP) for vitamin D2 and its metabolites compared with the corresponding D3 forms [6,7]. Because DBP maintains the circulating reservoir of 25(OH)D and prolongs its half-life, weaker binding of 25(OH)D2 may increase the fraction available for metabolism and clearance, thereby contributing to faster removal from the circulation [6,7]. Differences are also observed at the enzymatic level. The hepatic 25-hydroxylase CYP2R1 hydroxylates both vitamins comparably, whereas the mitochondrial CYP27A1 does not 25-hydroxylate vitamin D2, and the catabolic 24-hydroxylase CYP24A1 processes 1,25(OH)2D2 differently from 1,25(OH)2D3 [6]. Together, these post-absorptive differences may help explain why vitamin D2 often produces a smaller and less sustained increase in circulating 25(OH)D than equivalent doses of vitamin D3, particularly with intermittent or bolus dosing regimens [6]. The observed inverse association between D2 and D3 metabolites further supports the concept that these two forms are not metabolically equivalent and raises the questions about their full interchangeability in supplementation strategies [49].
Overall, the available studies suggest that vitamin D2 effectively increases circulating 25(OH)D2, but its effect on total 25(OH)D is often less consistent than that of vitamin D3. In food-based interventions, this response may be further influenced by the food matrix and processing conditions, including cooking losses in mushroom products, which may limit the bioefficacy of vitamin D2.
The evidence favoring vitamin D3 is not uniform, however, and should be interpreted cautiously. Several trials found the two forms comparable, particularly at low daily doses: similar effects on total 25(OH)D were reported at 1000 IU/day in healthy adults [36,37], at 400 IU/day in breastfed infants [35], and at 200–400 IU/day, where the two forms appeared equipotent [45]. An exception was observed at a fortification dose of 600 IU/day, where vitamin D3 raised total 25(OH)D by about 75% compared with 33% for vitamin D2 in a large trial [46]. In contrast, the advantage of vitamin D3 was clearest with higher-dose regimens, including 2000 IU/day [39], 50,000 IU/week [41], and a single dose of 300,000 IU [44]. Overall, this suggests a dose-dependent tendency, although not the absolute one. Interpretation is also limited by small sample sizes, short intervention periods, unequal group sizes, and heterogeneous analytical methods, including LC-MS/MS, HPLC, RP-HPLC, RIA, and CLIA. These factors call for a cautious interpretation of the apparent superiority of vitamin D3.

3.5. Effectiveness of Vitamin D2 Supplementation in Special Groups of Patients

3.5.1. Chronic Kidney Diseases

Wetmore et al. [51], in a randomized clinical study, compared weekly administration of vitamin D2 (1250 μg, 50,000 IU) with an equivalent dose of vitamin D3 in non-dialysis-dependent patients with stage 3–5 CKD over a 12-week treatment period. Vitamin D2 ingestion resulted in a substantial rise in total serum 25(OH)D during active treatment, confirming its ability to correct vitamin D deficiency in CKD patients. However, the magnitude of increase achieved (30.7 ng/mL) was smaller than that observed with vitamin D3 (45.0 ng/mL) at the end of the intervention period of 12 weeks. This difference was largely attributable to a decline in the endogenous 25(OH)D3 fraction during vitamin D2 therapy, which limited the net increase in total 25(OH)D. Following discontinuation of supplementation, serum 25(OH)D concentrations declined in both treatment groups. Importantly, six weeks after cessation of therapy, no statistically significant difference in total 25(OH)D levels was observed between patients previously treated with ergocalciferol and those receiving cholecalciferol. This finding suggests that, despite the lower peak responses during active treatment, vitamin D2 and vitamin D3 may show comparable short-term persistence once supplementation is stopped. No significant differences were detected between both vitamins with respect to changes in serum parathyroid hormone or circulating 1,25-dihydroxyvitamin D, indicating that both forms exert similar effects on downstream markers of mineral metabolism in non-dialysis-dependent CKD patients. These findings demonstrate that vitamin D3 can be more effective in increasing serum 25(OH)D concentrations in CKD during active supplementation.

3.5.2. Insulin Related Diseases

In a 12-week double-blind RCT vitamin D2 (50,000 IU) was administered weekly to 90 healthy adults with low vitamin D level in serum (<20 ng/mL of 25(OH)D), to evaluate its impact on glucose and insulin metabolism. Total 25(OH)D increased significantly from 18 ± 7 to 43 ± 12 ng/mL, but insulin secretion and sensitivity were unchanged. Vitamin D2 corrected the deficiency but did not necessarily improve metabolic markers [52]. A similar study compared the supplementation of weekly administered 20,000 IU vitamin D2 or 15,000 IU vitamin D3 for 3 months to 47 Thai adults with impaired glucose regulation. The treatment significantly increased total 25(OH)D, and the oral glucose tolerance test, insulin resistance (HOMA-IR) and insulin secretion index (HOMA%B) were calculated. After the intervention, the oral glucose tolerance status did not change significantly and did not differ between groups, while HOMA-IR and HOMA%B showed no significant change in the overall vitamin D group. However, a significant reduction in HOMA-IR (−0.24 ± 0.42), together with an increased disposition index (+5.1 ± 10.5), was observed only in the subgroup whose total 25(OH)D rose by ≥10 ng/mL. Vitamin D3 raised 25(OH)D3 by +13.7 ± 4.9 ng/mL, whereas vitamin D2 increased 25(OH)D2 by +25.9 ± 4.2 ng/mL but reduced 25(OH)D3 by −13.1 ± 3.1 ng/mL. All changes were significant. Overall, vitamin D supplementation produced only limited metabolic benefits, mainly a reduction in waist circumference, with an improvement in insulin resistance confined to participants achieving an adequate rise in 25(OH)D, while vitamin D3 may exert stronger anthropometric effects [53].

3.5.3. Burn Injury

A randomized, double-blind study evaluated the effects of daily vitamin D2 or D3 supplementation (100 IU/kg) in 50 pediatric patients with severe burns (mean total body surface area 55.7% ± 2.6%). Serum vitamin D markers and parathyroid hormone (PTH) were monitored from hospitalization to one year post-injury. Although no significant differences in vitamin D levels were observed between groups during hospitalization, deficiency remained common at discharge (>10%) and increased markedly after one year, affecting 75% of the placebo group, 56% of the vitamin D2 group, and 25% of the vitamin D3 group. While changes in PTH and clinical outcomes were not statistically significant, supplementation showed clinically meaningful trends toward reduced insulin requirements, sepsis, and scar formation. These findings suggest prolonged vitamin D impairment after severe burns and support extended vitamin D3 supplementation to improve long-term status [54].

3.6. Effectiveness of Vitamin D2-Rich Mushrooms’ Supplementation in Special Groups of Patients

A 6-month randomized, double-blind, placebo-controlled trial evaluated the effects of vitamin D3 (~600 IU/day), vitamin D2 delivered in a mushroom matrix, standard mushrooms, and placebo, on vitamin D status, cognition, and mood in 436 healthy adults aged ≥60 years. The mushroom species used in the intervention was not reported in the original publication. Total 25(OH)D and 25(OH)D3 concentrations were maintained only in the vitamin D3 group, whereas significant declines were observed in the vitamin D2, mushroom, and placebo arms, with responses influenced by baseline vitamin D levels. Despite observational links between vitamin D deficiency and cognitive decline, no improvements in cognitive performance or mood were detected in any intervention group. These findings indicate that moderate-dose vitamin D3 is effective for maintaining vitamin D status during winter, but supplementation does not confer measurable cognitive or mood benefits in healthy older adults [55].
Another randomized, double-blind, placebo-controlled trial evaluated whether supplementation with vitamin D2 derived from Portobello mushroom (Agaricus bisporus) powder could improve skeletal muscle function and attenuate exercise-induced muscle damage in young athletes with low vitamin D status. The study included 33 male high school athletes with baseline serum 25(OH)D < 30 ng/mL. Participants were randomly assigned to receive capsules containing vitamin D2 (600 IU/day) from UV-exposed Portobello mushrooms, or the placebo containing non-UV-exposed mushroom powder, for 6 weeks. Following supplementation, participants completed a 90 min exercise protocol designed to induce skeletal muscle damage. Biochemical markers and measures of muscle function were assessed at baseline, post-supplementation (pre-exercise), and post-exercise. Vitamin D2 supplementation resulted in a significant increase in serum 25(OH)D2 (approximately 9–10 fold), accompanied by a significant decrease in serum 25(OH)D3 (~28%) and a modest increase in total 25(OH)D. Despite these changes, no significant differences were observed between groups in muscle strength, markers of muscle damage (myoglobin, LDH, AST, creatine kinase), or delayed onset muscle soreness. It was concluded that 6-week supplementation with vitamin D2 from Portobello mushrooms effectively increased circulating 25(OH)D2 but did not improve muscle function or protect against exercise-induced muscle damage in young athletes with low baseline vitamin D status [56].
Mehrotra et al. [57] conducted a 16-week randomized feeding trial to evaluate whether daily consumption of UVB-treated mushrooms enriched with vitamin D2 improves vitamin D status and metabolic risk factors in vitamin D-deficient adults with prediabetes and BMI > 25. The study used fresh market-available mushrooms, but the species was not indicated. Forty-three participants were assigned to consume entrées containing mushrooms providing either 600 IU or 4000 IU of vitamin D2, or untreated mushrooms combined with vitamin D3 supplements at comparable labeled doses. Due to substantial cooking losses, the effective vitamin D2 intake was lower than expected and resulted in only modest or no increases in serum 25(OH)D2 and total 25(OH)D compared with the vitamin D3 groups, whose actual intake exceeded labeled amounts. No intervention modified risk factors associated with type 2 diabetes. The limited response to mushroom-derived vitamin D2 may reflect reduced stability during cooking, as well as lower absorption and/or hydroxylation in this overweight, prediabetic population.
Notably, this study highlights important practical limitations of food-based vitamin D2 delivery. Thermal processing substantially reduced the vitamin D2 content of UVB-treated mushrooms, suggesting that postharvest fortification strategies may not guarantee predictable intake under real-world culinary conditions. Furthermore, the weaker response observed in overweight, prediabetic individuals may indicate altered vitamin D metabolism in metabolically compromised populations, potentially related to sequestration in adipose tissue or impaired hydroxylation. Collectively, these findings raise concerns about the reliability of mushroom-derived vitamin D2 as a strategy for improving vitamin D status in high-risk groups and underscore the need to optimize food fortification approaches.
Nieman et al. [58] investigated the physiological consequences of vitamin D2 supplementation in a cohort of athletes. In this double-blind randomized placebo-controlled study, 30 NASCAR pit crew members were assigned to receive either placebo (n = 15) or 3800 IU/day of vitamin D2 derived from UV-treated Portobello mushroom powder (n = 13) for six weeks. Supplementation produced a 456% increase in serum 25(OH)D2, accompanied by a 21% decline in 25(OH)D3, yet total vitamin D concentrations did not change significantly. Functional outcomes were similarly unaffected, as no improvements were detected in strength or performance tests. Unexpectedly, biomarkers of exercise-induced muscle damage were higher in the vitamin D2 group following an eccentric training protocol, with myoglobin rising by 252% compared with 122% in the placebo group (p = 0.001) and creatine phosphokinase increasing by 169% versus 32% (p < 0.001). These findings suggest a possible interaction between vitamin D isoforms, where elevation of 25(OH)D2 may occur at the expense of circulating 25(OH)D3, although the clinical relevance of this shift remains uncertain. D2 alters metabolite balance and may negatively influence exercise-induced muscle damage markers.

3.7. Effectiveness of Algal Supplementation in Special Groups of Patients

Despite growing interest in algae as a potential plant-based source of vitamin D, there are currently no randomized controlled trials (RCTs) demonstrating that supplementation with natural algal biomass (e.g., Ulva, Chlorella, Spirulina, or other microalgae) increases circulating 25-hydroxyvitamin D [25(OH)D] concentrations in humans. In contrast, human intervention studies involving algae have largely focused on other bioactive components. For example, Vanlint and Ried [59] conducted a pilot RCT evaluating algal oil supplementation for bone health; however, vitamin D3 (1000 IU/day) was administered separately and not derived from algae. Another study examined supplementation with Phaeodactylum tricornutum in elderly individuals but assessed antioxidant and metabolic outcomes rather than vitamin D status [60]. Numerous trials involving Chlorella, Spirulina, and other algal products have similarly evaluated lipid metabolism, inflammatory markers, or immune responses without measuring serum 25(OH)D.
While experimental studies confirm that certain algae can contain vitamin D under UV exposure, no clinical trials have demonstrated that algal supplementation increases serum 25(OH)D concentrations in humans. The lack of standardized preparations, variable vitamin D content, and absence of bioavailability studies represent significant research gaps that must be addressed before algae can be considered a validated dietary source of vitamin D. Only one prospective eight-month study exists, conducted by Schwarz et al. [61], with a group of vegans adhering to a whole-food, unrefined, organic diet without dietary supplementation. Participants consumed a minimum of 12 g/week of nori algae and 15 g/week of sun-dried wild mushrooms. While the primary nutritional focus of this group concerned vitamin B12 intake, serum vitamin D2 and D3 concentrations were also longitudinally assessed. At baseline, serum vitamin D3 concentrations did not differ significantly between groups; values in vegan participants were within the grey area (30–50 nmol/L), whereas vegetarians and meat-eaters generally presented normal levels. Over the course of the study, vitamin D3 concentrations declined significantly in the vegan group. By the end of the study, vitamin D3 levels in this group were below the reference threshold and significantly lower than in supplemented vegans and vegetarians. Thus, regular consumption of nori algae and sun-dried mushrooms did not prevent a deterioration in vitamin D3 status. Importantly, the study does not demonstrate that nori algae itself was the primary contributor to the observed vitamin D2 increase. The findings indicate that inclusion of nori algae within a whole-food vegan diet does not ensure maintenance of adequate vitamin D levels, particularly with respect to vitamin D3, and that dietary sources alone may be insufficient to meet physiological requirements.
The absence of clinical evidence may be explained by several factors. First, reported vitamin D concentrations in algae are highly variable and strongly dependent on UV exposure, species differences, and cultivation conditions, which complicates standardization. Second, most commercially available algal supplements are not standardized for vitamin D content, making dose control difficult. Third, vitamin D formation in algae appears to be largely photochemical rather than enzymatically regulated, raising questions about stability and reproducibility. Finally, the bioavailability of algal-derived vitamin D2 or D3 has not been systematically investigated, and its metabolic conversion to 25(OH)D in humans remains unverified.

4. Limitations

Several limitations of the present narrative review should be acknowledged. First, although the literature search was structured and supported by a PRISMA-style flow diagram, the manuscript was designed as a narrative review rather than a systematic review or meta-analysis. Therefore, no formal risk-of-bias assessment, quality scoring system, or quantitative meta-analysis was performed. This limits the possibility of drawing pooled estimates regarding the comparative effectiveness of vitamin D2 and vitamin D3.
Second, the search was conducted in PubMed, ScienceDirect, and Google Scholar, which were selected to provide broad coverage of biomedical, nutritional, food science, biochemical, analytical, and clinical studies. However, the Cochrane Central Register of Controlled Trials/CENTRAL was not included as a primary search database. Since CENTRAL is particularly relevant for identifying randomized controlled trials, some clinical trials directly comparing vitamin D2 and vitamin D3 may not have been captured. Consequently, conclusions regarding comparative clinical potency should be interpreted cautiously and within the narrative scope of this review.
Third, the evidence included in this review is heterogeneous. Studies on edible mushrooms and algae mainly include analytical, food composition, technological, and experimental investigations, whereas the comparison of vitamin D2 and vitamin D3 is based primarily on human intervention studies. These different evidence streams cannot be directly compared in terms of methodological design, sample size, outcome measures, or strength of inference. In particular, data on vitamin D content in mushrooms, macroalgae, and microalgae are strongly influenced by species, growth conditions, UV exposure, moisture content, analytical method, storage, and culinary processing.
Fourth, the available human studies comparing vitamin D2 and vitamin D3 differ substantially in population characteristics, baseline vitamin D status, age, health condition, dose, dosing frequency, route of administration, duration of intervention, and analytical methods used to measure vitamin D metabolites. Some trials included small sample sizes, short intervention periods, or unequal group sizes, which may limit the generalizability of their findings. Moreover, studies used different analytical techniques, including LC-MS/MS, HPLC, RP-HPLC, RIA, and CLIA, which may contribute to variability in reported serum 25(OH)D2, 25(OH)D3, and total 25(OH)D concentrations.
Fifth, the geographical distribution of the included studies was uneven. Human intervention studies were concentrated mainly in a limited number of countries, particularly the USA, while mushroom, algae, microalgae, and seaweed studies were distributed across several countries but often represented by only one or two studies per country (Supplementary Figure S1). This geographical imbalance may limit the global representativeness of the conclusions, especially because vitamin D status, UV exposure, dietary habits, supplement use, food fortification practices, and availability of plant-based vitamin D sources vary substantially between regions.
Sixth, the literature covered a broad time span from 1996 to 2026. As shown in Supplementary Figure S2, publication activity was relatively limited in the earlier years but increased markedly in more recent years, reflecting growing interest in vitamin D2 sources, UV-mediated formation, algae/microalgae, and comparison between vitamin D2 and vitamin D3. Over this period, analytical methods for vitamin D determination evolved substantially, particularly with the increasing use of LC-MS/MS-based approaches. As a result, older studies may not be fully comparable with more recent investigations using more sensitive and selective analytical techniques. This limitation is particularly relevant for algae and microalgae, where vitamin D concentrations are often low and may be affected by analytical sensitivity, co-elution, and interference from lipophilic pigments.
Finally, evidence concerning algae as a dietary source of vitamin D remains especially limited. Although several analytical studies suggest that selected macroalgae and microalgae may contain vitamin D2 or vitamin D3 after UV exposure, there is currently insufficient human intervention evidence demonstrating that natural algal biomass reliably improves circulating 25(OH)D concentrations. Therefore, conclusions regarding algae as a functional or clinically relevant vitamin D source should be considered preliminary.

5. Conclusions

The growing interest in plant-based and sustainable sources of vitamin D has intensified research into mushrooms and algae as alternative providers of vitamin D2 and, under specific conditions, vitamin D3. Evidence clearly demonstrates that UV exposure effectively enhances vitamin D2 content in edible mushrooms, making them one of the few non-animal dietary sources capable of delivering nutritionally relevant amounts of this vitamin. However, technological factors such as processing, storage, and cooking may substantially reduce the final vitamin D2 intake.
The current data on algae remains inconsistent and largely preliminary. Although certain micro- and macroalgal species can contain vitamin D following UV exposure, there is no robust clinical evidence demonstrating that algal supplementation improves circulating 25(OH)D concentrations in humans. Variability in sterol composition, lack of standardization, and insufficient bioavailability represent major limitations.
Human intervention trials consistently indicate that vitamin D2 increases circulating 25(OH)D2 but often reduces endogenous 25(OH)D3 and is generally less effective than vitamin D3 in raising total vitamin D status. Recent meta-analytic evidence further supports the concept that vitamins D2 and D3 are not metabolically equivalent [49]. Available clinical data suggest that while vitamin D2 may represent a suitable non-animal source for individuals following plant-based diets, vitamin D3 demonstrates greater efficacy in elevating and maintaining circulating vitamin D concentrations. These observations have direct practical implications. In food fortification, vitamin D3 achieves substantially greater improvements in vitamin D status than equivalent doses of vitamin D2, particularly in populations at higher risk of deficiency [46], although the two forms appear more comparable at low dietary doses [45]. For vegan and vegetarian consumers, for whom vitamin D2 derived from UV-treated mushrooms, fermented yeast, or ergosterol synthesis remains the principal non-animal option, its lower potency and shorter duration of action should be reflected in dosing recommendations [33], and its dietary contribution interpreted in light of the considerable losses that occur during processing and cooking [57].
Future research should focus on mechanistic clarification of D2 and D3 interactions, optimization of food fortification strategies and production, and well-designed long-term clinical trials evaluating functional plant-based vitamin D sources.

Supplementary Materials

The following supporting information can be downloaded at https://www.mdpi.com/article/10.3390/metabo16070485/s1, Publication Trends and Geographical Distribution of Included Studies. Figure S1. Geographical distribution of included studies according to study type (PubMed). Figure S2. Number of publications by year (PubMed).

Author Contributions

Conceptualization, P.P., P.A.-Á. and S.G.; methodology, P.P. and F.B.; software, P.P. and F.B.; formal analysis, P.P., A.G., F.B., and P.A.-Á.; investigation, P.P., F.B. and A.G.; resources, P.P., P.A.-Á. and S.G.; data curation, P.P. and F.B.; writing—original draft preparation, P.P. and A.G.; writing—review and editing, P.P., A.G., F.B., P.A.-Á. and S.G.; visualization, P.P. and F.B.; supervision, P.P., P.A.-Á. and S.G.; project administration, P.P., P.A.-Á. and S.G.; funding acquisition, P.P. All authors have read and agreed to the published version of the manuscript.

Funding

This research received no external funding.

Institutional Review Board Statement

Not applicable.

Informed Consent Statement

Not applicable.

Data Availability Statement

No new data were created or analyzed in this study. Data sharing is not applicable to this article.

Acknowledgments

During the preparation of this manuscript, the authors used Scholar GPT 5.2 and Canva Pro for grammatic correction and figure preparation. The authors have reviewed and edited the output and take full responsibility for the content of this publication.

Conflicts of Interest

The authors declare no conflicts of interest.

Abbreviations

The following abbreviations are used in this manuscript:
25(OH)D25-hydroxyvitamin D
25(OH)D225-hydroxyvitamin D2 (25-hydroxyergocalciferol)
25(OH)D325-hydroxyvitamin D3 (25-hydroxycholecalciferol)
1,25(OH)2D1,25-dihydroxyvitamin D (calcitriol; total)
1,25(OH)2D21,25-dihydroxyvitamin D2
1,25(OH)2D31,25-dihydroxyvitamin D3
AUCArea Under the Curve
BMIBody Mass Index
CKDchronic kidney disease
DBPVitamin D-Binding Protein
DMDry Mass
EFSAEuropean Food Safety Authority
EMAEuropean Medicines Agency
FDAU.S. Food and Drug Administration
FWFresh Weight
HOMA-IRHomeostatic Model Assessment of Insulin Resistance
HOMA%BHomeostatic Model Assessment of β-cell Function
IUInternational Unit(s)
LC–QQQLiquid Chromatography–Triple Quadrupole Mass Spectrometry
PTHParathyroid Hormone
RCTRandomized Controlled Trial
RIARadioimmunoassay
UV-A/UV-B/UV-CUltraviolet A/B/C

References

  1. Grant, W.B.; Wimalawansa, S.J.; Pludowski, P.; Cheng, R.Z. Vitamin D: Evidence-Based Health Benefits and Recommendations for Population Guidelines. Nutrients 2025, 17, 277. [Google Scholar] [CrossRef] [Scilit] [PubMed]
  2. Dumbre, D.; Upendra, S.; Zacharias, B.S. Unraveling the Relationship Between Vitamin D and Noncommunicable Diseases: A Systemic Review and Meta-Analysis. Public Health Nurs. 2025, 42, 1302–1314. [Google Scholar] [CrossRef] [Scilit] [PubMed]
  3. Malhotra, A.; Lakade, A. Analytical Review on Nutritional Deficiencies in Vegan Diets: Risks, Prevention, and Optimal Strategies. J. Am. Nutr. Assoc. 2025, 44, 545–555. [Google Scholar] [CrossRef] [Scilit] [PubMed]
  4. Kryczyk-KozioŁ, J.; Madej, E.; Zagrodzki, P.; Podsiadły, R.; Galanty, A.; Paśko, P. Evaluation of the consumption of potential goitrogenic food products in various models of plant-based diets in Poland. Acta Pol. Pharm. 2023, 80, 939–953. [Google Scholar] [CrossRef] [Scilit] [PubMed]
  5. Johnson, C.R.; Thacher, T.D. Vitamin D: Immune Function, Inflammation, Infections and Auto-Immunity. Paediatr. Int. Child. Health 2023, 43, 29–39. [Google Scholar] [CrossRef] [Scilit] [PubMed]
  6. Bikle, D.D. Vitamin D Metabolism, Mechanism of Action, and Clinical Applications. Chem. Biol. 2014, 21, 319–329. [Google Scholar] [CrossRef] [Scilit] [PubMed]
  7. Chun, R.F.; Shieh, A.; Gottlieb, C.; Yacoubian, V.; Wang, J.; Hewison, M.; Adams, J.S. Vitamin D Binding Protein and the Biological Activity of Vitamin D. Front. Endocrinol. 2019, 10, 718. [Google Scholar] [CrossRef] [Scilit] [PubMed]
  8. Bruins, M.J. Contribution of Different Vitamin D Forms and Fortified Foods to Vitamin D Intake in Europe: A Narrative Review. J. Steroid Biochem. Mol. Biol. 2025, 251, 106761. [Google Scholar] [CrossRef] [Scilit] [PubMed]
  9. Göring, H. Vitamin D in Nature: A Product of Synthesis and/or Degradation of Cell Membrane Components. Biochemistry 2018, 83, 1350–1357. [Google Scholar] [CrossRef] [Scilit] [PubMed]
  10. Jasinghe, V.J.; Perera, C.O. Ultraviolet Irradiation: The Generator of Vitamin D2 in Edible Mushrooms. Food Chem. 2006, 95, 638–643. [Google Scholar] [CrossRef] [Scilit]
  11. Cardwell, G.; Bornman, J.F.; James, A.P.; Black, L.J. A Review of Mushrooms as a Potential Source of Dietary Vitamin D. Nutrients 2018, 10, 1498. [Google Scholar] [CrossRef] [Scilit] [PubMed]
  12. Mattila, P.H.; Piironen, V.I.; Uusi-Rauva, E.J.; Koivistoinen, P.E. Vitamin D Contents in Edible Mushrooms. J. Agric. Food Chem. 1994, 42, 2449–2453. [Google Scholar] [CrossRef] [Scilit]
  13. Teichmann, A.; Dutta, P.C.; Staffas, A.; Jägerstad, M. Sterol and Vitamin D2 Concentrations in Cultivated and Wild Grown Mushrooms: Effects of UV Irradiation. LWT 2007, 40, 815–822. [Google Scholar] [CrossRef] [Scilit]
  14. USDA. Available online: https://www.usda.gov/ (accessed on 25 February 2026).
  15. Jasinghe, V.J.; Perera, C.O. Distribution of Ergosterol in Different Tissues of Mushrooms and Its Effect on the Conversion of Ergosterol to Vitamin D2 by UV Irradiation. Food Chem. 2005, 92, 541–546. [Google Scholar] [CrossRef] [Scilit]
  16. Koyyalamudi, S.R.; Jeong, S.C.; Song, C.H.; Cho, K.Y.; Pang, G. Vitamin D2 Formation and Bioavailability from Agaricus bisporus Button Mushrooms Treated with Ultraviolet Irradiation. J. Agric. Food Chem. 2009, 57, 3351–3355. [Google Scholar] [CrossRef] [Scilit] [PubMed]
  17. Huang, S.J.; Lin, C.P.; Tsai, S.Y. Vitamin D2 Content and Antioxidant Properties of Fruit Body and Mycelia of Edible Mushrooms by UV-B Irradiation. J. Food Compost. Anal. 2015, 42, 38–45. [Google Scholar] [CrossRef] [Scilit]
  18. Cardwell, G.; Bornman, J.F.; James, A.P.; Daly, A.; Dunlop, E.; Dabos, G.; Adorno, P.; Black, L.J. The Retention of Vitamin D2 and 25-Hydroxyvitamin D2 in Pulse UV-Irradiated Dried Button Mushrooms (Agaricus bisporus) after 12 Months of Storage. Foods 2023, 12, 1429. [Google Scholar] [CrossRef] [Scilit] [PubMed]
  19. Leung, M.F.; Cheung, P.C.K. Vitamins D and D2 in Cultivated Mushrooms under Ultraviolet Irradiation and Their Bioavailability in Humans: A Mini-Review. Int. J. Med. Mushrooms 2021, 23, 1–15. [Google Scholar] [CrossRef] [Scilit] [PubMed]
  20. Pedrali, D.; Gallotti, F.; Proserpio, C.; Pagliarini, E.; Lavelli, V. Kinetic Study of Vitamin D2 Degradation in Mushroom Powder to Improve Its Applications in Fortified Foods. LWT 2020, 125, 109248. [Google Scholar] [CrossRef] [Scilit]
  21. Ložnjak, P.; Jakobsen, J. Stability of Vitamin D3 and Vitamin D2 in Oil, Fish and Mushrooms after Household Cooking. Food Chem. 2018, 254, 144–149. [Google Scholar] [CrossRef] [Scilit] [PubMed]
  22. Sławińska, A.; Fornal, E.; Radzki, W.; Skrzypczak, K.; Zalewska-Korona, M.; Michalak-Majewska, M.; Parfieniuk, E.; Stachniuk, A. Study on Vitamin D2 Stability in Dried Mushrooms during Drying and Storage. Food Chem. 2016, 199, 203–209. [Google Scholar] [CrossRef] [Scilit] [PubMed]
  23. Volkman, J.K. Sterols in Microalgae. In The Physiology of Microalgae; Springer: Cham, Switzerland, 2016; pp. 485–505. [Google Scholar] [CrossRef] [Scilit]
  24. Rao, D.S.; Raghuramulu, N. Food Chain as Origin of Vitamin D in Fish. Comp. Biochem. Physiol. A Physiol. 1996, 114, 15–19. [Google Scholar] [CrossRef] [Scilit]
  25. Brown, M.R.; Mular, M.; Miller, I.; Farmer, C.; Trenerry, C. The Vitamin Content of Microalgae Used in Aquaculture. J. Appl. Phycol. 1999, 11, 247–255. [Google Scholar] [CrossRef] [Scilit]
  26. Ljubic, A.; Jacobsen, C.; Holdt, S.L.; Jakobsen, J. Microalgae Nannochloropsis Oceanica as a Future New Natural Source of Vitamin D3. Food Chem. 2020, 320, 126627. [Google Scholar] [CrossRef] [Scilit] [PubMed]
  27. Schneider, G.; Figueroa, F.L.; Vega, J.; Chaves, P.; Álvarez-Gómez, F.; Korbee, N.; Bonomi-Barufi, J. Photoprotection Properties of Marine Photosynthetic Organisms Grown in High Ultraviolet Exposure Areas: Cosmeceutical Applications. Algal Res. 2020, 49, 101956. [Google Scholar] [CrossRef] [Scilit]
  28. Eliason, O.; Malitsky, S.; Panizel, I.; Feldmesser, E.; Porat, Z.; Sperfeld, M.; Segev, E. The Photo-Protective Role of Vitamin D in the Microalga Emiliania huxleyi. iScience 2024, 27, 109884. [Google Scholar] [CrossRef] [Scilit] [PubMed]
  29. Ljubic, A.; Thulesen, E.T.; Jacobsen, C.; Jakobsen, J. UVB Exposure Stimulates Production of Vitamin D3 in Selected Microalgae. Algal Res. 2021, 59, 102472. [Google Scholar] [CrossRef] [Scilit]
  30. Hughes, L.J.; Black, L.J.; Sherriff, J.L.; Dunlop, E.; Strobel, N.; Lucas, R.M.; Bornman, J.F. Vitamin D Content of Australian Native Food Plants and Australian-Grown Edible Seaweed. Nutrients 2018, 10, 876. [Google Scholar] [CrossRef] [Scilit] [PubMed]
  31. Ergocalciferol 300,000 IU Solution for Injection—Summary of Product Characteristics (SmPC)-(Emc)|9133. Available online: https://www.medicines.org.uk/emc/product/9133/smpc (accessed on 25 February 2026).
  32. Forceval® Capsules. Available online: https://forceval.co.uk/capsules/ (accessed on 25 February 2026).
  33. Ketovit-Vittra Group. Available online: https://vittra.pl/oferta/ketovit/ (accessed on 25 February 2026).
  34. Nimitphong, H.; Saetung, S.; Chanprasertyotin, S.; Chailurkit, L.O.; Ongphiphadhanakul, B. Changes in Circulating 25-Hydroxyvitamin D According to Vitamin D Binding Protein Genotypes after Vitamin D3 or D2supplementation. Nutr. J. 2013, 12, 39. [Google Scholar] [CrossRef] [Scilit] [PubMed]
  35. Gallo, S.; Phan, A.; Vanstone, C.A.; Rodd, C.; Weiler, H.A. The Change in Plasma 25-Hydroxyvitamin D Did Not Differ between Breast-Fed Infants That Received a Daily Supplement of Ergocalciferol or Cholecalciferol for 3 Months. J. Nutr. 2013, 143, 148–153. [Google Scholar] [CrossRef] [Scilit] [PubMed]
  36. Holick, M.F.; Biancuzzo, R.M.; Chen, T.C.; Klein, E.K.; Young, A.; Bibuld, D.; Reitz, R.; Salameh, W.; Ameri, A.; Tannenbaum, A.D. Vitamin D2 Is as Effective as Vitamin D3 in Maintaining Circulating Concentrations of 25-Hydroxyvitamin D. J. Clin. Endocrinol. Metab. 2008, 93, 677–681. [Google Scholar] [CrossRef] [Scilit] [PubMed]
  37. Biancuzzo, R.M.; Clarke, N.; Reitz, R.E.; Travison, T.G.; Holick, M.F. Serum Concentrations of 1,25-Dihydroxyvitamin D2 and 1,25-Dihydroxyvitamin D3 in Response to Vitamin D2 and Vitamin D3 Supplementation. J. Clin. Endocrinol. Metab. 2013, 98, 973–979. [Google Scholar] [CrossRef] [Scilit] [PubMed]
  38. Glendenning, P.; Chew, G.T.; Seymour, H.M.; Gillett, M.J.; Goldswain, P.R.; Inderjeeth, C.A.; Vasikaran, S.D.; Taranto, M.; Musk, A.A.; Fraser, W.D. Serum 25-Hydroxyvitamin D Levels in Vitamin D-Insufficient Hip Fracture Patients after Supplementation with Ergocalciferol and Cholecalciferol. Bone 2009, 45, 870–875. [Google Scholar] [CrossRef] [Scilit] [PubMed]
  39. Lehmann, U.; Hirche, F.; Stangl, G.I.; Hinz, K.; Westphal, S.; Dierkes, J. Bioavailability of Vitamin D2 and D3 in Healthy Volunteers, a Randomized Placebo-Controlled Trial. J. Clin. Endocrinol. Metab. 2013, 98, 4339–4345. [Google Scholar] [CrossRef] [Scilit] [PubMed]
  40. Trang, H.M.; Cole, D.E.C.; Rubin, L.A.; Pierratos, A.; Siu, S.; Vieth, R. Evidence That Vitamin D3 Increases Serum 25-Hydroxyvitamin D More Efficiently than Does Vitamin D2. Am. J. Clin. Nutr. 1998, 68, 854–858. [Google Scholar] [CrossRef] [Scilit] [PubMed]
  41. Heaney, R.P.; Recker, R.R.; Grote, J.; Horst, R.L.; Armas, L.A.G. Vitamin D3 Is More Potent than Vitamin D2 in Humans. J. Clin. Endocrinol. Metab. 2011, 96, E447–E452. [Google Scholar] [CrossRef] [Scilit] [PubMed]
  42. Binkley, N.; Gemar, D.; Engelke, J.; Gangnon, R.; Ramamurthy, R.; Krueger, D.; Drezner, M.K. Evaluation of Ergocalciferol or Cholecalciferol Dosing, 1600 IU Daily or 50,000 IU Monthly in Older Adults. J. Clin. Endocrinol. Metab. 2011, 96, 981–988. [Google Scholar] [CrossRef] [Scilit] [PubMed]
  43. Hammami, M.M.; Abuhdeeb, K.; Hammami, S.; Yusuf, A. Vitamin-D2 Treatment-Associated Decrease in 25(OH)D3 Level Is a Reciprocal Phenomenon: A Randomized Controlled Trial. BMC Endocr. Disord. 2019, 19, 8. [Google Scholar] [CrossRef] [Scilit] [PubMed]
  44. Romagnoli, E.; Mascia, M.L.; Cipriani, C.; Fassino, V.; Mazzei, F.; D’Erasmo, E.; Carnevale, V.; Scillitani, A.; Minisola, S. Short and Long-Term Variations in Serum Calciotropic Hormones after a Single Very Large Dose of Ergocalciferol (Vitamin D2) or Cholecalciferol (Vitamin D3) in the Elderly. J. Clin. Endocrinol. Metab. 2008, 93, 3015–3020. [Google Scholar] [CrossRef] [Scilit] [PubMed]
  45. Fisk, C.M.; Theobald, H.E.; Sanders, T.A.B. Fortified Malted Milk Drinks Containing Low-Dose Ergocalciferol and Cholecalciferol Do Not Differ in Their Capacity to Raise Serum 25-Hydroxyvitamin D Concentrations in Healthy Men and Women Not Exposed to UV-B. J. Nutr. 2012, 142, 1286–1290. [Google Scholar] [CrossRef] [Scilit] [PubMed]
  46. Tripkovic, L.; Wilson, L.R.; Hart, K.; Johnsen, S.; De Lusignan, S.; Smith, C.P.; Bucca, G.; Penson, S.; Chope, G.; Elliott, R.; et al. Daily Supplementation with 15 Mg Vitamin D2 Compared with Vitamin D3 to Increase Wintertime 25-Hydroxyvitamin D Status in Healthy South Asian and White European Women: A 12-Wk Randomized, Placebo-Controlled Food-Fortification Trial. Am. J. Clin. Nutr. 2017, 106, 481–490. [Google Scholar] [CrossRef] [Scilit] [PubMed]
  47. Stephensen, C.B.; Zerofsky, M.; Burnett, D.J.; Lin, Y.-P.; Hammock, B.D.; Hall, L.M.; McHugh, T. Ergocalciferol from Mushrooms or Supplements Consumed with a Standard Meal Increases 25-Hydroxyergocalciferol but Decreases 25-Hydroxycholecalciferol in the Serum of Healthy Adults. J. Nutr. 2012, 142, 1246–1252. [Google Scholar] [CrossRef] [Scilit] [PubMed]
  48. Stepien, M.; O’Mahony, L.; O’Sullivan, A.; Collier, J.; Fraser, W.D.; Gibney, M.J.; Nugent, A.P.; Brennan, L. Effect of Supplementation with Vitamin D2-Enhanced Mushrooms on Vitamin D Status in Healthy Adults. J. Nutr. Sci. 2013, 2, e29. [Google Scholar] [CrossRef] [Scilit] [PubMed]
  49. Brown, E.I.G.; Darling, A.L.; Robertson, T.M.; Hart, K.H.; Li, J.; Martin, C.; Warren, M.J.; Smith, C.P.; Lanham-New, S.A.; Elliott, R.M. Effect of Vitamin D2 Supplementation on 25-Hydroxyvitamin D3 Status: A Systematic Review and Meta-Analysis of Randomized Controlled Trials. Nutr. Rev. 2025, 83, nuaf166. [Google Scholar] [CrossRef] [Scilit] [PubMed]
  50. Borel, P.; Caillaud, D.; Cano, N.J. Vitamin D bioavailability: State of the art. Crit. Rev. Food Sci. Nutr. 2015, 55, 1193–1205. [Google Scholar] [CrossRef] [Scilit] [PubMed]
  51. Wetmore, J.B.; Kimber, C.; Mahnken, J.D.; Stubbs, J.R. Cholecalciferol v. Ergocalciferol for 25-Hydroxyvitamin D (25(OH)D) Repletion in Chronic Kidney Disease: A Randomised Clinical Trial. Br. J. Nutr. 2016, 116, 2074–2081. [Google Scholar] [CrossRef] [Scilit] [PubMed]
  52. Mitchell, D.M.; Leder, B.Z.; Cagliero, E.; Mendoza, N.; Henao, M.P.; Hayden, D.L.; Finkelstein, J.S.; Burnett-Bowie, S.A.M. Insulin Secretion and Sensitivity in Healthy Adults with Low Vitamin D Are Not Affected by High-Dose Ergocalciferol Administration: A Randomized Controlled Trial. Am. J. Clin. Nutr. 2015, 102, 385–392. [Google Scholar] [CrossRef] [Scilit] [PubMed]
  53. Nimitphong, H.; Samittarucksa, R.; Saetung, S.; Bhirommuang, N.; Chailurkit, L.O.; Ongphiphadhanakul, B. The Effect of Vitamin D Supplementation on Metabolic Phenotypes in Thais with Prediabetes. J. Med. Assoc. Thai. 2015, 98, 1169–1178. [Google Scholar] [PubMed]
  54. Gottschlich, M.M.; Mayes, T.; Khoury, J.; Kagan, R.J. Clinical Trial of Vitamin D2 vs. D3 Supplementation in Critically Ill Pediatric Burn Patients. J. Parenter. Enter. Nutr. 2017, 41, 412–421. [Google Scholar] [CrossRef] [Scilit] [PubMed]
  55. Zajac, I.T.; Barnes, M.; Cavuoto, P.; Wittert, G.; Noakes, M. The Effects of Vitamin D-Enriched Mushrooms and Vitamin D3 on Cognitive Performance and Mood in Healthy Elderly Adults: A Randomised, Double-Blinded, Placebo-Controlled Trial. Nutrients 2020, 12, 3847. [Google Scholar] [CrossRef] [Scilit] [PubMed]
  56. Shanely, R.A.; Nieman, D.C.; Knab, A.M.; Gillitt, N.D.; Meaney, M.P.; Jin, F.; Sha, W.; Cialdella-Kam, L. Influence of Vitamin D Mushroom Powder Supplementation on Exercise-Induced Muscle Damage in Vitamin D Insufficient High School Athletes. J. Sports Sci. 2014, 32, 670–679. [Google Scholar] [CrossRef] [Scilit] [PubMed]
  57. Mehrotra, A.; Calvo, M.S.; Beelman, R.B.; Levy, E.; Siuty, J.; Kalaras, M.D.; Uribarri, J. Bioavailability of Vitamin D2 from Enriched Mushrooms in Prediabetic Adults: A Randomized Controlled Trial. Eur. J. Clin. Nutr. 2014, 68, 1154–1160. [Google Scholar] [CrossRef] [Scilit] [PubMed]
  58. Nieman, D.C.; Gillitt, N.D.; Andrew Shanely, R.; Dew, D.; Meaney, M.P.; Luo, B. Vitamin D2 Supplementation Amplifies Eccentric Exercise-Induced Muscle Damage in NASCAR Pit Crew Athletes. Nutrients 2013, 6, 63–75. [Google Scholar] [CrossRef] [Scilit] [PubMed]
  59. Vanlint, S.J.; Ried, K. Efficacy and Tolerability of Calcium, Vitamin D and a Plant-Based Omega-3 Oil for Osteopenia: A Pilot RCT. Maturitas 2012, 71, 44–48. [Google Scholar] [CrossRef] [Scilit] [PubMed]
  60. Stiefvatter, L.; Frick, K.; Lehnert, K.; Vetter, W.; Montoya-Arroyo, A.; Frank, J.; Schmid-Staiger, U.; Bischoff, S.C. Potentially Beneficial Effects on Healthy Aging by Supplementation of the EPA-Rich Microalgae Phaeodactylum tricornutum or Its Supernatant-A Randomized Controlled Pilot Trial in Elderly Individuals. Mar. Drugs 2022, 20, 716. [Google Scholar] [CrossRef] [Scilit] [PubMed]
  61. Schwarz, J.; Dschietzi, T.; Schwarz, J.; Dura, A.; Nelle, E.; Watanabe, F.; Wintgens, K.F.; Reich, M.; Armbruster, F.P. The Influence of a Whole Food Vegan Diet with Nori Algae and Wild Mushrooms on Selected Blood Parameters. Clin. Lab. 2014, 60, 2039–2050. [Google Scholar] [CrossRef] [Scilit] [PubMed]
Figure 1. Chemical structure of ergocalciferol (Vitamin D2) and cholecalciferol (Vitamin D3).
Metabolites 16 00485 g001
Figure 2. PRISMA-style flow diagram of the literature identification and selection process.
Metabolites 16 00485 g002
Table 2. Losses of vitamin D2 during storage and culinary processing of mushrooms.
ProcessVitamin D2 LossReference
Refrigerated storage (fresh),
2–4 °C
Minimal over 7–14 days; gradual first-order decline thereafter[18,19,20]
Dry storage (dried)14.3 → 9.3 µg/g DM over 8 months; → 6.9 µg/g DM over the next 10 months[11]
Frying without oil (~5 min)12–15%[21,22]
Boiling~40%[21,22]
Oven-baking~40%[21,22]
Table 3. Reported vitamin D2 and vitamin D3 contents of micro- and macroalgae across the cited studies.
Algal GroupSpeciesTreatment/ConditionVitamin D2
Content
Vitamin D3
Content
Analytical MethodReference
/Country
Microalgae(Pediastrum, Scenedesmus, Crucigenia, Coelastrum, Chlorella, Cosmarium), (Gomphosphaeria, Oscillatoria), diatoms (Gomphonema, Synedra, Navicula, Cyclotella), EuglenaWild-harvested (lake); summer (April)5.3 µg/100 g DW80 µg/100 g DWHPLC[24]
India
MicroalgaeNannochloropsis-like sp., Pavlova pinguis, Stichococcus sp., Tetraselmis sp.Cultured; fluorescent light; late-log harvestBelow detection (≤0.45 µg/g)Below detection (≤0.45 µg/g)HPLC[25]
Australia
MicroalgaNannochloropsis oceanicaCultured; UVB (312 nm); dose-dependent, up to 36 kJ/m2/day (lamp 5–15 cm; max at 5 cm); 5 days; 23 ± 1 °CUp to 0.27 ± 0.08 µg/g DWUp to 1 ± 0.3 µg/g DWLC-MS/MS[26]
Denmark
MicroalgaeChlorella minutissima, Arthrospira maxima, Rhodomonas salinaCultured; UVB (312 nm); 3–22 kJ/m2/day (lamp 10 cm); 7 days; 23 ± 1 °CBelow LOQ (R. salina up to 0.20 µg/g DW)Not produced (below LOQ)LC-MS/MS[26]
Denmark
MicroalgaEmiliania huxleyiCultured; full-spectrum UV (UV-A 0.50, UV-B 0.07, UV-C 0.03 W/m2; peaks 355/297/265 nm); lamp 20 cm; 14 h/day (diurnal); 18 °C4.32 ± 1.39 ng/mg DW0.038 ± 0.001 ng/mg DWUPC2-MS/MS[28]
Israel
MicroalgaEmiliania huxleyiCultured; no UV (control); 18 °C0.09 ± 0.01 ng/mg DW0.039 ± 0.001 ng/mg DWUPC2-MS/MS[28]
Israel
MicroalgaNannochloropsis limneticaCultured; UVB; 15 kJ/m2/day; 3 days-2700 ± 198 ng/g DWHPLC[29]
Denmark
MacroalgaeWakame (Undaria pinnatifida), kombu (Lessonia corrugata)Wild-harvested, winterNot detected (<0.05 µg/100 g DW)Not detected (<0.05 µg/100 g DW)LC-QQQ[30]
Australia
DW, dry weight; HPLC, high-performance liquid chromatography; LC-MS/MS, liquid chromatography–tandem mass spectrometry; LC-QQQ, liquid chromatography–triple quadrupole mass spectrometry; LOQ, limit of quantification; UPC2-MS/MS, ultra-performance convergence (supercritical fluid) chromatography–tandem mass spectrometry; UV, ultraviolet.
Table 4. Summary of intervention studies comparing vitamin D2 and vitamin D3 on circulating vitamin D metabolite concentrations.
Reference/Type of Study/CountryPopulationInterventionAnalytical MethodMain Outcomes
Nimitphong et al. [34] RCT, unblinded;
Thailand
n = 39 healthy adults; 15–70 y; 61.5% vitamin D deficient (<50 nmol/L)D2 or D3 400 IU/day; daily; 3 months; tablets (+calcium)LC-MS/MSD3: 25(OH)D3 +16.2 ± 4.2 nmol/L (p < 0.001). D2: 25(OH)D2 +22.0 ± 2.1 nmol/L (p < 0.001) but 25(OH)D3 −14.2 nmol/L (p < 0.001). Total 25(OH)D tended higher with D3 (67.8 vs. 61.0 nmol/L; p = 0.08).
Gallo et al. [35]
RCT; Canada
n = 52 healthy breastfed infants; 1 month; 23% vitamin D deficient (≤24.9 nmol/L)D2 or D3 400 IU/day; daily; 3 months; dropsLC-MS/MS; CLIANo difference in total 25(OH)D (D2 +17.6 vs. D3 +22.2 nmol/L; p = 0.21). Sufficiency ≥50 nmol/L: D3 96% vs. D2 75% (p = 0.05).
Holick et al. [36] RCT, double blind, placebo controlled; USAn = 68 healthy adults; 18–84 y; 60% vitamin D deficient (<20 ng/mL)D2 1000, D3 1000, or D2 + D3 500 + 500 IU/day, or placebo; daily; 11 weeks; capsulesLC-MS/MSTotal 25(OH)D: D2 16.9→26.8 ng/mL (p = 0.023); D3 19.6→28.9 ng/mL (p = 0.027); D2 + D3 20.2→28.4 ng/mL (p = 0.041). No difference between active groups (p = 0.957).
Biancuzzo et al. [37] RCT, double blind, placebo controlled; USAn = 34 healthy adults; 18–79 y; 82% vitamin D insufficient (<30 ng/mL)D2 or D3 1000 IU/day, or placebo; daily; 11 weeks; capsules or orange juice LC-MS/MSBoth forms raised total 25(OH)D similarly. D2: 1,25(OH)D2 + 7.4 pg/mL and 1,25(OH) D3 −9.9 pg/mL (total active unchanged).
Glendenning et al. [38] RCT, double blind; Australian = 95 hip-fracture patients; elderly (mean ~83 y); vitamin D insufficient (<50 nmol/L)D2 or D3 1000 IU/day; daily; 3 months; tablets/capsules (+calcium carbonate 600 mg/day)HPLC; RIAD3 raised 25(OH)D more than D2: +31% by HPLC (p = 0.010); +52% by RIA (p < 0.001).
Lehmann et al. [39] RCT, double blind, placebo controlled; Germanyn = 107 healthy adults; 19–67 yD2 or D3 2000 IU/day, or placebo; daily; 8 weeks; tabletsLC-MS/MSTotal 25(OH)D at 8 wk: D3 +45.5 vs. D2 +30.2 nmol/L (p = 0.001). 25(OH)D3: D3 +46.5 vs. D2 −19.8 nmol/L (p = 0.001).
Trang et al. [40]
RCT, double blind; Canada
n = 72 adults (D2 17; D3 55); 38 ± 9 yD2 or D3 4000 IU/day; daily; 14 days; oral solutionRIAIncrease in 25(OH)D: D3 +23.3 vs. D2 +13.7 nmol/L (p = 0.03).
Heaney et al. [41]
RCT, single-blind; USA
n = 33 healthy adults; 49.5 ± 9.8 y; baseline status D2 30.6 ± 14.8; D3 26.0 ± 9.2 ng/mLD2 or D3 50,000 IU/week; weekly; 12 weeks; gel capsulesCLIA; HPLC25(OH)D incremental AUC (12 wk): D3 2136 ± 606 vs. D2 1366 ± 516 ng·d/mL (p < 0.005). Steady-state increment: D3 +45 ± 16.2 vs. D2 +24 ± 10.3 ng/mL (p < 0.001).
Binkley et al. [42]
RCT, double blind; USA
n = 64 older adults; 65–88 y; 40% with 25(OH)D < 30 ng/mLD2 or D3 1600 IU/day or 50,000 IU/month; daily or monthly; 12 months; capsulesRP-HPLCD3 > D2 at 12 mo: daily +9.2 vs. +6.1 ng/mL (p = 0.05); monthly +8.9 vs. +3.6 ng/mL (p = 0.11).
Hammami et al. [43] RCT, double blind, placebo controlled; Saudi Arabian = 100 healthy adults; ≥18 y; D2 or D3 50,000 IU single oral dose, or placebo; followed 56 days; soft gel capsulesRP-HPLCD2 → 25(OH)D3 vs. placebo: −13.2 nmol/L day 28 (p < 0.001); −10.8 nmol/L day 56 (p < 0.001).
D3 → 25(OH)D2 vs. placebo: −9.8 nmol/L day 28 (p < 0.001); −1.7 nmol/L day 56 (p = 0.71).
Romagnoli et al. [44] RCT; Italyn = 32 elderly women; 66–97 y; all vitamin D deficient D2 or D3 300,000 IU single dose, by oral (os) or intramuscular (im) route; RIA30-day rise in 25(OH)D: D3 os +47.8 ± 7.3 vs. D3 im +15.9 ± 11.3, D2 os +17.3 ± 4.7, D2 im +5.0 ± 4.4 ng/mL (all p < 0.001). AUC60: D3 os 3193 ± 759 vs. D2 os 1820 ± 512 ng d/mL (p < 0.001); D3 im 1361 ± 492 vs. D2 im 728 ± 195 (p < 0.01).
LC-MS/MS, liquid chromatography–tandem mass spectrometry; HPLC, high-performance liquid chromatography; RP-HPLC, reversed-phase high-performance liquid chromatography; RIA, radioimmunoassay; CLIA, chemiluminescence immunoassay; 25(OH)D, 25-hydroxyvitamin D; 1,25(OH)D2, 1,25-dihydroxyvitamin D; IU, international units.
Disclaimer/Publisher’s Note: The statements, opinions and data contained in all publications are solely those of the individual author(s) and contributor(s) and not of MDPI and/or the editor(s). MDPI and/or the editor(s) disclaim responsibility for any injury to people or property resulting from any ideas, methods, instructions or products referred to in the content.