Article

Genotype × Environment Shapes Fig Seed Oil Metabolic Fingerprinting

1
Agro-Food Technology and Quality Laboratory, Regional Center of Agricultural Research of Meknes, National Institute of Agricultural Research, Rabat 10090, Morocco
2
Human Nutrition, Bioactives and Oncogenetics (NHBO), Faculty of Science, University Moulay Ismail, Zitoune, Meknes 50100, Morocco
3
National Research Institute for Agriculture, Fisheries and Environment (INRAPE), Ex CEFADER, M’dé, Ngazidja, Moroni P.O. Box 1406, Comoros
*
Author to whom correspondence should be addressed.
Metabolites 2026, 16(2), 127; https://doi.org/10.3390/metabo16020127
Submission received: 16 January 2026 / Revised: 30 January 2026 / Accepted: 4 February 2026 / Published: 12 February 2026
(This article belongs to the Special Issue The Influencing Factors of Nutrients and Metabolites in Plants)

Abstract

Background/Objectives: Fig (Ficus carica L.) seed oil represents an underexplored by-product with considerable nutraceutical potential. However, systematic evaluation of genotype × environment (G × E) interactions affecting its biochemical composition remains limited. This study assessed compositional variability across fig varieties, identified metabolic trade-offs, and developed rapid authentication protocols using FTIR-ATR spectroscopy to support predictive G × E models and marker-assisted selection. Methods: Thirty-seven fig varieties were evaluated across two consecutive harvest years (2023–2024) in Morocco. Conventional biochemical analyses measured total phenolic content (TPC), total flavonoid content (TFC), DPPH and ABTS antioxidant activities, and oil yield. FTIR-ATR spectroscopy characterized spectral variations, with ANOVA assessing effects of year, variety, and G × E interactions. Principal Component Analysis (PCA) discriminated genotypes and years. Results: TPC varied substantially (16.5–115.1 mg GAE/100 g oil), declining 36% from 2023 (48.7 ± 16.6 mg GAE/100 g) to 2024 (31.2 ± 16.6 mg GAE/100 g; F = 1372.84, p < 0.001), with TFC showing parallel trends (15.6 vs. 11.8 mg QCE/100 g). DPPH activity increased 34% in 2024 (58.5% vs. 43.7%), while ABTS activity decreased 18.6% from 32.34 ± 14.28% to 26.31 ± 6.10% (p < 0.001). Oil yield decreased from 26.7% to 21.2% and negatively correlated with phenolic accumulation (r = −0.49, p < 0.001). FTIR-ATR identified diagnostic peaks (e.g., 3012, 2928 cm−1), with significant G × E effects (p < 0.001). PCA captured 75.4–84.5% variance, discriminating genotypes and years. Stable high-value cultivars included ‘Dottato Perguerolles’, ‘VCR 276/49’, and ‘Ferqouch Jmel’. Conclusions: Genotypic differences and year-to-year environmental conditions significantly influence fig seed oil composition. The observed negative correlation between oil yield and phenolic content indicates a trade-off between lipid biosynthesis and secondary metabolism. FTIR-ATR spectroscopy coupled with multivariate analysis enables reliable variety discrimination and year differentiation, supporting the development of stable cultivars for nutraceutical applications.

1. Introduction

Ficus carica L., one of the oldest domesticated fruit trees since the Neolithic revolution [1], is a key species in the Mediterranean region, widely recognized for the nutritional richness of its fruits, notably, sugars, fibers, and natural antioxidants [2]. Beyond fresh consumption and traditional processing, fig seeds currently discarded as waste during industrial transformation represent a strategic investment opportunity within the circular economy framework [3,4]. Moreover, various parts of this plant, including leaves, latex, bark, and roots, have traditionally been used for their medicinal properties [5]. Studies have confirmed that figs have functional properties such as anti-diabetes and anti-oxidation [6,7,8,9,10,11,12]. The active ingredients mainly depend on phenols and flavonoids in the fruit, but these studies focus more on the pulp of the fruit, and less on the seeds and their oils. Although FTIR-ATR spectroscopy has been used for variety identification and quality control [13,14,15,16,17], there is no research to verify whether it can accurately capture the changes in the composition of fig seed oil caused by G × E interaction, which makes it difficult to meet the needs of cross-annual quality prediction.
These seeds, characterized by a round shape and yellowish color, vary considerably in number and weight depending on genotype, which suggests potential variability in oil quality [18]. However, no systematic study has been conducted to quantify the synergistic effects of G × E interactions on key quality indicators such as phenols, flavonoid content, antioxidant activity, and oil yield in fig seed oil. In addition, most of the existing studies are single-year single-point experiments, lacking the exploration of the G × E interaction mechanism under inter-annual environmental variation, and cannot provide a basis for variety screening under different climatic conditions.
Furthermore, oil yields from fig seeds fluctuate substantially, reaching up to 40% depending on variety and environmental conditions, reflecting genetic-, geographical-, and pollination-related differences [13,18,19]. These yields are comparable or even superior to those of other fruit seed oils and markedly exceed those from prickly pear seeds [20,21]. For rural cooperatives equipped with basic extraction facilities, this yield potential translates into tangible economic benefits, as seed oil can command premium prices in cosmetic, nutraceutical, and specialty food markets [22,23]. Consequently, this variability highlights an untapped economic potential, especially within the framework of the circular economy and sustainable valorization of local production chains [3,4,19]. Despite this promise, the molecular basis underlying yield variability and its relationship to bioactive compound accumulation remains poorly understood, preventing stakeholders from making informed decisions about cultivar deployment and processing investments.
Biochemically, fig seed oil is distinguished by a high content of essential polyunsaturated fatty acids, primarily α-linolenic acid (C18:3 ω-3) and linoleic acid (C18:2 ω-6), accompanied by notable oleic acid (C18:1 ω-9) levels [19]. These fatty acids contribute significantly to immune function modulation and cardiovascular disease prevention, benefits that are further reinforced by a particularly low omega-6/omega-3 ratio (0.75–0.79) [23,24]. In addition, minor bioactive compounds such as β-sitosterol and γ-tocopherol enhance the antioxidant and nutraceutical properties of the oil [25,26,27].
Although seed oils are predominantly composed of lipophilic compounds (fatty acids, tocopherols, phytosterols), phenolic compounds, despite their hydrophilic nature, can be co-extracted and retained within oil matrices through liquid–liquid extraction using polar solvents such as methanol or methanol–water mixtures [28]. These minor polar compounds, typically present at concentrations ranging from 50 to 940 mg/kg in vegetable oils, contribute significantly to oxidative stability by scavenging free radicals and chelating pro-oxidant metal ions [29]. Beyond lipid protection, they demonstrate biological activities including protective effects against LDL oxidation and cardiovascular diseases [30]. Phenolic compounds extracted following an adapted method [31] were quantified by the Folin–Ciocalteu colorimetric assay [32], revealing a total phenolic content of 79.5 mg gallic acid equivalent per 100 g oil [25].
However, oil chemical composition appears markedly influenced by both varietal and environmental factors, with recent studies reporting significant biochemical variability among Moroccan cultivars and other genotypes [13,18]. Critical unresolved questions remain: whether these nutritional attributes remain stable across harvest years or exhibit genotype-dependent plasticity under variable climatic regimes, whether phenolic accumulation and lipid biosynthesis operate independently or exhibit metabolic trade-offs that could constrain simultaneous optimization of both traits, and whether Fourier-transform infrared spectroscopy (FTIR-ATR) signatures can capture genotype × environment-driven compositional shifts with sufficient resolution to enable rapid authentication and quality prediction across multiple seasons [13,14,15,16,17].
We hypothesize the following: (1) Genotypic differences and cross-annual environmental variations jointly drive the changes in the biochemical characteristics of fig seed oil, and there is a metabolic trade-off between secondary metabolites such as phenols and flavonoids and oil synthesis. (2) The composition change caused by G × E interaction can be captured by the characteristic peaks of FTIR-ATR spectra. (3) The combination of biochemical analysis and spectral technology can realize variety identification and cross-year quality prediction, and improve the clarity.
In this context, the present study aims to investigate, over two consecutive years (2023 and 2024), the biochemical and spectral variability (FTIR-ATR) of oils obtained from seeds of 37 Ficus carica L. cultivars. The integrated analysis of total polyphenols, flavonoids, DPPH, ABTS antioxidant assays, and FTIR spectra is expected to offer a rapid and reliable approach for characterization, varietal discrimination, and provide technical support for directional screening of fig seed oil varieties, cross-year quality prediction, and stable application in food and cosmetics.

2. Materials and Methods

2.1. Plant Material and Experimental Design

A diverse collection of thirty-seven fig tree genotypes (Ficus carica L.) was selected from an ex situ genetic resource maintained at the experimental station of the National Institute of Agricultural Research (INRA) in Meknes, Morocco. This collection includes twenty-three local clones and fourteen exotic cultivars (Table 1).
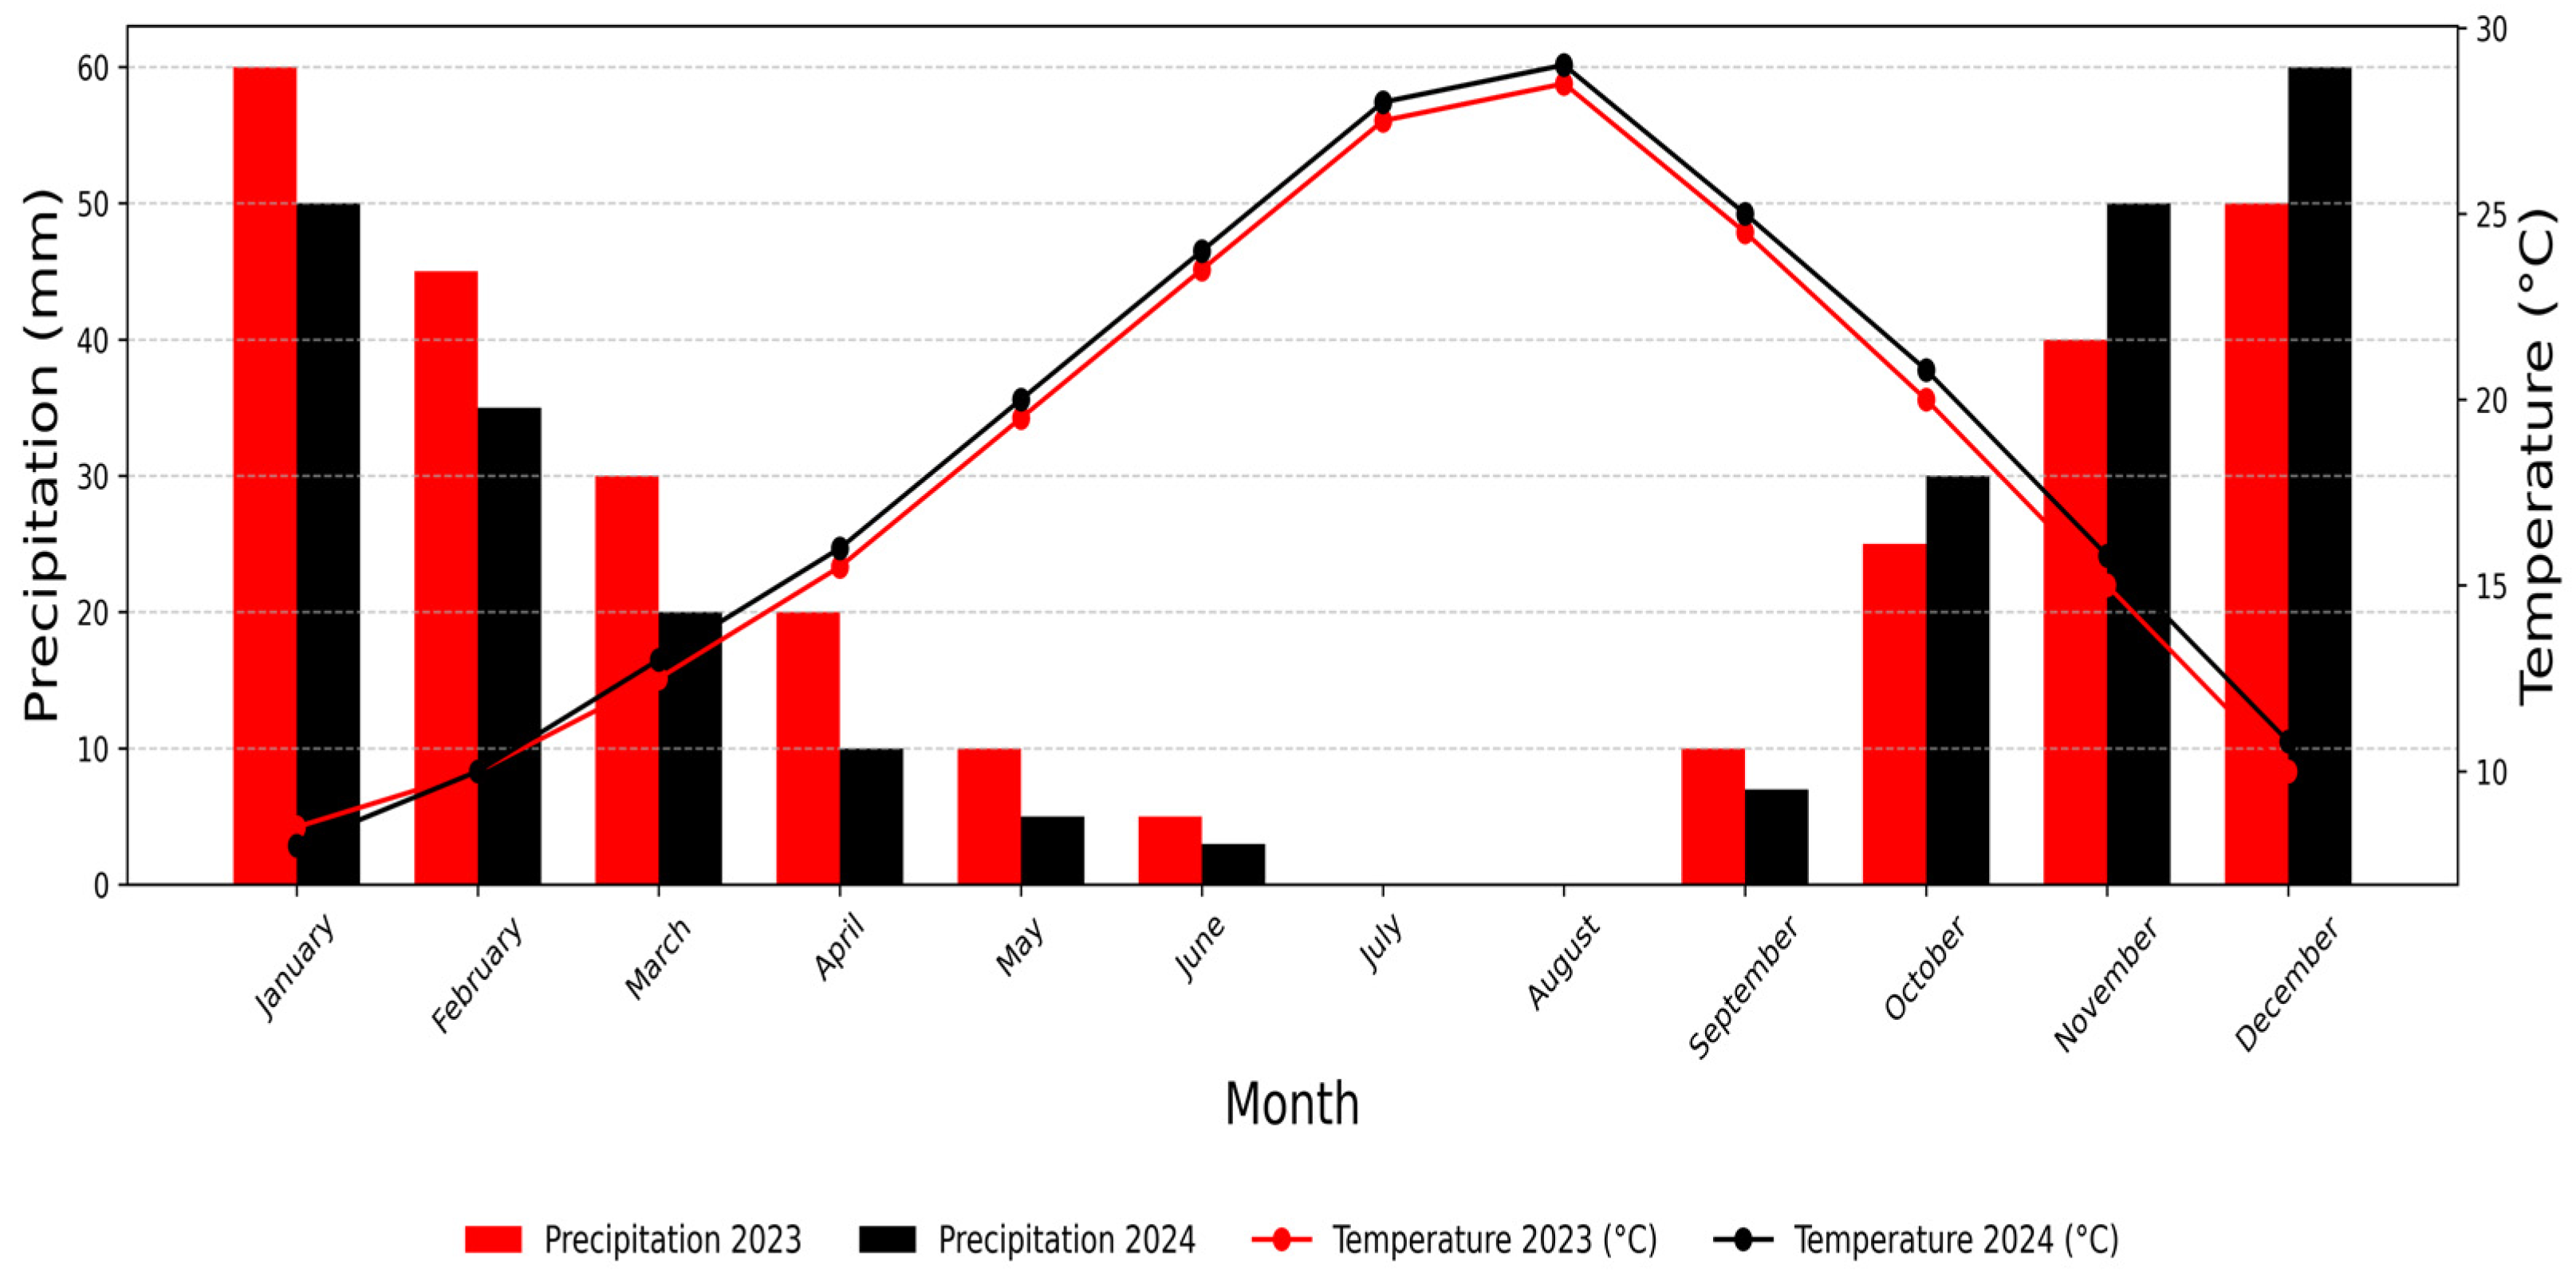
The trees, aged eighteen years and pruned into a cup shape, were arranged in a randomized complete block design with three individual trees per genotype spaced 5 m by 3 m apart. The orchard is maintained under rainfed conditions with supplementary drip irrigation during critical dry periods, following standard cultural practices including annual winter pruning and integrated pest management. Phenotypic evaluations were carried out at full maturity during critical periods from July to September in 2023 and 2024. Climatic data for both growing seasons were recorded using an on-site weather station. The 2023 season was characterized by moderate thermal conditions, with a mean temperature of 17.9 °C and a cumulative rainfall of 295 mm during the reproductive period (Figure 1). In contrast, the 2024 season exhibited slightly higher thermal stress (mean 18.3 °C) and lower precipitation (270 mm), consistent with regional climate variability patterns.

2.2. Fruit Sampling

Figs were collected at full ripeness during the summer season. Genotypes were selected based on fruit size and seed count. Full maturity was identified when approximately three-quarters of the fruit surface exhibited a reddish-purple hue, and the fruit could be easily detached from the branch with gentle hand pressure, following established maturity indices for Ficus carica L. [19]. To obtain a representative sample, approximately 15–20 fruits were randomly picked from different sections of the canopy at a uniform height of 160 cm from the three replicate trees per genotype. Fruits were immediately transported to the laboratory in ventilated containers and processed within 24 h of harvest to minimize post-harvest biochemical changes.

2.3. Seed and Oil Extraction

Seeds were manually separated from the fig pulp using a 10% ethanol solution to prevent microbial growth and enzymatic degradation. The mixture was agitated for about 10 min using a magnetic stirrer at 200 rpm and then allowed to rest, enabling seeds to rise to the surface. The floated yellow, spherical seeds were collected, rinsed thoroughly with distilled water until the rinse water ran clear (typically 3–4 rinses), and air-dried at ambient temperature (22–25 °C) for 24 h on absorbent paper with periodic turning to ensure uniform drying. The dried seeds were subsequently ground to a fine powder using an IKA A11 basic grinder (IKA-Werke GmbH & Co. KG, Staufen, Germany) operating at 20,000 rpm for 30 s, achieving a particle size <0.5 mm. Oil was extracted using a Soxhlet extraction technique. A total of 20 g of finely ground seed samples were placed in cellulose thimbles and extracted with 150 mL of n-hexane for 4 h. After extraction, the solvent was removed under reduced pressure using a Büchi Rotavapor R-200 at 40 °C. The oil yield was then determined in accordance with the procedure described by Kassimi et al. (2025) [13].
Oil yield (%) = [(M1 − M0)/M2] × 100
where
  • M0 represents the weight of the empty flask in grams (g);
  • M1 corresponds to the weight of the flask following solvent evaporation (g);
  • M2 denotes the weight of the seed powder (g).
All extractions were performed in triplicate, and oil yield is reported as mean ± standard deviation. The average weight of the residual oil cake was also determined. Extracted oils were stored in dark glass containers fitted with Teflon-lined caps, flushed with nitrogen gas to prevent oxidation, at 4 °C, and analyzed within two weeks of extraction until further analysis. Distilled water was further purified using a Milli-Q system (Millipore, Bedford, MA, USA) to achieve ultrapure water (18.2 MΩ·cm resistivity) for all analytical procedures.

2.4. Seed Oil Analysis

Chemical Inputs

All reagents employed in this study were of analytical grade and sourced from Sigma-Aldrich (Saint Louis, MO, USA).

2.5. Biochemical Analysis

2.5.1. Phenol Extraction

To determine the total phenolic content, total flavonoid content, and antioxidant capacity, the extraction of compounds followed the method outlined by Tsimidou et al. (1992), with slight modifications [31]. In brief, 2 g of oil were dissolved in 10 mL of hexane, to which 4 mL of 60% methanol (v/v) in ultrapure water was added. The mixture was gently agitated on an orbital shaker (150 rpm) at room temperature (22–25 °C) for 2 h, protected from light using aluminum foil to prevent degradation of light-sensitive compounds. After extraction, the upper methanolic phase was separated using a separatory funnel and filtered through Whatman No. 1 filter paper (Whatman International, Brentford, UK). This extraction was repeated three times to ensure maximum recovery and reproducibility. The collected filtrates were pooled, washed with an additional 10 mL of hexane to eliminate remaining lipid residues, and stored in amber vials at 4 °C for no longer than 48 h until analysis.

2.5.2. Total Phenolic Content (TPC)

Total phenolic content (TPC) was determined using a modified version of the Folin–Ciocalteu assay, based on the method described by Singleton et al. (1999) [33]. In this procedure, 50 μL of the extract was mixed with 3 mL of ultrapurewater, followed by the addition of 250 μL of Folin–Ciocalteu reagent and 750 μL of a 7% w/v sodium carbonate solution. The mixture was gently mixed by inversion at room temperature for 8 min. Then, 950 μL of ultrapure water was added, and the reaction was left to develop in the dark for 2 h at room temperature. Absorbance was measured at 765 nm using a Jasco V-530 UV-Vis spectrophotometer (Hachioji, Tokyo, Japan), with a blank containing all reagents except the sample extract for baseline correction. Gallic acid at concentrations ranging from 10 to 100 μg/mL served as the standard to generate the calibration curve (R2 > 0.987), and TPC results were expressed as milligrams of gallic acid equivalents (GAE) per 100 g of oil. All measurements were performed in triplicate, and results are reported as mean ± standard deviation.

2.5.3. Total Flavonoid Content (TFC)

The total flavonoid content (TFC) was assessed following the protocol established by Favati et al. (1994) [32]. In short, 0.5 mL of the extract was combined with 0.5 mL of a 2% w/v aluminum chloride solution prepared in methanol. The mixture was left to react at room temperature for 15 min in the dark, after which the absorbance was measured at 430 nm, using methanol as the blank reference. Quercetin at concentrations of 5–50 μg/mL was used as the standard (R2 > 0.998), and TFC was expressed as milligrams of Quercetin equivalents (QCE) per 100 g of oil. All measurements were performed in triplicate.

2.5.4. Free Radical Scavenging Activity (DPPH Assay)

Free radical scavenging activity (FRSA) was measured using the DPPH (2,2-diphenyl-1-picrylhydrazyl) assay, adapted from the method of Brand-Williams et al. (1995) [34]. In this procedure, 50 μL of the oil extract was mixed with 950 μL of a methanolic DPPH solution (0.030 mg/mL, freshly prepared before each assay). The mixture was incubated in the dark for 60 min at room temperature to avoid light-induced degradation. Following incubation, absorbance was recorded at 515 nm using a spectrophotometer, with a blank prepared by substituting the sample with methanol instead of ultrapure water. The DPPH radical scavenging activity was calculated as a percentage inhibition using the following formula:
DPPH inhibition (%) = [(Ac − Ae)/Ac] × 100
where Ac is the absorbance of the control, and Ae is the absorbance of the sample. All measurements were performed in triplicate.

2.5.5. Radical Cation Decolorization (ABTS Assay)

Antioxidant capacity was assessed using the ABTS (2,2′-azino-bis (3-ethylbenzothiazoline-6-sulfonic acid) radical cation decolorization assay, based on the method of Re et al. (1999) [35] with slight modifications. The ABTS•+stock solution was prepared by reacting 7 mM ABTS with 2.45 mM potassium persulfate in ultrapure water and storing it in the dark at room temperature for 12–16 h before use. The working solution was obtained by diluting the stock with methanol to an absorbance of 0.70 ± 0.02 at 734 nm. In this test, 10 μL of the oil extract was mixed with 990 μL of ABTS+ solution, which was generated by reacting ABTS with potassium persulfate. The mixture was incubated in the dark at room temperature for 6 min. Absorbance was then measured at 734 nm, using methanol as the blank. The percentage of radical scavenging activity was calculated using the following formula:
ABTS inhibition (%) = [(Ac − Ae)/Ac] × 100,
where Ac and Ae represent the absorbance of the control and the sample, respectively.

2.6. Variety Coding for Statistical Analysis

For multivariate statistical purposes, each of the thirty-seven fig (Ficus carica L.) varieties was assigned a numerical code to simplify data visualization and interpretation in the statistical plots (Table 2). This numerical identification was consistently applied throughout the biochemical and the FTIR-ATR statistical analyses. This coding approach allowed for a clear graphical representation in the PCA score plots (Figures 4 and 9) without overcrowding the visualization with full cultivar names.

2.7. FTIR-ATR Spectroscopy

Fourier transform infrared (FTIR) spectra of fig seed oil were obtained using a Bruker spectrometer (Bruker Optics Inc., Ettlingen, Germany), scanning the wavenumber range from 4000 to 450 cm−1 with a resolution of 4 cm−1. Analyses were conducted at room temperature with approximately 50 μL of oil applied per measurement to ensure complete coverage of the crystal surface. Each spectrum represents the average of multiple replicates, with 128 scans recorded for each sample to improve signal-to-noise ratio. Prior to sample measurement, a background spectrum was collected using a clean germanium crystal in air and subsequently subtracted from the sample spectra automatically.
To maintain measurement accuracy, the ATR crystal was thoroughly cleaned with analytical-grade ethanol and warm ultrapure water between samples, then dried with absorbent paper. Baseline correction was applied to all spectra to minimize potential interference from atmospheric CO2 and water vapor. ATR correction was carried out with parameters set at a 45° angle of incidence, single-bounce ATR reflection, and a sample refractive index of 1.5, typical for vegetable oils. The maximum penetration depth was fixed at 50 μm over a 1.8 mm crystal surface [36].
In ATR spectroscopy, the IR light reflects internally within the high refractive index crystal, generating an evanescent wave that interacts with the sample’s lower refractive index surface. to a depth of approximately 0.5–2 μm, providing information about the molecular composition at the oil–crystal interface. Spectral intensities corresponding to the molecular fingerprints were quantified using Essential FTIR software (version 3.00, Operant LLC, Burke, VA, USA) [37]. Integrated band areas were calculated for five characteristic peaks: 3012 cm−1 (=C–H stretching of unsaturated fatty acids), 2928 cm−1 (–CH2 asymmetric stretching), 1745 cm−1 (C=O ester stretching of triglycerides), 1375 cm−1 (CH3 symmetric bending), and 1050 cm−1 (C–O stretching of primary alcohols and esters). Baseline correction was performed using a linear baseline drawn between the integration limits.

2.8. Data Analysis

All data analyses were performed using Python (v3.10), with pandas (v1.5.3), numpy (v1.24.2), matplotlib (v3.7.1), seaborn (v0.12.2), scipy (v1.10.1), and scikit-learn (v1.2.2) libraries being employed for data processing and visualization. Statistical significance was set at α = 0.05 for all tests unless otherwise specified.

2.8.1. Biochemical Data Analysis

Descriptive statistics were first calculated for all biochemical parameters, including total phenolic content (TPC), total flavonoid content (TFC), antioxidant capacities (DPPH and ABTS), oil yield, and seed yield.
The main design factors, including the year and the variety, were assessed for their effect on the abovementioned parameters individually and in the combination of both (Year × Variety), through a two-way Analysis of Variance (ANOVA) using the Type III sum of squares method to account for unbalanced designs. Normality of residuals was assessed using the Shapiro–Wilk test, and homogeneity of variances was verified using Levene’s test. When significant effects were detected (p < 0.05), pairwise comparisons were further examined using Tukey’s HSD test honest significant difference test with Bonferroni correction for multiple comparisons.
Data distribution patterns were visualized using boxplots, and relationships among biochemical traits were explored through a correlation heatmap based on Pearson’s correlation coefficients. A PCA biplot was also constructed to identify global trends and similarities among varieties across years. PCA was performed on standardized data (z-score normalization) to give equal weight to all variables regardless of their measurement units. The number of principal components retained was determined based on the Kaiser criterion (eigenvalues > 1) and cumulative explained variance exceeding 70%.

2.8.2. FTIR Integrated Area Analysis

For the FTIR analysis, the integrated absorbance areas of the main spectral peaks (3012, 2928, 1745, 1375 and 1050 cm−1) were computed directly from the raw spectra without preprocessing using trapezoidal numerical integration after linear baseline correction.
A two-way ANOVA was then applied to each integrated area to examine the effects of year, variety and their interaction following the same statistical assumptions and procedures described in Section 2.8.1. Boxplots were generated to compare the distribution of integrated absorbance values between years, while PCA biplots were used to visualize the overall grouping and variance structure among samples based on FTIR peaks. PCA on FTIR data was performed on mean-centered integrated areas without additional scaling to preserve the relative magnitudes of spectral features.

3. Results

3.1. Seed Yield per Fruit and Oil Yield

The seed yield per fruit and oil yield exhibited substantial variation among the thirty-seven fig genotypes analyzed over the two consecutive seasons (2023 and 2024). Both traits showed a strong dependence on the genetic background and a noticeable influence of the growing year, suggesting that genotype × environment interactions play a key role in determining the productivity and oil accumulation potential of fig seeds.
In 2023, seed yield varied from 1.023 ± 0.019 g for ‘Jeblia’ to 3.608 ± 0.1 g for ‘Bourjassate Noire’, with an average of 2.00 g (Table 3). In 2024, values ranged from 0.387 ± 0.055 g ‘INRA 1304’ to 5.053 ± 0.07 g ‘Bourjassate Noire’, averaging 2.25 ± 1.12 g. Genotypes ‘VCR 276/49’ and ‘Bourjassate Noire’ maintained high yields across both seasons.
Oil content showed substantial variability between genotypes and seasons. In 2023, it ranged from 10.55 ± 0.75% for ‘Jeblia’ to 35.56 ± 1.16% for ‘Sucre Vert’, averaging 25.6 ± 0.05%. Genotypes ‘Sucre Vert’, ‘Hamra’, ‘White Adriatic’, and ‘INRA 2304’ exceeded 33%.
In 2024, a marked reduction was observed, with values from 6.31 ± 0.69% (‘INRA 1304’) to 37.82 ± 0.43% ‘Ferqouch Jmel’, representing an overall 20.5% drop (26.6% vs. 21.2%, p < 0.001). Nonetheless, ‘Ferqouch Jmel’ and ‘Noukali’ sustained high yields.

3.2. Biochemical Characterization and Statistical Evaluation

Descriptive Analysis of Biochemical Parameters

  • Yearly trends in biochemical composition and yield traits
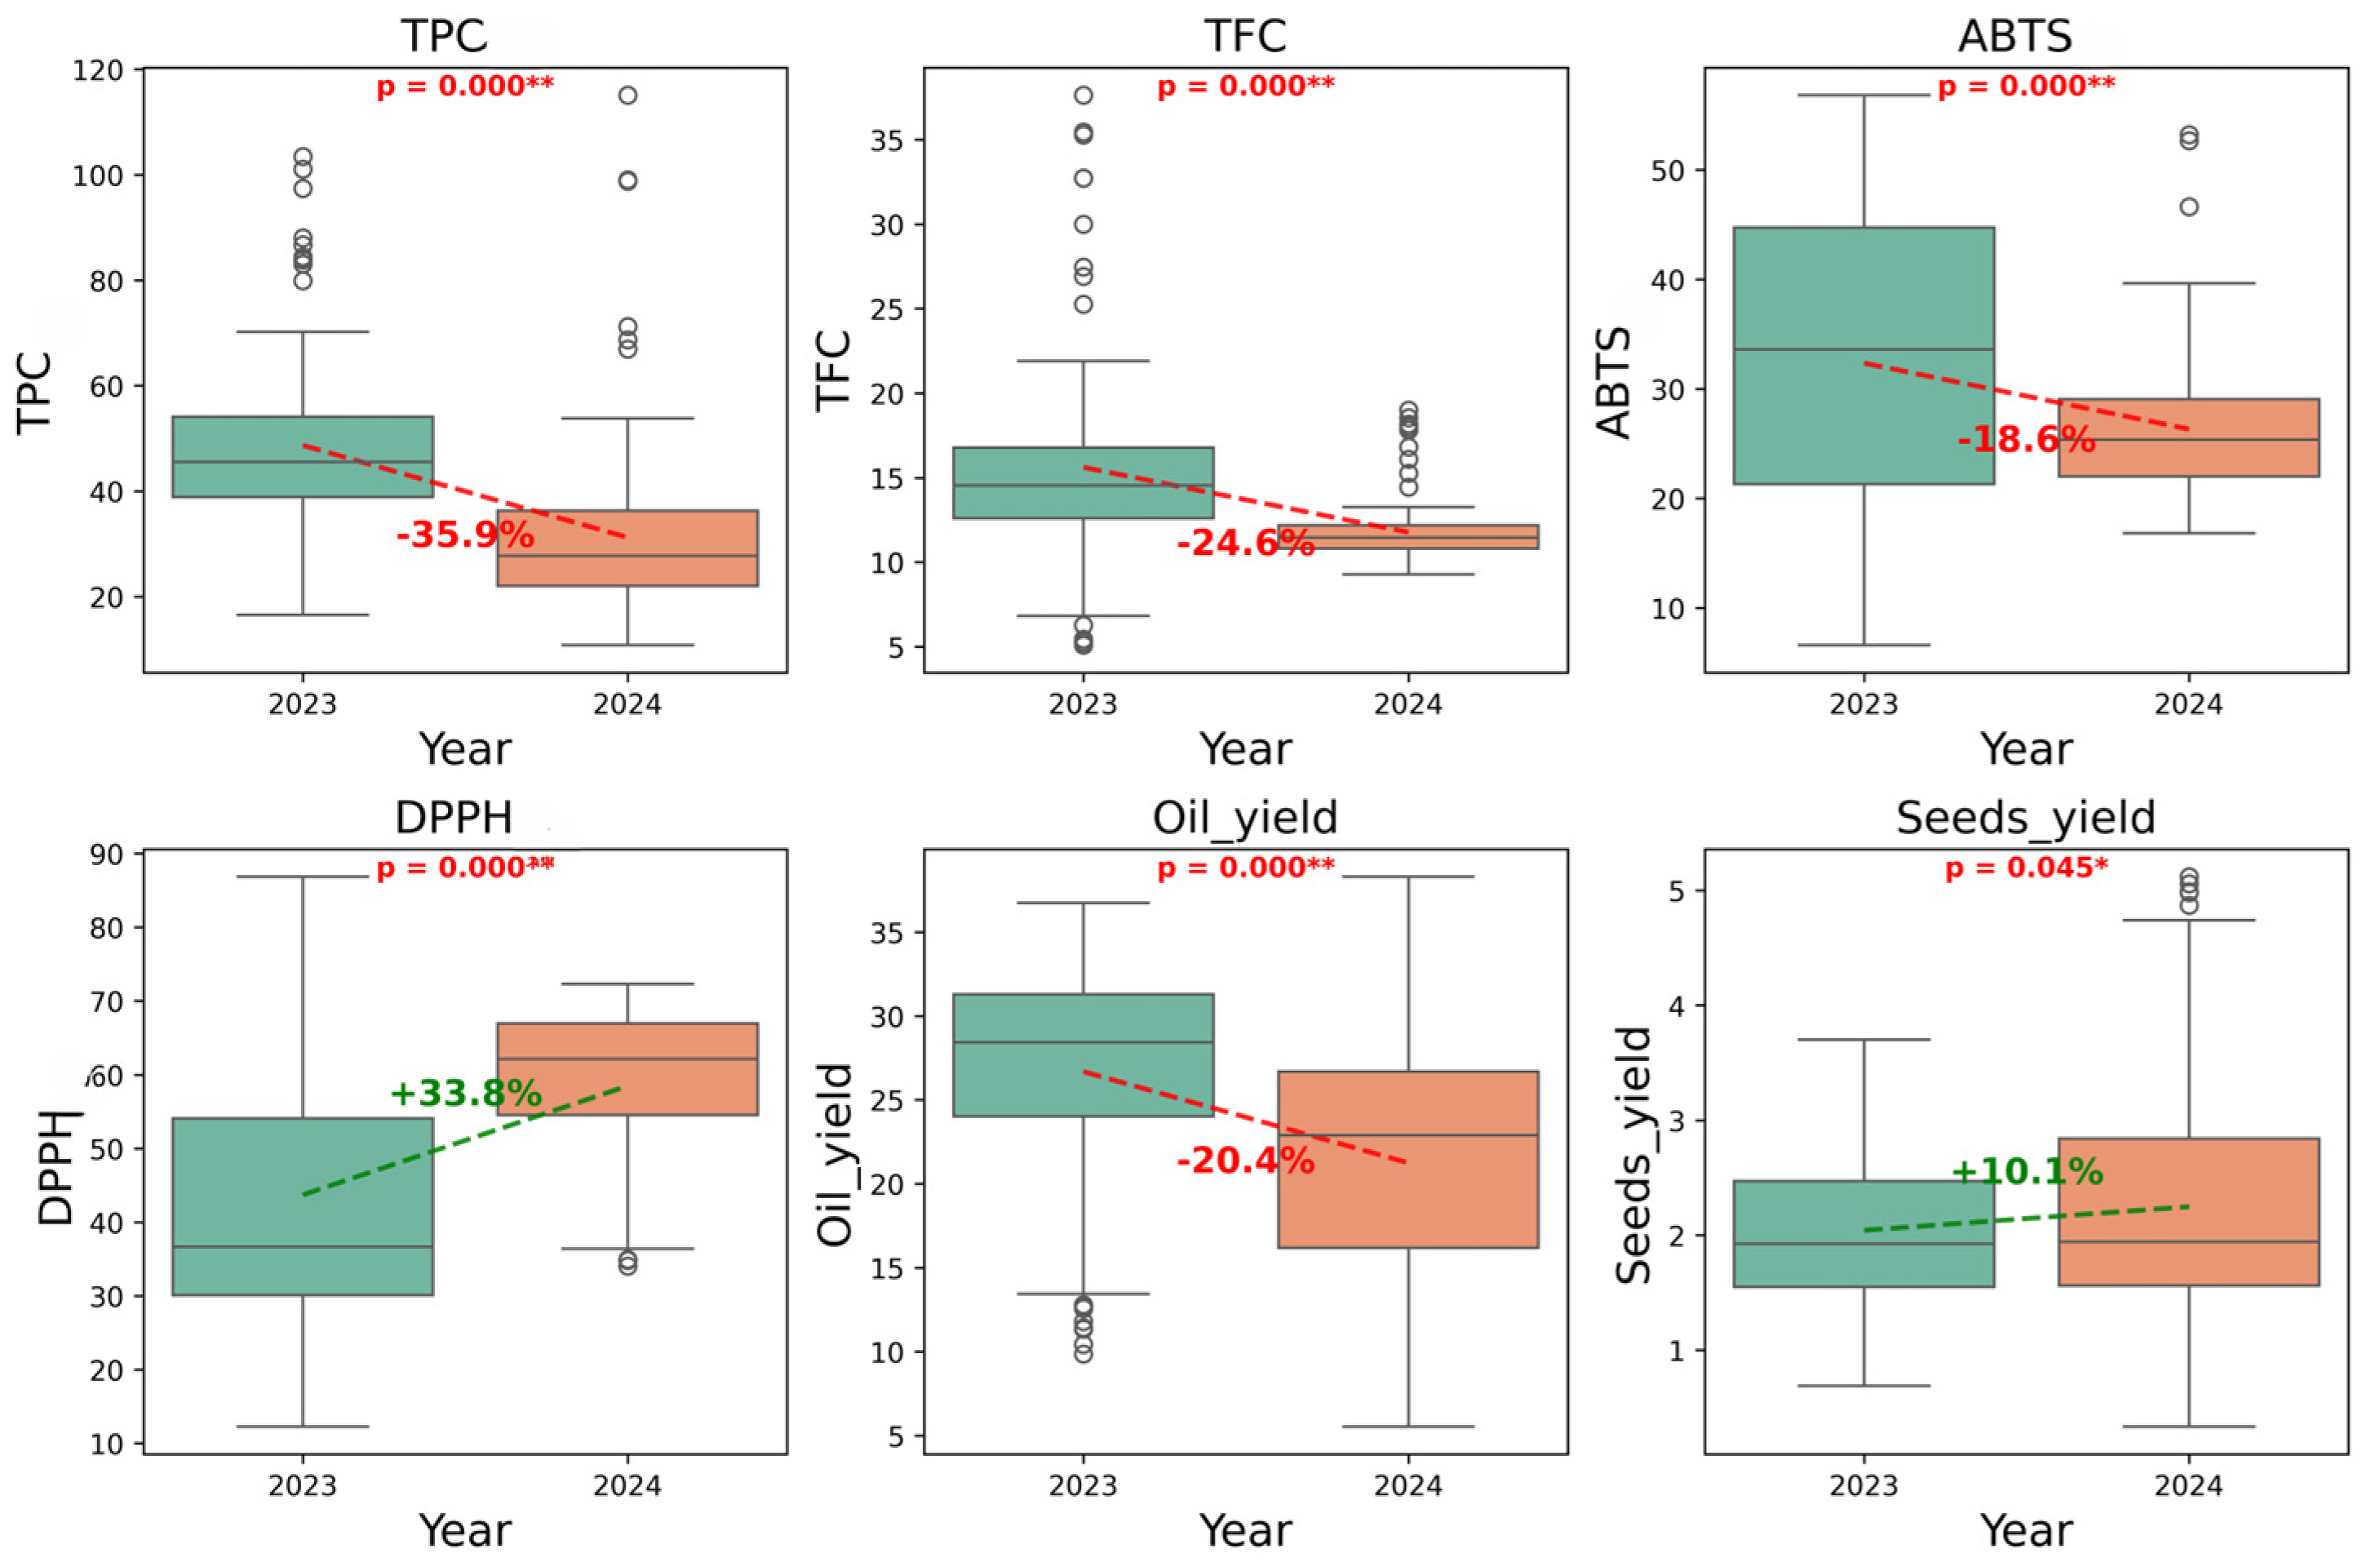
The biochemical profiling of the thirty-seven fig genotypes over the 2023 and 2024 seasons revealed substantial interannual and genotypic variability (Table 4; Figure 2).
The average total phenolic content (TPC) significantly decreased from 48.68 ± 16.59 mg GAE/100 g oil in 2023 to 31.21 ± 16.64 mg GAE/100 g oil in 2024, representing a 36% reduction (p < 0.001). The wider dispersion observed in 2023 indicates greater genetic variability in phenolic responses. Flavonoid content dropped from 15.62 ± 5.86 mg QCE/100 g oil in 2023 to 11.78 ± 1.88 mg QCE/100 g oil in 2024. The reduced variability in 2024 suggests a more uniform metabolic response across genotypes. DPPH scavenging activity increased from 43.70 ± 20.94% in 2023 to 58.49 ± 10.78% in 2024, a significant 34% improvement (p < 0.001), while ABTS activity decreased from 32.34 ± 14.28% to 26.31 ± 6.10%, a 18.6% reduction (p < 0.001). Oil content decreased from 26.68 ± 6.77% in 2023 to 21.25 ± 7.42% in 2024, while seed yield per fruit slightly increased from 2.04 ± 0.66 g to 2.25 ± 1.12 g.
  • Varietal trends in biochemical composition and yield traits
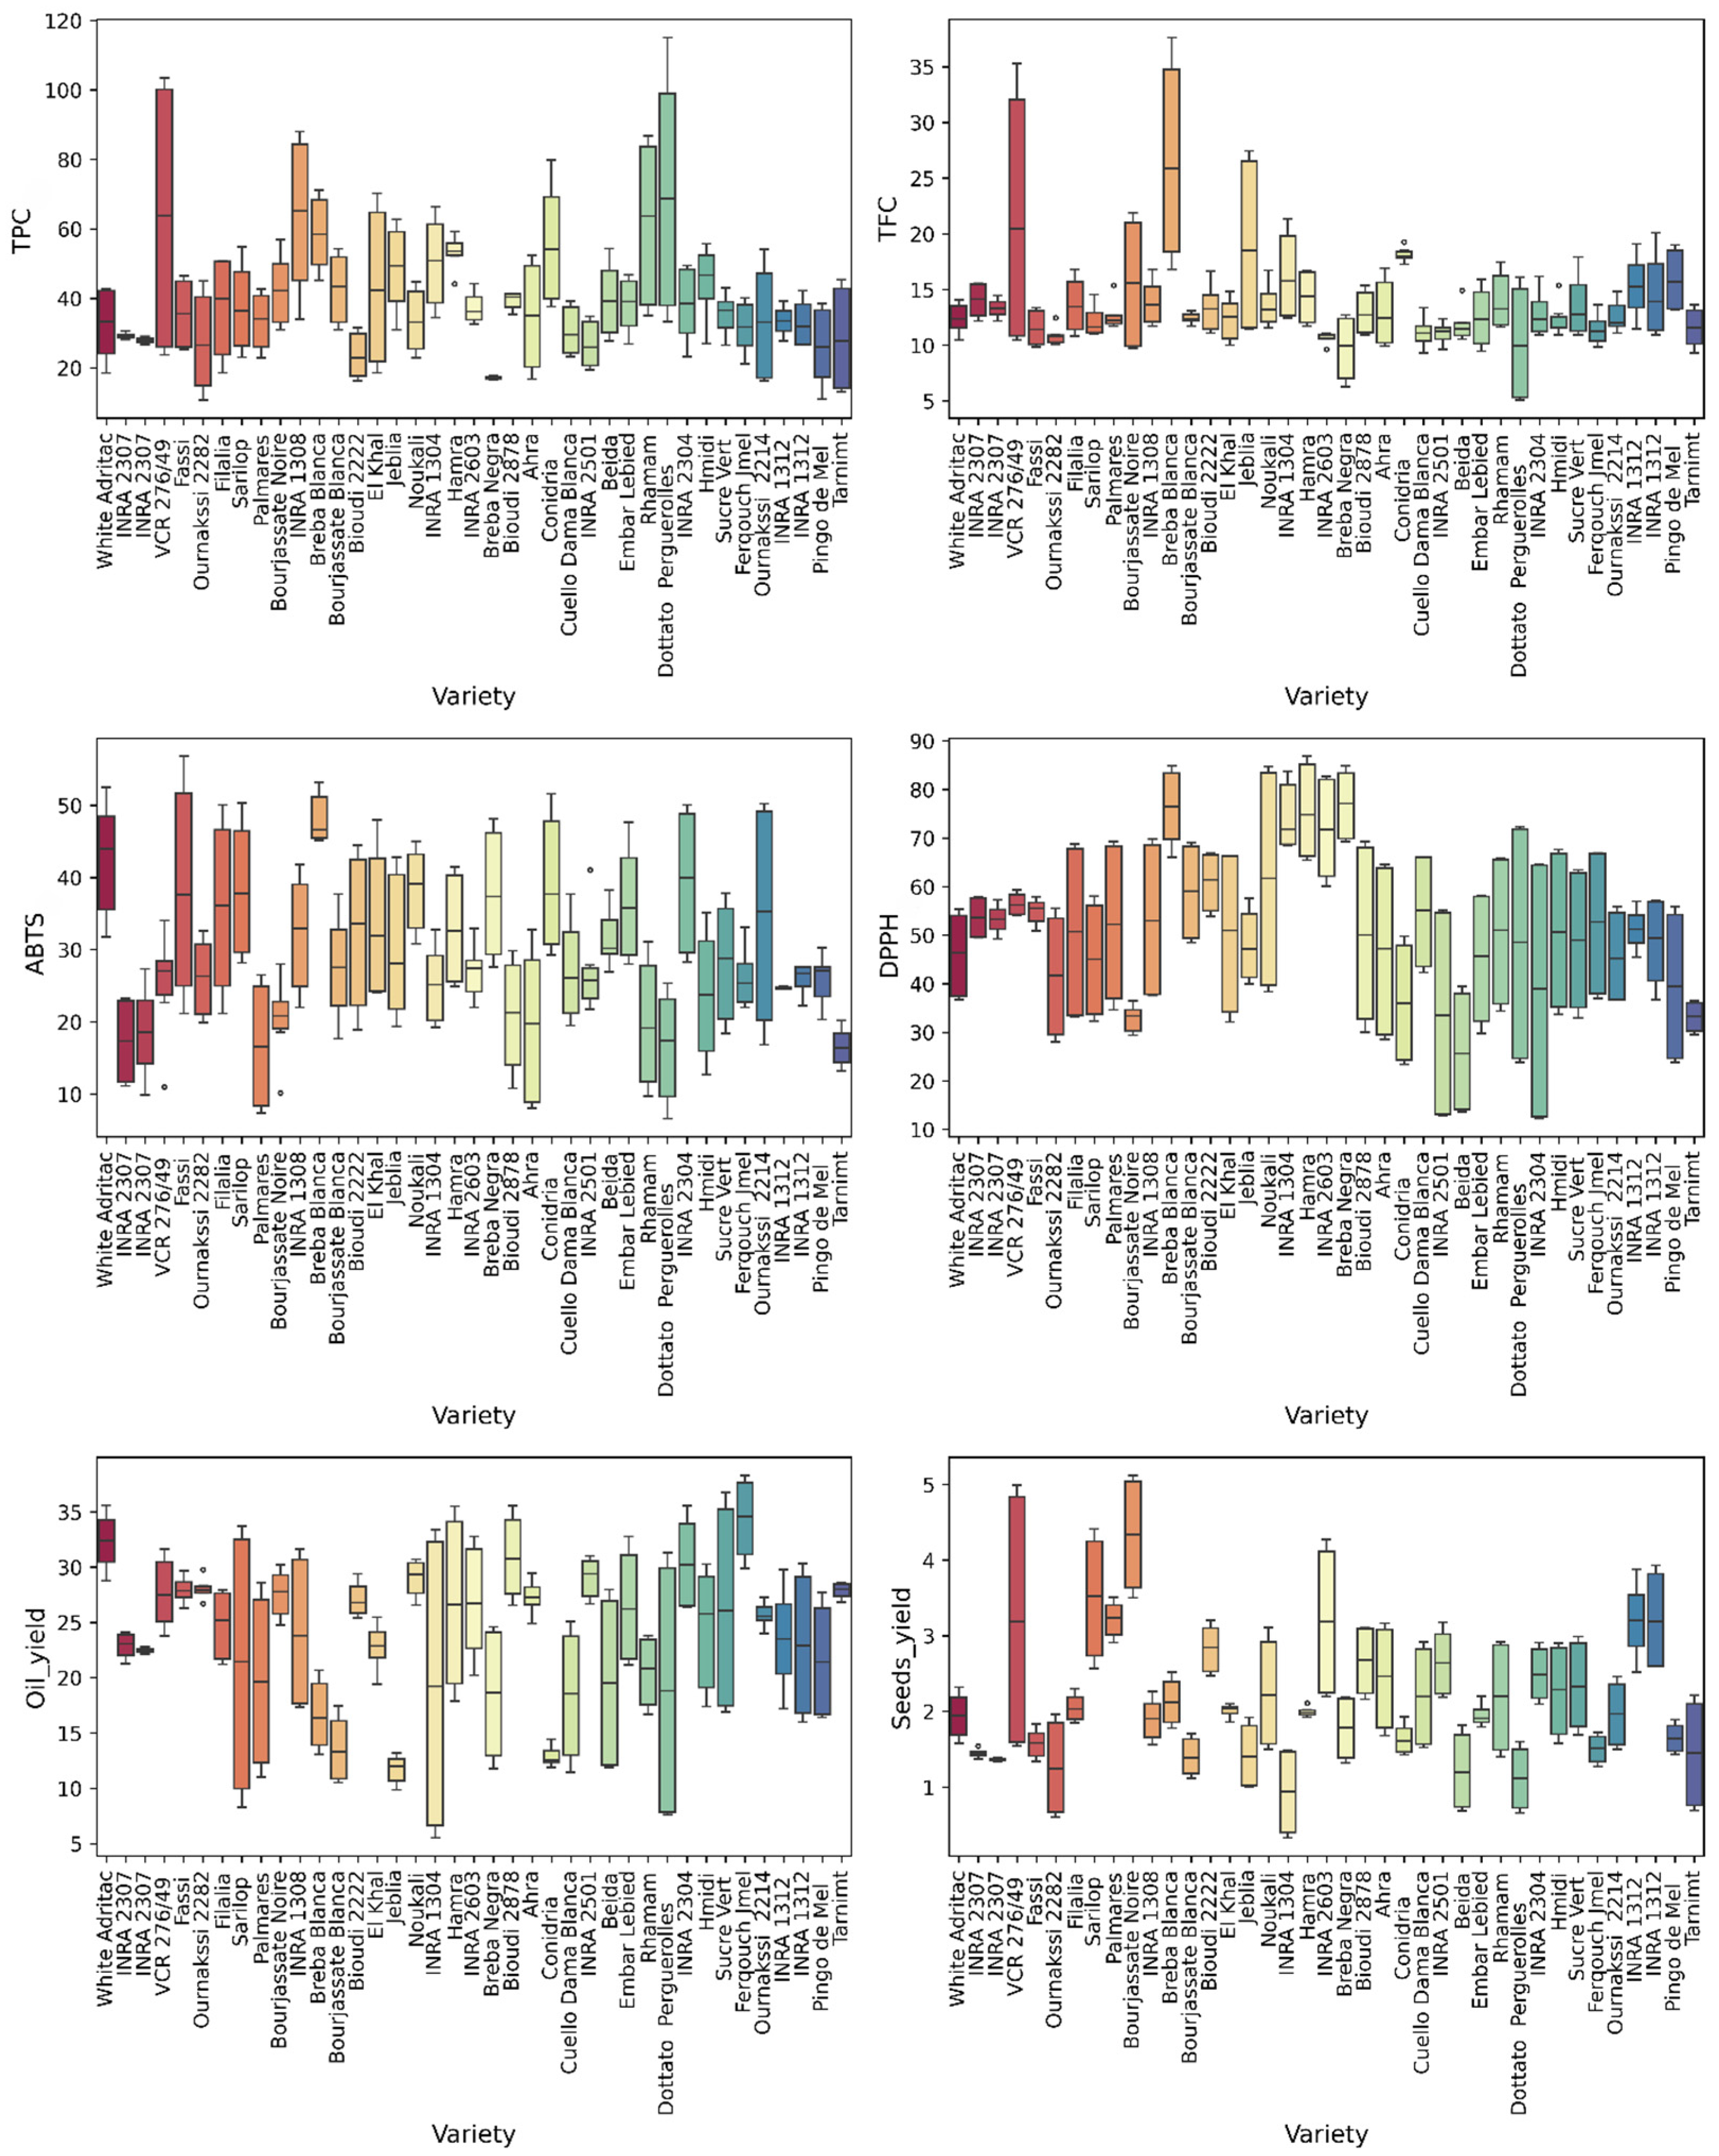
Marked differences were observed between genotypes (Figure 3). ‘Dottato Perguerolles’, ‘VCR 276/49’, ‘Rhamam’, and ‘INRA 1304’ exhibited the highest TPC (>70 mg GAE/100 g). ‘Breba Negra’, ‘Bioudi 2222’, and ‘INRA 2307’ showed lower TPC. For TFC, ‘Breba Blanca’, ‘VCR 276/49’, and ‘Jeblia’ maintained high levels. ‘Breba Blanca’, ‘Breba Negra’, and ‘Hamra’ displayed strong DPPH activity, while ‘Breba Blanca’ and ‘White Adriatic’ showed marked ABTS responses. ‘Ferqouch Jmel’ and ‘White Adriatic’ presented the highest oil contents (>30%), while ‘Jeblia’ and ‘Conidria’ showed lower yields. ‘Bourjassate Noire’, ‘Sarilop’, and ‘VCR 276/49’ displayed the highest median seed weights.

3.3. Multivariate and Univariate Statistical Analyses

ANOVA revealed highly significant effects (p < 0.001) of Year, Genotype, and their interaction on all parameters (Table 5). The Year effect was particularly pronounced for DPPH (F = 6199.06) and oil content (F = 1864.59). The significant varietal effect demonstrates substantial genetic diversity, although F-values (35.9–550.8) were lower than year effects. The Year × Genotype interaction (F = 28.6–367.3) reveals pronounced variations in genotype ranking between years.
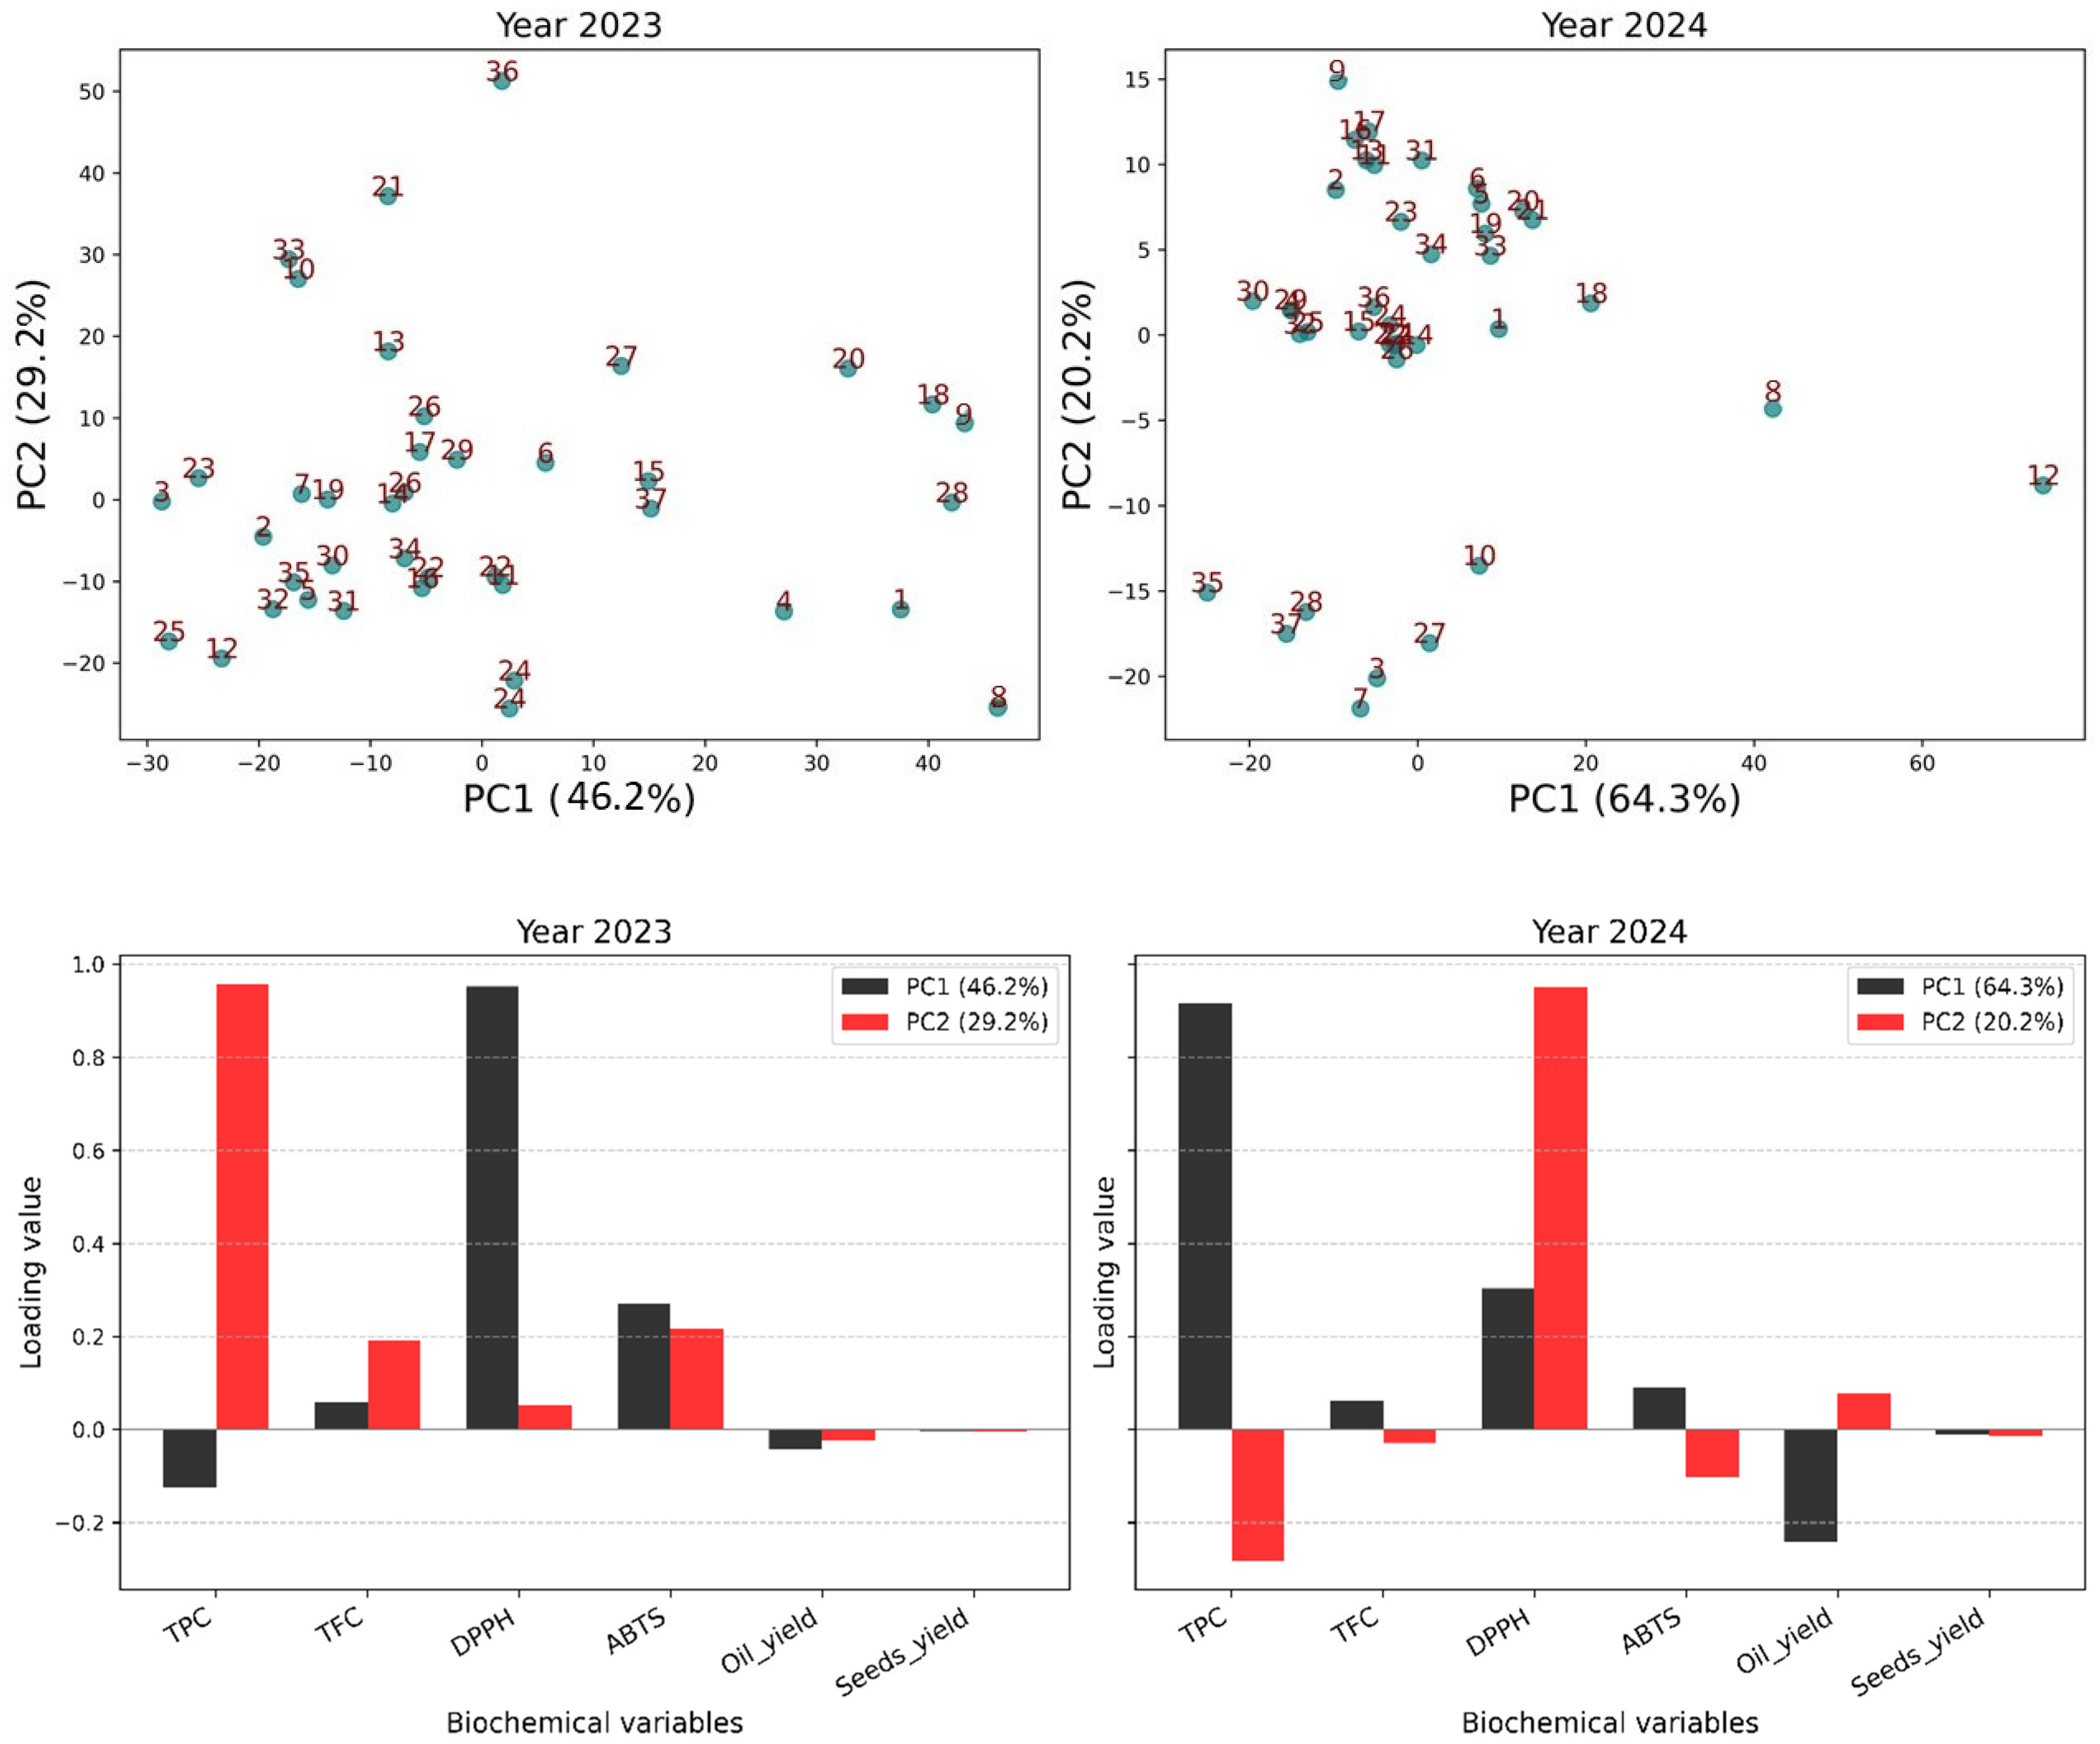
The PCA revealed clear differentiation patterns (Figure 4). In 2023, PC1 and PC2 explained 75.4% of the variance (46.2% and 29.2%), while in 2024, this reached 84.5% (64.3% and 20.2%).
In 2023, PC1 was associated with antioxidant activity (DPPH, ABTS), while PC2 was dominated by TPC. In 2024, TPC became the main contributor to PC1, with oil content negatively correlated, and PC2 was explained by DPPH.
Score plots illustrated these relationships. In 2023, dispersion was wide with distinct clusters: ‘Conidria’ (9), ‘Hmidi’ (18), ‘INRA 1308’ (20), and ‘Noukali’ (28) occupied the upper-right quadrant, while ‘Jeblia’ (27), ‘Ferqouch Jmel’ (15), and ‘INRA 2501’ (24) clustered toward the lower quadrants. In 2024, the distribution was more compact.
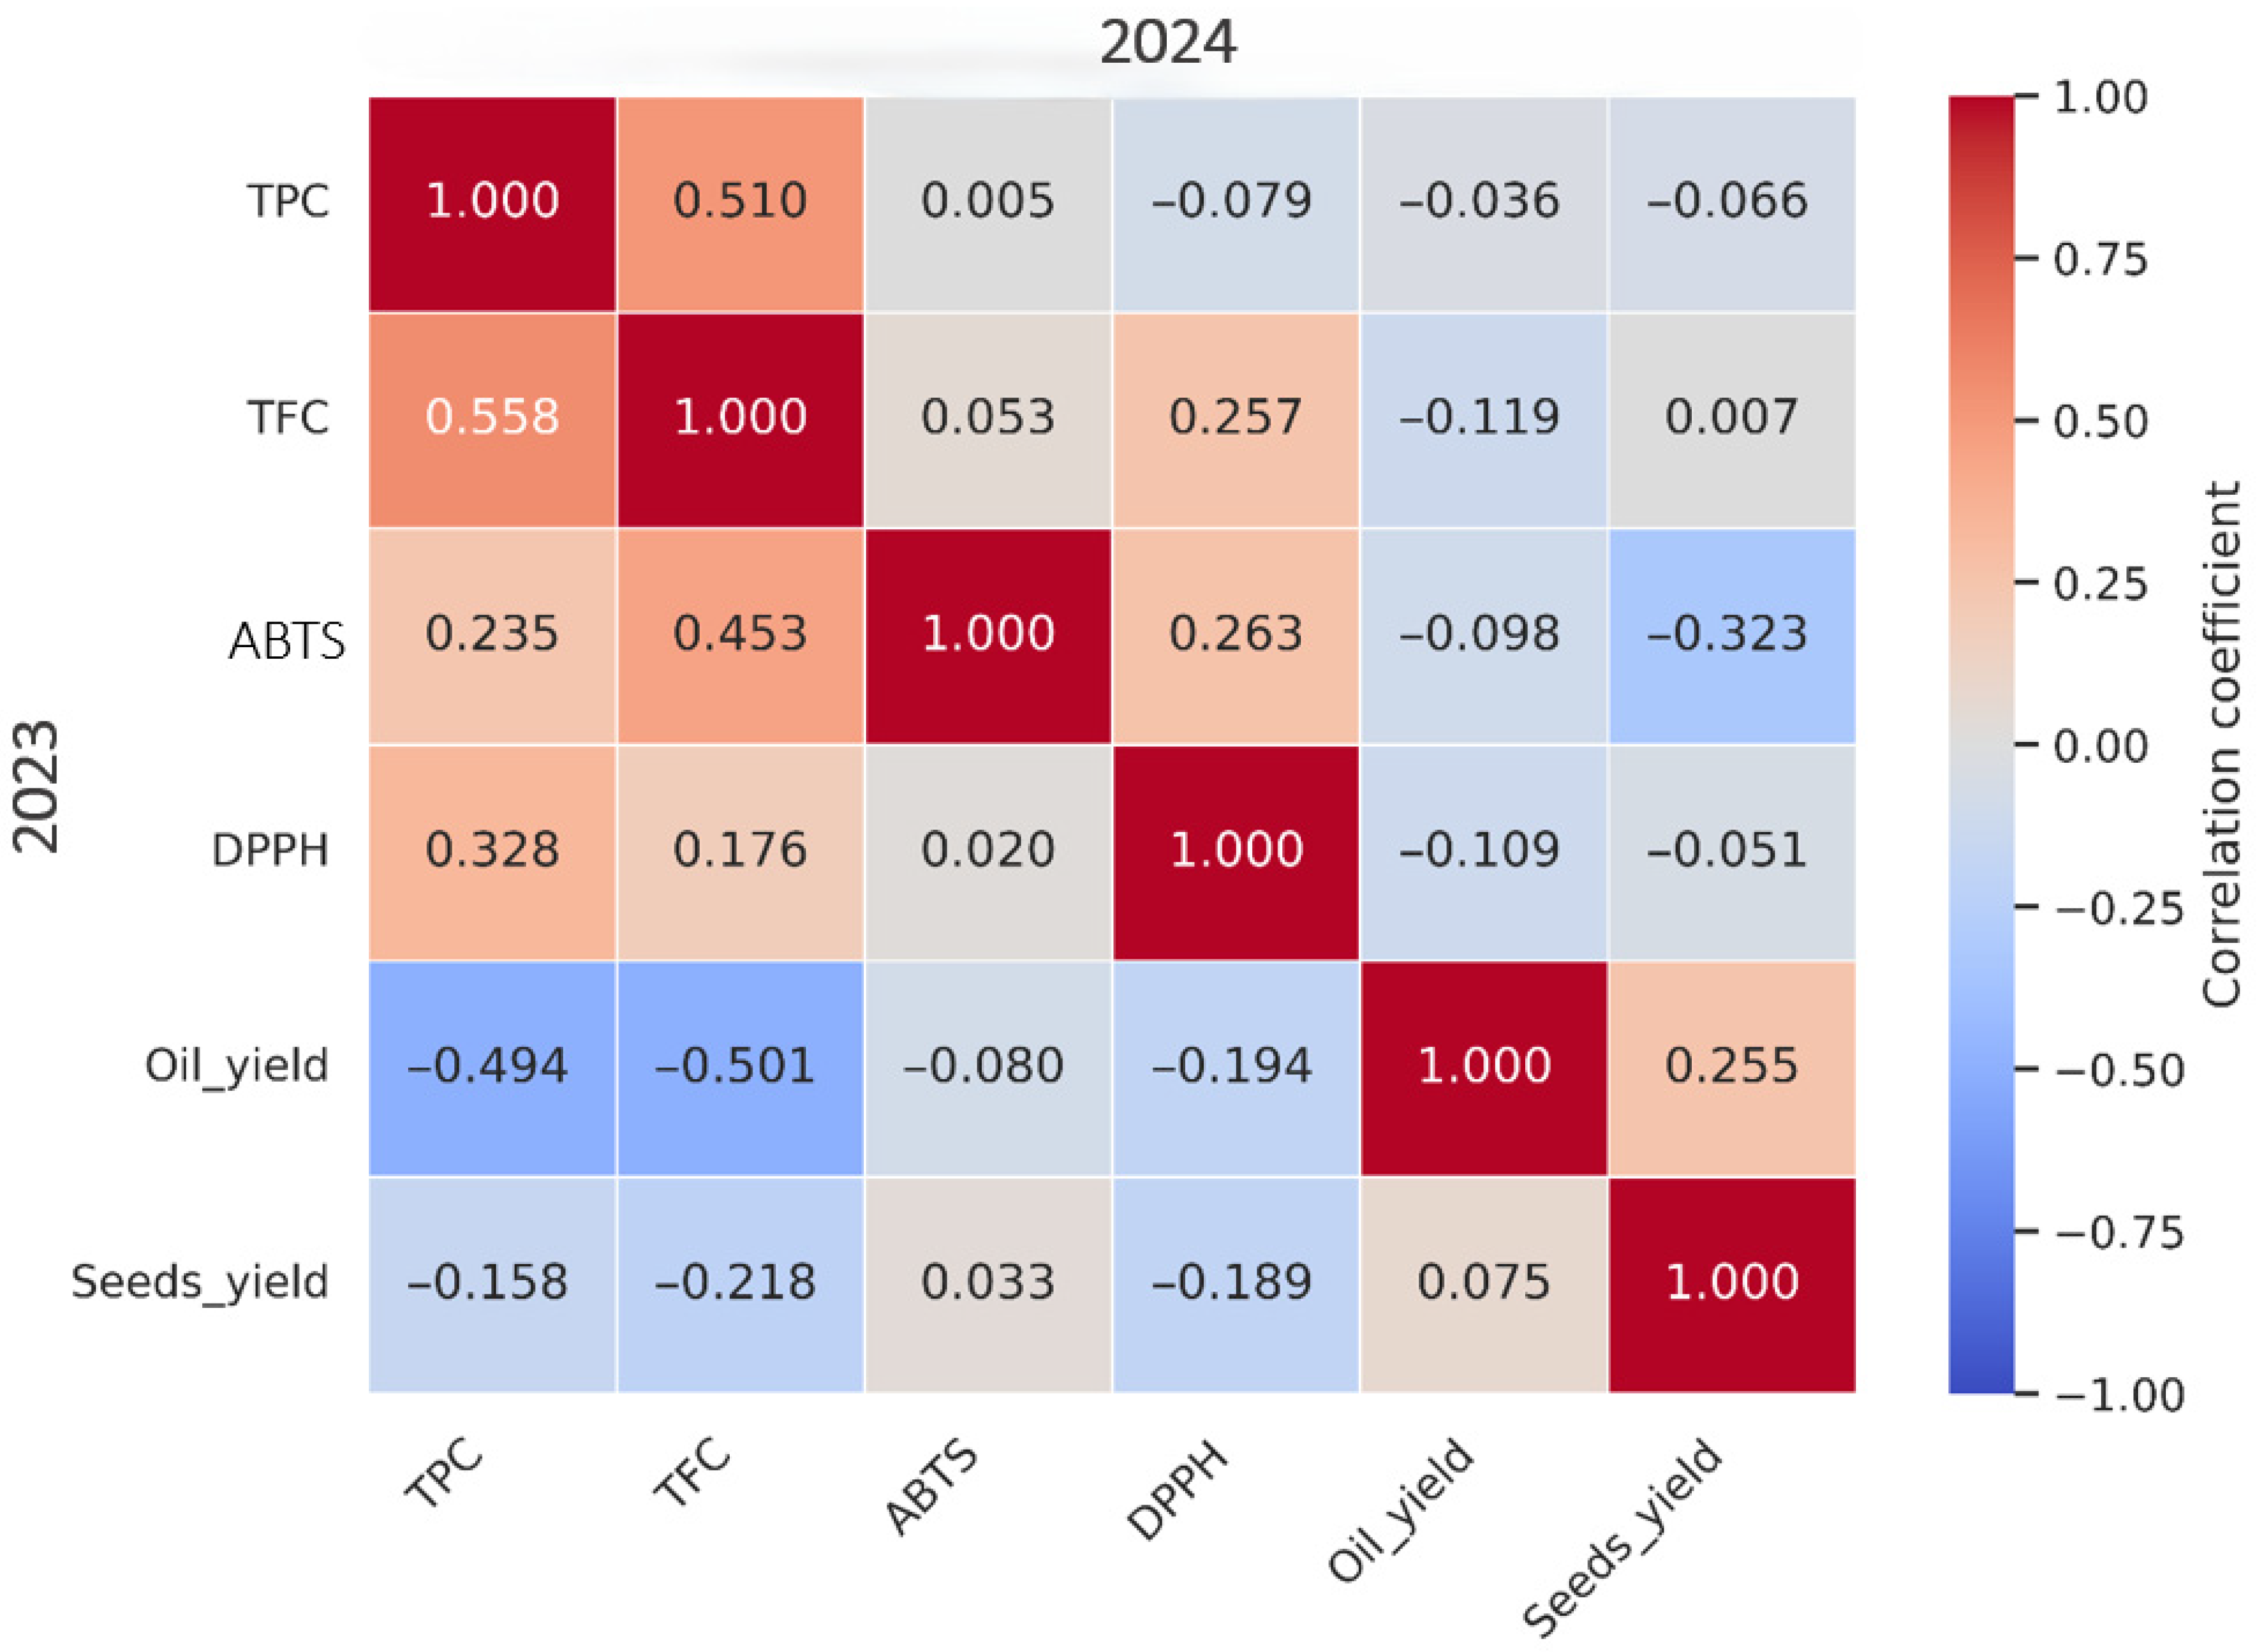
The heatmap (Figure 5) revealed moderate positive associations between TPC and TFC (r = 0.56 in 2023; r = 0.51 in 2024). DPPH showed positive correlation with TPC (r = 0.33 in 2023) and TFC (r = 0.18–0.26), while ABTS exhibited weak associations (r < 0.3).
Oil content showed a negative correlation with TPC (r = −0.49 in 2023) and TFC (r = −0.50 in 2023). Seed yield was weakly correlated with oil content (r = 0.25 in 2023).

3.4. Characteristics of FTIR-ATR Signatures

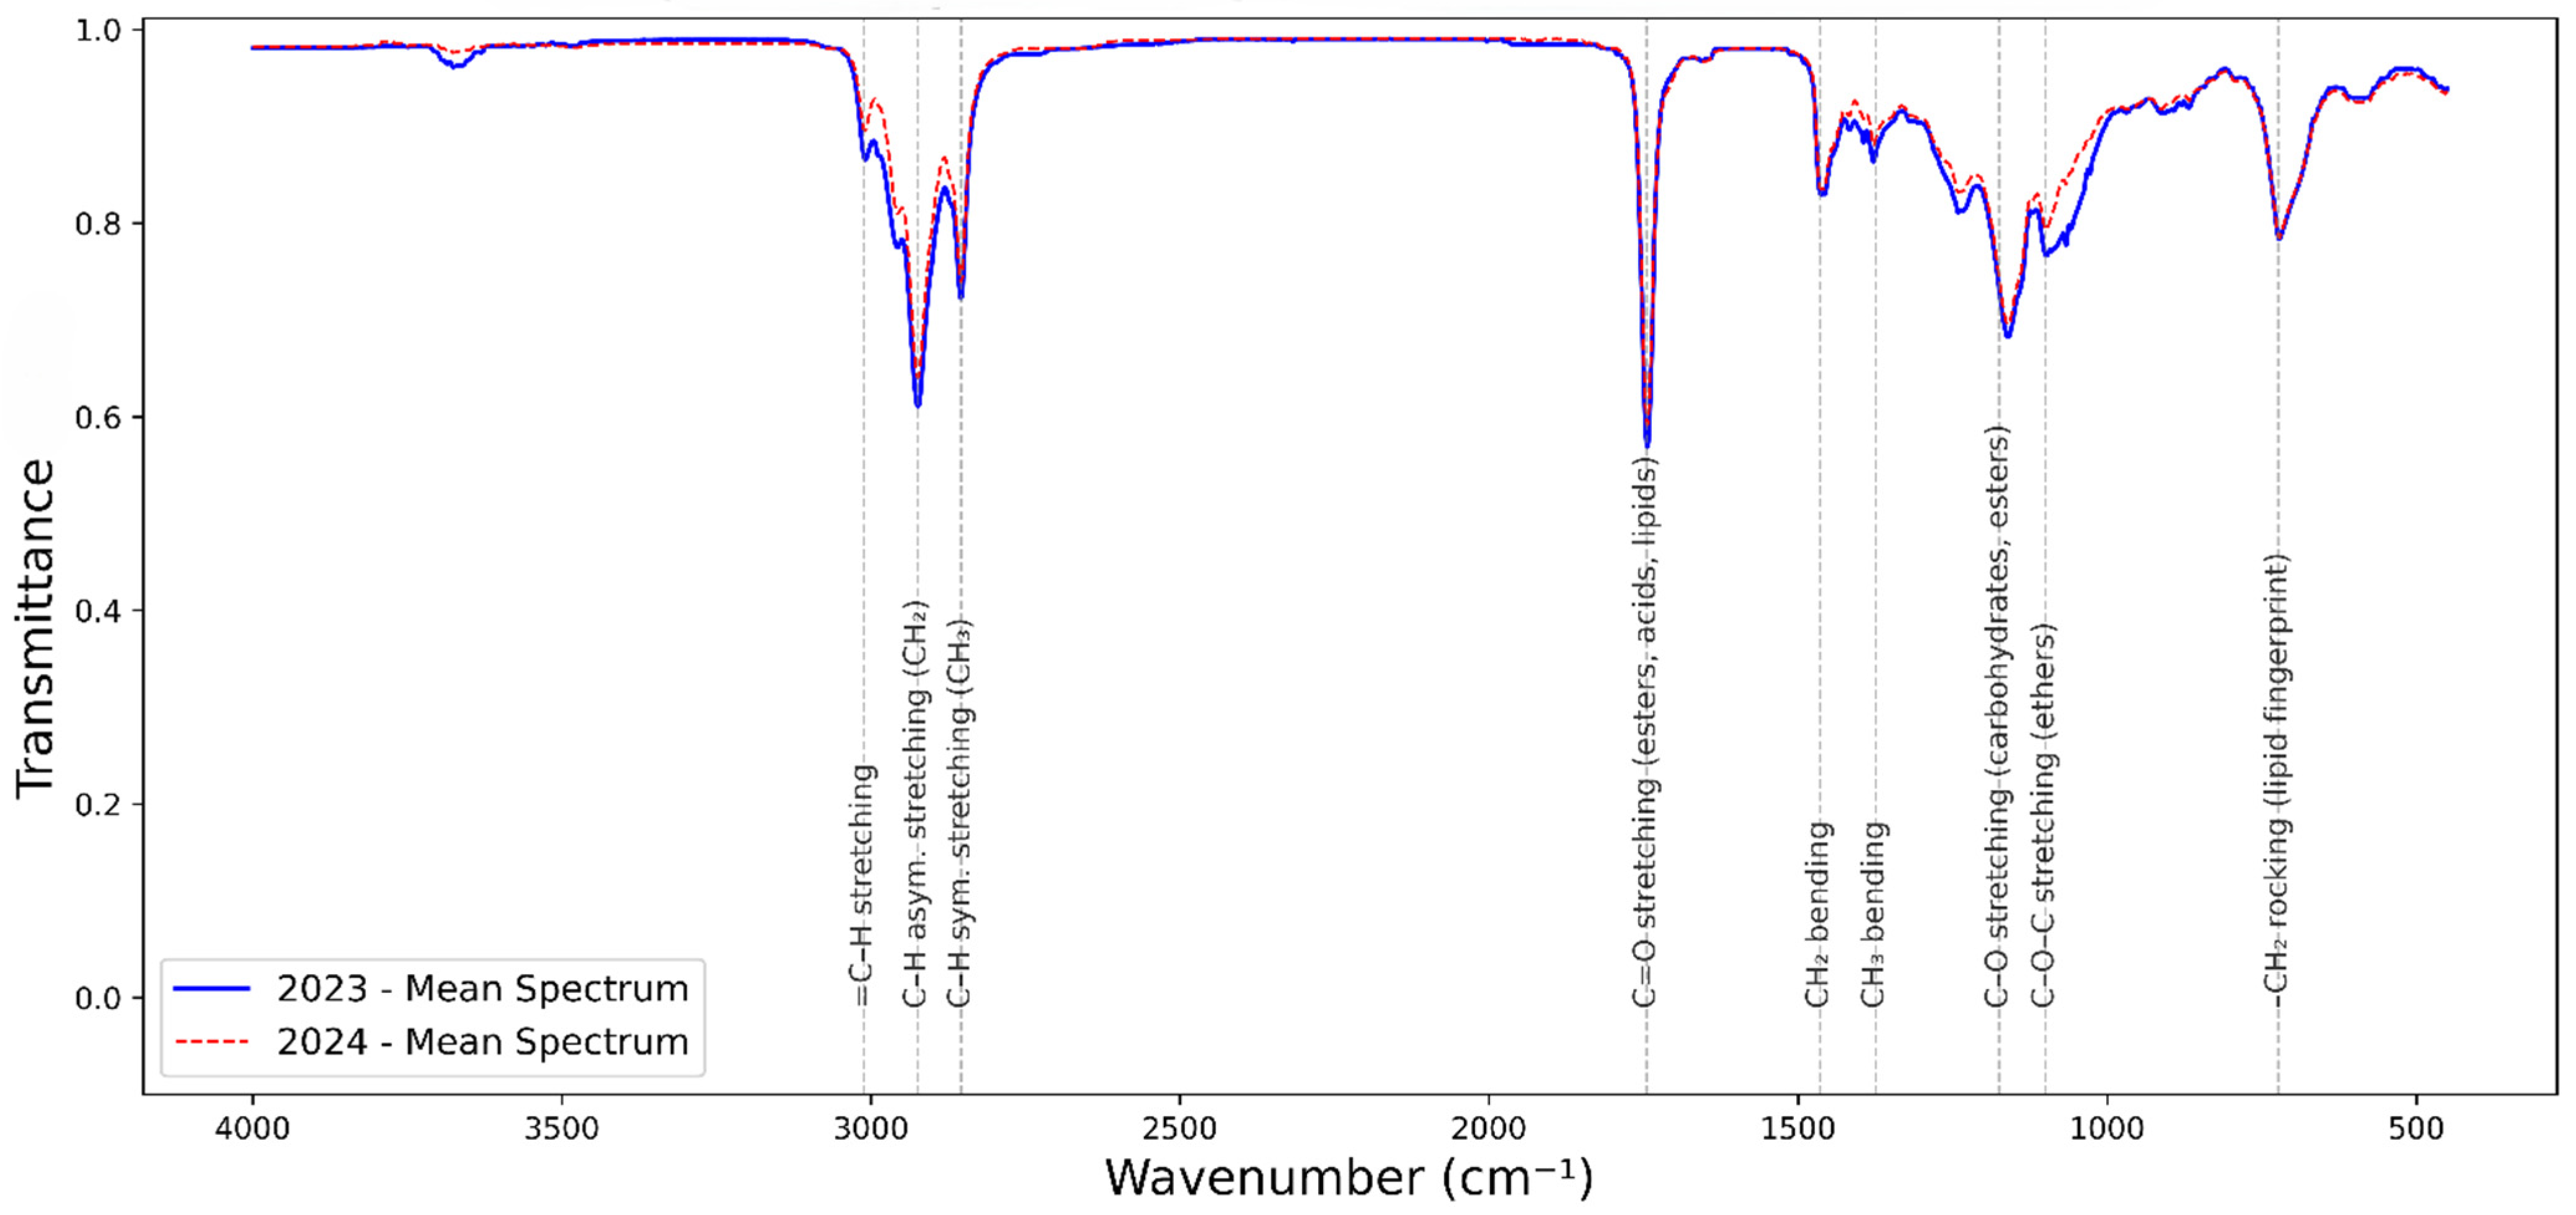
The averaged FTIR spectra of the thirty-seven fig genotypes recorded in 2023 and 2024 exhibited highly comparable global profiles (Figure 6).
C–H stretching vibrations of aliphatic chains were identified by sharp peaks around 2928 cm−1 and 2855 cm−1. A weaker band near 3012 cm−1 was attributed to =C–H stretching of olefinic groups. The intensity ratio between the 2928 and 2855 cm−1 peaks (typically 1.1–1.3) provides information on chain length distribution.
The strong absorption at 1745 cm−1 was assigned to the C=O ester stretching vibration of triglycerides. Other key peaks include 1500 and 1375 cm−1, associated with C–H bending, aromatic ring vibrations from phenolics, and methyl bending of lipids. The 1175 cm−1 band was attributed to C–O stretching vibrations of carbohydrates, while the 723 cm−1 band was related to –CH2 rocking.
In 2024, the spectra tended to display higher absorbance intensities in the C=O ester band (~1745 cm−1) compared to 2023.
Table 6. FTIR peaks assignments for functional groups found in fig seed oil (Ficus carica L.).
Wavenumber (cm−1)Functional GroupAssignmentReferences
3012=C–H stretchingOlefinic groups, unsaturated fatty acids[38]
2928–CH2 stretchingAliphatic chains[39,40]
2855–CH3 stretchingTerminal groups of fatty acids[39,40]
1745C=O ester stretchingTriglycerides, lipids[41,42]
1500C–H bending/aromatic ring vibrationsPhenolics, residual proteins[40,41,42,43]
1375CH3 bendingLipids[43]
1175C–O stretchingCarbohydrates, esterified sugars[40,41,42,43,44]
1050C–O stretchingPolysaccharides[40,41,42,43,44]
723–CH2 rockinglipid fingerprint[45,46]

3.5. Descriptive Analysis of Integrated Areas

3.5.1. Yearly Differentiation of Integrated Areas

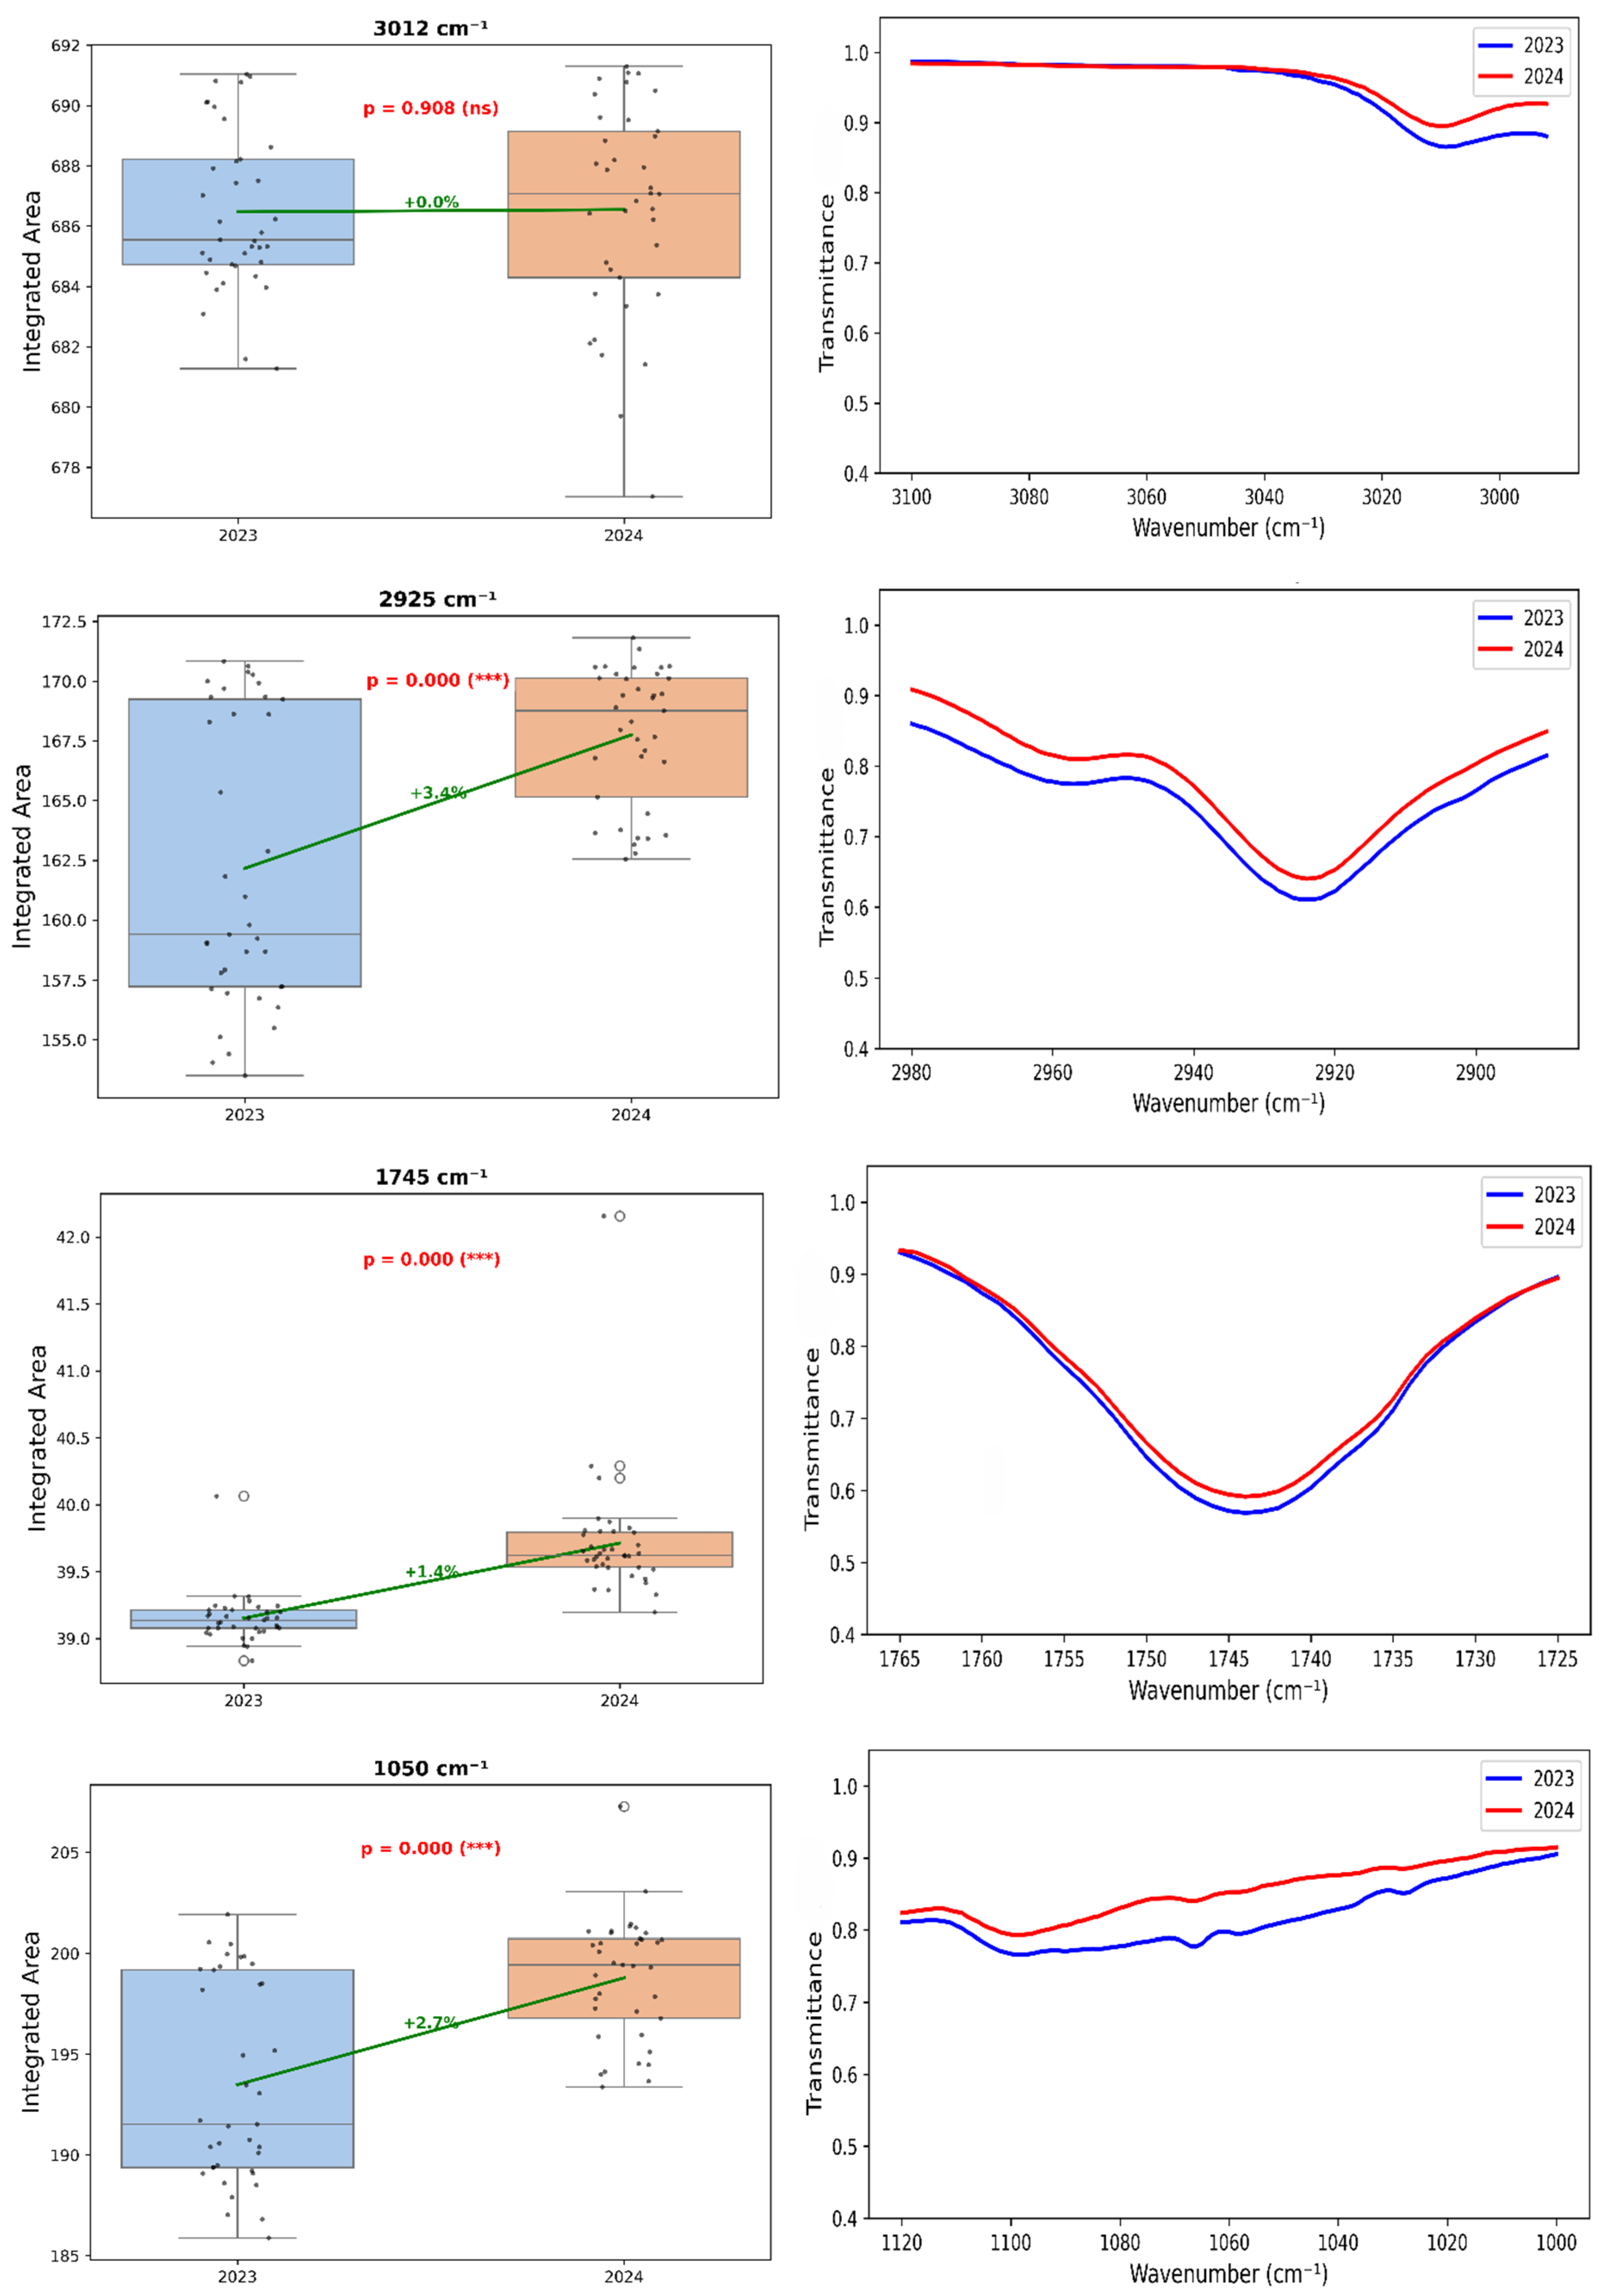
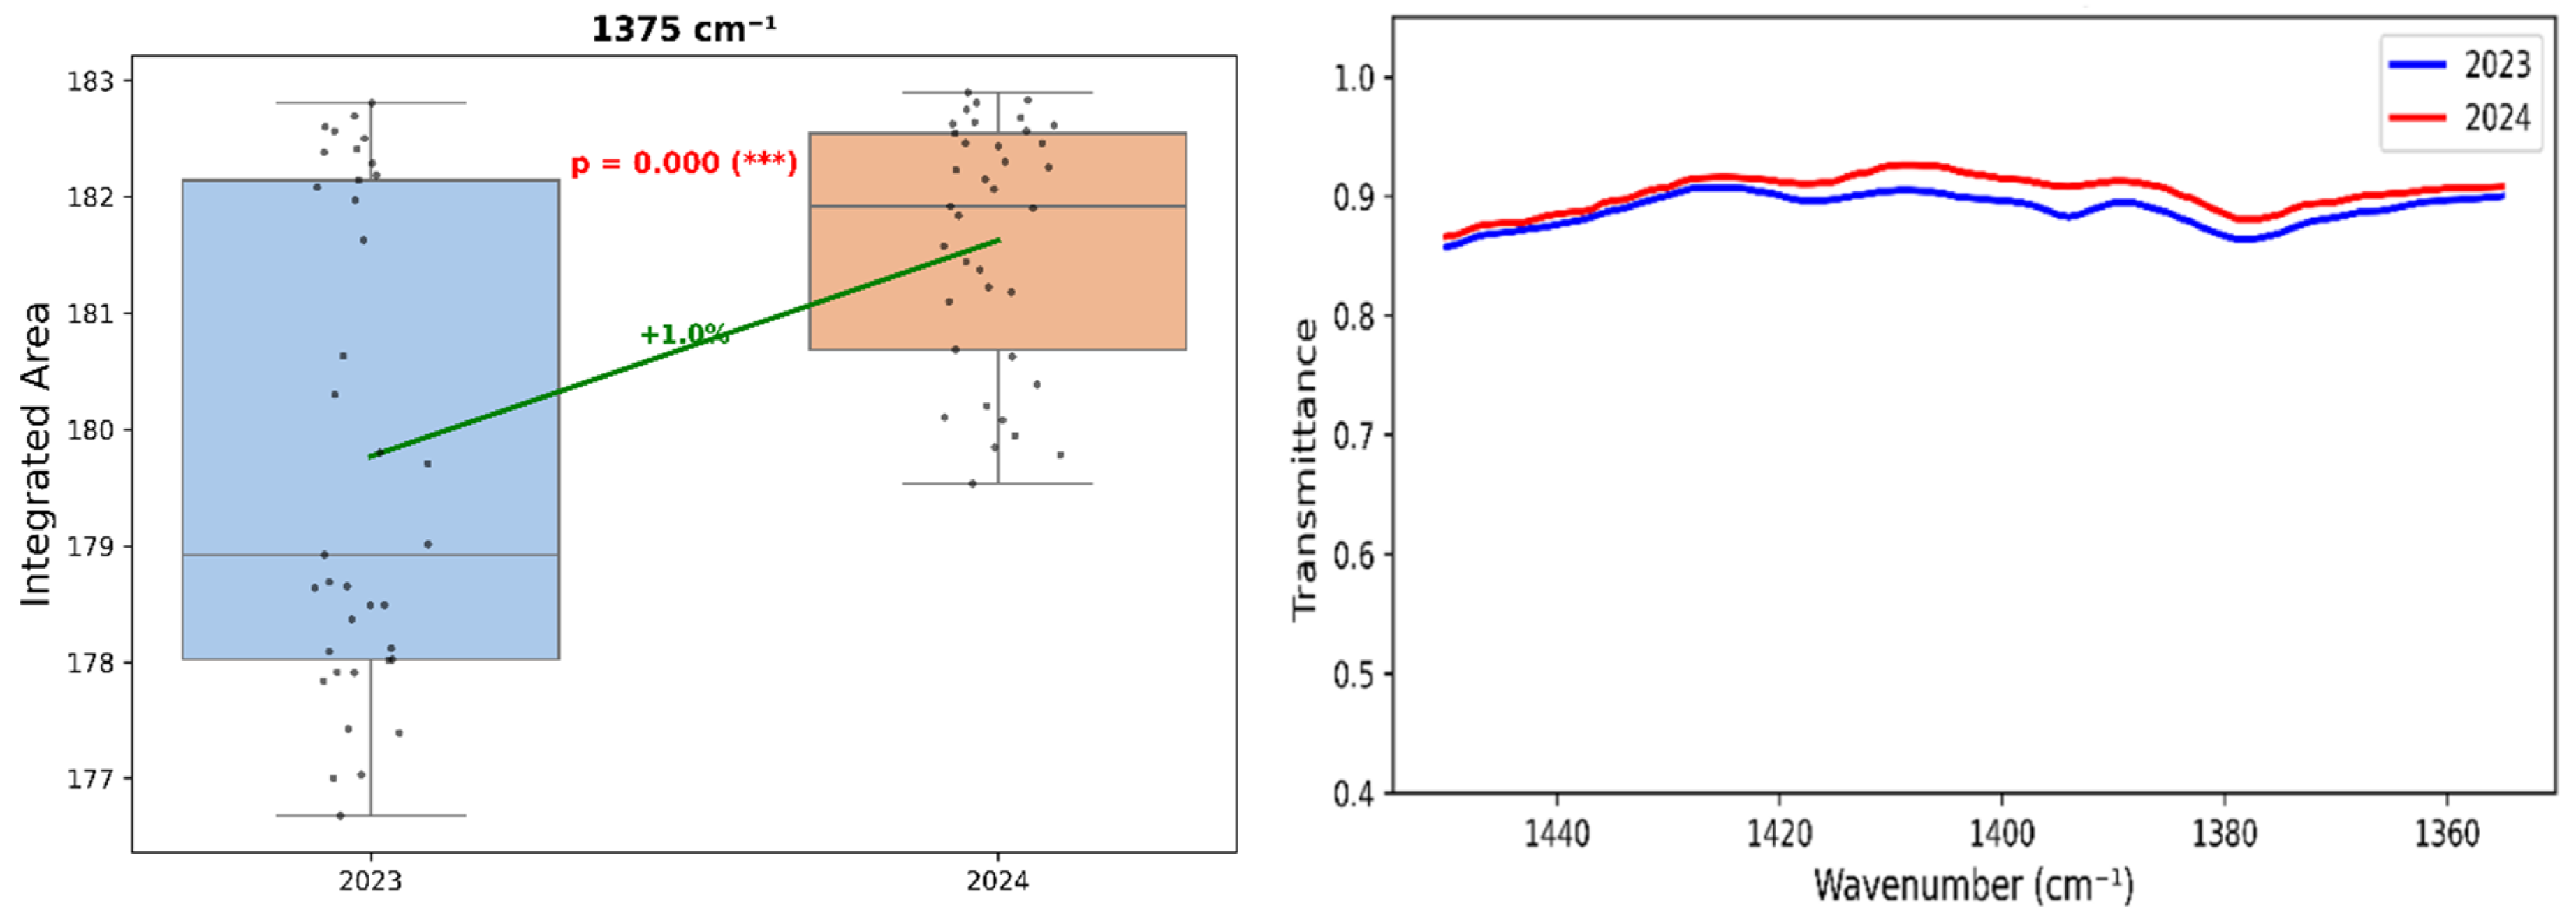
FTIR-ATR absorption area evaluation revealed subtle but significant interannual differences (Figure 7). The =C-H elongation at 3012 cm−1 showed a slight shift in 2024. Median intensity at 2928 cm−1 increased in 2024. The carbonyl peak at 1745 cm−1 displayed higher and less variable areas in 2024, with a 2–5% area increase. The bands at 1375 cm−1 and 1050 cm−1 showed higher areas in 2024.

3.5.2. Varietal Differentiation of Integrated Areas

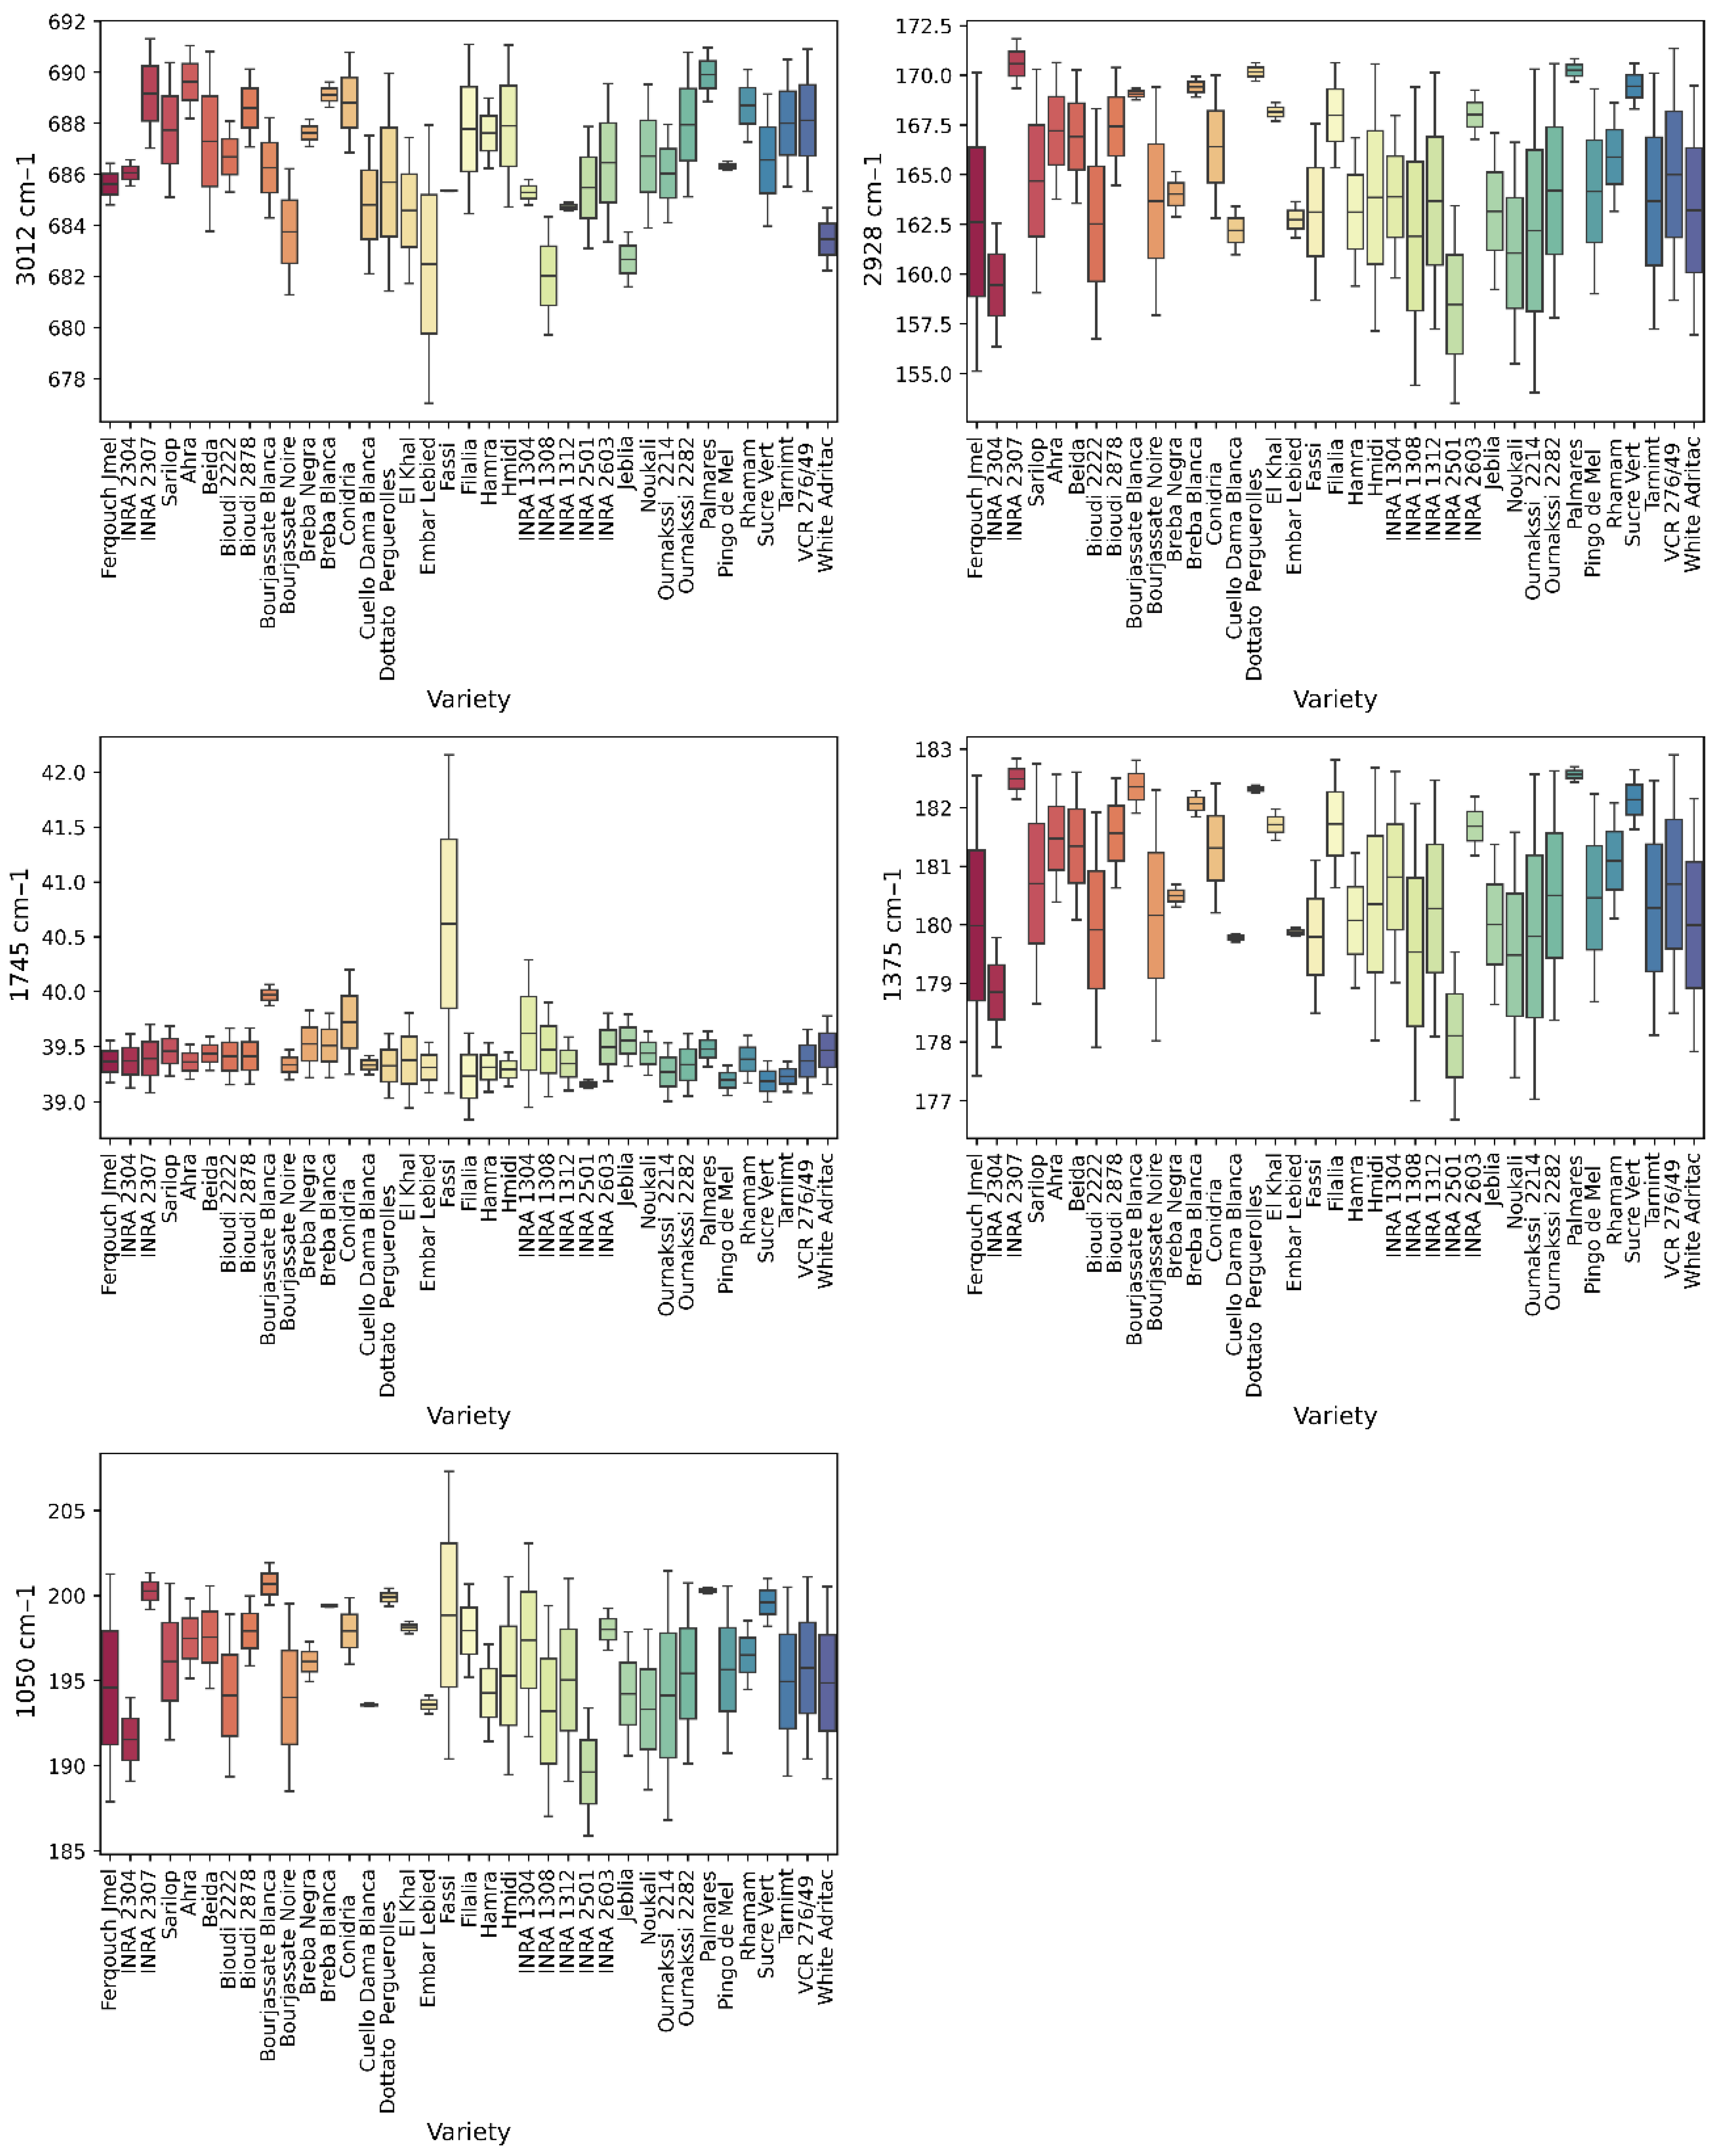
Varietal boxplots (Figure 8) reveal substantial heterogeneity. At 3012 cm−1, ‘Palmares’, ‘Ahra’, and ‘Breba Blanca’ exhibited the highest intensities, while ‘INRA 1304’, ‘Jeblia’, and ‘Embar Lebied’ showed the weakest responses. At 2928 cm−1, ‘Palmares’, ‘INRA 2307’, and ‘Dottato Perguerolles’ displayed the highest median values. At 1745 cm−1, ‘Dottato Perguerolles’ and ‘Bourjassate Blanca’ exhibited the most marked signals. The bands at 1375 and 1050 cm−1 revealed genotypic clustering, with ‘Palmares’, ‘INRA 2307’, and ‘Bourjassate Blanca’ showing high median intensities.

3.6. Multivariate Analysis of FTIR-ATR Integrated Areas

The multivariate analysis revealed significant sources of spectral variation (Table 7). All five characteristic absorption bands showed highly significant (p < 0.001) effects of year, variety, and their interaction. Interannual variability exerted a pronounced influence, particularly within the aliphatic –CH2 stretching band (2928 cm−1; F = 73,421.83) and the carbohydrate-associated band (1050 cm−1; F = 9435.603).
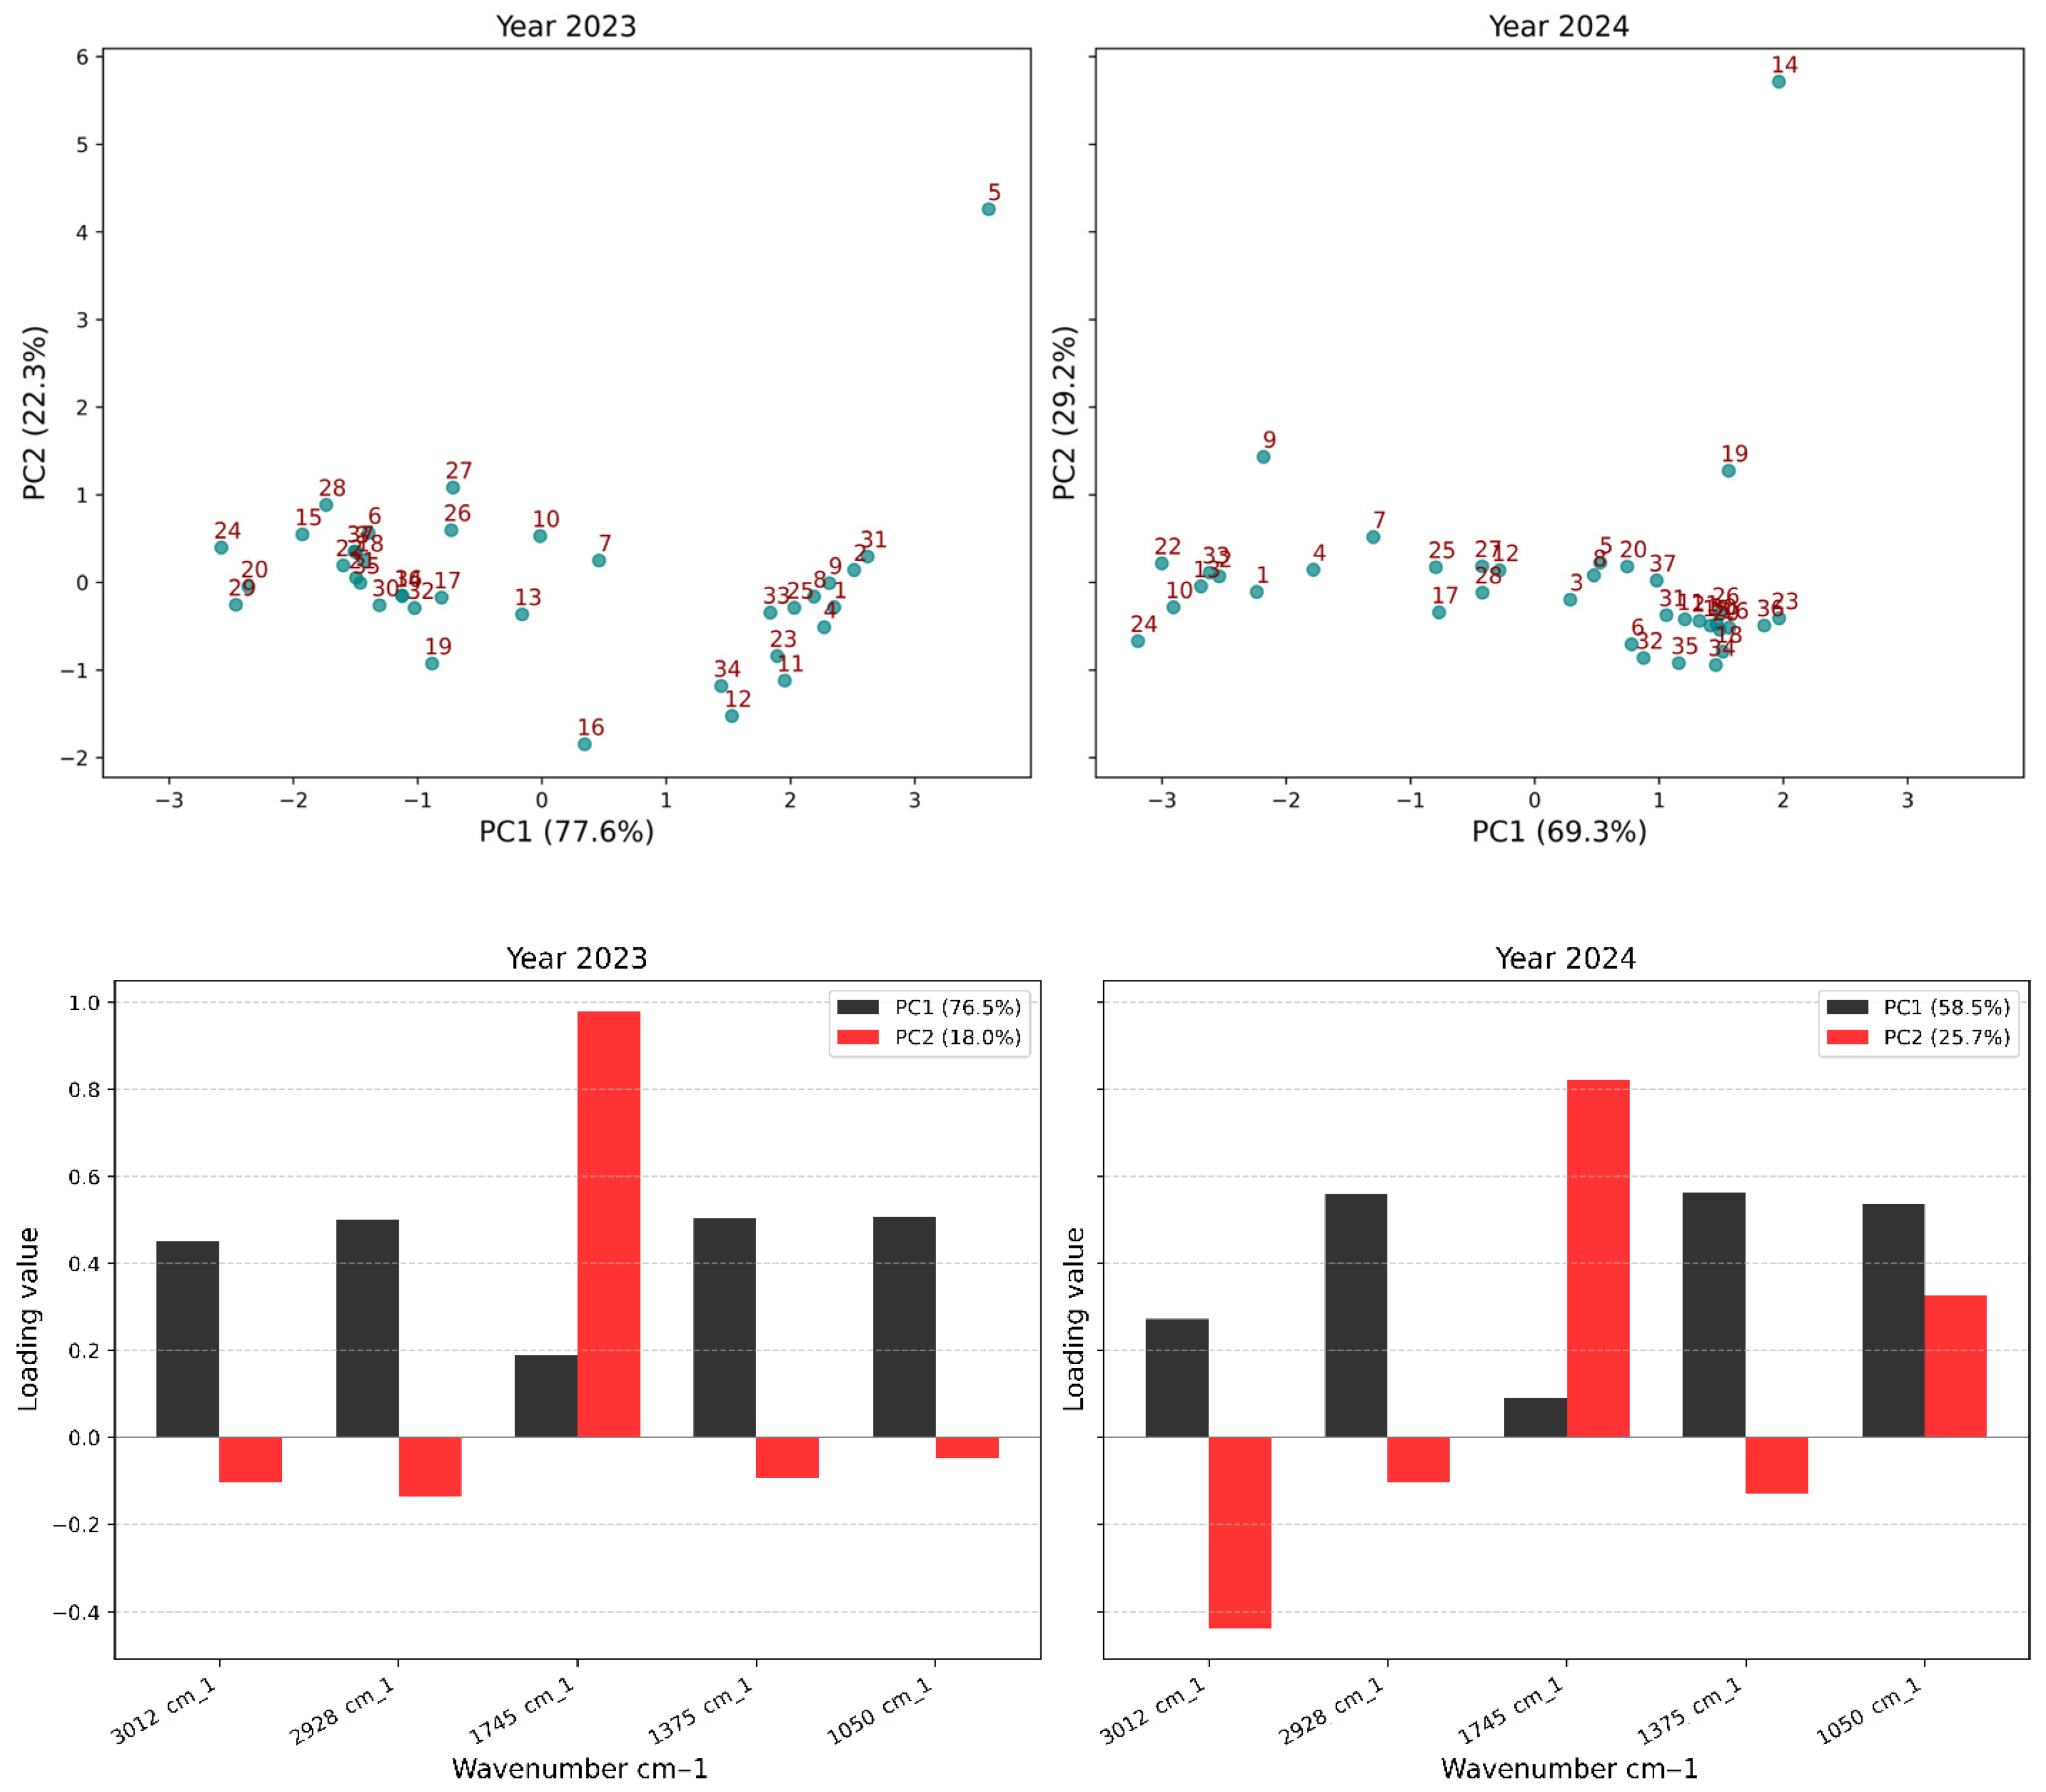
The PCA (Figure 4) provided an overview of biochemical differentiation. For 2023, PC1 and PC2 explained 77.6% and 22.3% of the variance, respectively, while in 2024, PC1 and PC2 accounted for 69.3% and 29.2%.
In 2023, PC1 was characterized by strong positive loadings for lipid, protein, and carbohydrate bands (3012, 2928, 1375, 1050 cm−1), while PC2 showed a marked positive contribution from the carbonyl band (1745 cm−1). In 2024, all spectral regions exhibited positive contributions on PC1, although the carbonyl band retained the weakest contribution. On PC2, the carbonyl band showed the highest positive contribution.
Score plots (Figure 9) revealed clear varietal groupings. In 2023, three groups were distinguished: Group I (‘INRA 2501’, ‘Ferqouch Jmel’, ‘Noukali’, ‘Sarilop’) with weaker lipid contributions; Group II (‘Breba Negra’, ‘INRA 1304’, ‘Cuello Dama Blanca’) with intermediate profiles; Group III (‘El Khal’, ‘INRA 2307’, ‘Palmares’, ‘Sucre Vert’, ‘Bioudi 2878’) with higher lipid and carbohydrate absorbances. ‘Bourjassate Blanca’ was isolated. In 2024, distribution was more compact, but three subgroups remained discernible.

4. Discussion

4.1. Seed Yield t and Oil Yield

This variability reflects significant genetic differences in seed development, consistent with prior observations on Ficus carica L. [13,19]. The 9% reduction in precipitation (270 vs. 295 mm) and temperature increase (+0.4 °C) induced water stress that limited assimilate allocation to seeds in sensitive genotypes [47]. Genotypes ‘VCR 276/49’ and ‘Bourjassate Noire’ maintained high yields across both seasons, confirming their genetic stability.
Oil content results were in line with previous data [19,48]. Genotypes exceeding 33% indicated strong predisposition to lipid biosynthesis, comparable to established oil seeds [23].
The overall 20.5% drop in 2024 reflects water stress that restricted photosynthate supply and redirected carbon allocation toward protective compounds rather than storage lipids [49,50]. The resilience of ‘Ferqouch Jmel’ and ‘Noukali’ highlights their potential for production in drought-prone Mediterranean areas.

4.2. Biochemical Characterization: Year and Varietal Effects

  • Yearly effects in biochemical composition and yield traits
The higher phenolic accumulation in 2023 likely reflects stronger activation of secondary metabolism under more favorable or moderately stressful environmental conditions, as temperature and water stress are known to stimulate phenol biosynthesis [2,51]. However, the relationship between stress and phenolic accumulation is complex and non-linear. Moderate stress generally enhances secondary metabolism through upregulation of the phenylpropanoid pathway, while severe stress can suppress biosynthetic capacity due to limited photosynthate availability [52,53]. The 2023 season, with its more balanced temperature and humidity regime, likely provided optimal conditions for phenol biosynthesis without imposing severe metabolic limitations. The wider dispersion observed in 2023 also indicates greater genetic variability in phenolic responses, suggesting that environmental conditions that year allowed fuller expression of genetic differences in secondary metabolism.
The reduced variability in 2024 suggests a more uniform metabolic response across genotypes, indicating environmental constraints that limited phenotypic expression of genetic variability. Flavonoid synthesis is tightly regulated by light exposure, UV intensity, and temperature [54,55], which may explain interannual variations. Greater solar radiation and reduced cloud cover, typically associated with drier seasons (2024), should theoretically favor flavonoid synthesis as a UV-protective response. However, the observed decrease suggests that water deficit was the predominant limiting factor, restricting carbon allocation to secondary metabolism despite potentially favorable light conditions [56].
These divergent responses between DPPH and ABTS suggest that antioxidant potential depends on compound type, with DPPH and ABTS reacting differently to hydrophilic versus lipophilic antioxidants [57,58]. The more lipophilic DPPH radical preferentially reacts with phenolic compounds soluble in organic solvents and tocopherols, while the water-soluble ABTS cation radical primarily measures hydrophilic antioxidants like phenolic acids and glycosylated flavonoids [59]. The increased DPPH activity in 2024, despite lower total phenol content, suggests a qualitative shift toward more lipophilic or structurally modified phenolic compounds with higher radical scavenging efficiency per molecule. This could reflect stress-induced structural modifications of phenols, such as increased methylation or reduced glycosylation, enhancing lipid solubility and antioxidant potency [60].
Despite the apparent increase in average seed yield, the high standard deviation and greater dispersion in 2024 indicate substantial variability, with some genotypes showing drastic reductions while others increased. This inverse relationship implies that while fruit biomass was preserved, lipid biosynthesis was less efficient under 2024 climatic conditions. Comparable observations have been reported in other oilseed species under environmental stress [49,50]. The maintenance or slight increase in seed weight coupled with reduced oil content suggests that carbon was preferentially allocated to structural carbohydrates and proteins rather than storage lipids under drought conditions, consistent with metabolic adjustments in seed filling processes where carbohydrate synthesis and protein accumulation are prioritized over lipid biosynthesis during water limitation [61].
Overall, descriptive statistics highlight strong environmental modulation of fig seed phenolic and lipid metabolism. The 2023 season favored phenol and flavonoid accumulation, while 2024 enhanced antioxidant reactivity (DPPH), a pattern often linked to compensatory metabolic adjustments in response to stress [62]. These results support our hypothesis that interannual environmental conditions induce coordinated biochemical adjustments involving metabolic trade-offs between secondary metabolism and primary lipid biosynthesis.
  • Varietal effects in biochemical composition and yield traits
High TPC in ‘Dottato Perguerolles’, ‘VCR 276/49’, ‘Rhamam’, and ‘INRA 1304’ confers enhanced oxidative stability [26]. Lower TPC in ‘Breba Negra’, ‘Bioudi 2222’, and ‘INRA 2307’ suggests a trade-off toward lipid metabolism.
Antioxidant assays highlighting unequal contributions to hydrophilic and lipophilic systems confirm findings by Prior et al. (2005) [57].
The negative relationship between phenolic synthesis and lipid biosynthesis in ‘Ferqouch Jmel’, ‘White Adriatic’, ‘Jeblia’, and ‘Conidria’ illustrates metabolic competition [63]. This metabolic competition implies that selection for maximum oil yield may reduce phenolic content and vice versa [64].
Differences in seed yield reflect variations in reproductive allocation that influence oil extraction potential [64].

4.3. Interpretation of Multivariate and Univariate Analyses of Biochemical Parameters

The high F-values confirm substantial genetic and environmental influences. The major impact of climatic fluctuations on antioxidant potential and lipid biosynthesis has been documented [65,66]. The exceptionally high F-value for DPPH suggests particular sensitivity of lipophilic antioxidants to environmental conditions [26].
The significant varietal effect demonstrates substantial genetic diversity, although lower F-values than year effects indicate overall stronger environmental influence. The Year × Genotype interaction complicates direct recommendations and underscores the need for multi-environmental evaluations [67].
The PCA results indicate reduced biochemical complexity in 2024, likely due to environmental constraints [68,69].
The trade-off between antioxidant capacity and lipid productivity in 2023, and the decoupling between antioxidant activity and phenolic concentration in 2024, indicate environmental contingency of the metabolic trade-off. This rotation demonstrates that the balance between competing metabolic pathways is not fixed but responds dynamically to environmental conditions.
These results highlight three major findings: (1) biochemical diversity is dynamically modulated by genotype and environment, (2) the negative association between antioxidants and yield confirms allocation constraints [70,71], and (3) identification of stably performing genotypes enables reliable selection for commercial contexts.
The moderate TPC-TFC correlation (r > 0.50) indicates divergent regulation at biosynthetic branch points [52]. The variable contributions of phenolic compounds to antioxidant potential are consistent with findings by Sánchez-Rangel et al. (2013) [59].
The negative correlation between oil content and TPC/TFC underscores the trade-off between secondary metabolites and lipid accumulation under stress [52]. The weak correlation between seed yield and oil content suggests that oil concentration per unit weight varies considerably across genotypes [72].
Overall, these results demonstrate that genetic and environmental variability play a determining role in biochemical quality. The 2024 season, characterized by moderate water stress, favored phenolic accumulation and antioxidant activity, while 2023 promoted lipid synthesis. These divergent responses confirm that genotype × environment interactions influence metabolic partitioning [73].

4.4. Interpretation of FTIR-ATR Spectral Features

This spectral similarity reflects the conserved biochemical composition of fig seed oils and seeds, largely dominated by lipids, phenolic derivatives, proteins, and carbohydrates, in agreement with previous reports on fig and other oil-rich seeds [74,75].
These signals reflect the presence of –CH2 and terminal –CH3 groups from saturated and unsaturated fatty acids, confirming the lipidic nature of fig oils [39,40]. The intensity ratio information on chain length distribution is supported by studies showing higher ratios associated with longer fatty acid chains [76].
This band is diagnostic for oil content and esterification degree, with its position and intensity sensitive to the degree of fatty acid saturation and oxidation state [76].
The relative intensity correlation with phenolic content (r = 0.42, p < 0.01) confirms that the fingerprint region contains meaningful information about phenolic composition. The low-frequency band, though often overlooked, contains valuable information about seed matrix composition and can aid in varietal discrimination [77].
These differences are not unexpected, since interannual variations in plant secondary metabolites and oil biosynthesis are strongly dependent on climatic and environmental conditions such as rainfall distribution, irrigation availability, and temperature stress [52,62].
From a biochemical standpoint, the enhanced absorbance in the O–H band in 2024 could reflect a higher accumulation of phenolic hydroxyl groups and water-associated hydrogen bonding, often linked to stress-induced enhancement of antioxidant defenses [43,44]. However, this spectral observation contradicts the biochemical data showing reduced TPC in 2024 (31.2 vs. 48.7 mg GAE/100 g of oil), suggesting that the increased O-H absorbance may instead reflect altered moisture content, increased glycosylation of phenolics, or changes in hydrogen bonding networks rather than absolute phenolic concentration. This discrepancy highlights the importance of integrating spectral and wet-chemical methods for comprehensive quality assessment.
Meanwhile, the more pronounced C=O ester stretching at 1745 cm−1 is indicative of increased levels of triacylglycerols and fatty acids, suggesting that lipid biosynthesis was favored under the 2024 climatic conditions, though, again, this contradicts the measured decrease in oil yield from 26.7% to 21.2%. The apparent inconsistency may reflect compositional changes, specifically, an increase in the proportion of esterified lipids relative to free fatty acids or polar lipids rather than total lipid content, possibly due to differences in temperature or water stress at seed filling [41,42]. These observations underscore that FTIR absorbance intensities reflect molecular composition and structural organization rather than simple component concentrations, necessitating multivariate calibration models to extract quantitative information [78].

4.5. Integrated Areas as Discriminatory Markers4.5.1. Yearly Differentiation of Integrated Areas

The shift at 3012 cm−1 in 2024 is consistent with stress-induced enrichment [79]. Enhanced methylene vibrations at 2928 cm−1 indicate structural adjustments. Higher carbonyl peak areas support the hypothesis of increased structural order in lipids [41], with enrichment in saturated or monounsaturated fatty acids [76].
Structural adjustments reflected in the 1375 cm−1 band and increased carbohydrate-related absorbance at 1050 cm−1 align with biochemical observations showing decreased phenols but increased DPPH reactivity [62,80]. These modifications suggest coordinated metabolic responses to environmental conditions.

Varietal Differentiation of Integrated Areas

The abundance of hydroxylated compounds in ‘Palmares’, ‘Ahra’, and ‘Breba Blanca’ has been previously reported (Hssaini et al., 2021) [81]. Greater abundance of long-chain fatty acids in ‘Palmares’, ‘INRA 2307’, and ‘Dottato Perguerolles’ reflects genotypic differences in desaturase enzyme activity [82,83].
Higher esterification efficiency in ‘Dottato Perguerolles’ and ‘Bourjassate Blanca’ is consistent with lipid metabolism differences [42]. The genotypic clustering observed in bands at 1375 and 1050 cm−1 has been noted in other studies [84].
This spectral variability underscores genetic control of macromolecular composition, supporting the hypothesis of distinct biochemical strategies underlying varietal adaptation [12,85].

4.6. Interpretation of Multivariate Analysis of FTIR-ATR Integrated Areas

These interaction effects indicate that genotypes respond differentially to environmental conditions, with some cultivars maintaining stable spectral profiles across years (e.g., ‘VCR 276/49’, ‘Condria’) while others exhibit pronounced year-dependent shifts (e.g., ‘Ferqouch Jmel’, ‘Ahra’, ‘Filalia’). This genotype-specific environmental plasticity reflects differential regulation of lipid desaturation, phenolic hydroxylation, and esterification pathways under thermal and water stress [76,81].
The PCA results demonstrate that year-dependent metabolic plasticity modulates the biochemical signature. The interannual variability governed by shifts in the balance between carbonyl compounds and carbohydrates reflects environmental adaptation strategies. Clear varietal groupings in 2023 and more compact distribution in 2024 confirm environmental homogenization while maintaining genotypic identity. These results demonstrate that lipid and carbohydrate vibrations serve as robust varietal identity markers, while the carbonyl region is a sensitive indicator of environmental modulation [78,86]. The isolation of ‘Bourjassate Blanca’ indicates an atypical composition worthy of further investigation for unique biochemical properties.

5. Conclusions

This study examined biochemical and spectral variability in seed oils from 37 fig genotypes over two harvest seasons (2023–2024) to determine whether genotype × environment interaction drives coordinated metabolic shifts detectable by FTIR-ATR spectroscopy. Results confirmed this hypothesis through multiple lines of evidence. Statistical analysis demonstrated highly significant effects (p < 0.001) of year, variety, and their interaction on all measured parameters. Total phenolic content decreased 36% between years (48.7 to 31.2 mg GAE/100 g oil), while DPPH scavenging activity increased 34% (43.7% to 58.5%), indicating a compositional shift toward lipophilic antioxidants under changing environmental conditions. Concurrently, oil yield declined from 26.7% to 21.2%, exhibiting a negative correlation with phenolic levels (r = −0.49, p < 0.001), which supports the existence of metabolic competition between lipid biosynthesis and secondary phenolic pathways. Among tested varieties, ‘Dottato Perguerolles’, ‘VCR 276/49’, and ‘Condria’ maintained consistently favorable biochemical profiles across both seasons. FTIR-ATR spectroscopy successfully captured these genotype–environment-driven variations through diagnostic absorption bands at 3012, 2928, 1745, 1375, and 1050 cm−1, with variance analysis confirming substantial spectral effects (F > 103, p < 0.001). Multivariate analysis explained 75.4–84.5% of total variance and achieved clear discrimination between genotypes and harvest years, validating the approach for rapid cultivar authentication and quality assessment. These findings establish that fig seed oil composition responds predictably to genotype–environment interactions, with FTIR-ATR providing a practical tool for quality monitoring. Future work should incorporate multi-location trials across Mediterranean environments, employ targeted metabolomics and lipidomics to identify specific bioactive compounds, and integrate molecular approaches, including transcriptomics and genome-wide association mapping, to enable marker-assisted breeding for stable, high-value fig seed oil production.

Author Contributions

Conceptualization, C.E.-d.K., L.H. (Lhoussain Hajji) and L.H. (Lahcen Hs saini); methodology, C.E.-d.K., L.H. (Lahcen Hssaini) and L.H. (Lhoussain Hajji); software, F.D., C.E.-d.K. and L.H. (Lhoussain Hajji); validation, F.D., L.H. (Lhoussain Hajji) and L.H. (Lahcen Hssaini); formal analysis, C.E.-d.K., A.I. and S.H.; investigation, F.D., C.E.-d.K., L.H. (Lhoussain Hajji), S.H., I.G., K.H. and S.B.; resources, L.H. (Lahcen Hssaini); data curation, C.E.-d.K., L.H. (Lahcen Hssaini) and S.H.; writing—original draft preparation, C.E.-d.K.; writing—review and editing, L.H. (Lahcen Hssaini) and S.H.; visualization, F.D., C.E.-d.K. and L.H. (Lhoussain Hajji); supervision, L.H. (Lahcen Hssaini); project ad ministration, L.H. (Lahcen Hssaini). All authors have read and agreed to the published version of the manuscript.

Funding

This research received no external funding.

Institutional Review Board Statement

Not applicable.

Informed Consent Statement

Not applicable.

Data Availability Statement

Data are available upon request.

Conflicts of Interest

The authors declare no conflicts of interest.

Abbreviations

The following abbreviations are used in this manuscript:
ABTS2,2′-azino-bis (3-ethylbenzothiazoline-6-sulfonic acid)
AcAbsorbance of Control
AeAbsorbance of Sample
ANOVAAnalysis of Variance
ATRAttenuated Total Reflectance
DFDegrees of Freedom
DPPH2,2-diphenyl-1-picrylhydrazyl
FRSAFree Radical Scavenging Activity
FTIRFourier-Transform Infrared
FTIR-ATRFourier-Transform Infrared–Attenuated Total Reflectance
G × EGenotype × Environment interaction
GAEGallic Acid Equivalent
HSDHonest Significant Difference
INRANational Institute of Agricultural Research
IRInfrared
MAMorocco (Maroc)
PC1Principal Component 1
PC2Principal Component 2
PCAPrincipal Component Analysis
QCEQuercetin Equivalent
R2Coefficient of Determination
StdStandard Deviation
TFCTotal Flavonoid Content
TPCTotal Phenolic Content
UKUnited Kingdom
USAUnited States of America
UV-VisUltraviolet-Visible
VVariety
Y:VYear × Variety Interaction
YYear

References

  1. Kislev, M.E.; Hartmann, A.; Bar-Yosef, O. Early domesticated fig in the Jordan Valley. Science 2006, 312, 1372–1374. [Google Scholar] [CrossRef]
  2. Hssaini, L.; Hernandez, F.; Viuda-Martos, M.; Charafi, J.; Razouk, R.; Houmanat, K.; Ouaabou, R.; Ennahli, S.; Elothmani, D.; Hmid, I.; et al. Survey of phenolic acids, flavonoids and in vitro antioxidant potency between fig peels and pulps: Chemical and chemometric approach. Molecules 2021, 26, 2574. [Google Scholar] [CrossRef]
  3. Górnaś, P.; Rudzińska, M. Seeds recovered from industry by-products of nine fruit species with a high potential utility as a source of unconventional oil for biodiesel and cosmetic and pharmaceutical sectors. Ind. Crops Prod. 2016, 83, 329–338. [Google Scholar] [CrossRef]
  4. Piombo, G.; Barouh, N.; Barea, B.; Boulanger, R.; Brat, P.; Pina, M.; Villeneuve, P. Characterization of the seed oils from kiwi (Actinidia chinensis), passion fruit (Passiflora edulis) and guava (Psidium guajava). Oléagineux Corps Gras Lipides 2006, 13, 195–199. [Google Scholar] [CrossRef]
  5. Badgujar, S.B.; Patel, V.V.; Bandivdekar, A.H.; Mahajan, R.T. Traditional uses, phytochemistry and pharmacology of Ficus carica: A review. Pharm. Biol. 2014, 52, 1487–1503. [Google Scholar] [CrossRef]
  6. Jeong, W.S.; Lachance, P.A. Phytosterols and fatty acids in fig (Ficus carica, var. Mission) fruit and tree components. J. Food Sci. 2001, 66, 278–281. [Google Scholar] [CrossRef]
  7. Del Caro, A.; Piga, A. Polyphenol composition of peel and pulp of two Italian fresh fig fruit cultivars (Ficus carica L.). Eur. Food Res. Technol. 2008, 226, 715–719. [Google Scholar] [CrossRef]
  8. Veberic, R.; Jurhar, J.; Mikulic-Petkovsek, M.; Stampar, F.; Schmitzer, V. Comparative study of primary and secondary metabolites in 11 cultivars of persimmon fruit (Diospyros kaki L.). Food Chem. 2010, 119, 477–483. [Google Scholar] [CrossRef]
  9. Schmitzer, V.; Slatnar, A.; Mikulic-Petkovsek, M.; Veberic, R.; Krska, B.; Stampar, F. Comparative study of primary and secondary metabolites in apricot (Prunus armeniaca L.) cultivars. J. Sci. Food Agric. 2011, 91, 860–866. [Google Scholar] [CrossRef] [PubMed]
  10. Kamiloglu, S.; Capanoglu, E. Investigating the in vitro bioaccessibility of polyphenols in fresh and sun-dried figs (Ficus carica L.). Int. J. Food Sci. Technol. 2013, 48, 2621–2629. [Google Scholar] [CrossRef]
  11. Debib, A.; Tir-Touili, A.; Mothana, R.A.; Meddah, B.; Sonnet, P. Phenolic content, antioxidant and antimicrobial activities of two fruit varieties of Algerian Ficus carica. J. Food Biochem. 2014, 38, 207–215. [Google Scholar] [CrossRef]
  12. Hssaini, L.; Razouk, R.; Charafi, J.; Houmanat, K.; Hanine, H. Fig seeds: Combined approach of lipochemical assessment using gas chromatography and FTIR-ATR spectroscopy using chemometrics. Vib. Spectrosc. 2021, 114, 103251. [Google Scholar] [CrossRef]
  13. Kassimi, C.E.D.; Houmanat, K.; Irchad, A.; Aboutayeb, R.; Moumen, A.B.; Fadlaoui, A.; Guirrou, I.; Diai, F.; Hajji, L.; Hssaini, L. Fig seeds as a novel oil source: Investigating lipochemodiversity through fatty acids profiling and FTIR spectral fingerprints. Plants 2025, 14, 945. [Google Scholar] [CrossRef]
  14. Dutra, L.M.; Teles, P.H.V.; de Melo, N.F.; Nagata, N.; da Silva Almeida, A.R.G. ATR-FTIR spectroscopy combined with chemometric tools for rapid distinction of Passiflora species. Rev. Bras. Plantas Med. 2023, 25, 54–62. [Google Scholar] [CrossRef]
  15. Zhang, Y.C.; Deng, J.; Lin, X.L.; Li, Y.M.; Sheng, H.X.; Xia, B.H.; Lin, L.M. Use of ATR—FTIR spectroscopy and chemometrics for the variation of active components in different harvesting periods of Lonicera japonica. Int. J. Anal. Chem. 2022, 2022, 8850914. [Google Scholar] [CrossRef] [PubMed]
  16. Venturini, F.; Sperti, M.; Michelucci, U.; Gucciardi, A.; Martos, V.M.; Deriu, M.A. Dataset of fluorescence spectra and chemical parameters of olive oils. arXiv 2023, arXiv:2301.04471. [Google Scholar] [CrossRef]
  17. Venturini, F.; Sperti, M.; Michelucci, U.; Gucciardi, A.; Martose, V.M.; Deriu, M.A. Physico-chemical properties extraction from the fluorescence spectrum with 1d-convolutional neural networks: Application to olive oil. arXiv 2022, arXiv:2203.07229. [Google Scholar] [CrossRef]
  18. Irchad, A.; Ouaabou, R.; Aboutayeb, R.; Razouk, R.; Houmanat, K.; Hssaini, L. Lipidomic profiling reveals phenotypic diversity and nutritional benefits in Ficus carica L. (fig) seed cultivars. Front. Plant Sci. 2023, 14, 1229994. [Google Scholar] [CrossRef] [PubMed]
  19. Hssaini, L.; Hanine, H.; Charafi, J.; Razouk, R.; Elantari, A.; Ennahli, S.; Ouaabou, R. First report on fatty acids composition, total phenolics and antioxidant activity in seed oil of four fig cultivars (Ficus carica L.) grown in Morocco. Oilseeds Fats Crops Lipids 2020, 27, 8. [Google Scholar] [CrossRef]
  20. Chougui, N.; Tamendjari, A.; Hamidj, W.; Hallal, S.; Barras, A.; Richard, T.; Larbat, R. Oil composition and characterisation of phenolic compounds of Opuntia ficus-indica seeds. Food Chem. 2013, 139, 796–803. [Google Scholar] [CrossRef]
  21. Al-Naqeb, G.; Fiori, L.; Ciolli, M.; Aprea, E. Prickly Pear Seed Oil Extraction, Chemical Characterization and Potential Health Benefits. Molecules 2021, 26, 5018. [Google Scholar] [CrossRef]
  22. Hssaini, L. Fig seeds: Source of value-added oil within the scope of circular economy. In Fig (Ficus carica): Production, Processing, and Properties; Springer International Publishing: Cham, Switzerland, 2023; pp. 321–337. [Google Scholar] [CrossRef]
  23. Sellem, F.; Pesando, D.; Bodennec, G.; Girard, J.-P.; Simopoulos, A.P. An increase in the omega-6/omega-3 fatty acid ratio increases the risk for obesity. Nutrients 2016, 8, 128. [Google Scholar] [CrossRef] [PubMed]
  24. Saini, R.K.; Keum, Y.S. Omega-3 and omega-6 polyunsaturated fatty acids: Dietary sources, metabolism, and significance—A review. Life Sci. 2018, 203, 255–267. [Google Scholar] [CrossRef] [PubMed]
  25. Guvenc, M. Analysis of fatty acid and some lipophilic vitamins found in the fruits of the Ficus carica variety picked from the Adiyaman District. Res. J. Biol. Sci. 2009, 4, 320–323. [Google Scholar]
  26. Baygeldi, N.; Kucukerdonmez, O.; Akder, R.N.; Cagindi, O. Medicinal and nutritional analysis of fig (Ficus carica) seed oil: A new gamma-tocopherol and omega-3 source. Prog. Nutr. 2021, 23, e2021210. [Google Scholar] [CrossRef]
  27. Shin, E.C.; Huang, Y.Z.; Pegg, R.B.; Phillips, R.D.; Eitenmiller, R.R. Commercial runner peanut cultivars in the United States: Tocopherol composition. J. Agric. Food Chem. 2009, 57, 10289–10295. [Google Scholar] [CrossRef]
  28. Kalinowska, M.; Płońska, A.; Trusiak, M.; Gołębiewska, E.; Gorlewska-Pietluszenko, A. Comparing the extraction methods, chemical composition, phenolic contents and antioxidant activity of edible oils from Cannabis sativa and Silybum marianu seeds. Sci. Rep. 2022, 12, 20609. [Google Scholar] [CrossRef]
  29. Bendini, A.; Cerretani, L.; Carrasco-Pancorbo, A.; Gómez-Caravaca, A.M.; Segura-Carretero, A.; Fernández-Gutiérrez, A.; Lercker, G.; Simal-Gandara, J. Phenolic molecules in virgin olive oils: A survey of their sensory properties, health effects, antioxidant activity and analytical methods. An overview of the last decade. Molecules 2007, 12, 1679–1719. [Google Scholar] [CrossRef]
  30. Servili, M.; Sordini, B.; Esposto, S.; Urbani, S.; Veneziani, G.; Maio, I.D.; Selvaggini, R.; Taticchi, A. Biological activities of phenolic compounds of extra virgin olive oil. Antioxidants 2013, 3, 1–23. [Google Scholar] [CrossRef]
  31. Tsimidou, M.; Papadopoulos, G.; Boskou, D. Determination of phenolic compounds in virgin olive oil by reversed-phase HPLC with emphasis on UV detection. Food Chem. 1992, 44, 53–60. [Google Scholar] [CrossRef]
  32. Favati, F.; Caporale, G.; Bertuccioli, M. Rapid determination of phenol content in extra virgin olive oil. Grasas Aceites 1994, 45, 68–70. [Google Scholar] [CrossRef]
  33. Singleton, V.L.; Orthofer, R.; Lamuela-Raventós, R.M. Analysis of total phenols and other oxidation substrates and antioxidants by means of Folin–Ciocalteu reagent. In Methods in Enzymology; Elsevier: Amsterdam, The Netherlands, 1999; Volume 299, pp. 152–178. [Google Scholar] [CrossRef]
  34. Brand-Williams, W.; Cuvelier, M.E.; Berset, C. Use of a free radical method to evaluate antioxidant activity. LWT Food Sci. Technol. 1995, 28, 25–30. [Google Scholar] [CrossRef]
  35. Re, R.; Pellegrini, N.; Proteggente, A.; Pannala, A.; Yang, M.; Rice-Evans, C. Antioxidant activity applying an improved ABTS radical cation decolorization assay. Free Radic. Biol. Med. 1999, 26, 1231–1237. [Google Scholar] [CrossRef]
  36. Lu, S.; Luo, Y.; Turner, E.; Feng, H. Efficacy of sodium chlorite as an inhibitor of enzymatic browning in apple slices. Food Chem. 2007, 104, 824–829. [Google Scholar] [CrossRef]
  37. De Nardo, T.; Shiroma-Kian, C.; Halim, Y.; Francis, D.; Rodriguez-Saona, L.E. Rapid and simultaneous determination of lycopene and β-carotene contents in tomato juice by infrared spectroscopy. J. Agric. Food Chem. 2009, 57, 1105–1112. [Google Scholar] [CrossRef]
  38. Bouafif, H.; Koubaa, A.; Perré, P.; Cloutier, A.; Riedl, B. Analysis of among-species variability in wood fiber surface using DRIFTS and XPS: Effects on esterification efficiency. J. Wood Chem. Technol. 2008, 28, 296–315. [Google Scholar] [CrossRef]
  39. Niu, S.; Zhou, Y.; Yu, H.; Lu, C.; Han, K. Investigation on thermal degradation properties of oleic acid and its methyl and ethyl esters through TG–FTIR. Energy Convers. Manag. 2017, 149, 495–504. [Google Scholar] [CrossRef]
  40. Tulukcu, E.; Cebi, N.; Sagdic, O. Chemical fingerprinting of seeds of some Salvia species in Turkey by using GC–MS and FTIR. Foods 2019, 8, 118. [Google Scholar] [CrossRef]
  41. Vlachos, N.; Skopelitis, Y.; Psaroudaki, M.; Konstantinidou, V.; Chatzilazarou, A.; Tegou, E. Applications of Fourier transform-infrared spectroscopy to edible oils. Anal. Chim. Acta 2006, 573, 459–465. [Google Scholar] [CrossRef]
  42. De la Mata, P.; Domínguez-Vidal, A.; Bosque-Sendra, J.M.; Ruiz-Medina, A.; Cuadros-Rodríguez, L.; Ayora-Cañada, M.J. Olive oil assessment in edible oil blends by means of ATR-FTIR and chemometrics. Food Control 2012, 23, 449–455. [Google Scholar] [CrossRef]
  43. Schwanninger, M.; Rodrigues, J.C.; Pereira, H.; Hinterstoisser, B. Effects of short-time vibratory ball milling on the FTIR spectra of wood and cellulose. Vib. Spectrosc. 2004, 36, 23–40. [Google Scholar] [CrossRef]
  44. Bölek, S. Effects of waste fig seed powder on quality as an innovative ingredient in biscuit formulation. J. Food Sci. 2020, 86, 55–60. [Google Scholar] [CrossRef]
  45. Eker, T.; Öz, A.T. Sugar composition and biochemical properties of fig seed obtained from Abbas variety. Çukurova Tarım Gıda Bilim. Derg. 2025, 40, 200–208. [Google Scholar] [CrossRef]
  46. Scarsini, M.; Thurotte, A.; Veidl, B.; Amiard, F.; Niepceron, F.; Badawi, M.; Lagarde, F.; Schoefs, B.; Marchand, J. Metabolite quantification by Fourier transform infrared spectroscopy in diatoms: Proof of concept on Phaeodactylum tricornutum. Front. Plant Sci. 2021, 12, 756421. [Google Scholar] [CrossRef]
  47. Oliveira, C.E.S.; Zoz, T.; Jalal, A.; Seron, C.C.; Rando, F.S.; Vendruscolo, E.P. Salt stress affects nutrient uptake, fruit yield and fruit quality of tomato genotypes. SSRN Electron. J. 2017; preprint. [Google Scholar] [CrossRef]
  48. Ustun-Argon, Z.; Sari, Z.; Gokyer, A.; Buyukhelvacigil-Ozturk, S. Phytochemical evaluation of Ficus carica seeds and their cold-pressed oil. Appetite 2021, 161, 105134. [Google Scholar] [CrossRef]
  49. Zemour, K.; Adda, A.; Labdelli, A.; Dellal, A.; Cerny, M.; Merah, O. Effects of genotype and climatic conditions on the oil content and its fatty acids composition of Carthamus tinctorius L. seeds. Agronomy 2021, 11, 2048. [Google Scholar] [CrossRef]
  50. Khan, A.A.; Wang, Y.F.; Akbar, R.; Alhoqail, W.A. Mechanistic insights and future perspectives of drought stress management in staple crops. Front. Plant Sci. 2025, 16, 1547452. [Google Scholar] [CrossRef] [PubMed]
  51. Nunes, A.R.; Alves, M.G.; Oliveira, P.F.; Silva, L.R.; Silva, B.M. Bioactive Compounds and Health-Promoting Properties of Ficus carica (L.): A Review. In Natural Bioactive Compounds from Fruits and Vegetables as Health Promoters: Part I; Bentham Science Publishers Ltd.: Sharjah, United Arab Emirates, 2016; pp. 3–28. [Google Scholar] [CrossRef]
  52. Cheynier, V.; Comte, G.; Davies, K.M.; Lattanzio, V.; Martens, S. Plant phenolics: Recent advances on their biosynthesis, genetics, and ecophysiology. Plant Physiol. Biochem. 2013, 72, 1–20. [Google Scholar] [CrossRef] [PubMed]
  53. Sun, Y.; Alseekh, S.; Fernie, A.R. Plant secondary metabolic responses to global climate change: A meta-analysis in medicinal and aromatic plants. Glob. Change Biol. 2023, 29, 477–504. [Google Scholar] [CrossRef]
  54. Solomon, A.; Golubowicz, S.; Yablowicz, Z.; Grossman, S.; Bergman, M.; Gottlieb, H.E.; Altman, A.; Kerem, Z.; Flaishman, M.A. Antioxidant activities and anthocyanin content of fresh fruits of common fig (Ficus carica L.). J. Agric. Food Chem. 2006, 54, 7717–7723. [Google Scholar] [CrossRef]
  55. Nakilcioğlu, E.; Hıșıl, Y. Research on the phenolic compounds in Sarılop (Ficus carica L.) fig variety. GIDA—J. Food 2013, 38, 267–274. [Google Scholar]
  56. González-Mendoza, D.; Troncoso-Rojas, R.; Gonzalez-Soto, T.; Grimaldo-Juarez, O.; Cecena-Duran, C.; Duran-Hernandez, D.; Gutierrez-Miceli, F. Changes in phenylalanine ammonia-lyase activity, total phenolic compounds, and flavonoids in Prosopis glandulosa treated with cadmium and copper. An. Acad. Bras. Cienc. 2018, 90, 1465–1472. [Google Scholar] [CrossRef]
  57. Prior, R.L.; Wu, X.; Schaich, K. Standardized methods for the determination of antioxidant capacity and phenolics in foods and dietary supplements. J. Agric. Food Chem. 2005, 53, 4290–4302. [Google Scholar] [CrossRef] [PubMed]
  58. Mukhtar Dirir, A. Phytochemical Screening, Elemental Composition and In Vitro Antioxidant Assessment of Selected UAE Medicinal Plants. Master’s Thesis, United Arab Emirates University, Al Ain, United Arab Emirates, 2018. Available online: https://scholarworks.uaeu.ac.ae/bio_theses/30 (accessed on 1 January 2026).
  59. Sánchez-Rangel, J.C.; Benavides, J.; Heredia, J.B.; Cisneros-Zevallos, L.; Jacobo-Velázquez, D.A. The Folin–Ciocalteu assay revisited: Improvement of its specificity for total phenolic content determination. Anal. Methods 2013, 5, 5990–5999. [Google Scholar] [CrossRef]
  60. Rocchetti, G.; Gregorio, R.P.; Lorenzo, J.M.; Barba, F.J.; Oliveira, P.G.; Prieto, M.A.; Simal-Gandara, J.; Mosele, J.I.; Motilva, M.; Tomas, M.; et al. Functional implications of bound phenolic compounds and phenolics–food interaction: A review. Compr. Rev. Food Sci. Food Saf. 2022, 21, 811–842. [Google Scholar] [CrossRef]
  61. Awasthi, R.; Bhandari, K.; Nayyar, H. Temperature stress and redox homeostasis in agricultural crops. Front. Environ. Sci. 2015, 3, 11. [Google Scholar] [CrossRef]
  62. Siano, F.; Straccia, M.C.; Paolucci, M.; Fasulo, G.; Boscaino, F.; Volpe, M.G. Physico-chemical properties and fatty acid composition of pomegranate, cherry and pumpkin seed oils. J. Sci. Food Agric. 2016, 96, 1730–1735. [Google Scholar] [CrossRef] [PubMed]
  63. El Riachy, M.; Hamade, A.; Ayoub, R.; Dandachi, F.; Chalak, L. Oil content, fatty acid and phenolic profiles of some olive varieties growing in Lebanon. Front. Nutr. 2019, 6, 458819. [Google Scholar] [CrossRef] [PubMed]
  64. Saroj, R.; Soumya, S.L.; Singh, S.; Sankar, S.M.; Chaudhary, R.; Yashpal; Saini, N.; Vasudev, S.; Yadava, D.K. Unraveling the relationship between seed yield and yield-related traits in a diversity panel of Brassica juncea using multi-traits mixed model. Front. Plant Sci. 2021, 12, 651936. [Google Scholar] [CrossRef]
  65. Bajoub, A. Virgin Olive Oil: Potential of Different Omics Approaches to Authenticate Its Geographical and Botanical Origin. Doctoral Dissertation, Universidad de Granada, Granada, Spain, 2016. Available online: http://hdl.handle.net/10481/43905 (accessed on 1 January 2026).
  66. Bortoluzzi, L.; Casal, S.; Cruz, R.; Peres, A.M.; Baptista, P.; Rodrigues, N. Influence of interannual climate conditions on the composition of olive oil from centenarian olive trees. Agronomy 2023, 13, 2884. [Google Scholar] [CrossRef]
  67. Çalışkan, O.; Polat, A.A. Effects of genotype and harvest year on phytochemical and fruit quality properties of Turkish fig (Ficus carica L.) genotypes. Span. J. Agric. Res. 2021, 19, e0705. [Google Scholar] [CrossRef]
  68. Bouayed, J.; Bohn, T. Exogenous antioxidants—Double-edged swords in cellular redox state: Health beneficial effects at physiologic doses versus deleterious effects at high doses. Oxidative Med. Cell. Longev. 2010, 3, 228–237. [Google Scholar] [CrossRef]
  69. Mditshwa, A.; Magwaza, L.S.; Tesfay, S.Z.; Opara, U.L. Postharvest factors affecting vitamin C content of citrus fruits: A review. Sci. Hortic. 2017, 218, 95–104. [Google Scholar] [CrossRef]
  70. Aradhya, M.K.; Stover, E.D.; Velasco, D.; Koehmstedt, A. Genetic structure and differentiation in cultivated fig (Ficus carica L.). Genetica 2010, 138, 681–694. [Google Scholar] [CrossRef]
  71. Milošević, T.; Milošević, N.; Miletić, N.; Ercişli, S. Genetic diversity of fig accessions under atypical climatic conditions assessed by fruit quality and antioxidant activity. S. Afr. J. Bot. 2022, 151, 214–223. [Google Scholar] [CrossRef]
  72. Duman, E.; Şimşek, M.; Özcan, M.M. Monitoring of composition and antimicrobial activity of fig (Ficus carica L.) fruit and seed oil. J. Agroaliment. Process. Technol. 2018, 24, 75–80. Available online: https://api.semanticscholar.org/CorpusID:218529661 (accessed on 3 January 2026).
  73. Ahlawat, Y.K.; Singh, M.; Manorama, K.; Lakra, N.; Zaid, A.; Zulfiqar, F. Plant phenolics: Neglected secondary metabolites in plant stress tolerance. Braz. J. Bot. 2024, 47, 703–721. [Google Scholar] [CrossRef]
  74. Hssaini, L.; Razouk, R.; Bouslihim, Y. Rapid prediction of fig phenolic acids and flavonoids using mid-infrared spectroscopy combined with partial least square regression. Front. Plant Sci. 2022, 13, 782159. [Google Scholar] [CrossRef] [PubMed]
  75. Tulukcu, E.; Yalcin, H.; Ozturk, I.; Sagdic, O. Changes in the fatty acid compositions and bioactivities of clary sage seeds depending on harvest year. Ind. Crops Prod. 2012, 39, 69–73. [Google Scholar] [CrossRef]
  76. Guillén, M.D.; Cabo, N. Infrared spectroscopy in the study of edible oils and fats. J. Sci. Food Agric. 1997, 75, 1–11. [Google Scholar] [CrossRef]
  77. Kolašinac, S.M.; Mladenović, M.; Pećinar, I.; Šoštarić, I.; Nedović, V.; Miladinović, V.; Dajić Stevanović, Z.P. Raman and FTIR spectroscopy coupled with machine learning for the discrimination of different vegetable crop seed varieties. Plants 2025, 14, 1304. [Google Scholar] [CrossRef] [PubMed]
  78. Uncu, O.; Ozen, B. Geographical differentiation of a monovarietal olive oil using various chemical parameters and mid-infrared spectroscopy. Anal. Methods 2016, 8, 4872–4880. [Google Scholar] [CrossRef][Green Version]
  79. Leskovjan, A.C.; Kretlow, A.; Miller, L.M. Fourier transform infrared imaging showing reduced unsaturated lipid content in the hippocampus of a mouse model of Alzheimer’s disease. Anal. Chem. 2010, 82, 2711–2716. [Google Scholar] [CrossRef]
  80. Song, Y.; John Martin, J.J.; Liu, X.; Li, X.; Hou, M.; Zhang, R.; Xu, W.; Li, W.; Cao, H. Unraveling the response of secondary metabolites to cold tolerance in oil palm by integration of physiology and metabolomic analyses. BMC Plant Biol. 2025, 25, 279. [Google Scholar] [CrossRef]
  81. Hssaini, L.; Elfazazi, K.; Razouk, R.; Ouaabou, R.; Hernandez, F.; Hanine, H.; Charafi, J.; Houmanat, K.; Aboutayeb, R. Combined effect of cultivar and peel chromaticity on figs’ primary and secondary metabolites: Preliminary study using biochemical and FTIR fingerprinting coupled to chemometrics. Biology 2021, 10, 573. [Google Scholar] [CrossRef]
  82. Calder, P.C. Marine omega-3 fatty acids and inflammatory processes: Effects, mechanisms and clinical relevance. Biochim. Biophys. Acta (BBA)—Mol. Cell Biol. Lipids 2015, 1851, 469–484. [Google Scholar] [CrossRef]
  83. Ordoudi, S.A.; Strani, L.; Cocchi, M. Toward the non-targeted detection of adulterated virgin olive oil with edible oils via FTIR spectroscopy & chemometrics: Research methodology trends, gaps and future perspectives. Molecules 2023, 28, 337. [Google Scholar] [CrossRef]
  84. Gierlinger, N.; Keplinger, T.; Harrington, M. Imaging of plant cell walls by confocal Raman microscopy. Nat. Protoc. 2012, 7, 1694–1708. [Google Scholar] [CrossRef] [PubMed]
  85. Launay, M.; Bancal, M.O.; Colbach, N.; Pincebourde, S.; Vidal, T. Santé des plantes et changement climatique. In Agriculture et Changement Climatique: Impacts, Adaptation et Atténuation; Éditions Quae: Versailles Cedex, France, 2025; p. 187. [Google Scholar] [CrossRef]
  86. Kiefer, J.; Lampe, A.I.; Nicoli, S.F.; Lucarini, M.; Durazzo, A. Identification of passion fruit oil adulteration by chemometric analysis of FTIR spectra. Molecules 2019, 24, 3219. [Google Scholar] [CrossRef]
Figure 1. Comparison of monthly precipitation (mm) and temperature (°C) between 2023 and 2024.
Metabolites 16 00127 g001
Figure 2. Yearly variation in biochemical and agronomic parameters of fig seed oil samples (2023 vs. 2024). Boxplots illustrate the distribution of biochemical and agronomic parameters, with boxes representing the interquartile range and the median indicated by the central line. Circles represent individual data points. Dashed lines indicate relative increases (green) or decreases (red) and p-values from paired t-tests (* p ≤ 0.05; ** p ≤ 0.01).
Metabolites 16 00127 g002
Figure 3. Distribution of biochemical and agronomic parameters across fig varieties, revealing genotype-driven differences. Boxes representing the interquartile range and the median indicated by the central line. Circles represent individual data points. Each variety is represented by a different color.
Metabolites 16 00127 g003
Figure 4. PCA illustrating the relationships between biochemical and yield parameters across 37 fig varieties for the 2023 and 2024 harvest years. Points in the score plot correspond to sample numerical codes listed in Table 2.
Metabolites 16 00127 g004
Figure 5. Combined heatmap of correlations between biochemical and yield traits for the 2023 and 2024 seasons. Correlations for the 2024 season are shown in the upper triangle, while correlations for the 2023 season are in the lower triangle.
Metabolites 16 00127 g005
Figure 6. Average FTIR-ATR spectra of fig oils from 37 genotypes across two years, 2023 and 2024, showing characteristic absorption bands. Spectra represent mean absorbance values (n = 37 per year). Major functional group peaks are highlighted and labeled according to Table 6.
Metabolites 16 00127 g006
Figure 7. Overall effect of crop year (2023 vs. 2024) on main FTIR bands. (Left) boxplots of integrated band areas, boxes representing the interquartile range and the median indicated by the central line. Circles represent individual data points. Solid lines indicate relative increases (green) or decreases (red) and p-values from paired t-tests (*** p ≤ 0.001; ns = not significant). (Right) mean FTIR spectra per year (2023 blue, 2024 red) showing spectral peaks used for integration.
Metabolites 16 00127 g007aMetabolites 16 00127 g007b
Figure 8. Distribution of integrated FTIR–ATR band areas across fig varieties, revealing genotype-driven differences. Each variety is represented by a different color.
Metabolites 16 00127 g008
Figure 9. Multivariate differentiation of fig oils from 37 varieties based on FTIR spectral areas for 2023 and 2024 as revealed by PCA plots. Points in the score plot correspond to sample numerical codes listed in Table 2.
Metabolites 16 00127 g009
Table 1. List of exotic and local genotypes of fig trees (Ficus carica L.) used in this study.
Local GenotypesExotic Varieties
INRA 2307White Adriatic
FassiVCR 276/49
Ournakssi 2214Sarilop
FilaliaPalmares
INRA 1308Bourjassate Noire
Bioudi 2222Breba Blanca
El KhalBourjassate Blanca
JebliaBreba Negra
NoukaliConidria
INRA 1304Cuello Dama Blanca
HamraRhamam
INRA 2603Dottato Perguerolles
Bioudi 2878Sucre Vert
AhraPingo de Mel
INRA 2501
Beida
Embar Lebied
INRA 2304
Hmidi
Ferqouch Jmel
Ournakssi 2282
INRA 1312
Tarnimt
Table 2. Numerical coding of thirty-seven fig (Ficus carica L.) varieties used in biochemical and FTIR-ATR analyses.
1: Ahra20: INRA 1308
2: Beida21: INRA 1312
3: Bioudi 222222: INRA 2304
4: Bioudi 287823: INRA 2307
5: Bourjassate Blanca24: INRA 2501
6: Bourjassate Noire25: INRA 2603
7: Breba Negra26: Sarilop
8: Breba Blanca27: Jeblia
9: Conidria28: Noukali
10: Cuello Dama Blanca29: Ournakssi 2214
11: Dottato Perguerolles30: Ournakssi 2282
12: El Khal31: Palmares
13: Embar Lebied32: Pingo de Mel
14: Fassi33: Rhamam
15: Ferqouch Jmel34: Sucre Vert
16: Filalia35: Tarnimt
17: Hamra36: VCR 276/49
18: Hmidi37: White Adriatic
19: INRA 1304
Table 3. Seeds yield (g/fruit) and oil content (%) of studied thirty-seven genotypes between the 2023 and 2024 harvests. (mean ± standard deviation) values of three repetitions.
YearVarietySeeds Yield (g/Fruit)Oil Yield (%)
2023INRA 26032.239 ± 0.04331.8 ± 1.06
Ferqouch Jmel1.68 ± 0.0430.84 ± 0.92
INRA 23042.154 ± 0.05134.41 ± 1.0
INRA 23071.492 ± 0.07221.77 ± 0.75
Sarilop2.701 ± 0.13532.83 ± 0.82
Ahra3.108 ± 0.05228.51 ± 0.85
Beida0.733 ± 0.05127.25 ± 0.65
Bioudi 22223.133 ± 0.06528.51 ± 0.87
Bioudi 28783.089 ± 0.02134.56 ± 0.95
Bourjassate Blanca1.166 ± 0.04716.42 ± 0.95
Bourjassate Noire3.608 ± 0.129.45 ± 0.78
Breba Negra2.169 ± 0.02912.67 ± 0.83
Breba Blanca2.424 ± 0.09519.61 ± 1.22
Conidria1.459 ± 0.03813.55 ± 0.93
Cuello Dama Blanca1.562 ± 0.04512.67 ± 1.21
Dottato Perguerolles1.523 ± 0.07330.32 ± 0.88
El Khal2.062 ± 0.03524.5 ± 0.88
Embar Lebied1.841 ± 0.04131.53 ± 1.13
Fassi1.747 ± 0.07828.03 ± 0.83
Filalia1.89 ± 0.04121.77 ± 0.89
Hamra1.964 ± 0.03934.43 ± 1.02
Hmidi2.848 ± 0.05929.44 ± 0.77
INRA 13041.468 ± 0.02532.52 ± 0.87
INRA 13082.152 ± 0.09930.8 ± 0.95
INRA 13122.599 ± 0.00129.52 ± 1.12
INRA 25012.24 ± 0.0727.38 ± 0.92
Jeblia1.023 ± 0.01910.55 ± 0.75
Noukali1.559 ± 0.06127.51 ± 1.06
Ournakssi 22141.553 ± 0.06826.53 ± 0.78
Ournakssi 22821.875 ± 0.08727.56 ± 0.81
Palmares3.001 ± 0.10127.44 ± 1.09
Pingo de Mel1.47 ± 0.04526.63 ± 1.05
Rhamam2.882 ± 0.0417.53 ± 1.1
Sucre Vert1.771 ± 0.07135.56 ± 1.16
Tarnimt2.137 ± 0.06427.53 ± 0.95
VCR 276/491.585 ± 0.04330.62 ± 1.11
White Adriatic1.666 ± 0.08934.53 ± 1.08
2024INRA 26034.16 ± 0.09621.87 ± 1.44
Ferqouch Jmel1.323 ± 0.05537.82 ± 0.43
INRA 23042.84 ± 0.0726.53 ± 0.23
INRA 23071.405 ± 0.04923.97 ± 0.18
Sarilop4.293 ± 0.1049.58 ± 1.26
Ahra1.767 ± 0.0926.09 ± 1.04
Beida1.713 ± 0.1112.06 ± 0.22
Bioudi 22222.527 ± 0.07425.7 ± 0.27
Bioudi 28782.227 ± 0.0727.3 ± 0.68
Bourjassate Blanca1.643 ± 0.07610.78 ± 0.27
Bourjassate Noire5.053 ± 0.0725.7 ± 1.1
Breba Negra1.373 ± 0.05524.22 ± 0.35
Breba Blanca1.84 ± 0.0613.75 ± 0.73
Conidria1.813 ± 0.11112.23 ± 0.31
Cuello Dama Blanca2.847 ± 0.0724.1 ± 0.91
Dottato Perguerolles0.717 ± 0.067.81 ± 0.21
El Khal1.96 ± 0.10521.05 ± 1.43
Embar Lebied2.063 ± 0.13121.55 ± 0.38
Fassi1.403 ± 0.07127.85 ± 1.69
Filalia2.213 ± 0.08527.74 ± 0.19
Hamra2.027 ± 0.0819.0 ± 0.96
Hmidi1.68 ± 0.10519.36 ± 3.0
INRA 13040.387 ± 0.0556.31 ± 0.69
INRA 13081.64 ± 0.0817.6 ± 0.25
INRA 13123.855 ± 0.10616.54 ± 0.79
INRA 25013.06 ± 0.11130.66 ± 0.32
Jeblia1.837 ± 0.0812.83 ± 0.33
Noukali2.957 ± 0.1530.4 ± 0.36
Ournakssi 22142.38 ± 0.07524.84 ± 0.75
Ournakssi 22820.653 ± 0.0528.52 ± 1.1
Palmes3.43 ± 0.07511.98 ± 0.92
Pingo de Mel1.827 ± 0.06516.7 ± 0.44
Rhamam1.477 ± 0.0823.43 ± 0.47
Sucre vert2.917 ± 0.07517.33 ± 0.4
Tarnimt0.747 ± 0.0628.2 ± 0.36
VCR 276/494.867 ± 0.12524.74 ± 0.88
White Adriatic2.217 ± 0.09630.11 ± 1.32
Table 4. Descriptive biochemical and agronomic parameters of fig oils in 2023 and 2024.
YearMeanStdMin25%50%75%Max
TPC (mg GAE/100 g of oil)202348.67816.59316.52238.85945.54354.13103.478
TFC (mg QCE/100 g of oil)15.6165.8565.0912.59114.54516.77337.636
ABTS (%)32.34314.2836.58321.28933.61544.72656.821
DPPH (%)43.69820.94412.2330.08336.67654.08186.865
Oil yield (%)26.6836.7719.8624.01528.4231.30336.74
Seeds yield (g/fruit)2.0410.6570.6881.5471.9242.4693.702
TPC (mg GAE/100 g of oil)202431.20516.63910.76122.01127.71736.304115.109
TFC (mg QCE/100 g of oil)11.7751.8839.27310.81811.45512.18219
ABTS (%)26.3136.09716.80721.98925.3529.06253.221
DPPH (%)58.48710.77934.06354.5462.14366.96172.306
Oil yield (%)21.2457.4235.5216.19322.926.68838.3
Seeds yield (g/fruit)2.2471.1190.331.561.942.845.12
Table 5. Results of the Analysis of Variance (ANOVA) for the effects of year, variety and their interaction on biochemical and yield traits of fig oils.
SourceVariableDFF_Valuep_Value
Year (Y)TPC (mg GAE/100 g of oil)11372.8440.000
TFC (mg QCE/100 g of oil)1828.3640.000
DPPH (%)16199.0640.000
ABTS (%)1197.3740.000
Oil yield (%)11864.5920.000
Seeds yield (g/fruit)1403.7400.000
Variety (V)TPC (mg GAE/100 g of oil)3871.1640.000
TFC (mg QCE/100 g of oil)3862.0870.000
DPPH (%)38449.1070.000
ABTS (%)3835.8810.000
Oil yield (%)38188.7460.000
Seeds yield (g/fruit)38550.7620.000
Y:VTPC (mg GAE/100 g of oil)3854.5540.000
TFC (mg QCE/100 g of oil)3844.9250.000
DPPH (%)38367.3320.000
ABTS (%)3828.6130.000
Oil yield (%)38139.4740.000
Seeds yield (g/fruit)38282.6230.000
Table 7. Statistical significance of year, variety and their interaction on the main integrated FTIR bands in fig seed oils samples.
SourceWavenumber (cm−1)DFF_Valuep_Value
Year (Y)3012 cm−111880.7030.000
2928 cm−1173,421.830.000
1745 cm−111212.5490.000
1375 cm−1112,226.90.000
1050 cm−119435.6030.000
Variety (V)3012 cm−138115.2350.000
2928 cm−1382268.9570.000
1745 cm−13824.952630.000
1375 cm−138411.18680.000
1050 cm−138230.71730.000
Y:V3012 cm−138168.40240.000
2928 cm−1383082.040.000
1745 cm−13824.484410.000
1375 cm−138576.55680.000
1050 cm−138355.01120.000
Disclaimer/Publisher’s Note: The statements, opinions and data contained in all publications are solely those of the individual author(s) and contributor(s) and not of MDPI and/or the editor(s). MDPI and/or the editor(s) disclaim responsibility for any injury to people or property resulting from any ideas, methods, instructions or products referred to in the content.