
Gut Microbiota Composition in Rats Consuming Sucralose or Rebaudioside A at Recommended Doses Under Two Dietary Interventions

 ,
, 
 , , , and
Abstract
1. Introduction
2. Materials and Methods
2.1. Study Design
2.2. Animals
2.3. Diets
2.4. Treatments
2.5. DNA Extraction and 16S rRNA PCR
2.6. Application of 16S rRNA Gene Sequencing
2.7. Data Analysis
3. Results
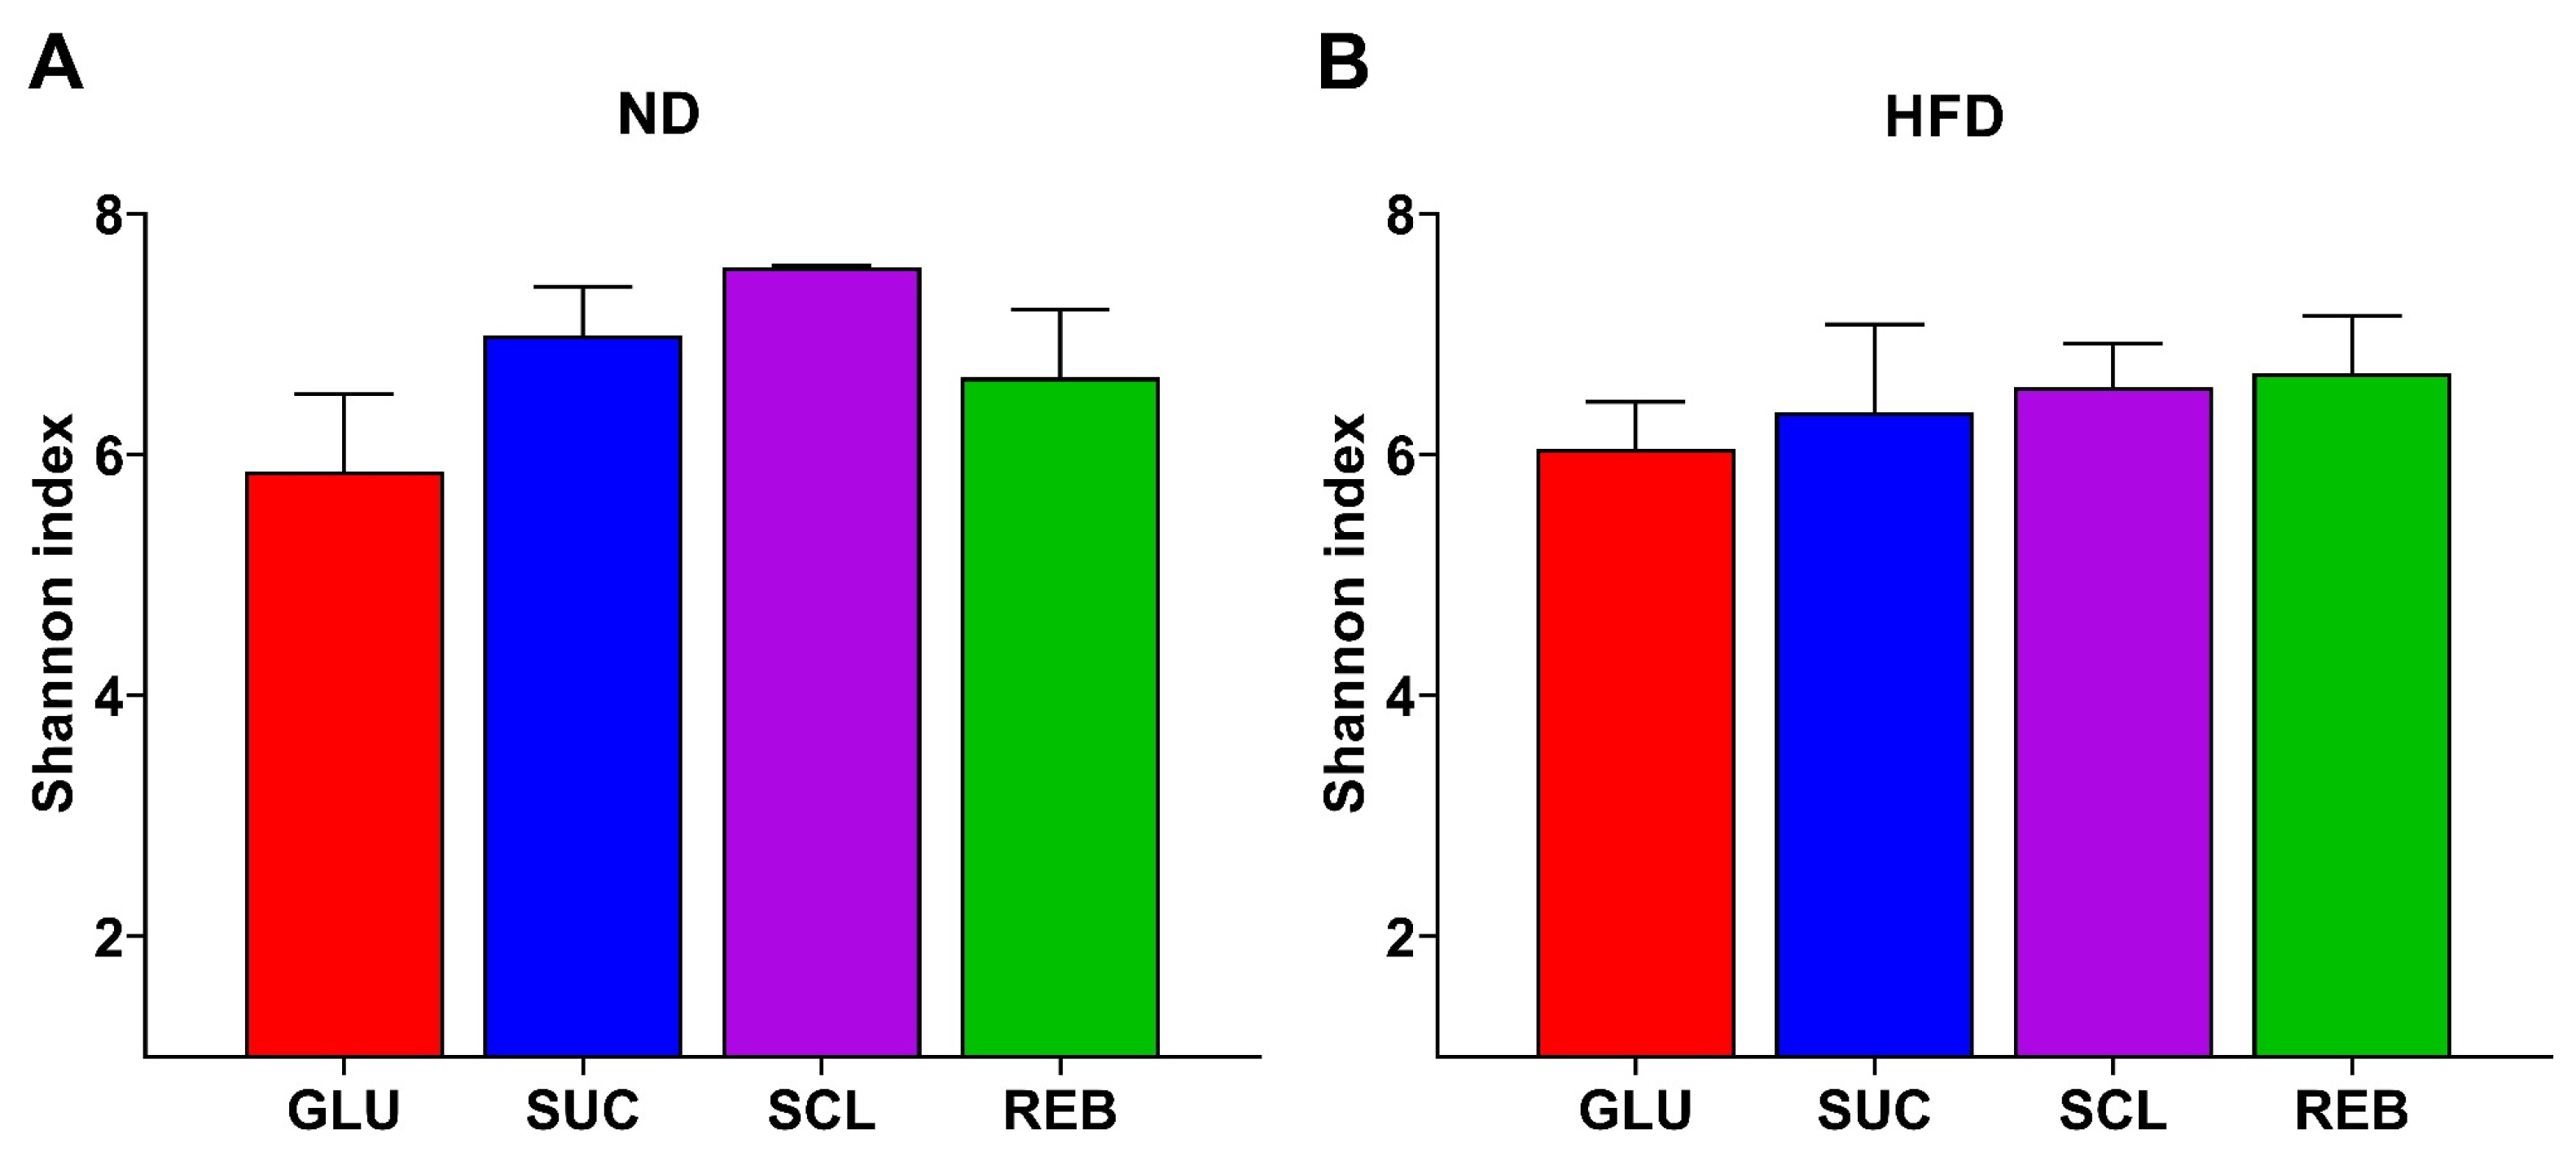
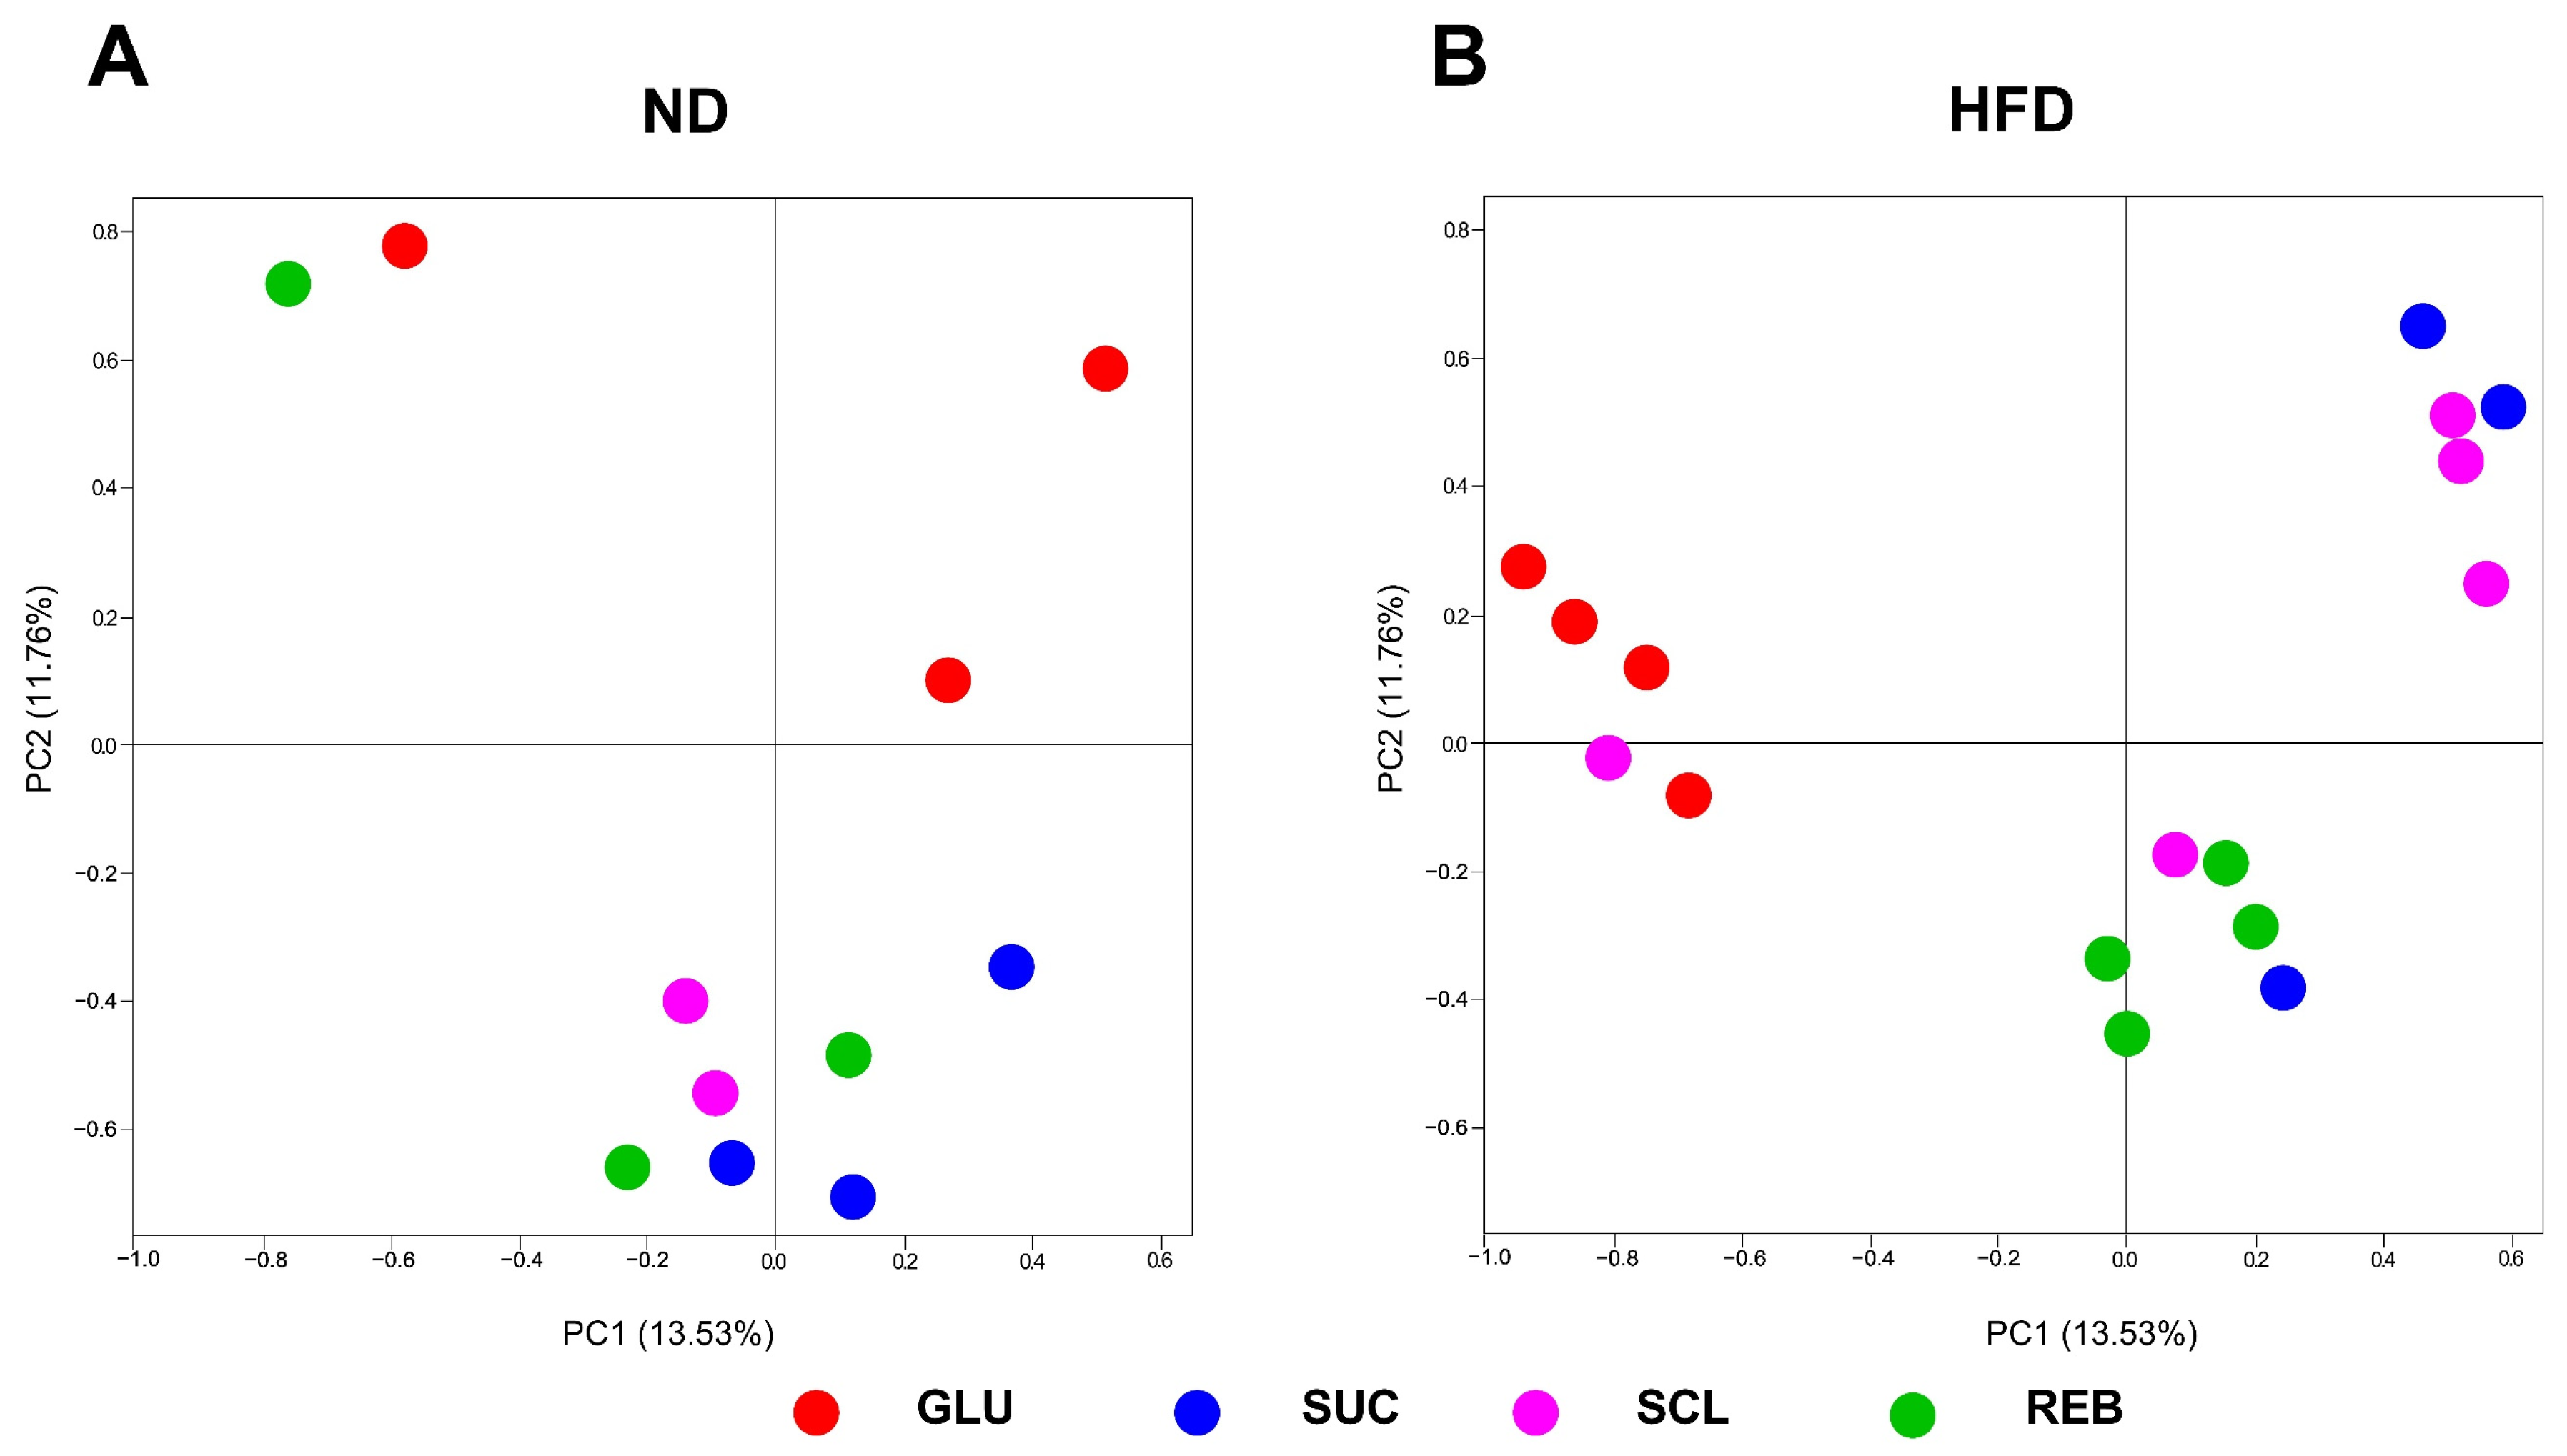
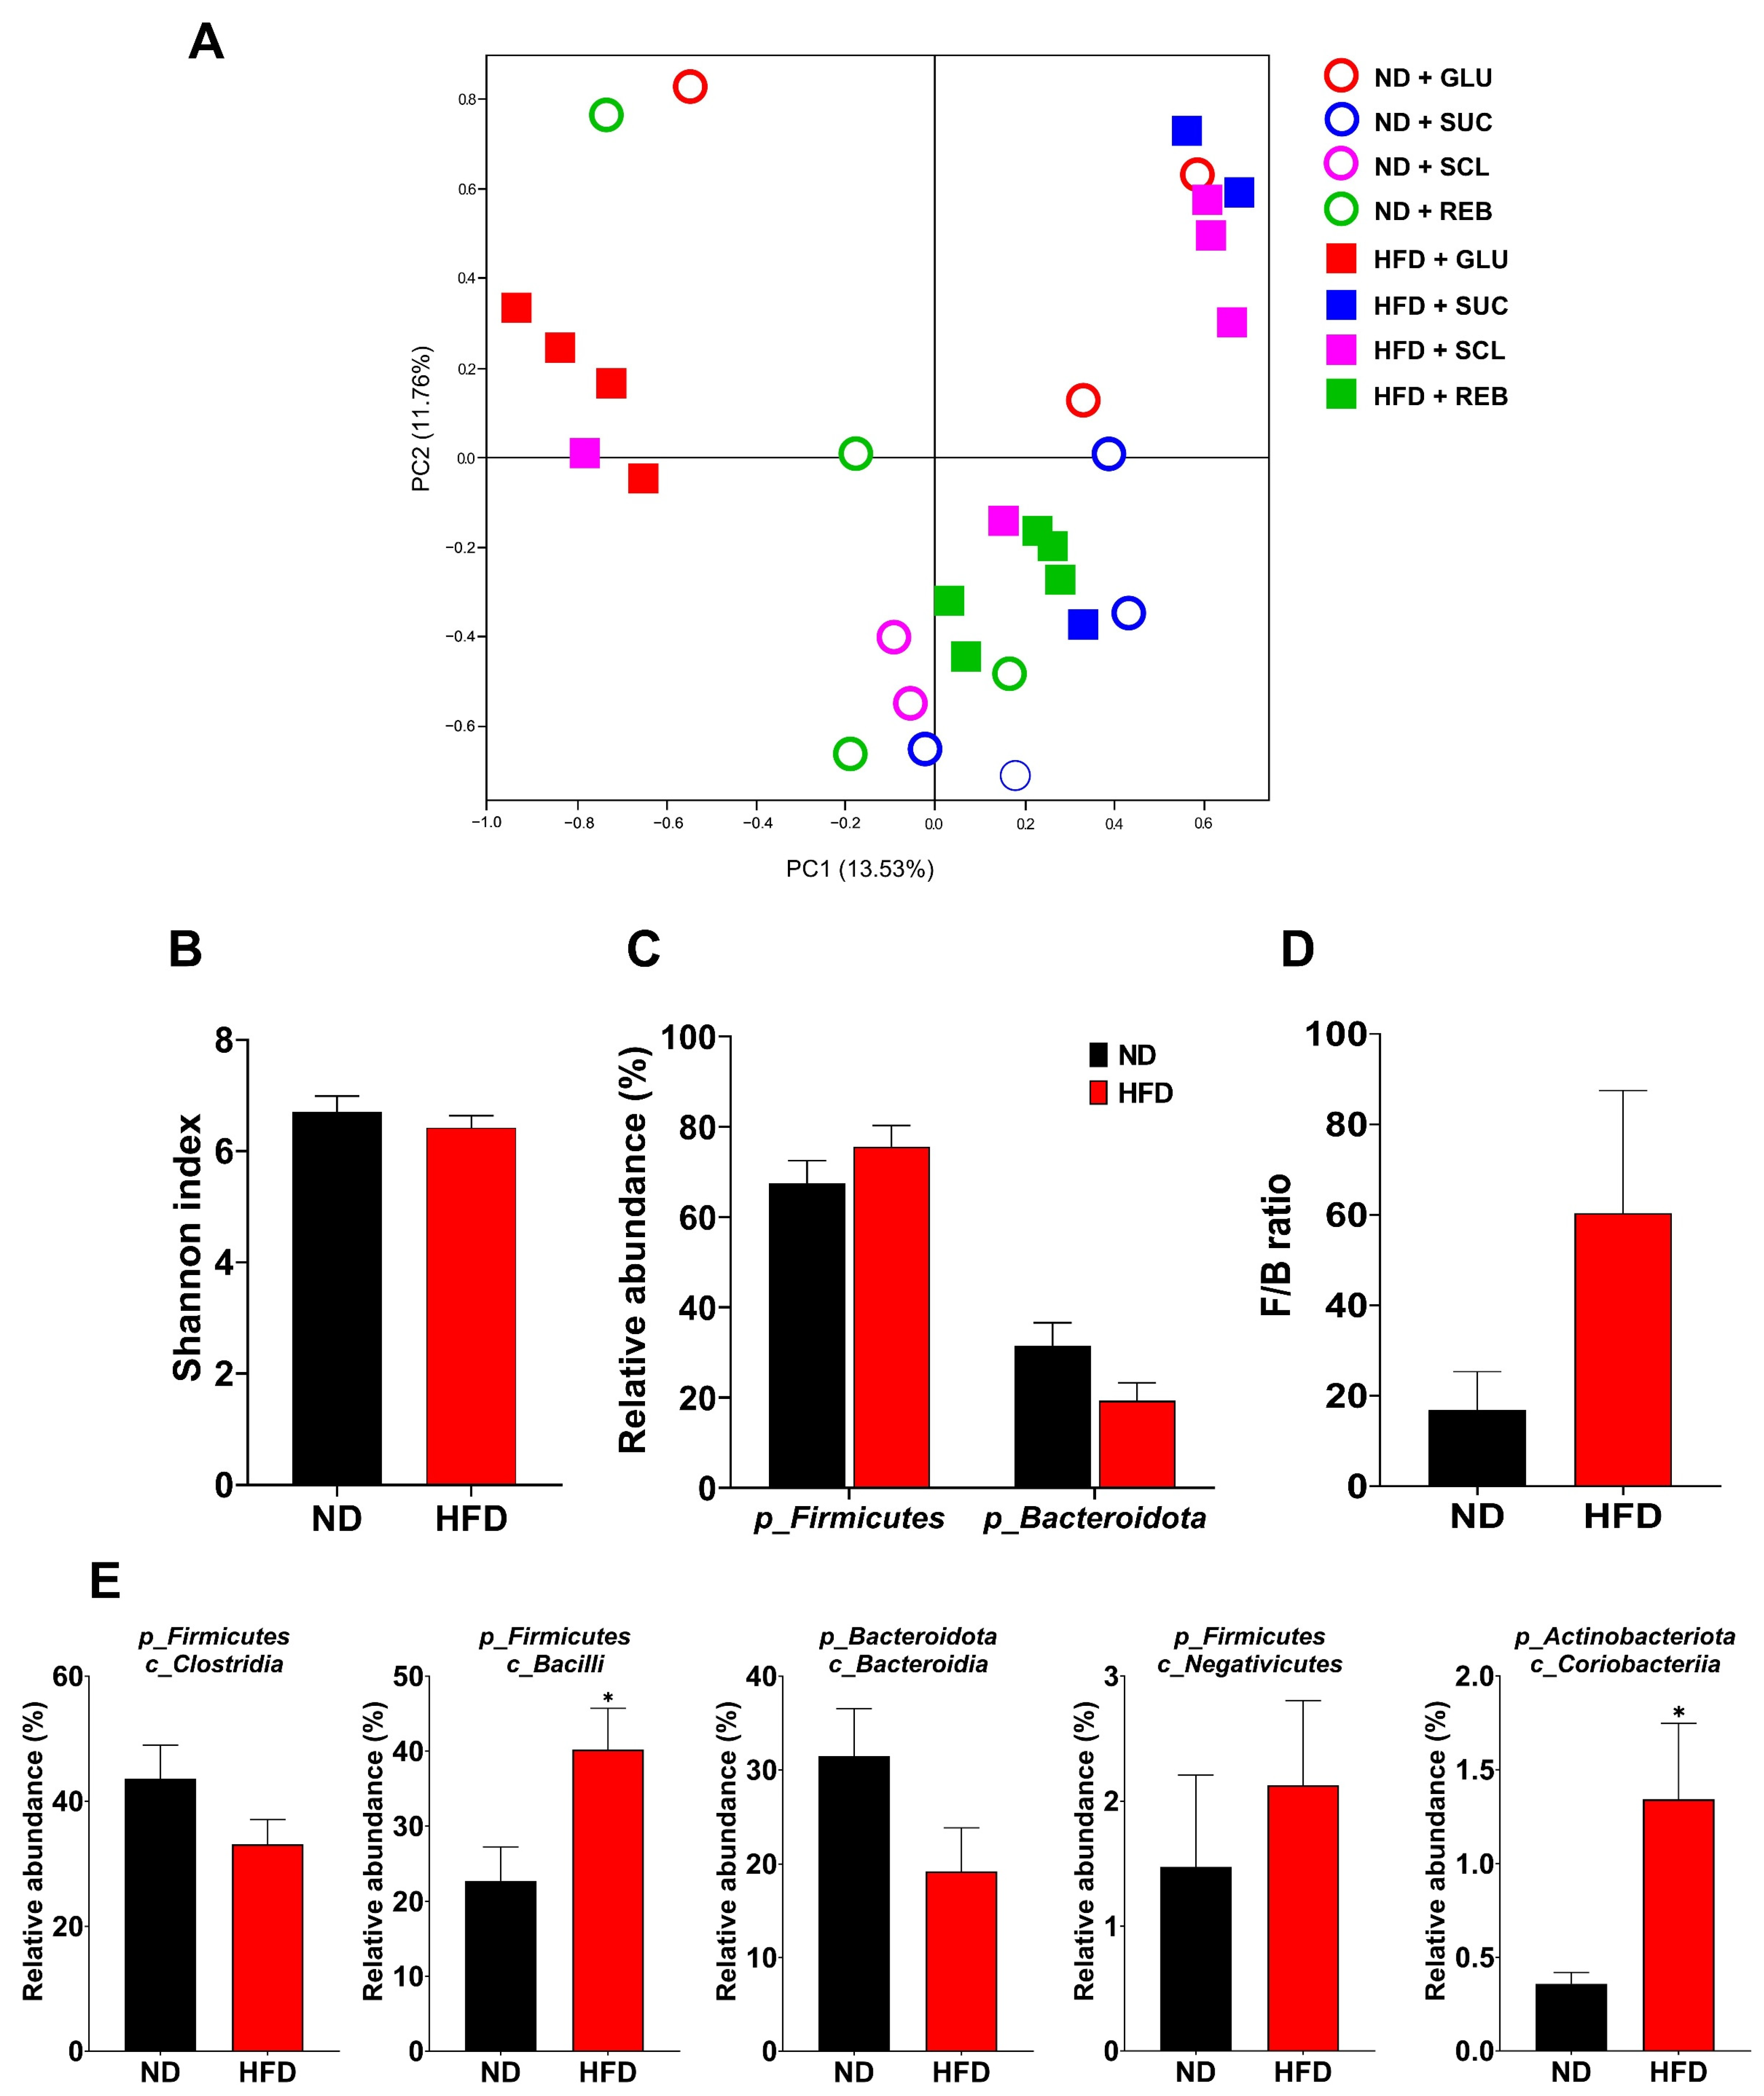
3.1. Effect of Sucralose or Reb A on GM Diversity
3.2. Effect of Sucralose or Reb A on GM Composition
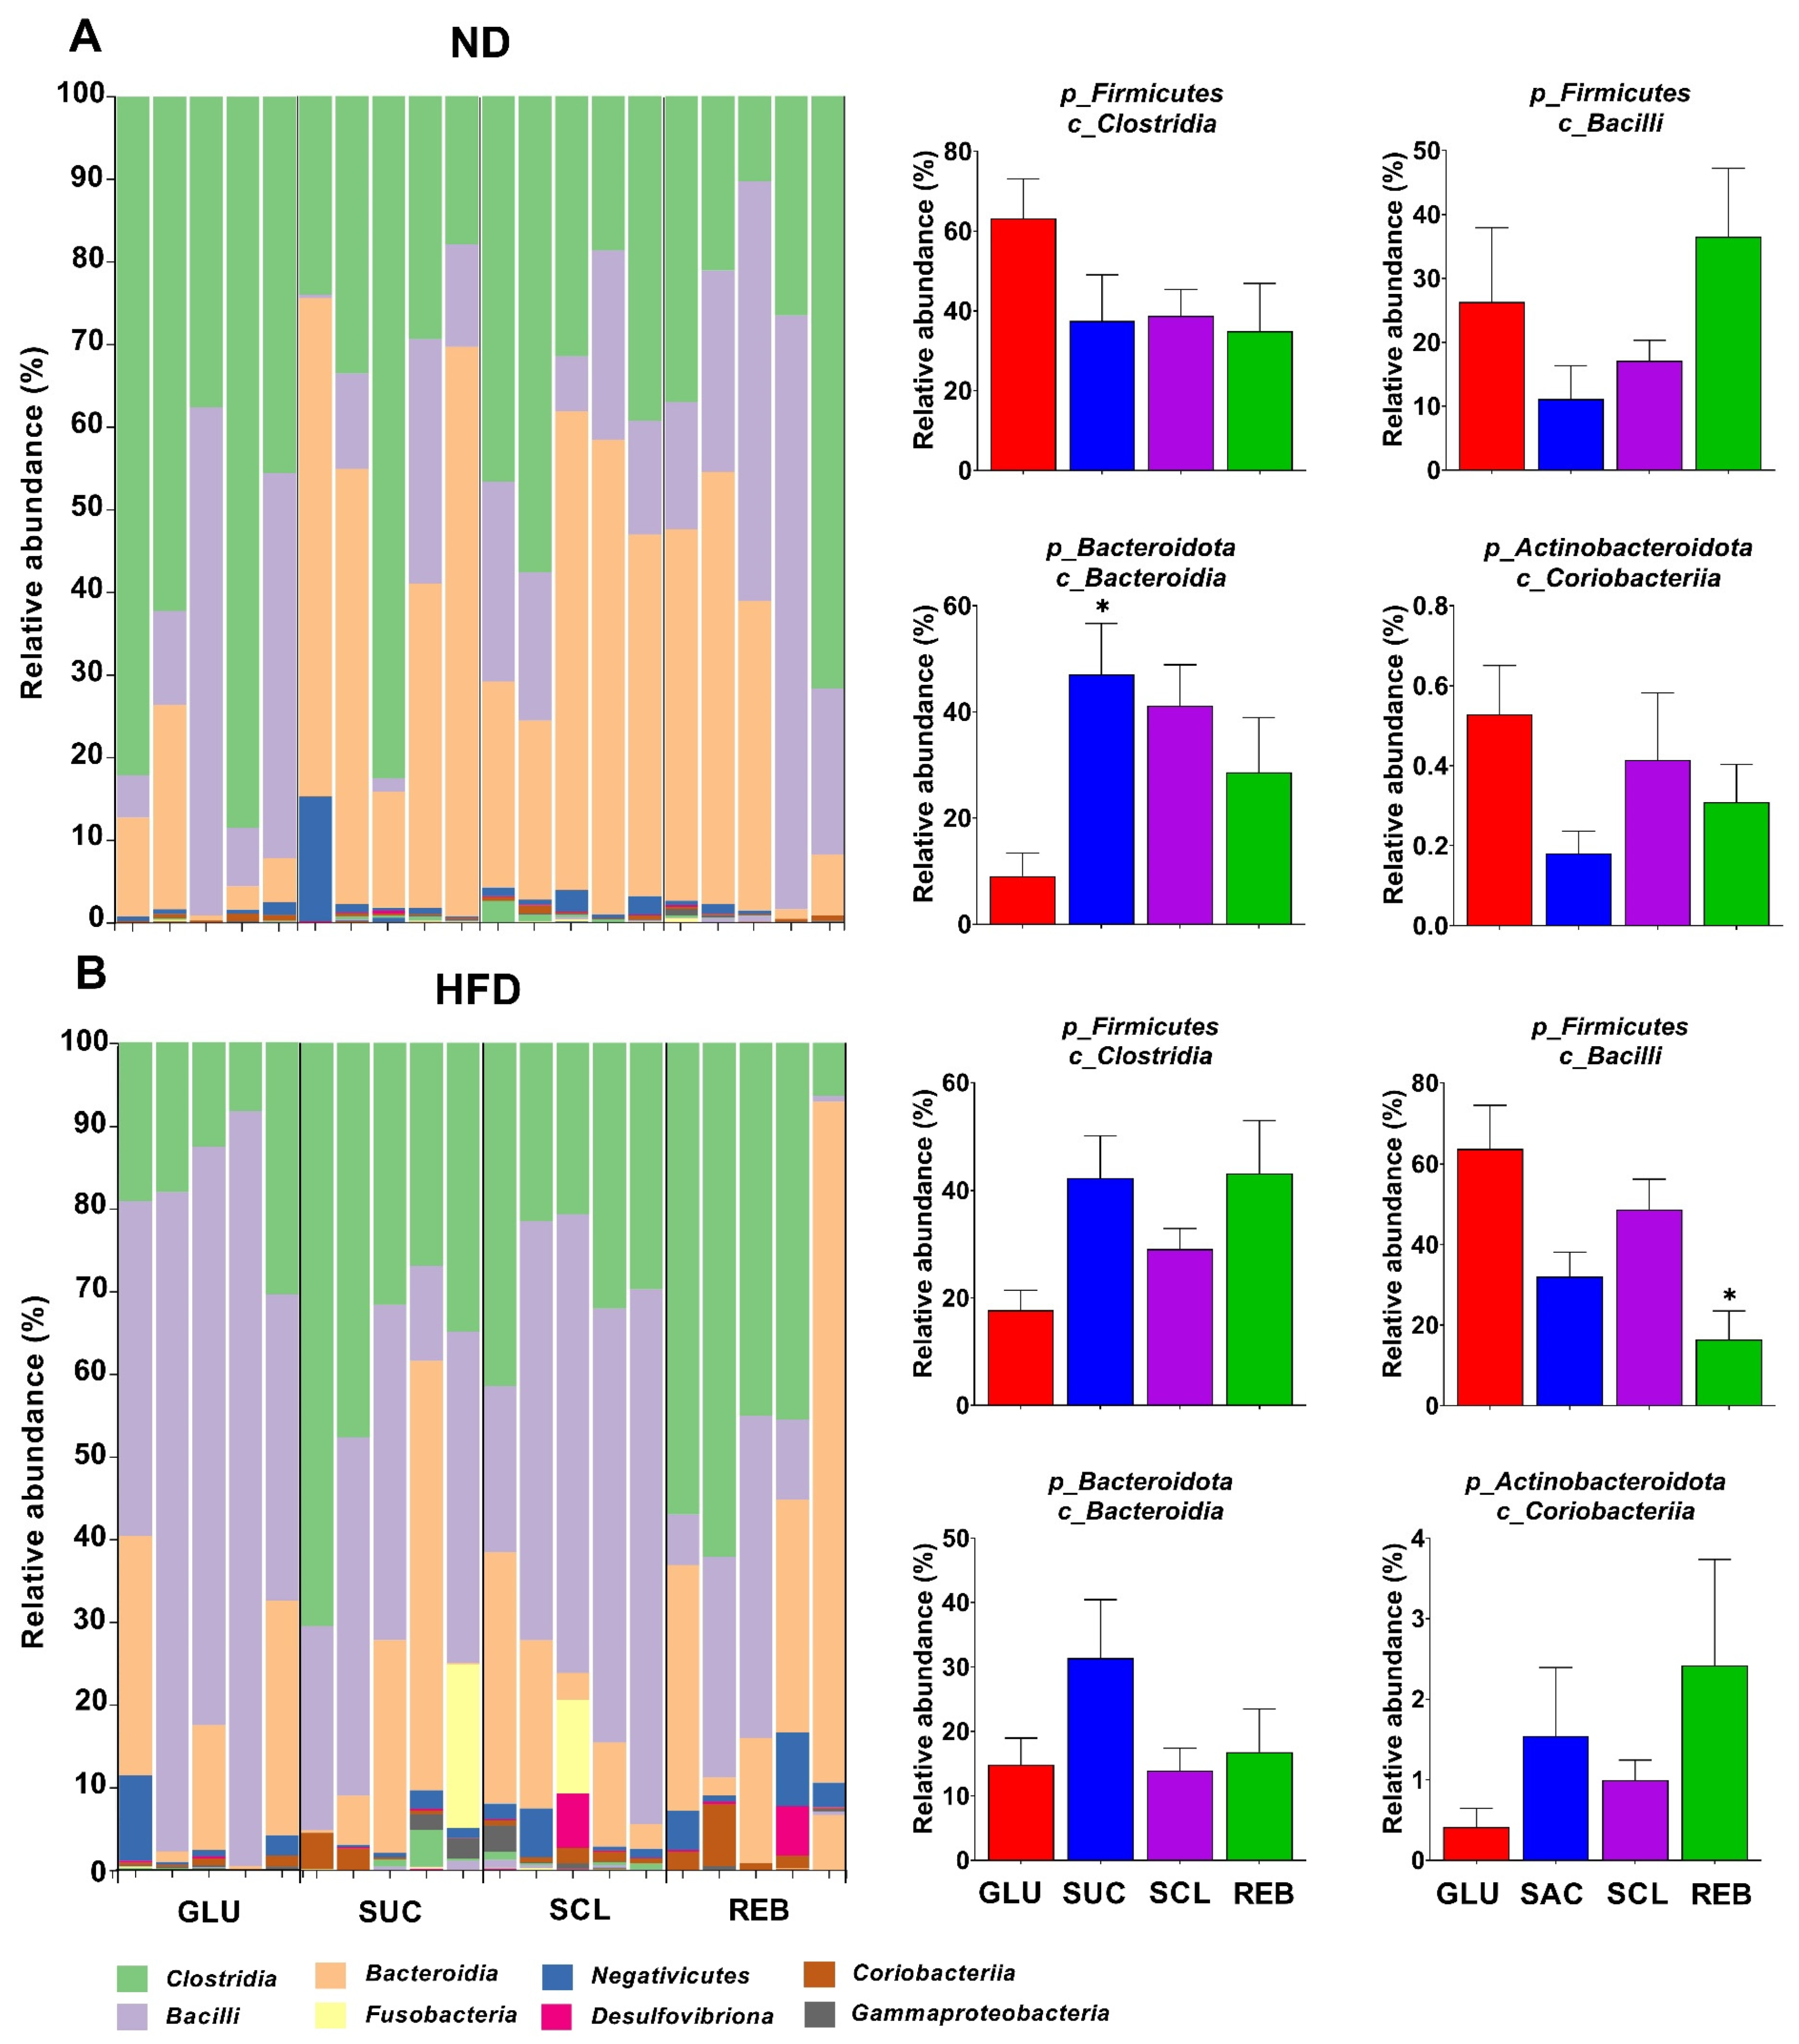
3.2.1. Phylum Level
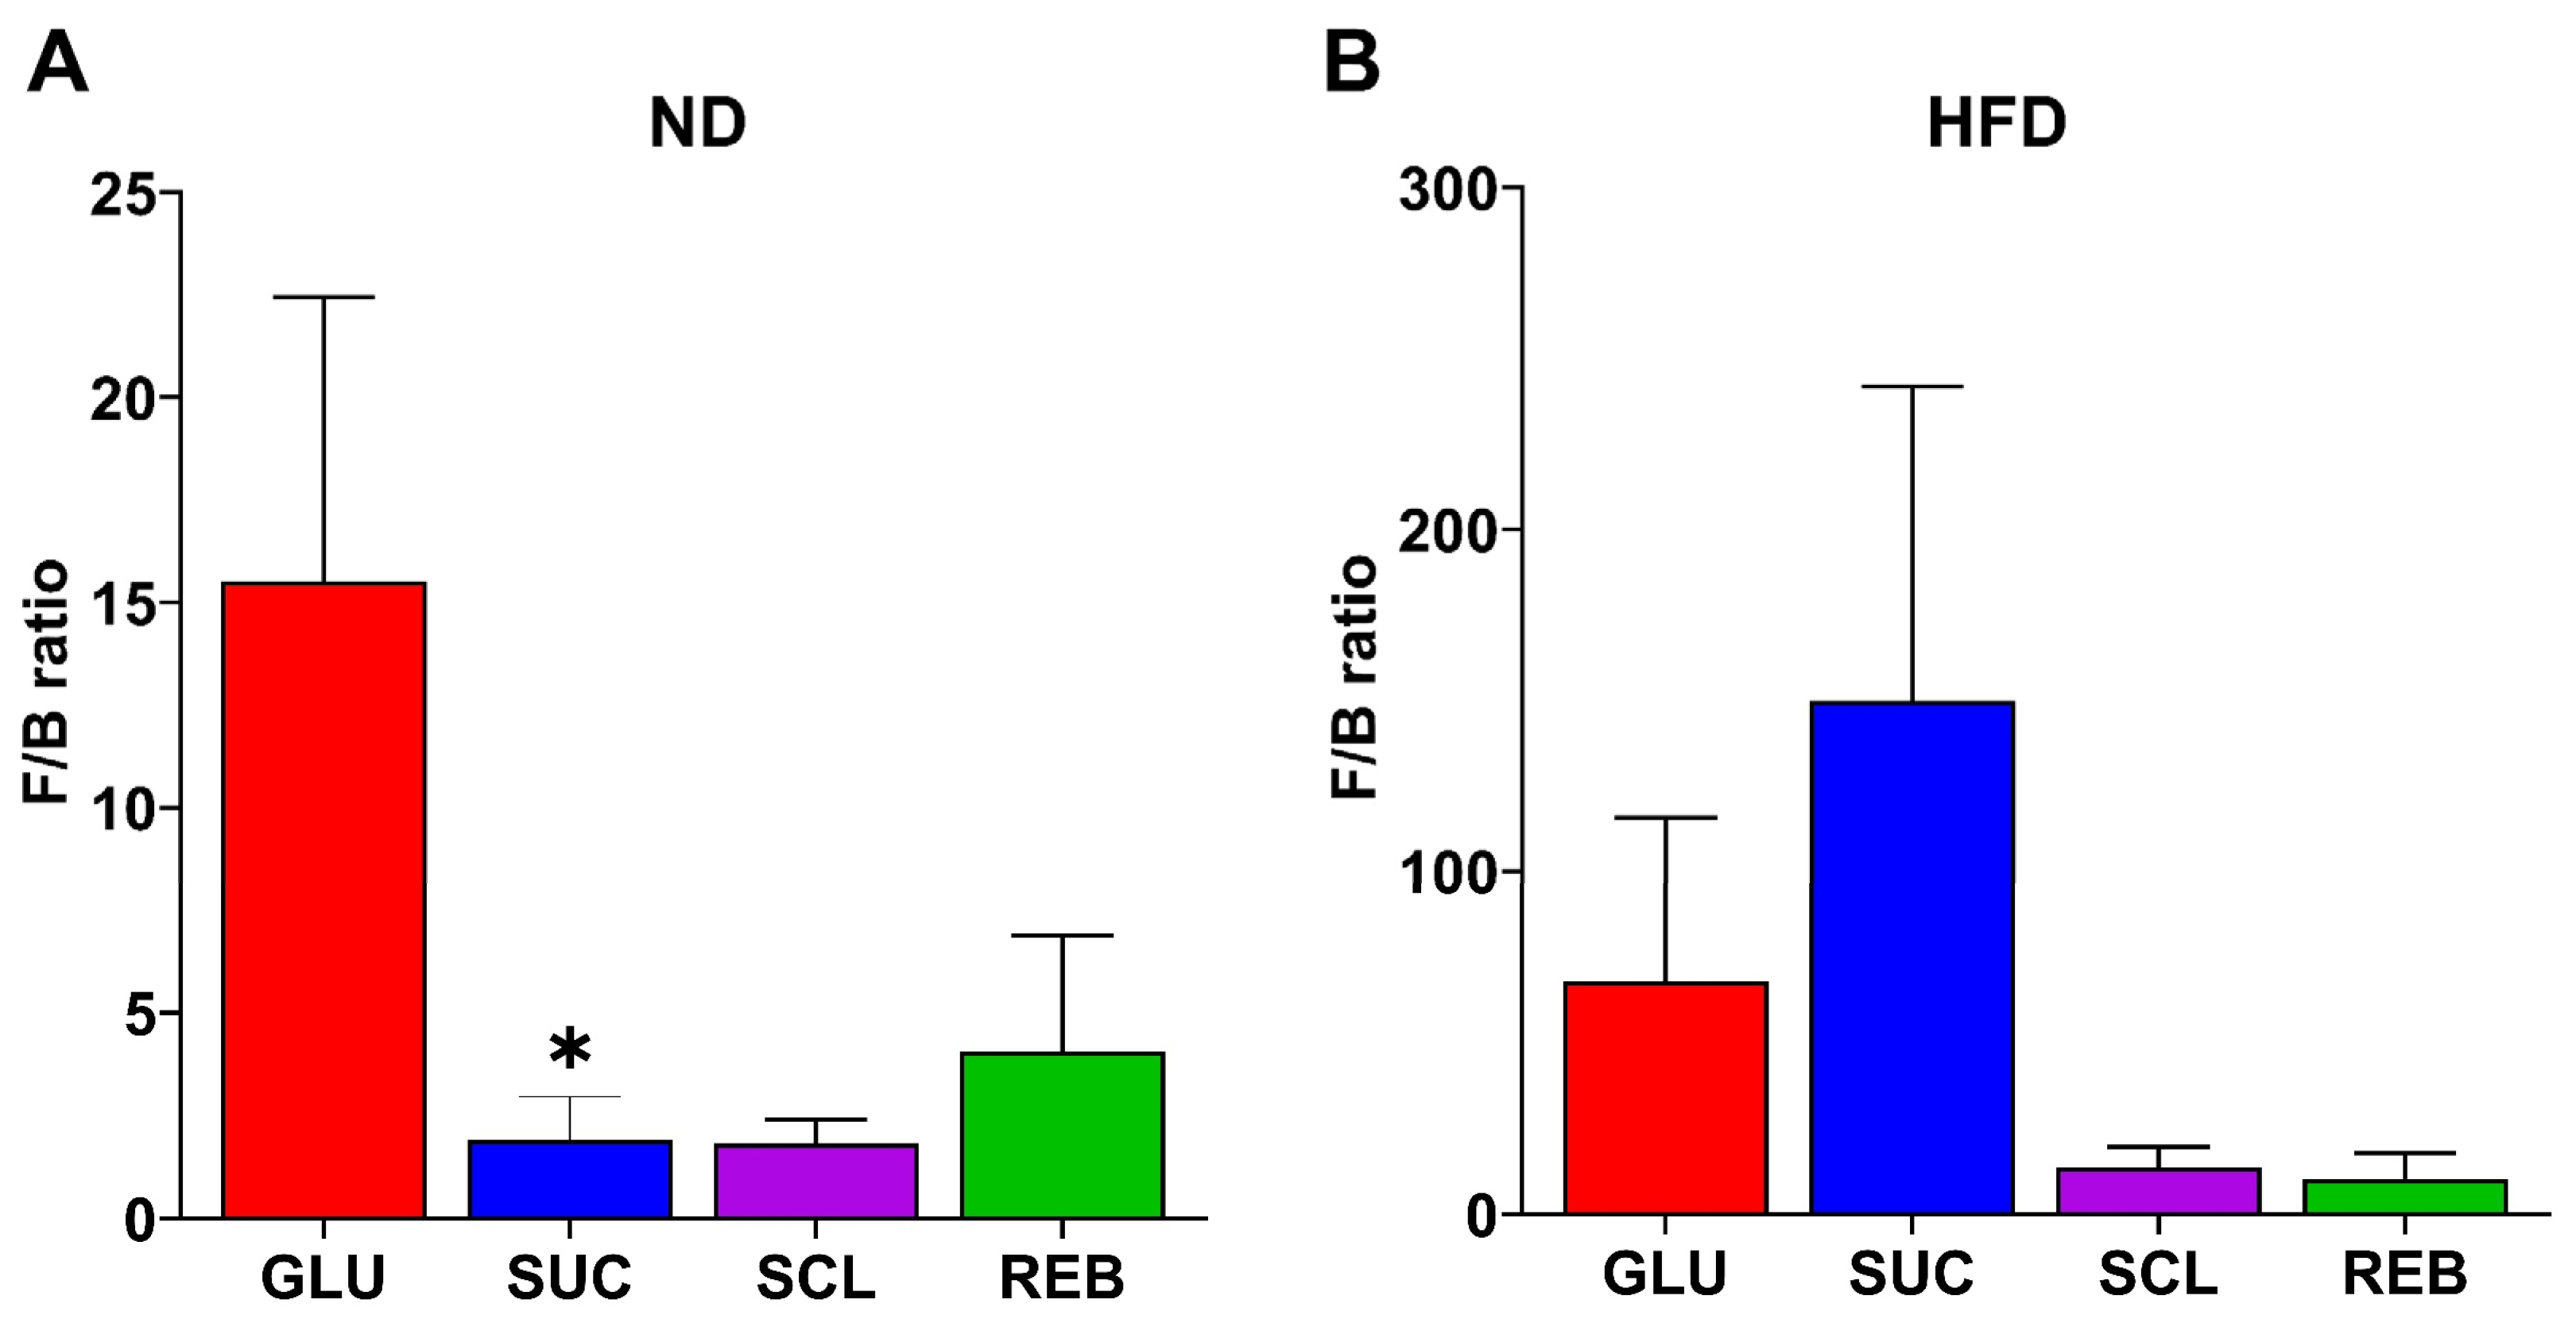
3.2.2. F/B Ratio
3.2.3. Class Level
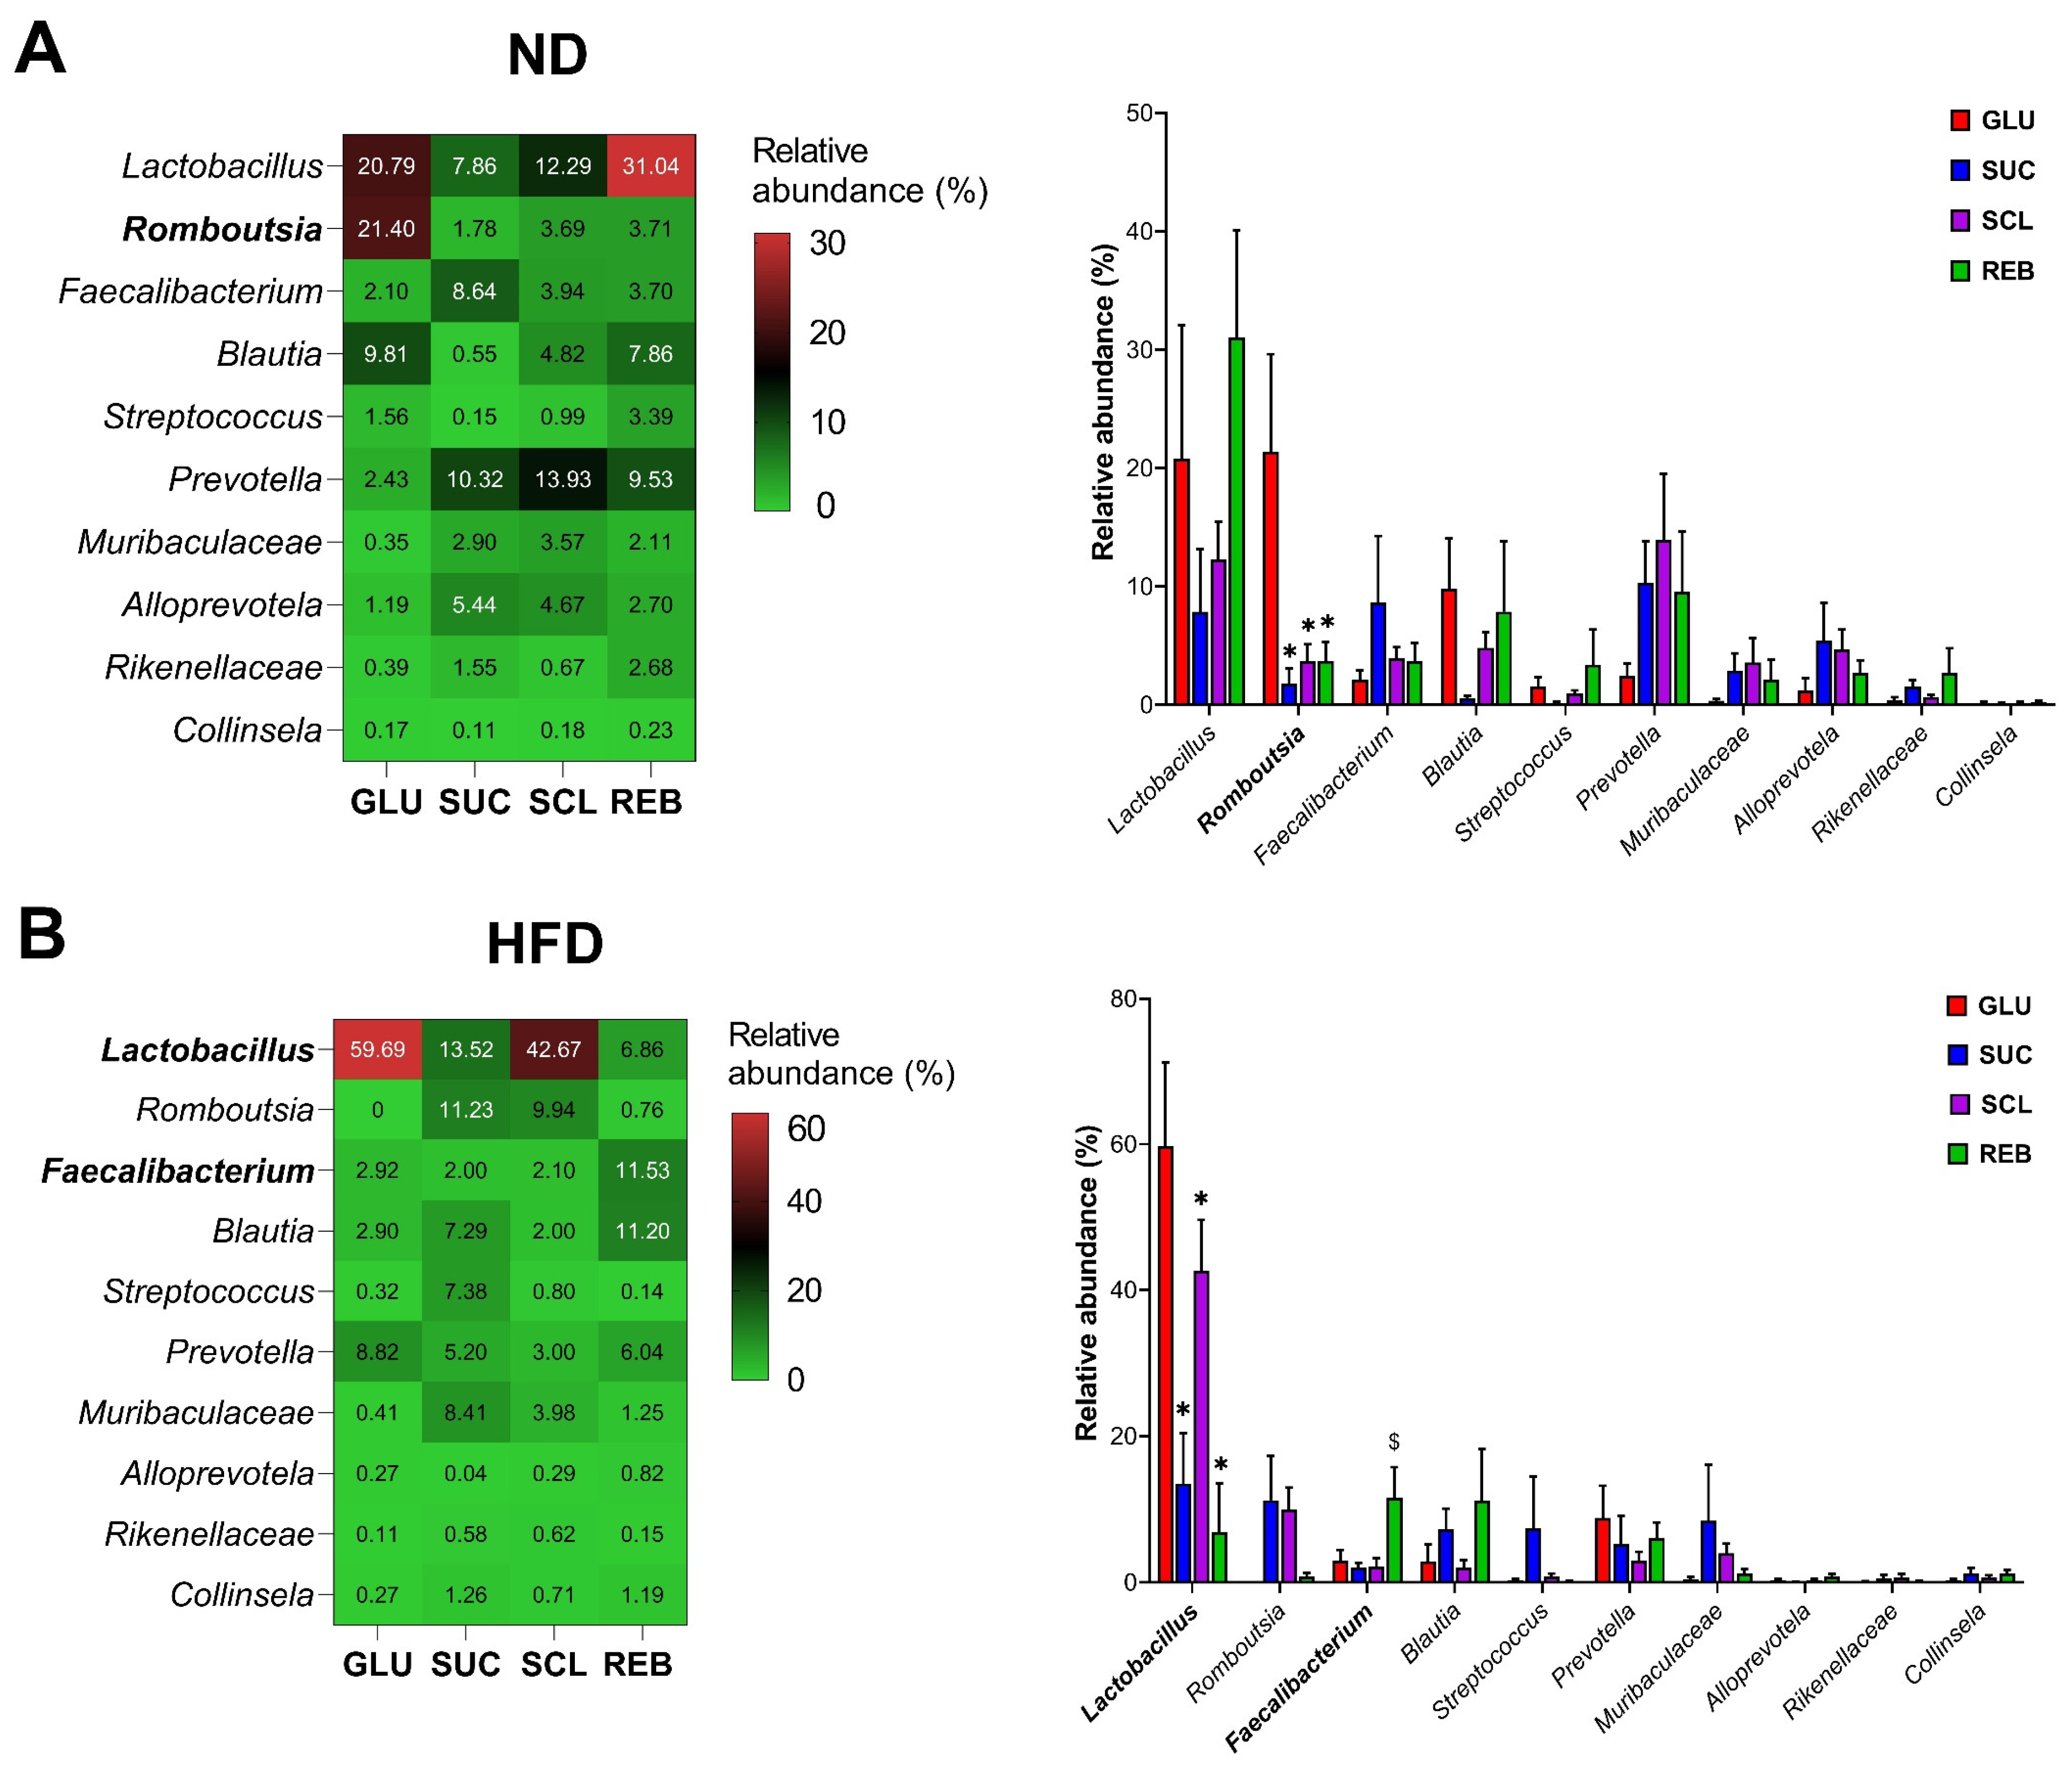
3.2.4. Genera Level
3.3. Effect of the HFD on Diversity, Composition, and the F/B Ratio
3.4. Effect of the HFD on Fasting Biochemical Parameters
4. Discussion
5. Conclusions
Supplementary Materials
Author Contributions
Funding
Institutional Review Board Statement
Informed Consent Statement
Data Availability Statement
Acknowledgments
Conflicts of Interest
Abbreviations
| NNS | Non-nutritive sweeteners |
| ADI | Acceptable daily intake |
| FDA | Food and Drug Administration |
| GM | Gut microbiota |
| SCL | Sucralose |
| REB | Rebaudioside A |
| GLU | Glucose |
| SUC | Sucrose |
| ND | Normal diet |
| HFD | High-fat diet |
| HCD | Hypercaloric diet |
| F/B ratio | Firmicutes/Bacteroidetes ratio |
| BW | Body weight |
References
- Wang, W.; Nettleton, J.E.; Gänzle, M.G.; Reimer, R.A. A metagenomics investigation of intergenerational effects of non-nutritive sweeteners on gut microbiome. Front. Nutr. 2022, 8, 795848. [Google Scholar] [CrossRef]
- Bian, X.; Chi, L.; Gao, B.; Tu, P.; Ru, H.; Lu, K. Gut microbiome response to sucralose and its potential role in inducing liver inflammation in mice. Front. Physiol. 2017, 8, 487. [Google Scholar] [CrossRef]
- Nettleton, J.E.; Klancic, T.; Schick, A.; Choo, A.C.; Shearer, J.; Borgland, S.L.; Chleilat, F.; Mayengbam, S.; Reimer, R.A. Low-dose stevia (rebaudioside a) consumption perturbs gut microbiota and the mesolimbic dopamine reward system. Nutrients 2019, 11, 1248. [Google Scholar] [CrossRef] [PubMed]
- Wang, Q.-P.; Browman, D.; Herzog, H.; Neely, G. Non-nutritive sweeteners possess a bacteriostatic effect and alter gut microbiota in mice. PLoS ONE 2018, 13, e0199080. [Google Scholar] [CrossRef] [PubMed]
- Lohner, S.; Toews, I.; Meerpohl, J.J. Health outcomes of non-nutritive sweeteners: Analysis of the research landscape. Nutr. J. 2017, 16, 55. [Google Scholar] [CrossRef] [PubMed]
- Additional Information about High-Intensity Sweeteners Permitted for Use in Food in the United States. Available online: https://www.fda.gov/food/food-additives-petitions/additional-information-about-high-intensity-sweeteners-permitted-use-food-united-states (accessed on 10 June 2024).
- Plaza-Diaz, J.; Pastor-Villaescusa, B.; Rueda-Robles, A.; Abadia-Molina, F.; Ruiz-Ojeda, F.J. Plausible biological interactions of low- and non-calorie sweeteners with the intestinal microbiota: An update of recent studies. Nutrients 2020, 12, 1153. [Google Scholar] [CrossRef]
- Suez, J.; Korem, T.; Zeevi, D.; Zilberman-Schapira, G.; Thaiss, C.A.; Maza, O.; Israeli, D.; Zmora, N.; Gilad, S.; Weinberger, A.; et al. Artificial sweeteners induce glucose intolerance by altering the gut microbiota. Nature 2014, 514, 181–186. [Google Scholar] [CrossRef]
- Zheng, Z.; Xiao, Y.; Ma, L.; Lyu, W.; Peng, H.; Wang, X.; Ren, Y.; Li, J. Low dose of sucralose alter gut microbiome in mice. Front. Nutr. 2022, 9, 848392. [Google Scholar] [CrossRef]
- Garcia, K.; Ferreira, G.; Reis, F.; Viana, S. Impact of dietary sugars on gut microbiota and metabolic health. Diabetology 2022, 3, 549–560. [Google Scholar] [CrossRef]
- Zmora, N.; Suez, J.; Elinav, E. You are what you eat: Diet, health and the gut microbiota. Nat. Rev. Gastroenterol. Hepatol. 2019, 16, 35–56. [Google Scholar] [CrossRef]
- Higgins, K.A.; Mattes, R.D. A randomized controlled trial contrasting the effects of 4 low-calorie sweeteners and sucrose on body weight in adults with overweight or obesity. Am. J. Clin. Nutr. 2019, 109, 1288–1301. [Google Scholar] [CrossRef] [PubMed]
- Kidangathazhe, A.; Amponsah, T.; Maji, A.; Adams, S.; Chettoor, M.; Wang, X.; Scaria, J. Synthetic vs. Non-synthetic sweeteners: Their differential effects on gut microbiome diversity and function. Front. Microbiol. 2025, 16, 1531131. [Google Scholar] [CrossRef]
- Serrano, J.; Smith, K.R.; Crouch, A.L.; Sharma, V.; Yi, F.; Vargova, V.; LaMoia, T.E.; Dupont, L.M.; Serna, V.; Tang, F.; et al. High-dose saccharin supplementation does not induce gut microbiota changes or glucose intolerance in healthy humans and mice. Microbiome 2021, 9, 11. [Google Scholar] [CrossRef]
- Ze, X.; Duncan, S.H.; Louis, P.; Flint, H.J. Ruminococcus bromii is a keystone species for the degradation of resistant starch in the human colon. ISME J. 2012, 6, 1535–1543. [Google Scholar] [CrossRef]
- Ramos-García, M.; Ble-Castillo, J.L.; García-Vázquez, C.; Tovilla-Zárate, C.A.; Juárez-Rojop, I.E.; Olvera-Hernández, V.; Genis-Mendoza, A.D.; Córdova-Uscanga, R.; Álvarez-González, C.A.; Díaz-Zagoya, J.C. Effects of non-nutritive sweeteners on energy intake, body weight and postprandial glycemia in healthy and with altered glycemic response rats. Foods 2021, 10, 958. [Google Scholar] [CrossRef]
- 16s Metagenomic Sequencing Library Preparation. Available online: https://support.illumina.com/documents/documentation/chemistry_documentation/16s/16s-metagenomic-library-prep-guide-15044223-b.pdf (accessed on 20 February 2023).
- Bolger, A.M.; Lohse, M.; Usadel, B. Trimmomatic: A flexible trimmer for illumina sequence data. Bioinformatics 2014, 30, 2114–2120. [Google Scholar] [CrossRef]
- Caporaso, J.G.; Kuczynski, J.; Stombaugh, J.; Bittinger, K.; Bushman, F.D.; Costello, E.K.; Fierer, N.; Peña, A.G.; Goodrich, J.K.; Gordon, J.I.; et al. Qiime allows analysis of high-throughput community sequencing data. Nat. Methods 2010, 7, 335–336. [Google Scholar] [CrossRef]
- Becker, S.L.; Chiang, E.; Plantinga, A.; Carey, H.V.; Suen, G.; Swoap, S.J. Effect of stevia on the gut microbiota and glucose tolerance in a murine model of diet-induced obesity. FEMS Microbiol. Ecol. 2020, 96, fiaa079. [Google Scholar] [CrossRef]
- Li, S.; Chen, T.; Dong, S.; Xiong, Y.; Wei, H.; Xu, F. The effects of rebaudioside a on microbial diversity in mouse intestine. Food. Sci. Technol. Res. 2014, 20, 459–467. [Google Scholar] [CrossRef]
- Magnuson, B.A.; Carakostas, M.C.; Moore, N.H.; Poulos, S.P.; Renwick, A.G. Biological fate of low-calorie sweeteners. Nutr. Rev. 2016, 74, 670–689. [Google Scholar] [CrossRef]
- Magnuson, B.A.; Roberts, A.; Nestmann, E.R. Critical review of the current literature on the safety of sucralose. Food. Chem. Toxicol. 2017, 106, 324–355. [Google Scholar] [CrossRef]
- Gardana, C.; Simonetti, P.; Canzi, E.; Zanchi, R.; Pietta, P. Metabolism of stevioside and rebaudioside a from stevia rebaudiana extracts by human microflora. J. Agric. Food. Chem. 2003, 51, 6618–6622. [Google Scholar] [CrossRef] [PubMed]
- Dyrskog, S.E.; Jeppesen, P.B.; Chen, J.; Christensen, L.P.; Hermansen, K. The diterpene glycoside, rebaudioside a, does not improve glycemic control or affect blood pressure after eight weeks treatment in the goto-kakizaki rat. Rev. Diabet. Stud. 2005, 2, 84–91. [Google Scholar] [CrossRef] [PubMed]
- Stojanov, S.; Berlec, A.; Štrukelj, B. The influence of probiotics on the firmicutes/bacteroidetes ratio in the treatment of obesity and inflammatory bowel disease. Microorganisms 2020, 8, 1715. [Google Scholar] [CrossRef] [PubMed]
- Abenavoli, L.; Scarpellini, E.; Colica, C.; Boccuto, L.; Salehi, B.; Sharifi-Rad, J.; Aiello, V.; Romano, B.; De Lorenzo, A.; Izzo, A.A.; et al. Gut microbiota and obesity: A role for probiotics. Nutrients 2019, 11, 2690. [Google Scholar] [CrossRef]
- Conz, A.; Salmona, M.; Diomede, L. Effect of non-nutritive sweeteners on the gut microbiota. Nutrients 2023, 15, 1869. [Google Scholar] [CrossRef]
- Jumpertz, R.; Le, D.S.; Turnbaugh, P.J.; Trinidad, C.; Bogardus, C.; Gordon, J.I.; Krakoff, J. Energy-balance studies reveal associations between gut microbes, caloric load, and nutrient absorption in humans. Am. J. Clin. Nutr. 2011, 94, 58–65. [Google Scholar] [CrossRef]
- Schwiertz, A.; Taras, D.; Schäfer, K.; Beijer, S.; Bos, N.A.; Donus, C.; Hardt, P.D. Microbiota and scfa in lean and overweight healthy subjects. Obesity 2010, 18, 190–195. [Google Scholar] [CrossRef]
- Tang, W.; Meng, Z.; Li, N.; Liu, Y.; Li, L.; Chen, D.; Yang, Y. Roles of gut microbiota in the regulation of hippocampal plasticity, inflammation, and hippocampus-dependent behaviors. Front. Cell Infect. Microbiol. 2020, 10, 611014. [Google Scholar] [CrossRef]
- Gerritsen, J.; Hornung, B.; Ritari, J.; Paulin, L.; Rijkers, G.T.; Schaap, P.J.; de Vos, W.M.; Smidt, H. A comparative and functional genomics analysis of the genus romboutsia provides insight into adaptation to an intestinal lifestyle. bioRxiv 2019, 845511. [Google Scholar] [CrossRef]
- Zhu, Q.; Zhu, Y.; Liu, Y.; Tao, Y.; Lin, Y.; Lai, S.; Liang, Z.; Chen, Y.; Chen, Y.; Wang, L. Moderation of gut microbiota and bile acid metabolism by chlorogenic acid improves high-fructose-induced salt-sensitive hypertension in mice. Food Funct. 2022, 13, 6987–6999. [Google Scholar] [CrossRef]
- Deniņa, I.; Semjonovs, P.; Fomina, A.; Treimane, R.; Linde, R. The influence of stevia glycosides on the growth of Lactobacillus reuteri strains. Lett. Appl. Microbiol. 2014, 58, 278–284. [Google Scholar] [CrossRef]
- Koyama, E.; Kitazawa, K.; Ohori, Y.; Izawa, O.; Kakegawa, K.; Fujino, A.; Ui, M. In vitro metabolism of the glycosidic sweeteners, stevia mixture and enzymatically modified stevia in human intestinal microflora. Food Chem. Toxicol. 2003, 41, 359–374. [Google Scholar] [CrossRef] [PubMed]
- Zhang, M.; Chen, J.; Yang, M.; Qian, C.; Liu, Y.; Qi, Y.; Feng, R.; Yang, M.; Liu, W.; Ma, J. Low doses of sucralose alter fecal microbiota in high-fat diet-induced obese rats. Front. Nutr. 2021, 8, 787055. [Google Scholar] [CrossRef] [PubMed]
- Machate, D.J.; Figueiredo, P.S.; Marcelino, G.; Guimarães, R.C.A.; Hiane, P.A.; Bogo, D.; Pinheiro, V.A.Z.; Oliveira, L.C.S.; Pott, A. Fatty acid diets: Regulation of gut microbiota composition and obesity and its related metabolic dysbiosis. Int. J. Mol. Sci. 2020, 21, 4093. [Google Scholar] [CrossRef] [PubMed]
- Netto Candido, T.L.; Bressan, J.; Alfenas, R.C.G. Dysbiosis and metabolic endotoxemia induced by high-fat diet. Nutr. Hosp. 2018, 35, 1432–1440. [Google Scholar] [CrossRef]
- Bian, X.; Chi, L.; Gao, B.; Tu, P.; Ru, H.; Lu, K. The artificial sweetener acesulfame potassium affects the gut microbiome and body weight gain in cd-1 mice. PLoS ONE 2017, 12, e0178426. [Google Scholar] [CrossRef]


| Parameter | GLU | SUC | SCL | REB | ||||
|---|---|---|---|---|---|---|---|---|
| ND | HFD | ND | HFD | ND | HFD | ND | HFD | |
| Glucose (mg/dL) | 123.3 ± 6.9 | 111.4 ± 9.8 | 127.9 ± 9.9 | 125.6 ± 6.7 | 120.4 ± 12.3 | 126.3 ± 14.9 | 137.9 ± 12.4 | 123.3 ± 8.5 |
| Insulin (µU/mL) | 79.3 ± 24.3 | 56.5 ± 12.9 | 72.5 ± 20.4 | 86.4 ± 25.4 | 102.3 ± 27.8 | 65.6 ± 36.1 | 76.3 ± 29.9 | 28.1 ± 19.2 |
| HOMA-IR (mg/dL × µU/mL) | 26.5 ± 9.0 | 16.9 ± 4.7 | 25.6 ± 8.2 | 28.8 ± 9.9 | 30.8 ± 8.00 | 29.3 ± 20.5 | 29.5 ± 13.4 | 8.44 ± 5.8 |
| Total Cholesterol (mg/dL) | 51.4 ± 4.9 | 51.0 ± 3.7 | 49.6 ± 3.4 | 65.6 ± 4.6 * | 64.5 ± 3.8 | 53.0 ± 3.6 * | 65 ± 2.9 | 55.5 ± 4.8 |
| Triglycerides (mg/dL) | 38.6 ± 3.0 | 48.1 ± 3.5 | 41.2 ± 4.2 | 62.6 ± 5.8 * | 45 ± 1.7 | 52.6 ± 5.5 | 48.2 ± 4.2 | 52.8 ± 3.0 |
| HDL-Cholesterol (mg/dL) | 21.0 ± 1.4 | 18.5 ± 0.8 | 20.9 ± 0.7 | 24.3 ± 2.1 | 24.9 ± 1.3 | 19.6 ± 1.0 * | 25.6 ± 0.7 | 20.5 ± 1.0 * |
Disclaimer/Publisher’s Note: The statements, opinions and data contained in all publications are solely those of the individual author(s) and contributor(s) and not of MDPI and/or the editor(s). MDPI and/or the editor(s) disclaim responsibility for any injury to people or property resulting from any ideas, methods, instructions or products referred to in the content. |
© 2025 by the authors. Licensee MDPI, Basel, Switzerland. This article is an open access article distributed under the terms and conditions of the Creative Commons Attribution (CC BY) license (https://creativecommons.org/licenses/by/4.0/).
Share and Cite
Ramos-García, M.; Genis-Mendoza, A.D.; García-Vázquez, C.; Martínez-Magaña, J.J.; Olvera-Hernández, V.; Martínez-López, M.C.; Díaz-Zagoya, J.C.; Alvarez-Villagomez, C.S.; Juárez-Rojop, I.E.; Nicolini, H.; et al. Gut Microbiota Composition in Rats Consuming Sucralose or Rebaudioside A at Recommended Doses Under Two Dietary Interventions. Metabolites 2025, 15, 529. https://doi.org/10.3390/metabo15080529
Ramos-García M, Genis-Mendoza AD, García-Vázquez C, Martínez-Magaña JJ, Olvera-Hernández V, Martínez-López MC, Díaz-Zagoya JC, Alvarez-Villagomez CS, Juárez-Rojop IE, Nicolini H, et al. Gut Microbiota Composition in Rats Consuming Sucralose or Rebaudioside A at Recommended Doses Under Two Dietary Interventions. Metabolites. 2025; 15(8):529. https://doi.org/10.3390/metabo15080529
Chicago/Turabian StyleRamos-García, Meztli, Alma Delia Genis-Mendoza, Carlos García-Vázquez, José Jaime Martínez-Magaña, Viridiana Olvera-Hernández, Mirian Carolina Martínez-López, Juan Cuauhtémoc Díaz-Zagoya, Carina Shianya Alvarez-Villagomez, Isela Esther Juárez-Rojop, Humberto Nicolini, and et al. 2025. "Gut Microbiota Composition in Rats Consuming Sucralose or Rebaudioside A at Recommended Doses Under Two Dietary Interventions" Metabolites 15, no. 8: 529. https://doi.org/10.3390/metabo15080529
APA StyleRamos-García, M., Genis-Mendoza, A. D., García-Vázquez, C., Martínez-Magaña, J. J., Olvera-Hernández, V., Martínez-López, M. C., Díaz-Zagoya, J. C., Alvarez-Villagomez, C. S., Juárez-Rojop, I. E., Nicolini, H., & Ble-Castillo, J. L. (2025). Gut Microbiota Composition in Rats Consuming Sucralose or Rebaudioside A at Recommended Doses Under Two Dietary Interventions. Metabolites, 15(8), 529. https://doi.org/10.3390/metabo15080529