
Interaction Between CYP1A2-Related Caffeine Metabolism and Vitamin B12/Folate Status in Patients with Metabolic Syndrome: A Novel Biomarker Axis

 ,
,  , and
, and
Abstract
1. Introduction
2. Materials and Methods
2.1. Study Design and Population
- The inclusion criteria were as follows:
- Adult patients aged between 18 and 75 years.
- Confirmed diagnosis of metabolic syndrome according to International Diabetes Federation (IDF) and National Cholesterol Education Program Adult Treatment Panel III (NCEP ATP III) criteria, requiring at least three of the following five components [11,12,13]:
- ○
- Central obesity (BMI ≥ 30 kg/m2).
- ○
- Elevated serum triglycerides (≥150 mg/dL).
- ○
- Low HDL cholesterol levels (<40 mg/dL in men and <50 mg/dL in women).
- ○
- Elevated fasting blood glucose (≥100 mg/dL or previously diagnosed type 2 diabetes).
- ○
- Elevated blood pressure (≥130/85 mmHg) or current antihypertensive treatment.
- Availability of complete clinical and biochemical data necessary for the study.
- Availability of genetic data, specifically genotyping results for the CYP1A2 gene SNP rs762551.
- Adequate completion of questionnaires regarding daily caffeine consumption.
- Provision of signed written informed consent for voluntary participation in the study.
- The exclusion criteria were as follows:
- Age under 18 or over 75 years.
- Pregnant or breastfeeding women.
- Confirmed diagnosis of severe hepatic impairment or liver cirrhosis.
- Advanced chronic kidney disease (eGFR < 30 mL/min/1.73 m2) [13].
- Severe acute or chronic inflammatory diseases, including active autoimmune diseases or chronic infections (e.g., HIV, Hepatitis B or C).
- Recent history (within the past 6 months) of major surgical interventions or prolonged hospitalizations (>10 days).
- Chronic pharmacological treatment known to significantly interfere with caffeine metabolism or vitamin status (e.g., anticonvulsants, antituberculosis medication, recent chemotherapy).
- Severe digestive disorders (Crohn’s disease, ulcerative colitis, gastric bypass) affecting vitamin B12 and folate absorption.
- Excessive alcohol intake (>2 units/day for women and >3 units/day for men) or history of substance abuse within the past year.
2.2. Data Collection and Clinical Variables
2.3. Biochemical Assessment
2.4. Assessment of Daily Caffeine Consumption
2.5. SNP Selection and Genotyping
2.6. Statistical Analysis
3. Results
4. Discussion
5. Conclusions
Author Contributions
Funding
Institutional Review Board Statement
Informed Consent Statement
Data Availability Statement
Conflicts of Interest
References
- Fahed, G.; Aoun, L.; Bou Zerdan, M.; Allam, S.; Bou Zerdan, M.; Bouferraa, Y.; Assi, H.I. Metabolic Syndrome: Updates on Pathophysiology and Management in 2021. Int. J. Mol. Sci. 2022, 23, 786. [Google Scholar] [CrossRef] [PubMed] [PubMed Central]
- Mottillo, S.; Filion, K.B.; Genest, J.; Joseph, L.; Pilote, L.; Poirier, P.; Rinfret, S.; Schiffrin, E.L.; Eisenberg, M.J. The metabolic syndrome and cardiovascular risk: A systematic review and meta-analysis. J. Am. Coll. Cardiol. 2010, 56, 1113–1132. [Google Scholar] [CrossRef]
- Cho, Y.; Lee, S.Y. Useful Biomarkers of Metabolic Syndrome. Int. J. Environ. Res. Public Health 2022, 19, 15003. [Google Scholar] [CrossRef] [PubMed]
- Li, Y.; Yu, C.; Chen, N.; Zhao, Y.; Zhang, X.; Song, W.; Lu, J.; Liu, X. Serum Klotho as a Novel Biomarker for Metabolic Syndrome: Findings from a Large National Cohort. Front. Endocrinol. 2024, 15, 1295927. [Google Scholar] [CrossRef]
- Grzegorzewski, J.; Bartsch, F.; Köller, A.; König, M. Pharmacokinetics of Caffeine: A Systematic Analysis of Reported Data for Application in Metabolic Phenotyping and Liver Function Testing. Front. Pharmacol. 2022, 12, 752826. [Google Scholar] [CrossRef] [PubMed] [PubMed Central]
- Sulem, P.; Gudbjartsson, D.F.; Geller, F.; Prokopenko, I.; Feenstra, B.; Aben, K.K.; Franke, B.; den Heijer, M.; Kovacs, P.; Stumvoll, M.; et al. Sequence variants at CYP1A1-CYP1A2 and AHR associate with coffee consumption. Hum. Mol. Genet. 2011, 20, 2071–2077. [Google Scholar] [CrossRef] [PubMed] [PubMed Central]
- Ulloque-Badaracco, J.R.; Hernandez-Bustamante, E.A.; Alarcon-Braga, E.A.; Al-Kassab-Córdova, A.; Cabrera-Guzmán, J.C.; Herrera-Añazco, P.; Benites-Zapata, V.A. Vitamin B12, folate, and homocysteine in metabolic syndrome: A systematic review and meta-analysis. Front. Endocrinol. 2023, 14, 1221259. [Google Scholar] [CrossRef]
- Yang, M.; Wang, D.; Wang, X.; Mei, J.; Gong, Q. Role of Folate in Liver Diseases. Nutrients 2024, 16, 1872. [Google Scholar] [CrossRef] [PubMed] [PubMed Central]
- Muroya, S.; Otomaru, K.; Oshima, K.; Oshima, I.; Ojima, K.; Gotoh, T. DNA Methylation of Genes Participating in Hepatic Metabolisms and Function in Fetal Calf Liver Is Altered by Maternal Undernutrition During Gestation. Int. J. Mol. Sci. 2023, 24, 10682. [Google Scholar] [CrossRef]
- International Diabetes Federation. IDF Diabetes Atlas, 10th ed.; International Diabetes Federation: Brussels, Belgium, 2021; Available online: https://diabetesatlas.org (accessed on 23 May 2025).
- National Cholesterol Education Program (NCEP); Expert Panel on Detection, Evaluation, and Treatment of High Blood Cholesterol in Adults (Adult Treatment Panel III). Third Report of the National Cholesterol Education Program (NCEP) Expert Panel on Detection, Evaluation, and Treatment of High Blood Cholesterol in Adults (Adult Treatment Panel III) Final Report; NIH Publication No. 02-5215; National Heart, Lung, and Blood Institute: Bethesda, MD, USA, 2002. Available online: https://www.nhlbi.nih.gov/files/docs/resources/heart/atp-3-cholesterol-full-report.pdf (accessed on 23 May 2025).
- Grundy, S.M.; Cleeman, J.I.; Daniels, S.R.; Donato, K.A.; Eckel, R.H.; Franklin, B.A.; Gordon, D.J.; Krauss, R.M.; Savage, P.J.; Smith, S.C.; et al. Diagnosis and Management of the Metabolic Syndrome: An American Heart Association/National Heart, Lung, and Blood Institute Scientific Statement. Circulation 2005, 112, 2735–2752. Available online: https://www.ahajournals.org/doi/10.1161/CIRCULATIONAHA.105.169404 (accessed on 26 May 2025). [CrossRef]
- Stevens, P.E.; Ahmed, S.B.; Carrero, J.J.; Foster, B.; Francis, A.; Hall, R.K.; Herrington, W.G.; Hill, G.; Inker, L.A.; Kazancıoğlu, R.; et al. KDIGO 2024 Clinical Practice Guideline for the Evaluation and Management of Chronic Kidney Disease. Kidney Int. Suppl. 2024, 105, S117–S314. Available online: https://kdigo.org/wp-content/uploads/2024/03/KDIGO-2024-CKD-Guideline.pdf (accessed on 21 May 2025). [CrossRef] [PubMed]
- Adhikari, A.C.; Peiris, H.; Attanayake, A.P. Stability of serum total cholesterol, triglycerides, and plasma glucose of healthy individuals at different storage conditions. Ceylon J. Sci. 2024, 53, 435–438. [Google Scholar] [CrossRef]
- Chen, X.; Ren, F.; Xu, J.; Yu, Z.; Lin, X.; Bai, Z.; Gong, F. A Rapid Quantitative Chemiluminescence Immunoassay for Vitamin B12 in Human Serum. Clin. Lab. 2020, 66, 277–286. [Google Scholar] [CrossRef] [PubMed]
- BD. BD Vacutainer® Tube Guide; BD: Franklin Lakes, NJ, USA, 2024; Available online: https://www.bd.com (accessed on 22 June 2025).
- Pawlik-Sobecka, L.; Sołkiewicz, K.; Kokot, I.; Kiraga, A.; Płaczkowska, S.; Schlichtinger, A.M.; Kratz, E.M. The Influence of Serum Sample Storage Conditions on Selected Laboratory Parameters Related to Oxidative Stress: A Preliminary Study. Diagnostics 2020, 10, 51. [Google Scholar] [CrossRef]
- Thompson, F.E.; Subar, A.F. Dietary assessment methodology. In Nutrition in the Prevention and Treatment of Disease, 4th ed.; Academic Press: Cambridge, MA, USA, 2017. [Google Scholar]
- RBC Bioscience. MagCore® Genomic DNA Whole Blood Kit—User Manual; RBC Bioscience: Taipei, Taiwan, 2023; Available online: https://www.rbcbioscience.com (accessed on 22 June 2025).
- Thermo Fisher Scientific. TaqMan® SNP Genotyping Assays Protocol; Thermo Fisher Scientific: Waltham, MA, USA, 2024; Available online: https://www.thermofisher.com (accessed on 22 June 2025).
- Nerurkar, P.V.; Gandhi, K.; Chen, J.J. Correlations Between Coffee Consumption and Metabolic Phenotypes, Plasma Folate, and Vitamin B12: NHANES 2003 to 2006. Nutrients 2021, 13, 1348. [Google Scholar] [CrossRef] [PubMed]
- Popa, L.C.; Farcaș, S.S.; Andreescu, N.I. Coffee Consumption and CYP1A2 Polymorphism Involvement in Type 2 Diabetes in a Romanian Population. J. Pers. Med. 2024, 14, 717. [Google Scholar] [CrossRef]
- Platt, D.E.; Ghassibe-Sabbagh, M.; Salameh, P.; Salloum, A.K.; Haber, M.; Mouzaya, F.; Gauguier, D.; Al-Sarraj, Y.; El-Shanti, H.; Zalloua, P.A.; et al. Caffeine Impact on Metabolic Syndrome Components Is Modulated by a CYP1A2 Variant. Ann. Nutr. Metab. 2016, 68, 1–11. [Google Scholar] [CrossRef] [PubMed]
- Low, J.J.; Tan, B.J.; Yi, L.X.; Zhou, Z.D.; Tan, E.K. Genetic Susceptibility to Caffeine Intake and Metabolism: A systematic review. J. Transl. Med. 2024, 22, 961. [Google Scholar] [CrossRef]
- Klomp, F.; Wenzel, C.; Drozdzik, M.; Oswald, S. Drug–Drug Interactions Involving Intestinal and Hepatic CYP1A Enzymes. Pharmaceutics 2020, 12, 1201. [Google Scholar] [CrossRef]
- Iqbal, M.S.; Sardar, N.; Peng, K.; Almutairi, L.A.; Duan, X.; Tanvir, F.; Attia, K.A.; Zeng, G.; Gu, D. Association between CYP1A2 gene variants −163 C/A (rs762551) and −3860 G/A (rs2069514) and bladder cancer susceptibility. BMC Cancer 2024, 24, 880. [Google Scholar] [CrossRef]
- Mahdavi, S.; Palatini, P.; El-Sohemy, A. CYP1A2 Genetic Variation, Coffee Intake, and Kidney Dysfunction. JAMA Netw. Open 2023, 6, e2247868. [Google Scholar] [CrossRef] [PubMed]
- Fulton, J.L.; Dinas, P.C.; Carrillo, A.E.; Edsall, J.R.; Ryan, E.J.; Ryan, E.J. Impact of Genetic Variability on Physiological Responses to Caffeine. Nutrients 2018, 10, 1373. [Google Scholar] [CrossRef]
- Banks, N.F.; Tomko, P.M.; Colquhoun, R.J.; Muddle, T.W.D.; Emerson, S.R.; Jenkins, N.D.M. Genetic Polymorphisms in ADORA2A and CYP1A2 Influence Caffeine’s Effect on Postprandial Glycemia. Sci. Rep. 2019, 9, 46931. [Google Scholar] [CrossRef] [PubMed]
- Soares, R.N.; Schneider, A.; Valle, S.C.; Schenkel, P.C. The influence of CYP1A2 genotype in the blood pressure response to caffeine ingestion is affected by physical activity status and caffeine consumption level. Vasc. Pharmacol. 2018, 106, 67–73. [Google Scholar] [CrossRef]
- Chmurzynska, A. Human genetics and caffeine: Functional single-nucleotide polymorphism and response to caffeine intake. In Coffee in Health and Disease Prevention, 2nd ed.; Preedy, V.R., Ed.; Academic Press: Cambridge, MA, USA, 2025; pp. 457–466. [Google Scholar] [CrossRef]
- Aronica, L.; Ordovas, J.M.; Volkov, A.; Lamb, J.J.; Stone, P.M.; Minich, D.; Leary, M.; Class, M.; Metti, D.; Larson, I.A.; et al. Genetic Biomarkers of Metabolic Detoxification for Personalized Lifestyle Medicine. Nutrients 2022, 14, 768. [Google Scholar] [CrossRef] [PubMed]
- Vesnina, A.; Prosekov, A.; Kozlova, O.; Atuchin, V. Genes and Eating Preferences, Their Roles in Personalized Nutrition. Genes 2020, 11, 357. [Google Scholar] [CrossRef]
- EasyDNA South Africa. DNA Comprehensive Health Report. EasyDNA 2024. Available online: https://www.easydna.co.za/wp-content/uploads/2024/09/dna-methylation-reportsample.pdf (accessed on 3 March 2025).
- Shang, X.; Scott, D.; Hodge, A.; Giles, G.G.; Ebeling, P.R.; Sanders, K.M. Dietary Protein from Different Food Sources, Incident Metabolic Syndrome and Changes in Its Components: An 11-Year Longitudinal Study in Healthy Community-Dwelling Adults. Clin. Nutr. 2017, 36, 1540–1548. [Google Scholar] [CrossRef]
- Ashok, T.; Puttam, H.; A Tarnate, V.C.; Jhaveri, S.; Avanthika, C.; Treviño, A.G.T.; Sl, S.; Ahmed, N.T. Role of Vitamin B12 and Folate in Metabolic Syndrome. Cureus 2021, 13, e18521. [Google Scholar] [CrossRef]
- Yang, A.; Palmer, A.A.; de Wit, H. Genetics of caffeine consumption and responses to caffeine. Psychopharmacology 2010, 211, 245–257. [Google Scholar] [CrossRef] [PubMed] [PubMed Central]
- Ulvik, A.; Vollset, S.E.; Hoff, G.; Ueland, P.M. Coffee consumption and circulating B-vitamins in healthy middle-aged men and women. Clin. Chem. 2008, 54, 1489–1496. [Google Scholar] [CrossRef] [PubMed]

| Variable | AA (n = 66) | AC (n = 145) | CC (n = 109) | p Value | p Value (AA–AC) | p Value (AA–CC) | p Value (AC–CC) |
|---|---|---|---|---|---|---|---|
| Age (years) * | 54.9 ± 7.8 | 55.0 ± 5.9 | 53.4 ± 8.1 | 0.121 | 0.103 | 0.942 | 0.085 |
| BMI * | 37.0 ± 3.2 | 36.6 ± 2.9 | 37.2 ± 3.2 | 0.103 | 0.149 | 0.724 | 0.051 |
| Weight (kilograms) * | 104.9 ± 16.3 | 102.2 ± 15.9 | 105.5 ± 16.1 | 0.465 | 0.223 | 0.415 | 0.639 |
| Height (meters) * | 1.68 ± 0.09 | 1.67 ± 0.09 | 1.68 ± 0.1 | 0.929 | 0.711 | 0.952 | 0.772 |
| Sex (F) ** | 33 (50.00%) | 77 (53.10%) | 56 (51.37%) | 0.909 | 0.678 | 0.786 | 0.861 |
| Smokers ** | 20 (30.30%) | 57 (39.31%) | 38 (34.86%) | 0.434 | 0.201 | 0.534 | 0.469 |
| Sedentary lifestyle ** | 36 (54.54%) | 68 (46.89%) | 52 (47.70%) | 0.570 | 0.306 | 0.384 | 0.899 |
| Family history of CVD (a) ** | 34 (51.51%) | 97 (66.89%) | 67 (61.46) | 0.103 | 0.034 | 0.202 | 0.375 |
| Variable | AA (n = 66) | AC + CC (n = 254) | p Value |
|---|---|---|---|
| Age (years) * | 54.9 ± 7.8 | 54.31 ± 6.93 | 0.046 |
| BMI * | 37.0 ± 3.2 | 36.86 ± 3.03 | 0.301 |
| Weight (kilograms) * | 104.9 ± 16.3 | 103.62 ± 15.99 | 0.432 |
| Height (meters) * | 1.68 ± 0.09 | 1.674 ± 0.09 | 0.670 |
| Sex (F) ** | 33 (50.00%) | 133 (52.36) | 0.735 |
| Smokers ** | 20 (30.30%) | 95 (37.40%) | 0.274 |
| Sedentary lifestyle ** | 36 (54.54%) | 120 (47.24) | 0.294 |
| Family history of CVD (a) ** | 34 (51.51%) | 164 (64.56%) | 0.061 |
| Parameter | 1–2 Cups/Day (n = 180) | ≥3 Cups/Day (n = 140) | p Value |
|---|---|---|---|
| Folate (ng/mL) | 285.1 ± 145.6 | 259.0 ± 132.1 | 0.004 |
| Vitamin B12 (pg/mL) | 4.1 ± 3.2 | 3.5 ± 2.9 | 0.012 |
| BMI (kg/m2) | 36.9 ± 6.5 | 37.4 ± 6.8 | 0.485 |
| Glucose (mg/dL) | 105.2 ± 22.4 | 107.5 ± 24.0 | 0.362 |
| Triglycerides (mg/dL) | 160.3 ± 58.9 | 165.7 ± 61.2 | 0.392 |
| HDL Cholesterol (mg/dL) | 46.7 ± 11.2 | 45.9 ± 10.8 | 0.491 |
| Coffee Consumption | Genotype | Folate (ng/mL) | Vitamin B12 (pg/mL) | Triglycerides (mg/dL) |
|---|---|---|---|---|
| Moderate (1–2 cups/day) | AA | 300.2 ± 145.0 | 4.3 ± 3.0 | 155.2 ± 59.0 |
| Moderate (1–2 cups/day) | AC + CC | 271.0 ± 140.3 | 3.8 ± 2.8 | 162.0 ± 57.1 |
| p Value | 0.023 | 0.041 | 0.365 | |
| High (≥3 cups/day) | AA | 260.1 ± 130.4 | 3.6 ± 2.9 | 158.7 ± 60.3 |
| High (≥3 cups/day) | AC + CC | 245.7 ± 125.9 | 3.2 ± 2.5 | 170.4 ± 62.2 |
| p Value | 0.178 | 0.215 | 0.092 | |
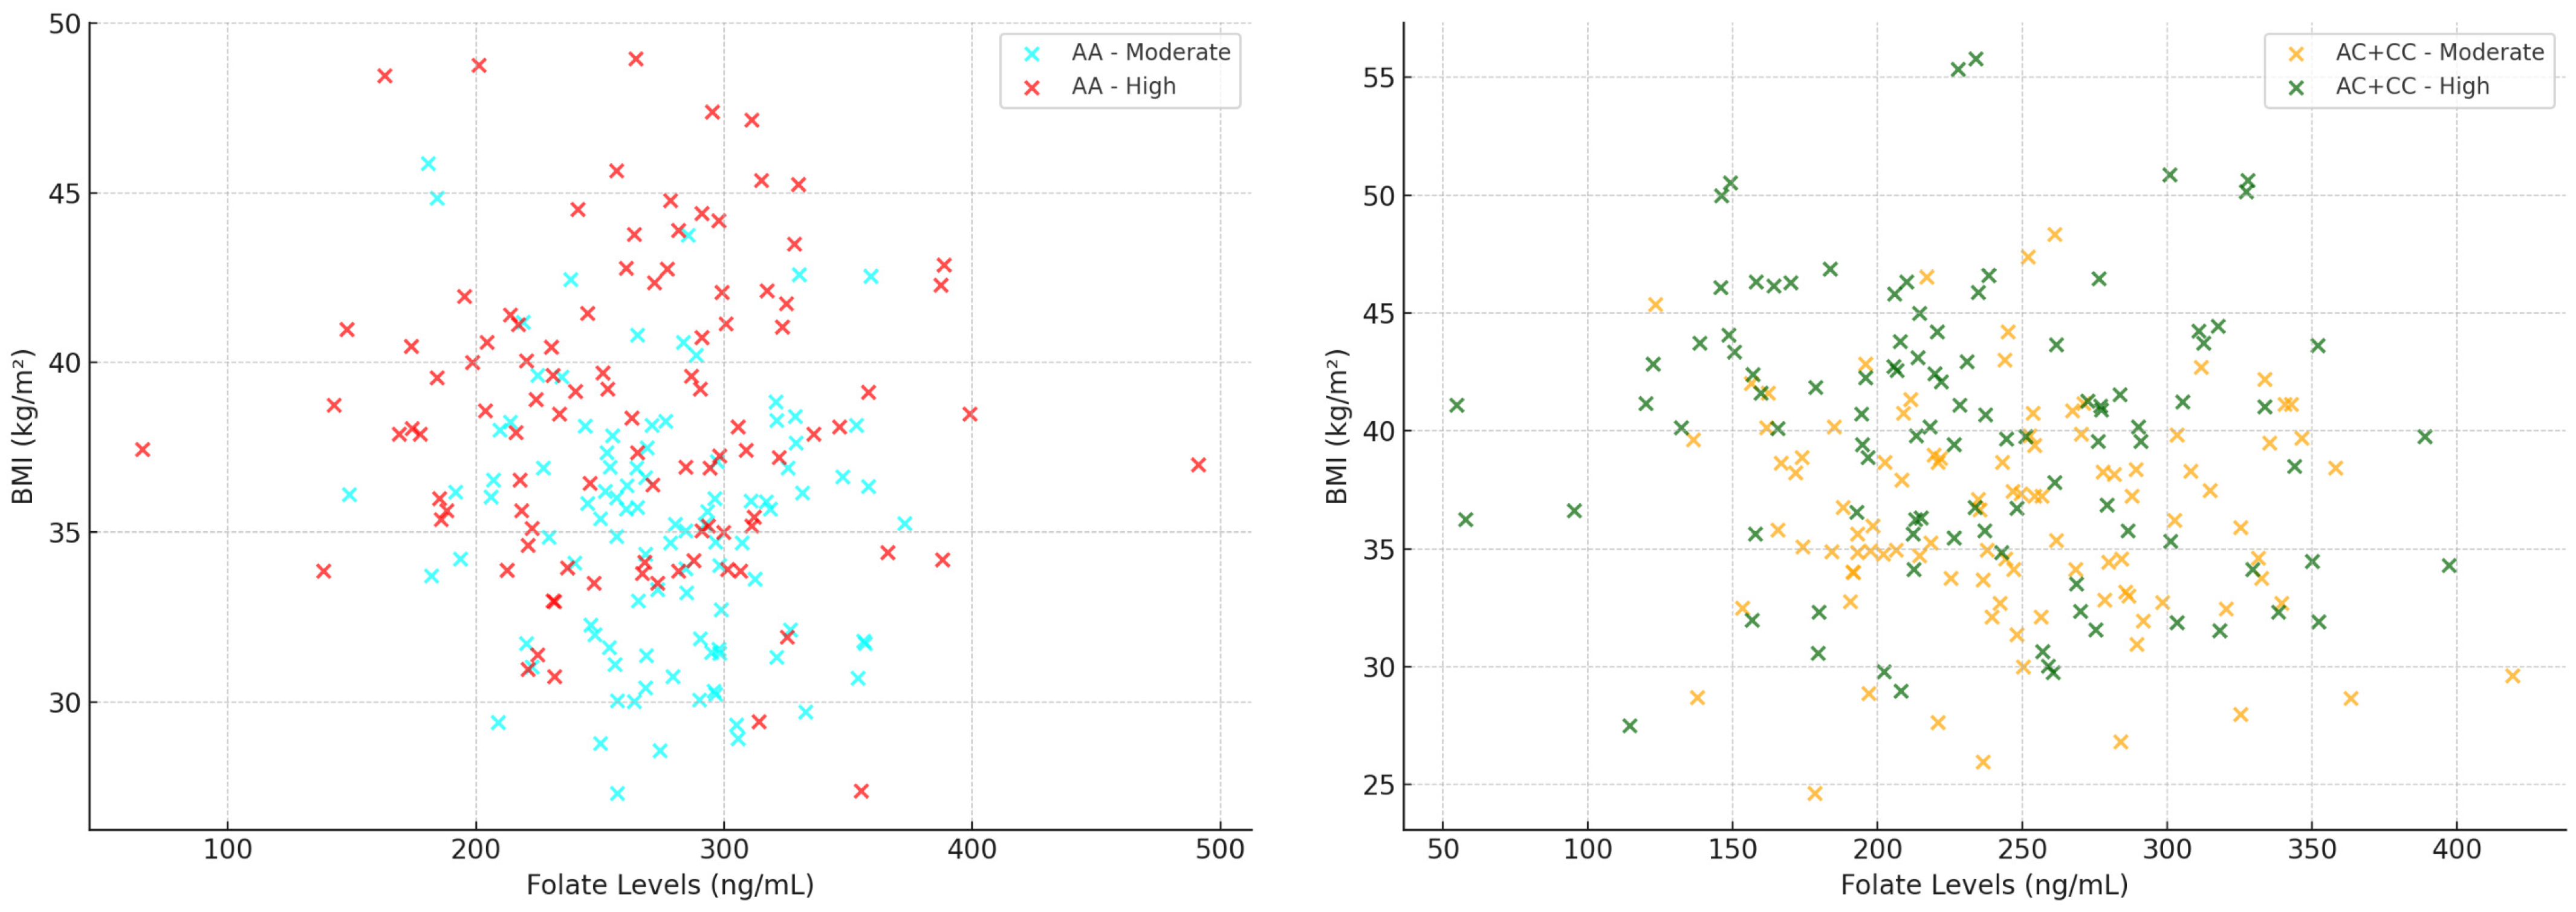
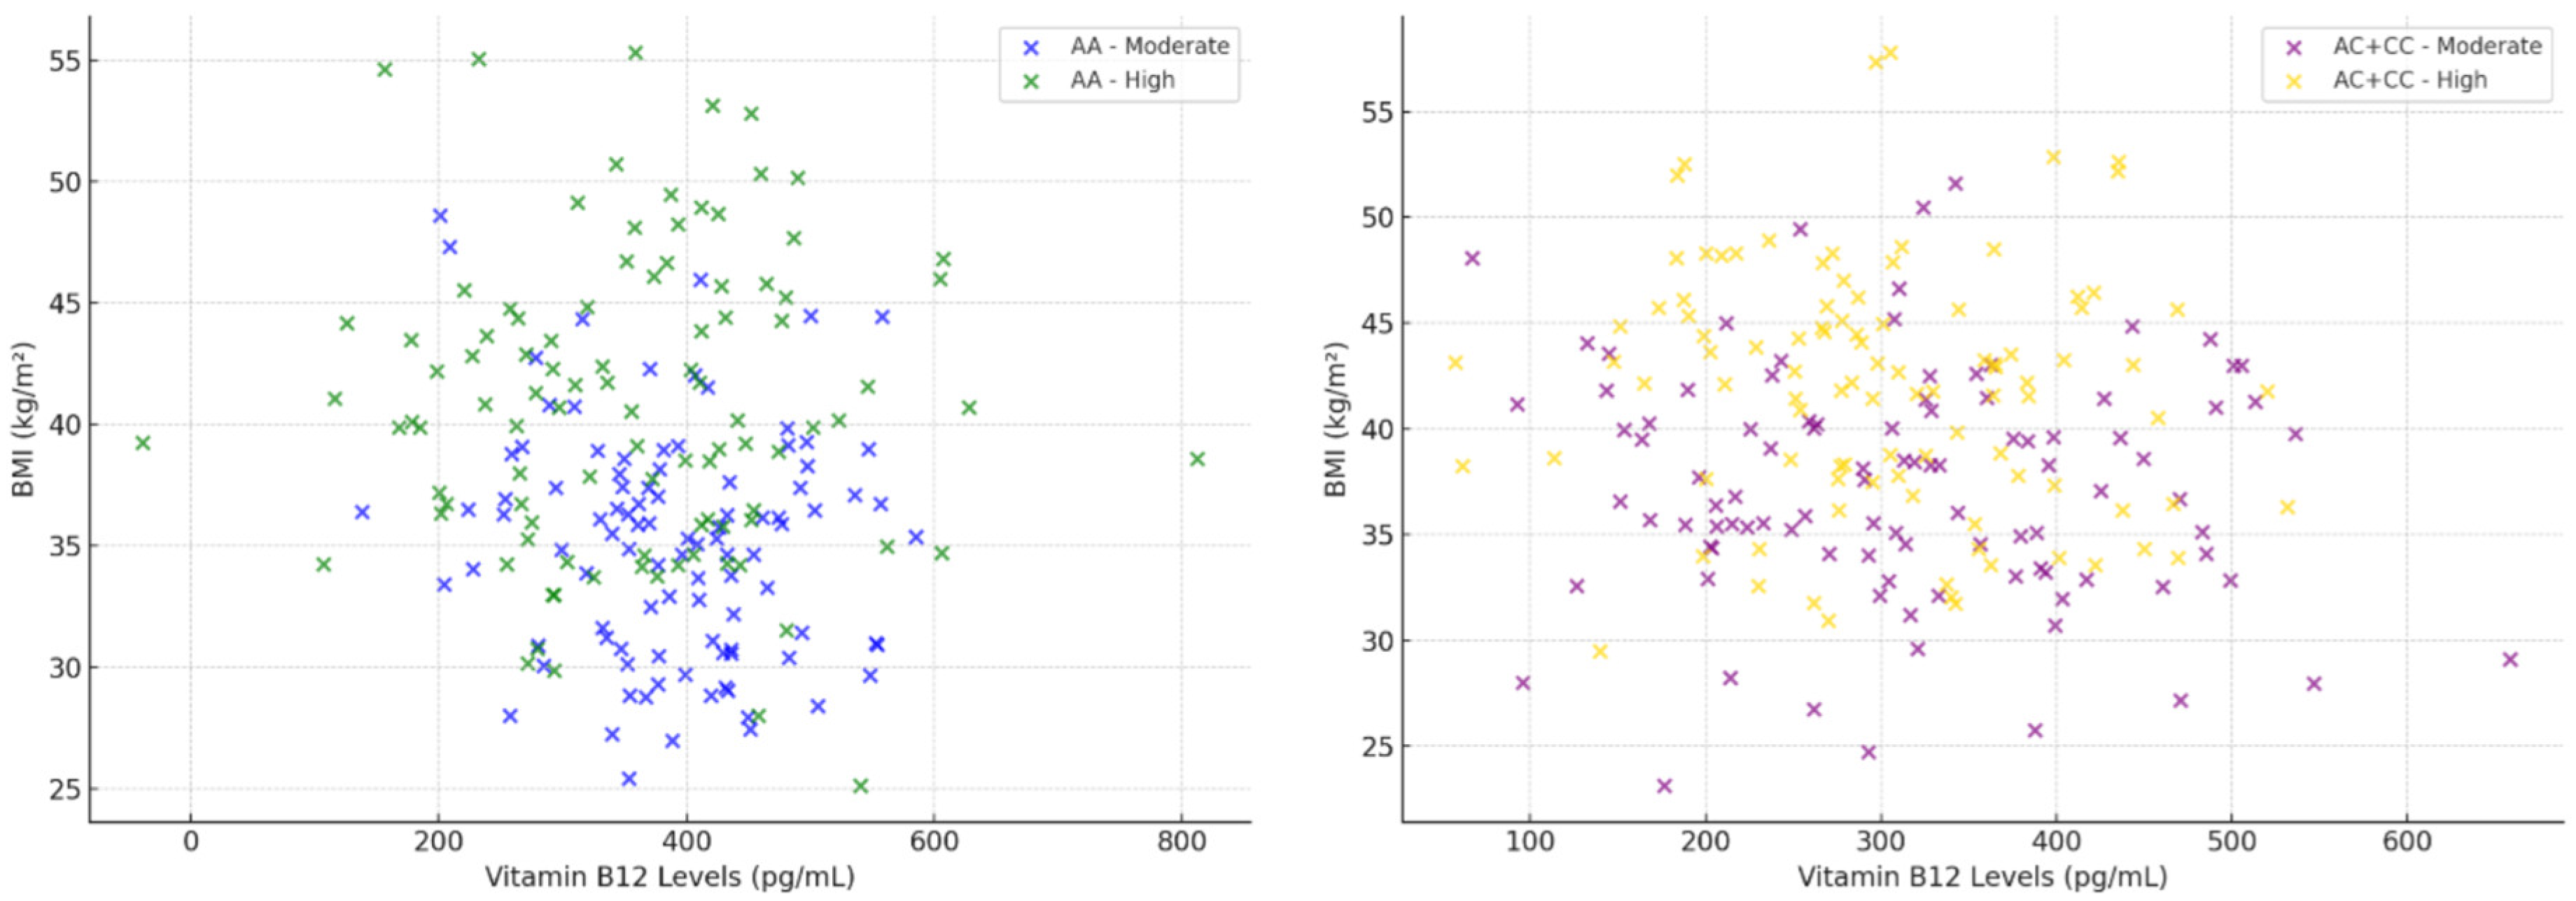
| Coffee Consumption | Combined CYP1A2 Genotype | Folate Correlation (r) | p-Value Folate | B12 Correlation (r) | p-Value B12 |
|---|---|---|---|---|---|
| Moderate (1–2 cups/day) | AA | 0.284 | 0.015 | 0.253 | 0.032 |
| Moderate (1–2 cups/day) | AC + CC | 0.149 | 0.130 | 0.107 | 0.291 |
| High (≥3 cups/day) | AA | 0.123 | 0.243 | 0.098 | 0.332 |
| High (≥3 cups/day) | AC + CC | 0.083 | 0.409 | 0.051 | 0.604 |
| Predictor | β Coefficient | Std. Error | p-Value | Significance |
|---|---|---|---|---|
| Main effects | ||||
| Genotype (AA vs. AC + CC) | 0.15 | 0.07 | 0.032 | Yes |
| Coffee Consumption (Moderate vs. High) | −0.18 | 0.08 | 0.027 | Yes |
| Folate (ng/mL) | −0.035 | 0.01 | 0.001 | Yes |
| Vitamin B12 (pg/mL) | −0.022 | 0.009 | 0.015 | Yes |
| Interactions (2-way) | ||||
| Genotype × Coffee Consumption | 0.125 | 0.065 | 0.049 | Yes |
| Genotype × Folate | −0.018 | 0.008 | 0.025 | Yes |
| Genotype × Vitamin B12 | −0.012 | 0.007 | 0.097 | No |
| Coffee Consumption × Folate | −0.024 | 0.009 | 0.012 | Yes |
| Coffee Consumption × Vitamin B12 | −0.015 | 0.008 | 0.068 | No |
| Interactions (3-way) | ||||
| Genotype × Coffee Consumption × Folate | 0.011 | 0.006 | 0.081 | No |
| Genotype × Coffee Consumption × Vitamin B12 | 0.008 | 0.005 | 0.120 | No |
Disclaimer/Publisher’s Note: The statements, opinions and data contained in all publications are solely those of the individual author(s) and contributor(s) and not of MDPI and/or the editor(s). MDPI and/or the editor(s) disclaim responsibility for any injury to people or property resulting from any ideas, methods, instructions or products referred to in the content. |
© 2025 by the authors. Licensee MDPI, Basel, Switzerland. This article is an open access article distributed under the terms and conditions of the Creative Commons Attribution (CC BY) license (https://creativecommons.org/licenses/by/4.0/).
Share and Cite
Popa, L.C.; Abu-Awwad, A.; Farcas, S.S.; Abu-Awwad, S.-A.; Andreescu, N.I. Interaction Between CYP1A2-Related Caffeine Metabolism and Vitamin B12/Folate Status in Patients with Metabolic Syndrome: A Novel Biomarker Axis. Metabolites 2025, 15, 450. https://doi.org/10.3390/metabo15070450
Popa LC, Abu-Awwad A, Farcas SS, Abu-Awwad S-A, Andreescu NI. Interaction Between CYP1A2-Related Caffeine Metabolism and Vitamin B12/Folate Status in Patients with Metabolic Syndrome: A Novel Biomarker Axis. Metabolites. 2025; 15(7):450. https://doi.org/10.3390/metabo15070450
Chicago/Turabian StylePopa, Laura Claudia, Ahmed Abu-Awwad, Simona Sorina Farcas, Simona-Alina Abu-Awwad, and Nicoleta Ioana Andreescu. 2025. "Interaction Between CYP1A2-Related Caffeine Metabolism and Vitamin B12/Folate Status in Patients with Metabolic Syndrome: A Novel Biomarker Axis" Metabolites 15, no. 7: 450. https://doi.org/10.3390/metabo15070450
APA StylePopa, L. C., Abu-Awwad, A., Farcas, S. S., Abu-Awwad, S.-A., & Andreescu, N. I. (2025). Interaction Between CYP1A2-Related Caffeine Metabolism and Vitamin B12/Folate Status in Patients with Metabolic Syndrome: A Novel Biomarker Axis. Metabolites, 15(7), 450. https://doi.org/10.3390/metabo15070450