1. Introduction
Thesium chinense Turcz. (
T. chinense Turcz.), long valued for centuries in traditional Chinese medicine (TCM) for its heat-clearing, detoxifying, kidney-nourishing, and essence-securing properties, is documented in classical texts like the
Compendium of Materia Medica for its use in treating inflammation, infections, and skin conditions [
1,
2]. Modern formulations (e.g., Bairui tablets) leverage its bioactive compounds—including flavonoids (potent antioxidants), alkaloids (broad antimicrobials), coumarins, and polysaccharides—to combat respiratory infections and pharyngitis. These compounds underpin its anti-inflammatory, antimicrobial, antioxidant, and immunomodulatory activities, working through mechanisms like oxidative stress alleviation, ferroptosis inhibition, and inflammatory factor modulation [
3,
4].
Modern metabolomics platforms, particularly ultra-performance liquid chromatography-quadrupole time-of-flight mass spectrometry (UHPLC-Q-TOF/MS), have revolutionized the study of medicinal plants like
T. chinense Turcz., enabling the high-throughput detection of hundreds of metabolites and providing unprecedented insights into their chemical diversity [
5]. These advancements have also started to transform empirical concepts like “geo-authenticity” into scientifically assessable frameworks, grounded in molecular markers, component networks, pathway regulation, and mechanisms of environmental adaptation [
6]. Geo-authenticity is the principle that herbs cultivated in specific geographical regions exhibit superior quality and efficacy due to the influence of unique environmental conditions.
Despite the growing body of research on the chemical constituents of T. chinense Turcz., significant knowledge gaps remain regarding the geographical variation of this species and its direct impact on chemical composition, bioactivity, and, ultimately, therapeutic efficacy and quality.
Current studies predominantly focus on established geo-authentic regions such as Anhui and Henan, often employing limited analytical strategies, such as single-component quantification (e.g., HPLC for rutin), without comprehensive multi-regional comparisons [
7]. While some studies suggest that Anhui-sourced material may contain higher levels of saccharides, saponins, and flavonoids due to local climate and soil conditions [
8], a systematic understanding of the mechanisms underlying geo-authenticity and the stability of key bioactive components across major production regions is lacking. This gap fundamentally hinders robust quality control, reliable clinical application, and effective market authentication.
Moreover, conventional chemometric methods like principal component analysis (PCA) are often inadequate for deciphering the complex, nonlinear relationships inherent in modern metabolomic datasets. These methods frequently fail to accurately identify region-specific core biomarkers or to quantify the intricate relationships between environmental factors, metabolites, and bioactivity that are crucial for understanding geo-authenticity [
9]. Compounding this issue is the notable absence of systematic studies validating how specific climatic factors—such as temperature variability and precipitation patterns—along with altitude and soil properties, influence the biosynthesis of pharmacologically vital compounds, including alkaloids and flavonoids [
10], across diverse geographical populations of
T. chinense Turcz.
To address these critical gaps, this study employs an integrated approach that combines advanced metabolomics, climate response analysis, and bioactivity testing specifically targeting T. chinense Turcz. from three major production areas recognized for their geo-authenticity: Anhui, Henan, and Shanxi. Samples were systematically collected from multiple localities within each province, accompanied by detailed environmental data. UPLC-QTOF-MS analysis was utilized to generate comprehensive chemical profiles and identify region-discriminating metabolites. Sophisticated machine learning algorithms, including Random Forest (RF) and Least Absolute Shrinkage and Selection Operator (LASSO), were applied to screen for robust, region-specific core biomarkers from the complex metabolomic data. Additionally, the antioxidant capacity (DPPH and hydroxyl radical scavenging activity) of samples from each region was quantitatively assessed. Redundancy analysis (RDA) and Pearson correlation were then employed to elucidate the quantitative relationships between the identified environmental variables (e.g., mean annual temperature, precipitation seasonality), the relative abundance of key metabolites, and the measured antioxidant activities.
This research represents a pioneering systematic effort to establish a traceable, geo-specific molecular marker system for T. chinense Turcz. across its primary production regions. By directly linking environmental factors to specific chemical profiles and bioactivities, this study aims to fill the theoretical and data gaps concerning geographical adaptation and molecular tracing. The findings are expected to significantly enhance our scientific understanding of Chinese geo-authentic herbs, ultimately paving the way for improved quality control protocols, reliable standardization practices, and informed conservation strategies for T. chinense Turcz.
4. Discussion
This study systematically elucidates the geographical differentiation patterns of secondary metabolites in T. chinense Turcz. from Anhui, Henan, and Shanxi Provinces in China, as well as the underlying interaction mechanisms with ecological environmental factors, through the integration of multidimensional analytical methods. The metabolomic analysis based on LC-MS combined with machine learning algorithms not only confirms the decisive role of geographical environments in shaping the chemical characteristics of medicinal plants, as proposed by the traditional “geo-authentic herbs” theory, but also provides a quantifiable biomarker screening strategy for modern quality control systems of traditional Chinese medicine (TCM). The findings reveal the molecular mechanisms by which complex ecological factors regulate key metabolic pathways to influence plant chemical phenotypes, offering new theoretical insights into the environmental adaptability and evolutionary processes of medicinal plants.
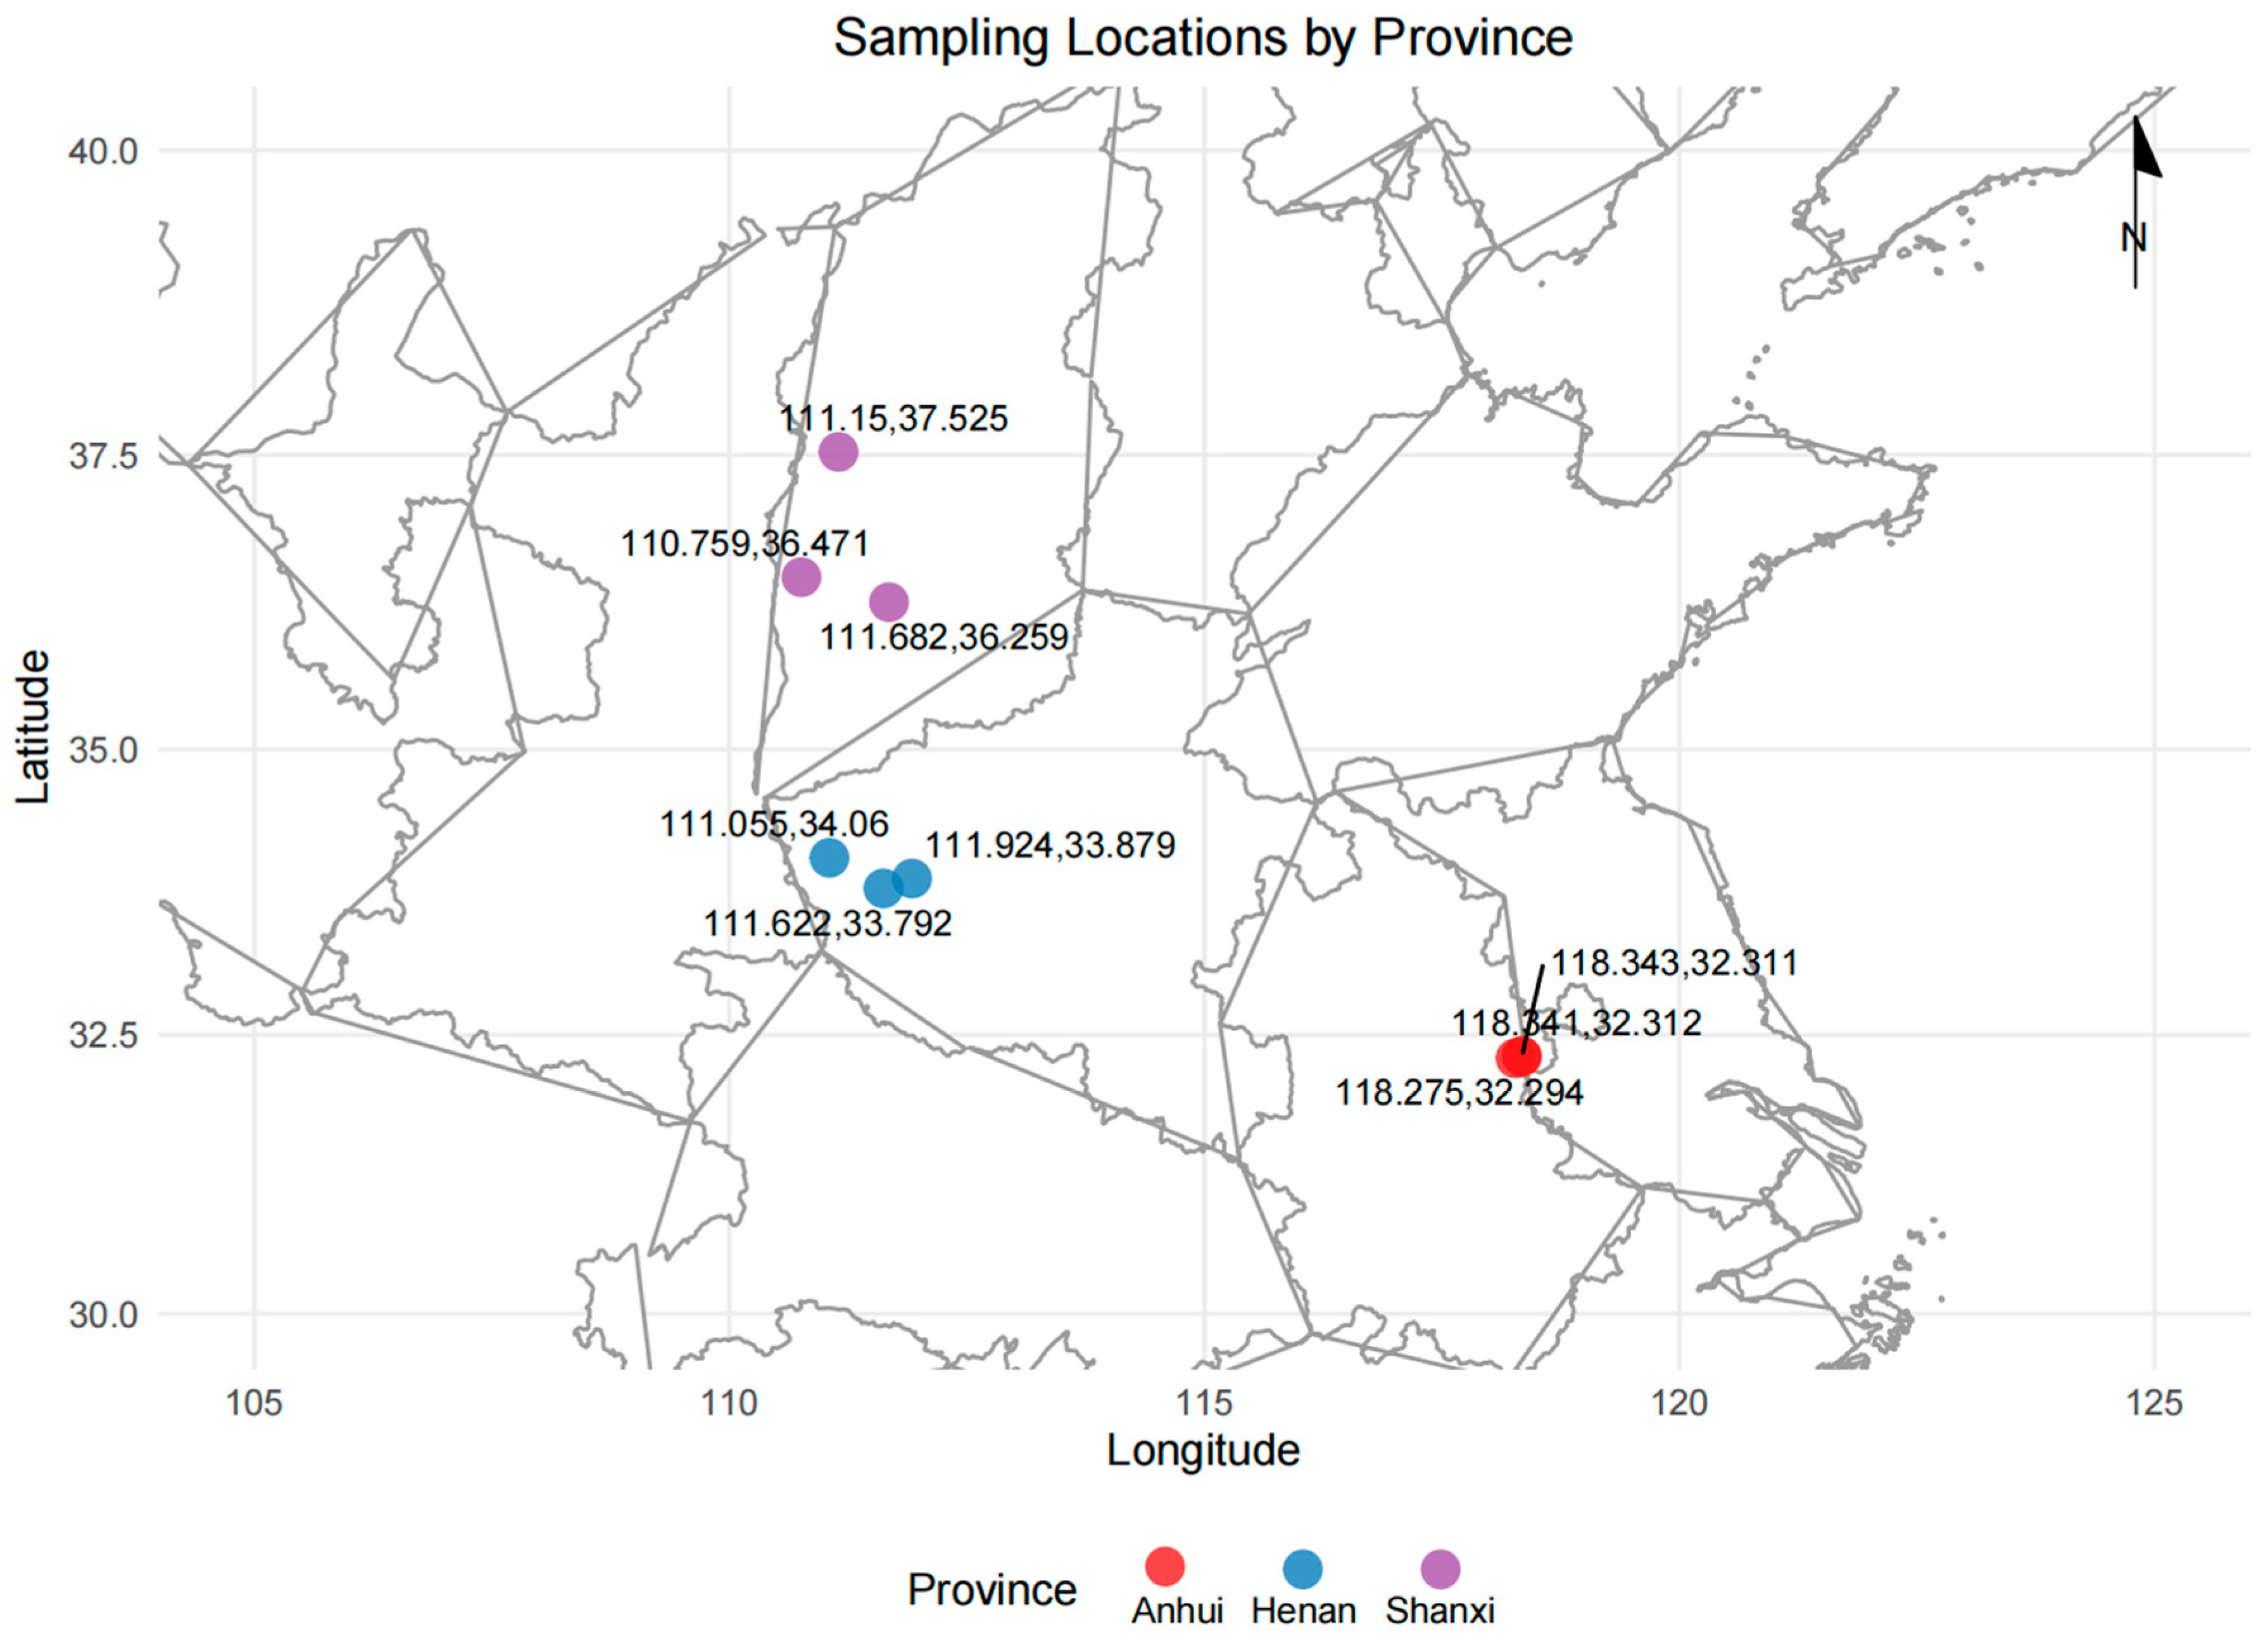
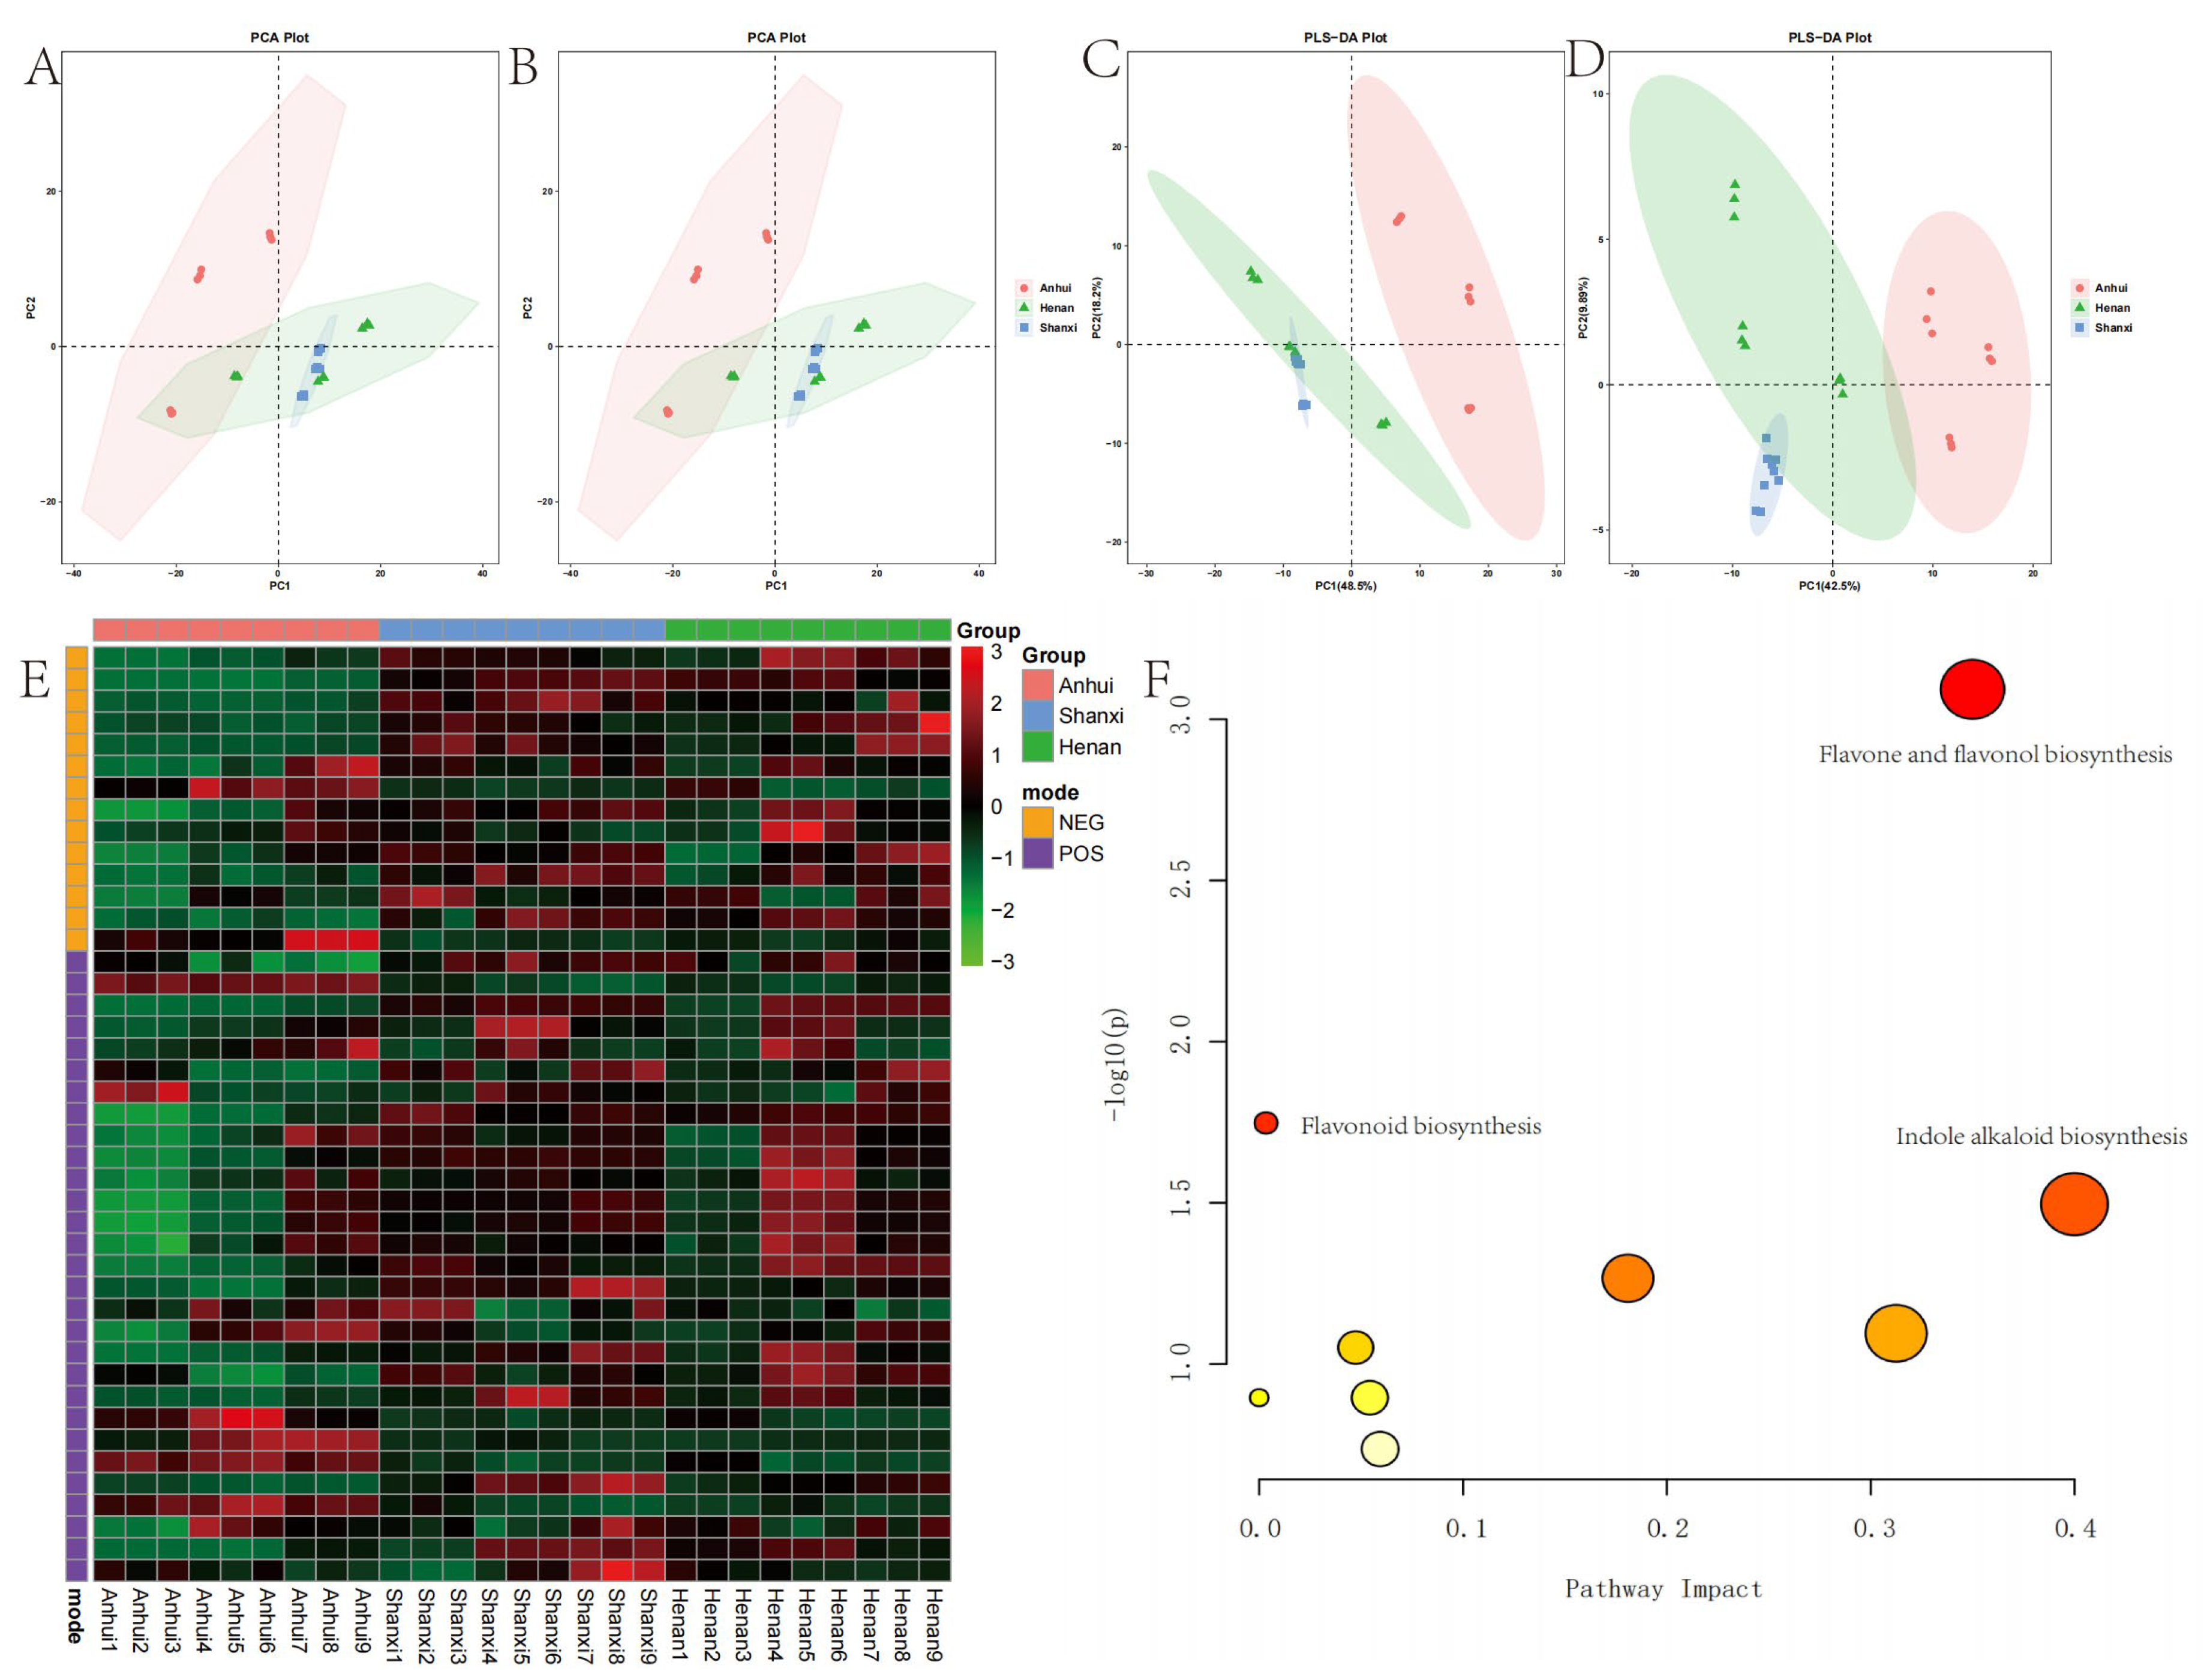
The metabolomic analysis conducted in both positive and negative ion modes detected a total of 506 secondary metabolites, with 289 identified in positive ion mode and 217 in negative ion mode. PCA demonstrated a gradient distribution pattern of samples from the three production regions in the metabolic space. Samples from Henan and Shanxi partially overlapped along the PC1 and PC2 axes, indicating that shared ecological pressures or genetic homogeneity in these adjacent regions, consistent with reports on geographically proximate plant populations exhibiting convergent metabolic traits. From a climatic perspective, the sample collection sites in Anhui Province are situated south of the North–South climatic boundary, corresponding to a subtropical monsoon climate regime. In contrast, Henan and Shanxi Provinces are characterized by temperate monsoon climate conditions, characterized by comparable temperature ranges and precipitation patterns, which may homogenize flavonoid and alkaloid biosynthesis [
21,
22,
23]. Notably, samples from Anhui exhibited distinct spatial clustering in positive ion mode, clearly distinguishing them from other regions. PLS-DA further validated these findings. This observation aligns with previous studies demonstrating that environmental factors such as altitude, temperature, and soil properties significantly influence secondary metabolite biosynthesis in medicinal plants.
The heatmap and enrichment analysis further identified 43 differential metabolites, dominated by flavonoids [
19], alkaloids [
12], and phenylpropanoids [
8], and ten enriched pathways, with flavone/flavonol biosynthesis ranking highest. Flavonoids are well-documented for their antioxidant, anti-inflammatory, and neuroprotective properties [
24,
25,
26], which correlate with the traditional use of
T. chinense Turcz. in treating inflammatory disorders. The prominence of indole alkaloid pathways is equally significant, as these compounds exhibit antitumor and antimicrobial activities. Interestingly, the bidirectional regulation of kaempferol glycosides (e.g., kaempferol 7-neohesperidoside vs. kaempferol 3-O-beta-sophoroside) in Anhui samples implies tissue-specific enzymatic modifications, possibly influenced by regional soil micronutrients such as zinc or selenium, which modulate glycosyltransferase activity. This phenomenon underscores the plasticity of plant secondary metabolism in adapting to localized environmental cues, a phenomenon documented in other medicinal plants [
27] such as Ginkgo biloba.
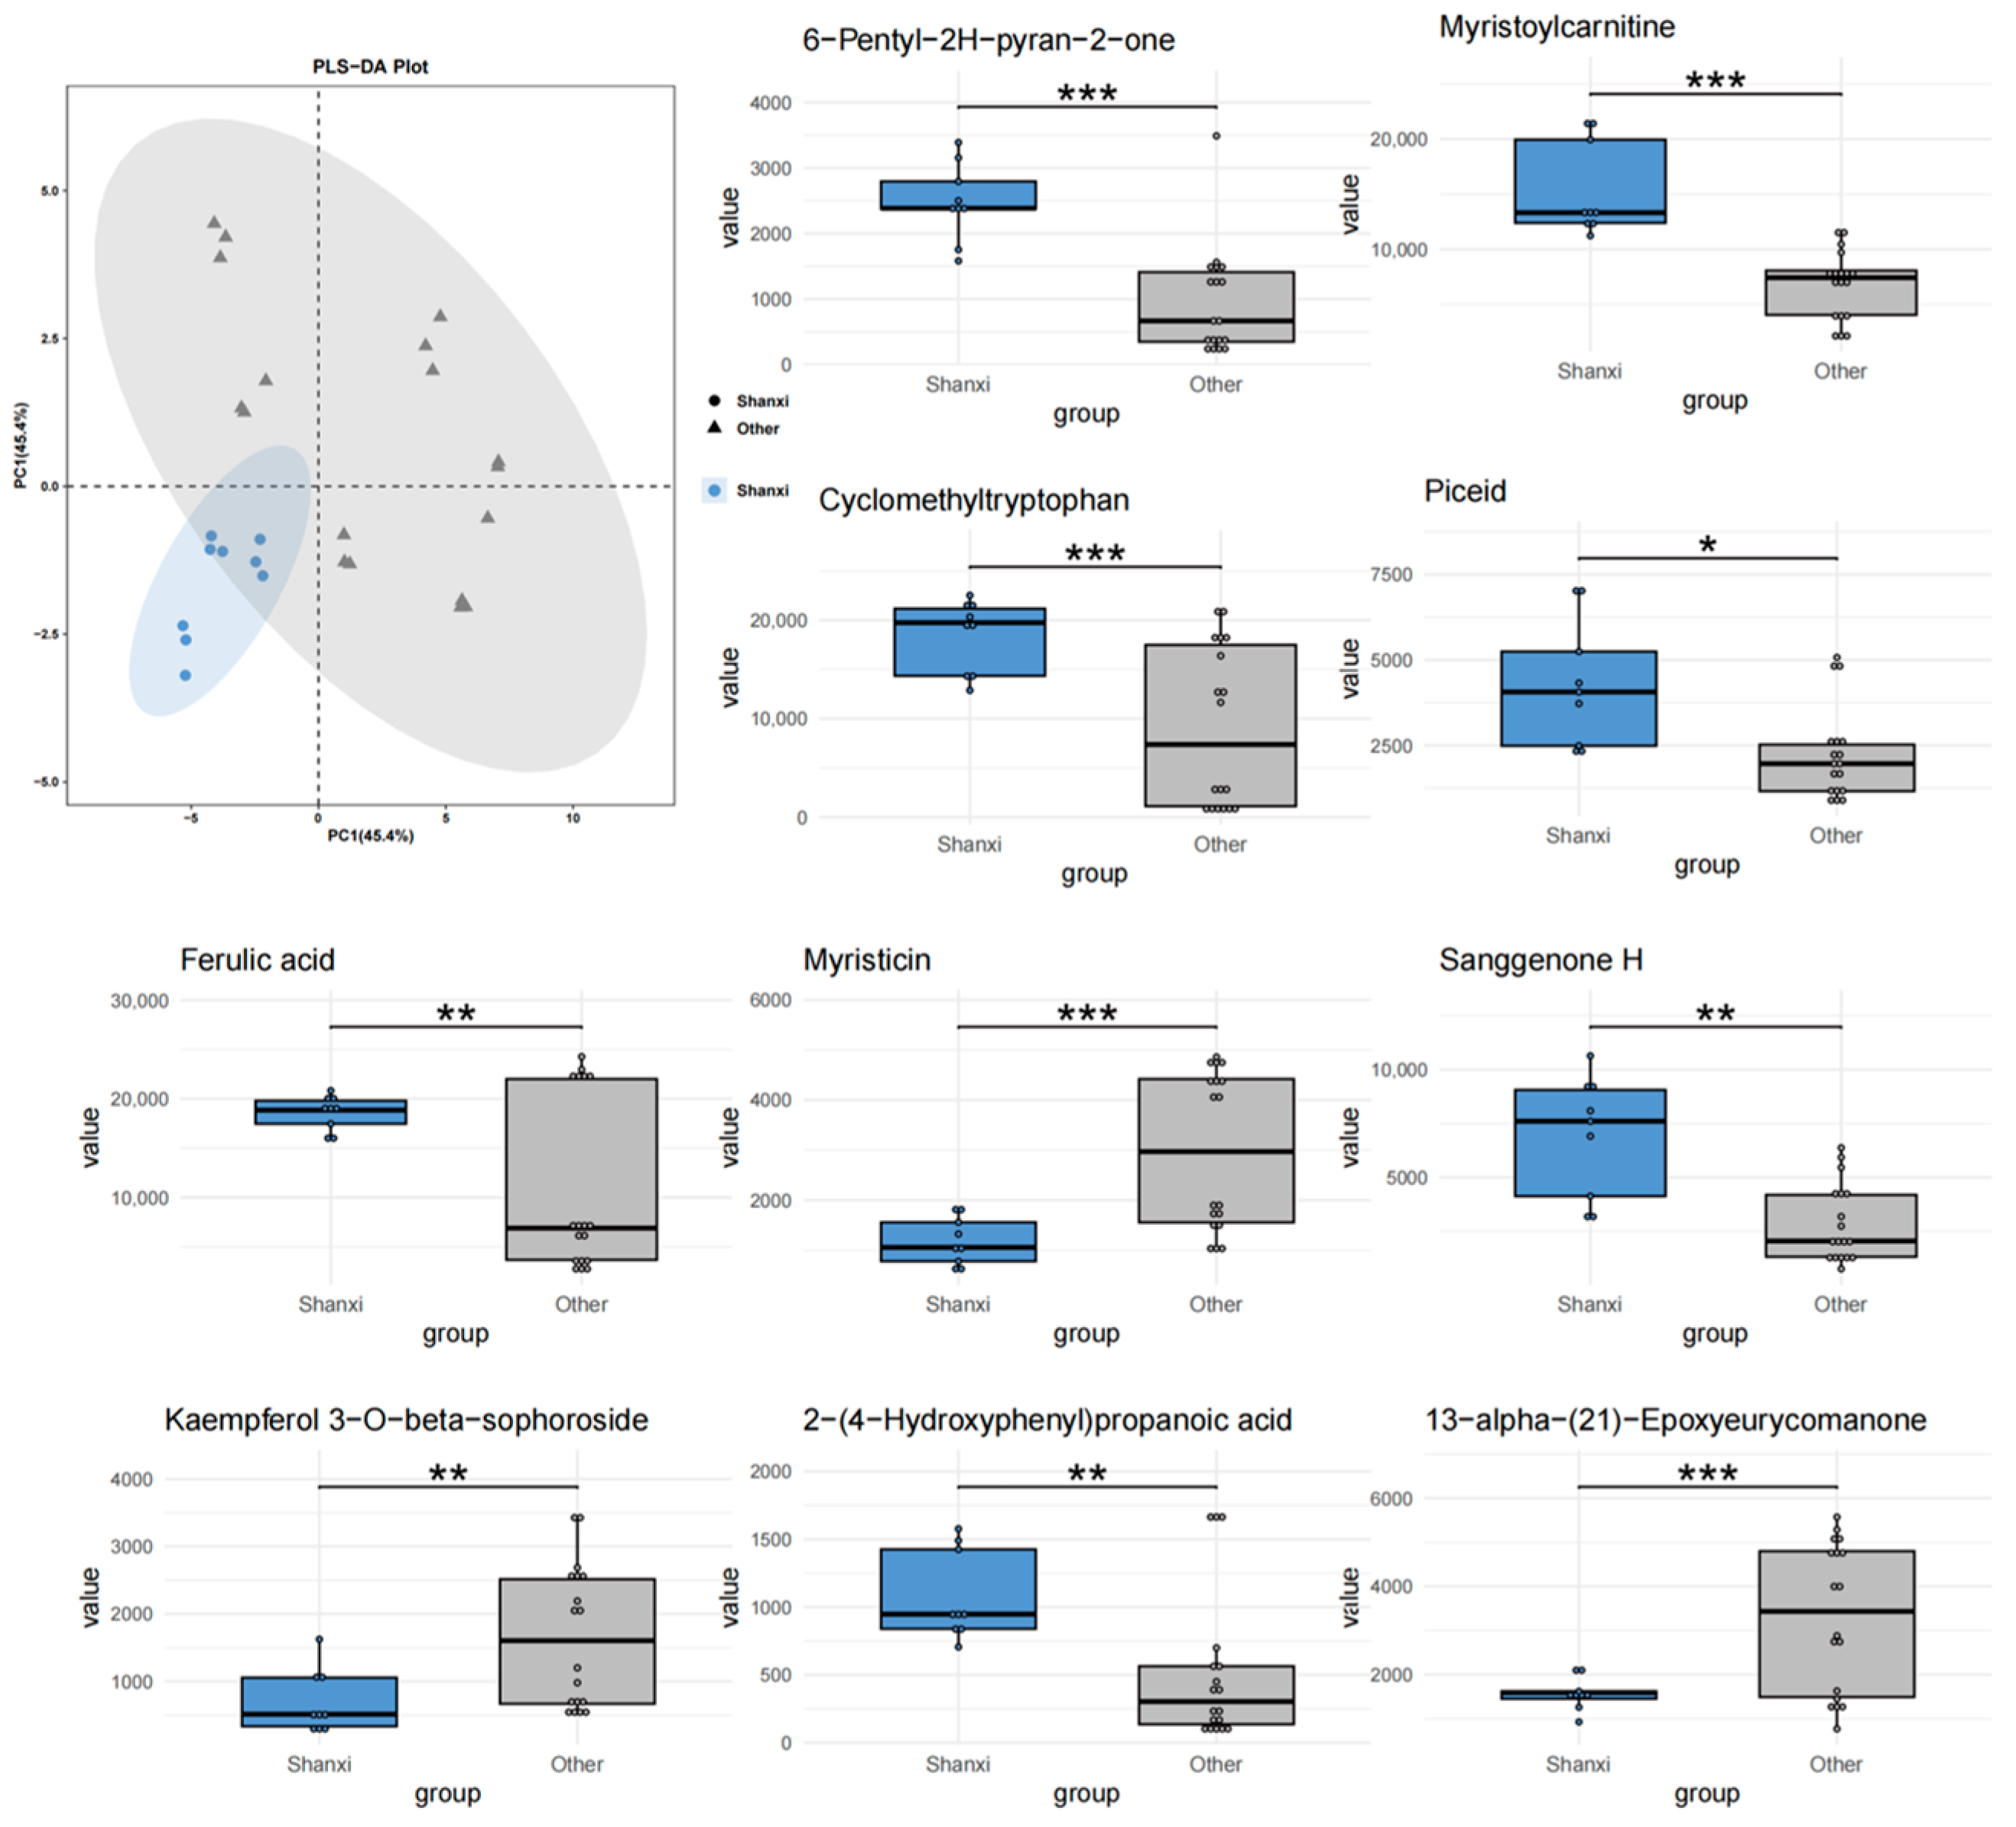
The comparative PLS-DA models (Anhui vs. others, Shanxi vs. others, Henan vs. others) and metabolite set enrichment analysis identified distinct regional metabolic signatures, with Anhui samples exhibiting the most unique chemical characteristics. Myristicin—a phenylpropene with known acetylcholinesterase inhibitory effects [
28]—was enriched in Anhui but downregulated in Shanxi. This contrast may reflect differences in soil nitrogen availability, as phenylpropanoid biosynthesis is nitrogen-dependent [
29]. Similarly, the reversal of ferulic acid trends between Anhui (downregulated) and Shanxi (upregulated) could be attributed to ultraviolet (UV) radiation intensity, which stimulates ferulic acid synthesis as a photoprotective mechanism [
30]. Shanxi’s higher altitude and stronger UV exposure align with this hypothesis. Glechomafuran and Cyclomethyltryptophan were downregulated in Anhui samples but upregulated in Shanxi populations. This cross-regional expression divergence likely reflects adaptive responses to local climatic conditions, particularly temperature fluctuations and precipitation patterns. Similar geographical regulation of secondary metabolites has been observed in Saussurea involucrata leaves, where low-temperature environments enhance phenolic compound accumulation [
31]. The reverse regulation of 6-Pentyl-2H-pyran-2-one in the Anhui and Shanxi samples highlights the complexity of ecological adaptation. This compound, known for its antimicrobial properties [
32], may serve as a stress-response metabolite under contrasting environmental pressures. The isomer-specific regulation of kaempferol glycosides further highlights the role of environmental factors in steering metabolic branching. The 82% decrease in kaempferol 7-neohesperidoside and 3.2-fold increase in its isomer in Anhui samples suggest that temperature fluctuations may influence glycosyltransferase specificity. Additionally, the consistent significance of 13-alpha-(21)-Epoxyeurycomanone across all regions positions it as a universal biomarker for
T. chinense Turcz.
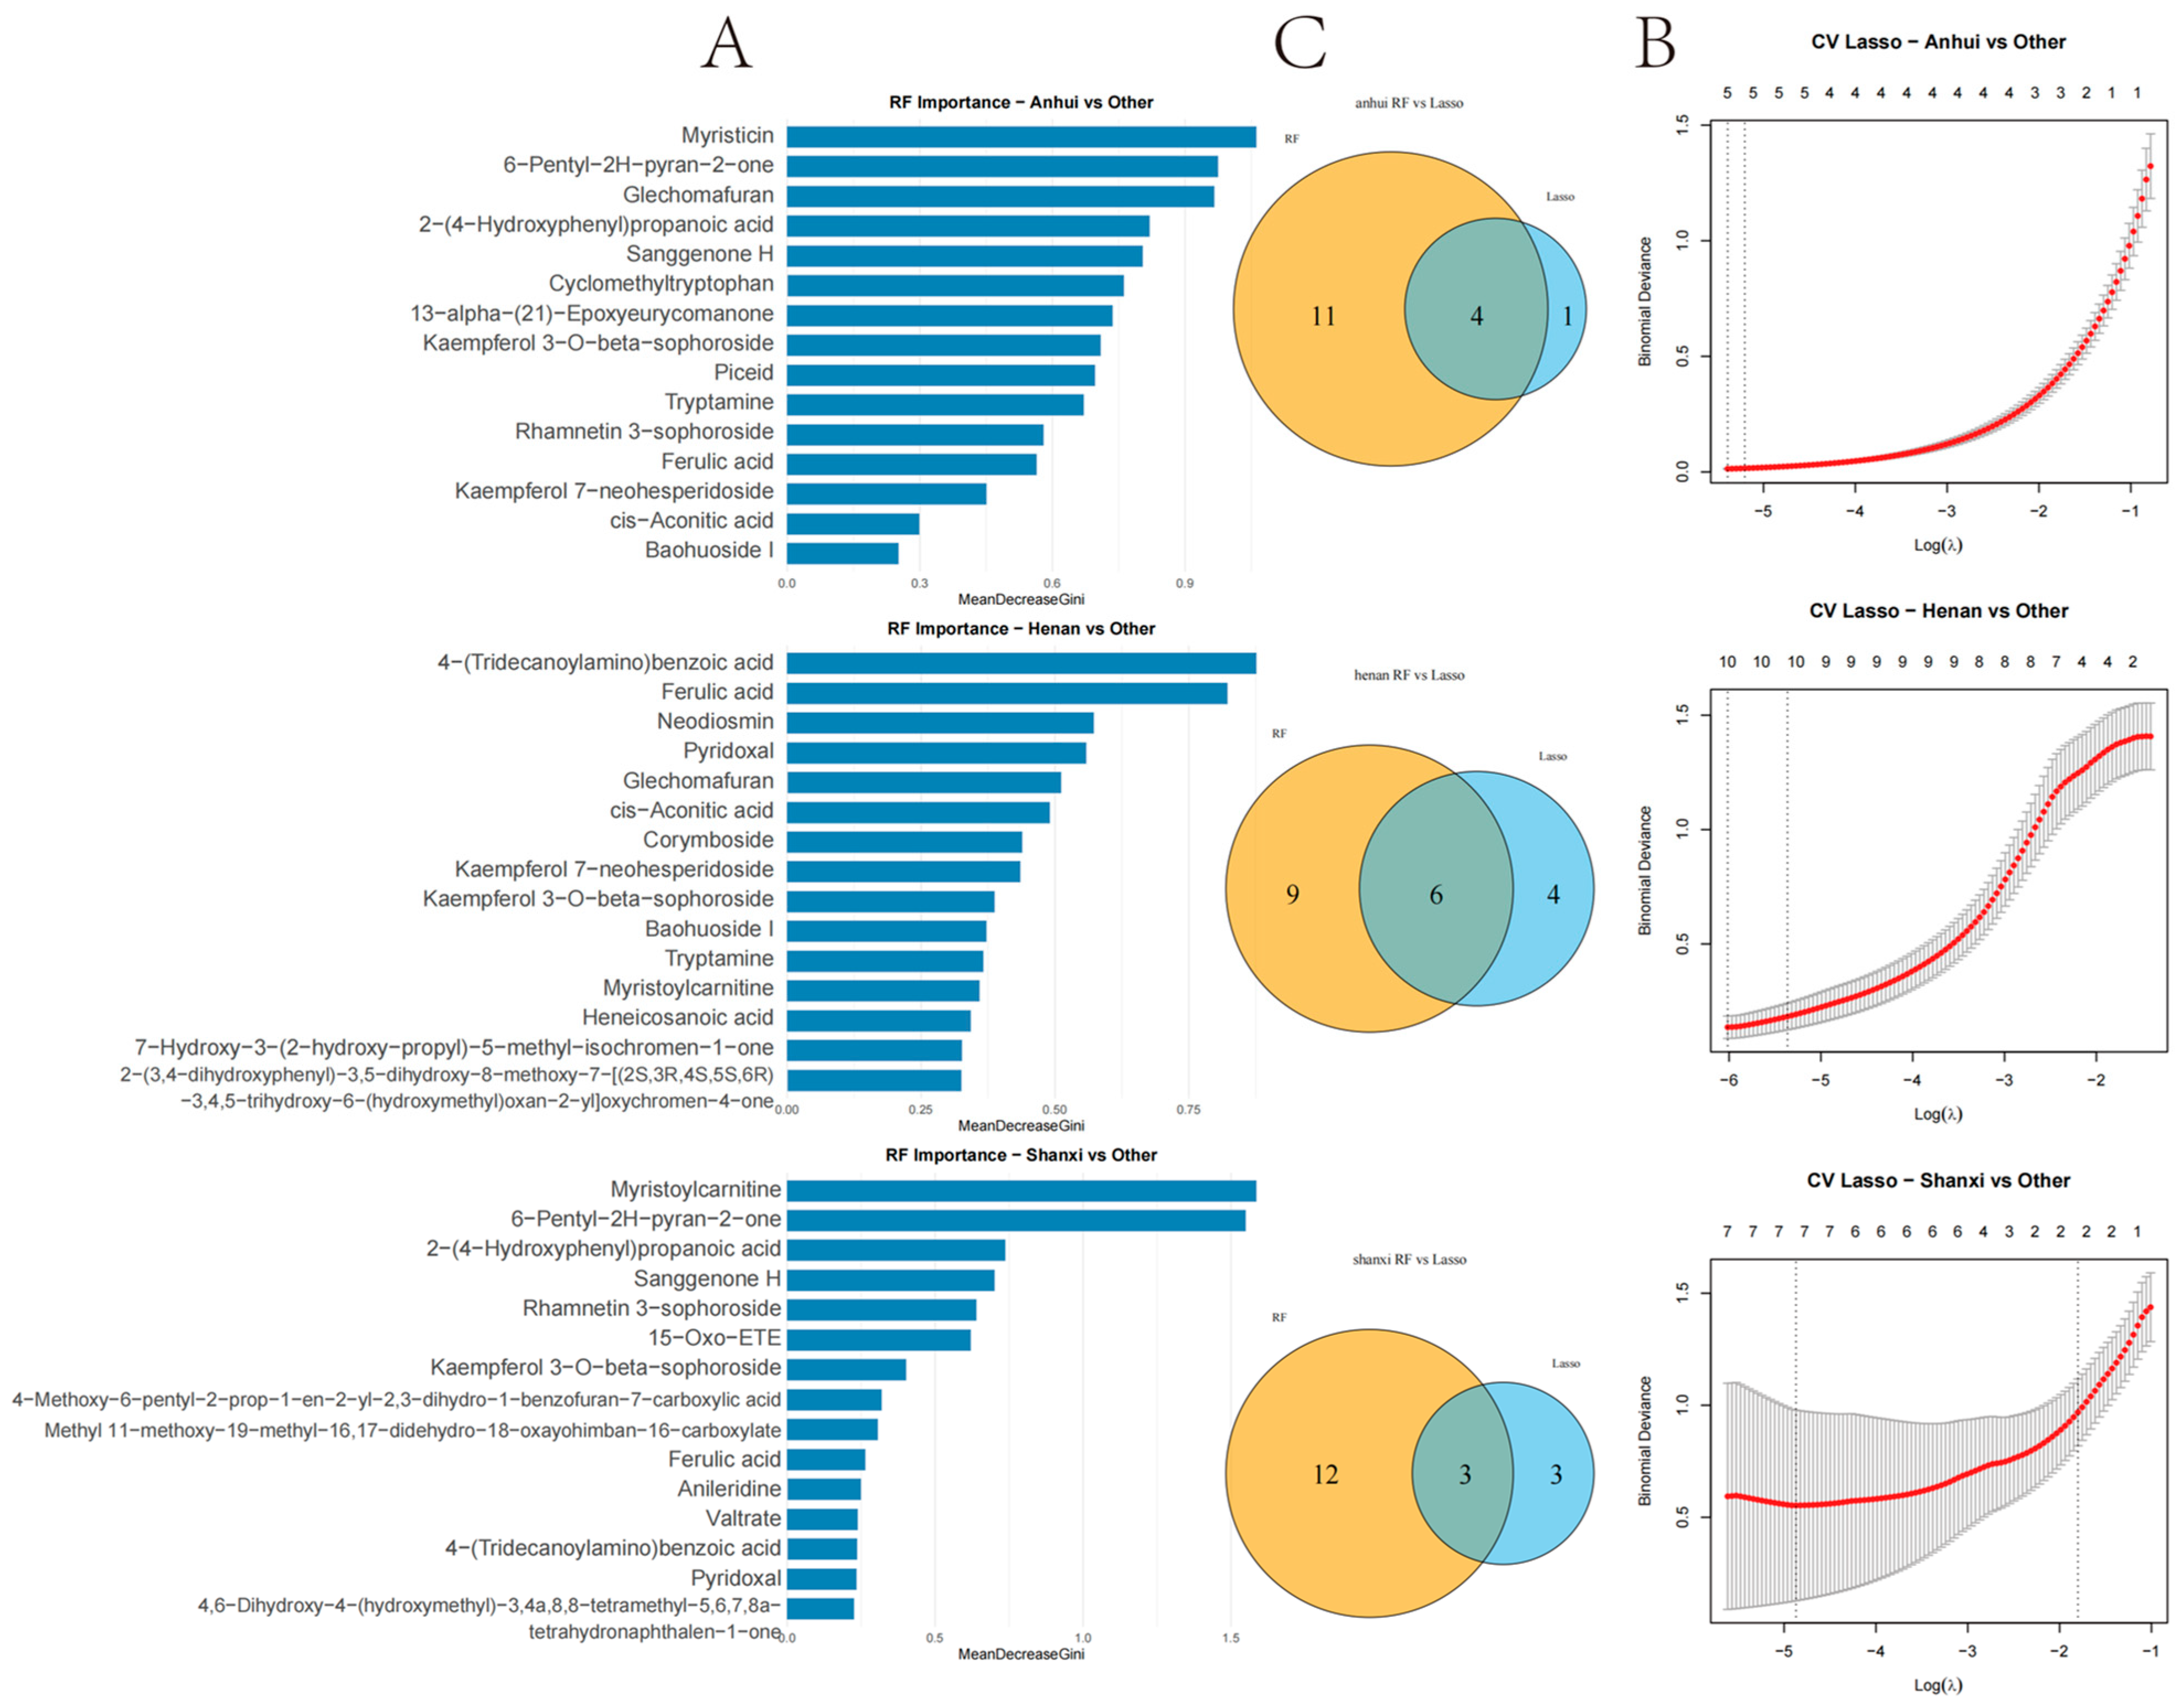
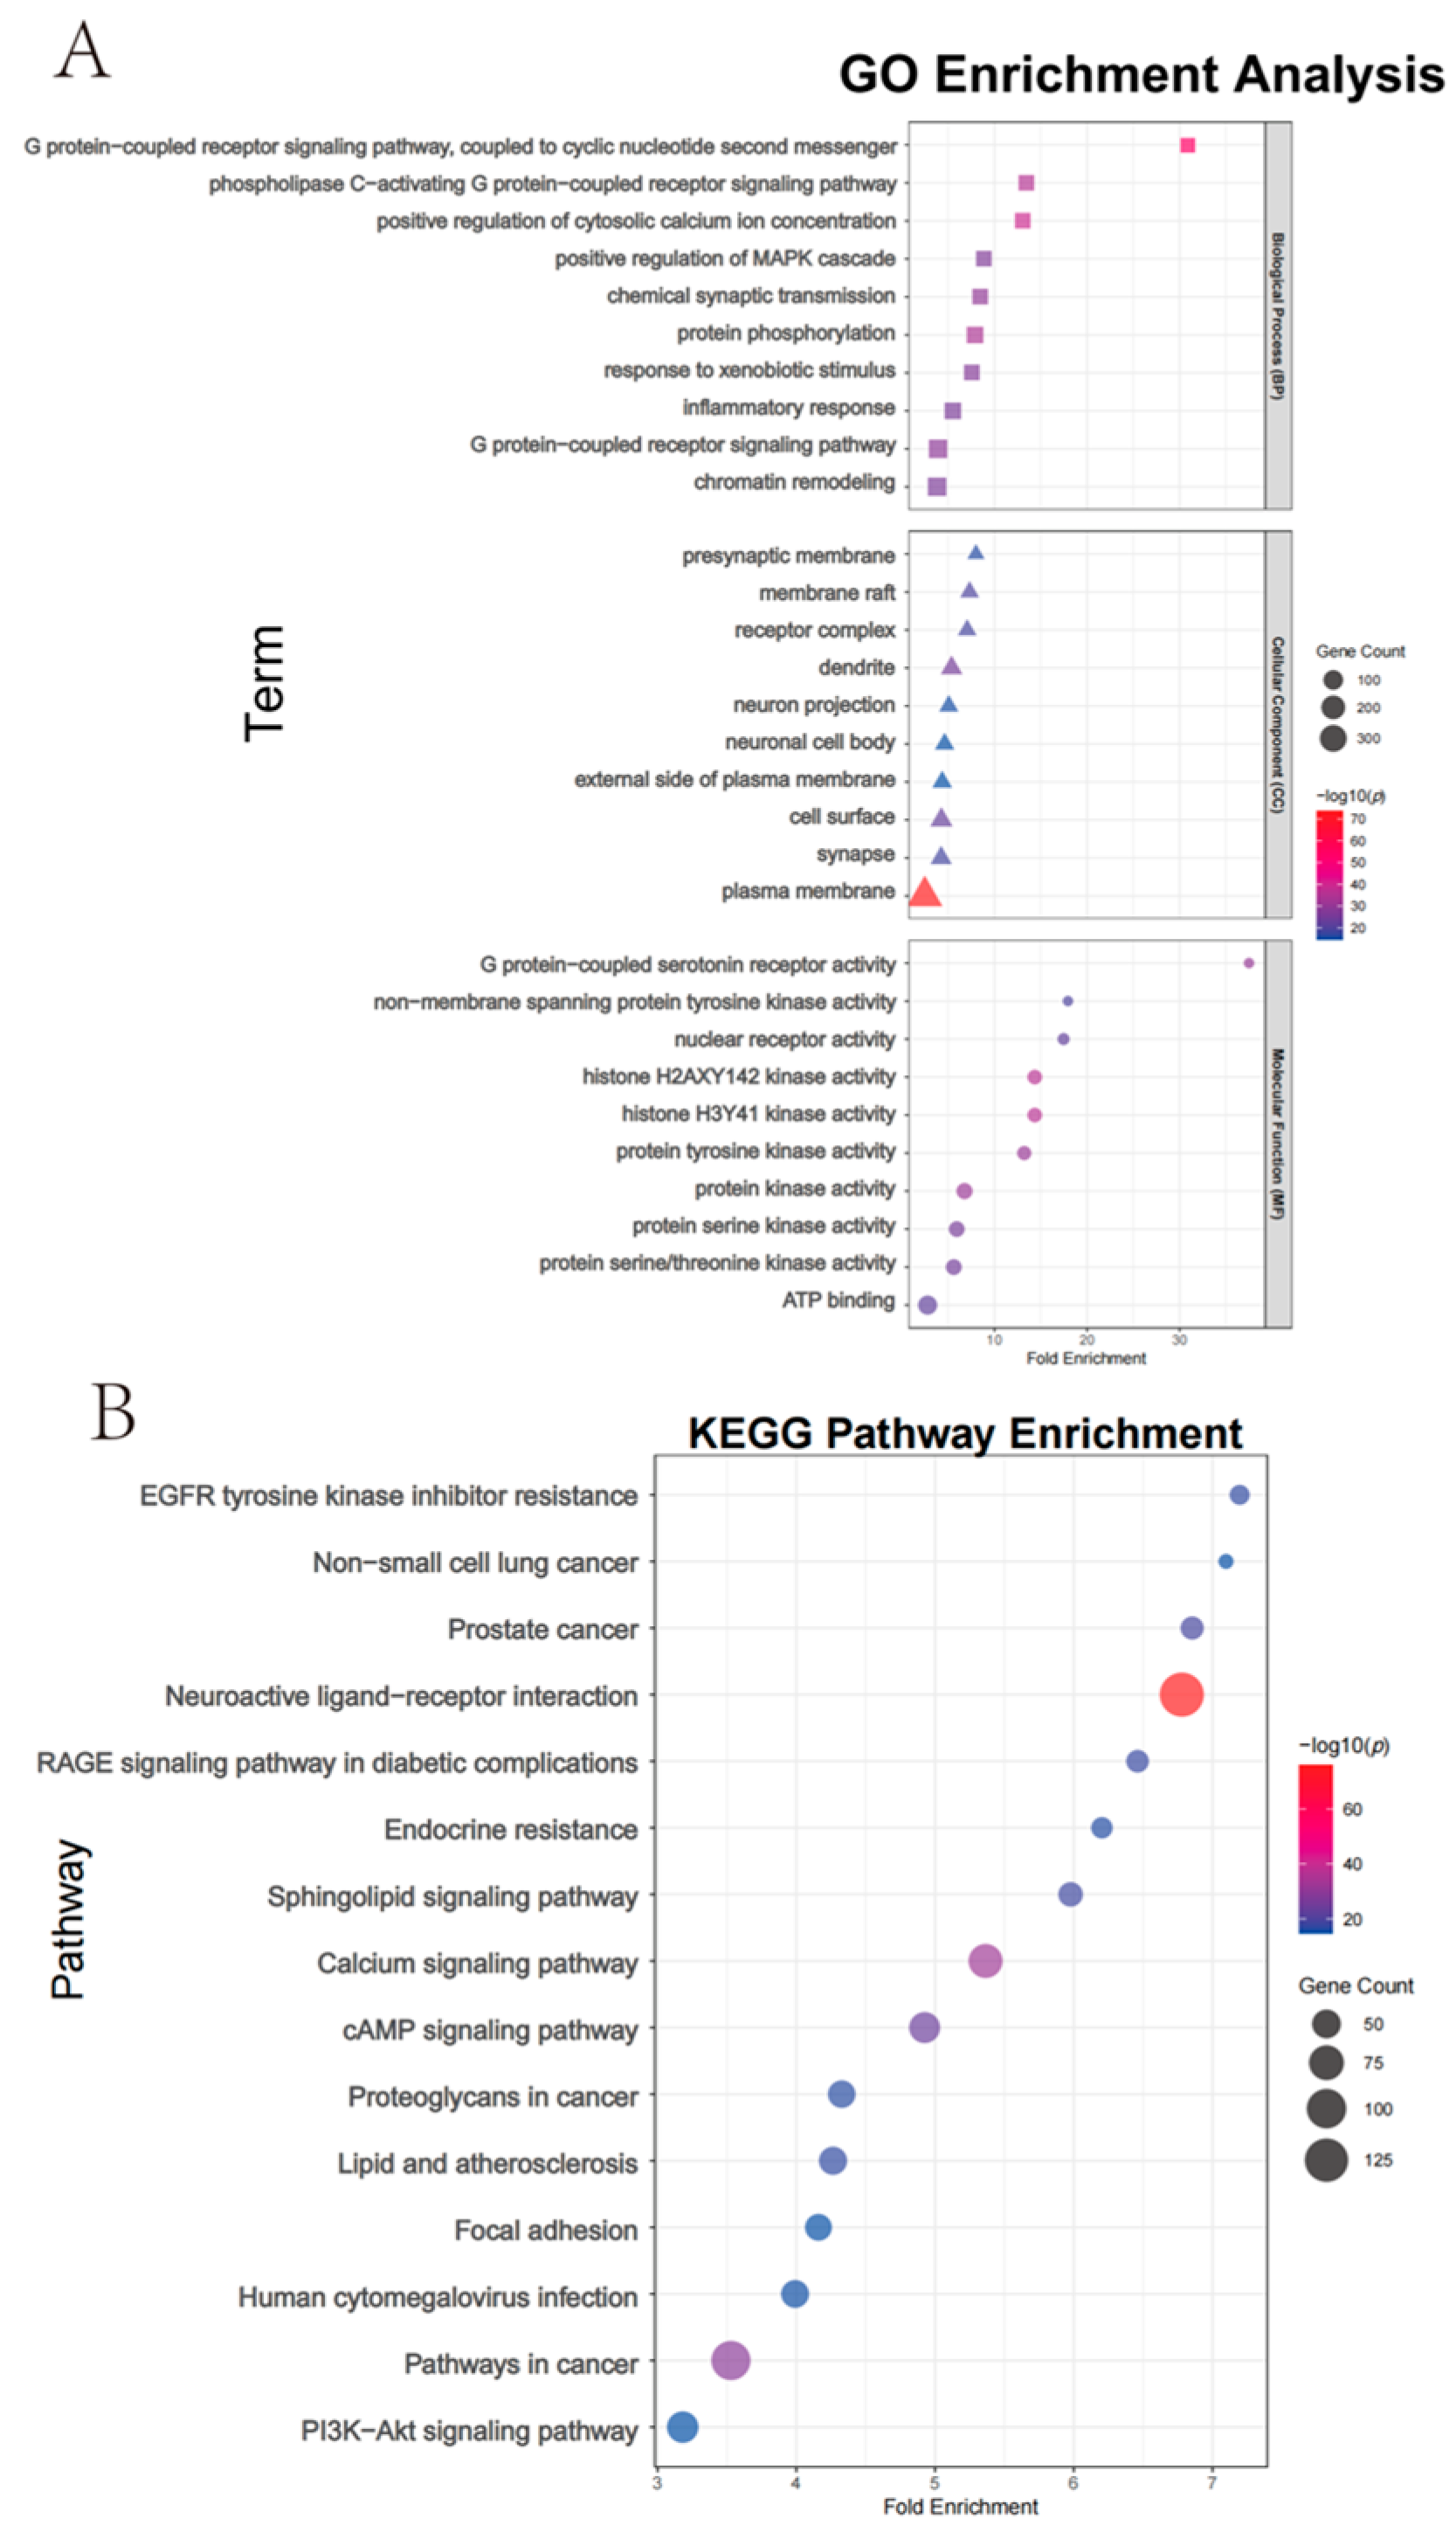
The integration of Random Forest and Lasso regression algorithms identified overlapping biomarkers with high diagnostic value for geographical discrimination. This dual-algorithm approach outperforms traditional univariate analyses by capturing nonlinear relationships and reducing overfitting risks. Among the Anhui markers, Kaempferol 3-O-beta-sophoroside, 13-alpha-(21)-Epoxyeurycomanone, Myristicin, and Glechomafuran exhibited significant regional specificity. Myristicin and Glechomafuran were significantly enriched in neuroactive ligand–receptor interaction and calcium signaling pathways, suggesting their roles in modulating neurotransmitter regulation and calcium homeostasis through genes like CHRM2/CHRM3/CHRM4. Among the six intersection compounds in Henan, the specific accumulation of 7-Hydroxy-3-(2-hydroxy-propyl)-5-methyl-isochromen-1-one and 4-(Tridecanoylamino)benzoic acid may reflect the diversification of secondary metabolic pathways due to complex terrain. Kaempferol 7-neohesperidoside and Myristoylcarnitine were primarily enriched in lipid metabolism-related pathways, implicating their roles in regulating lipid metabolism via targets such as ADORA1/PTGFR/PTGS2. This aligns with the lower annual precipitation in Henan, as drought stress often elevates lipid-derived metabolites to maintain membrane integrity. Among the three intersection compounds in Shanxi, the significant upregulation of Rhamnetin 3-sophoroside and 6-Pentyl-2H-pyran-2-one affected EGFR tyrosine kinase inhibitor resistance and PI3K-Akt signaling pathways by modulating kinase genes like AKT1/PRKACA/GSK3B, likely driven by high-altitude oxidative stress. Cross-regional comparisons revealed that Kaempferol 3-O-beta-sophoroside, Glechomafuran, and Myristoylcarnitine were consistently identified across multiple models, demonstrating robust regional differentiation capabilities. In the multi-regional “component–target–pathway” integrated network, the NOS3 gene played a central role in pathway enrichment across all three regions, accounting for 62.3% of cross-regional targets. However, its regulatory weight in the AGE-RAGE pathway associated with diabetic complications varied significantly across regions: 34 targets in Anhui, 21 in Henan, and 16 in Shanxi. This variation suggests differences in the functional mechanisms of NOS3 among regions, but its status as a potential key regulatory hub for cross-regional synergy remains noteworthy.
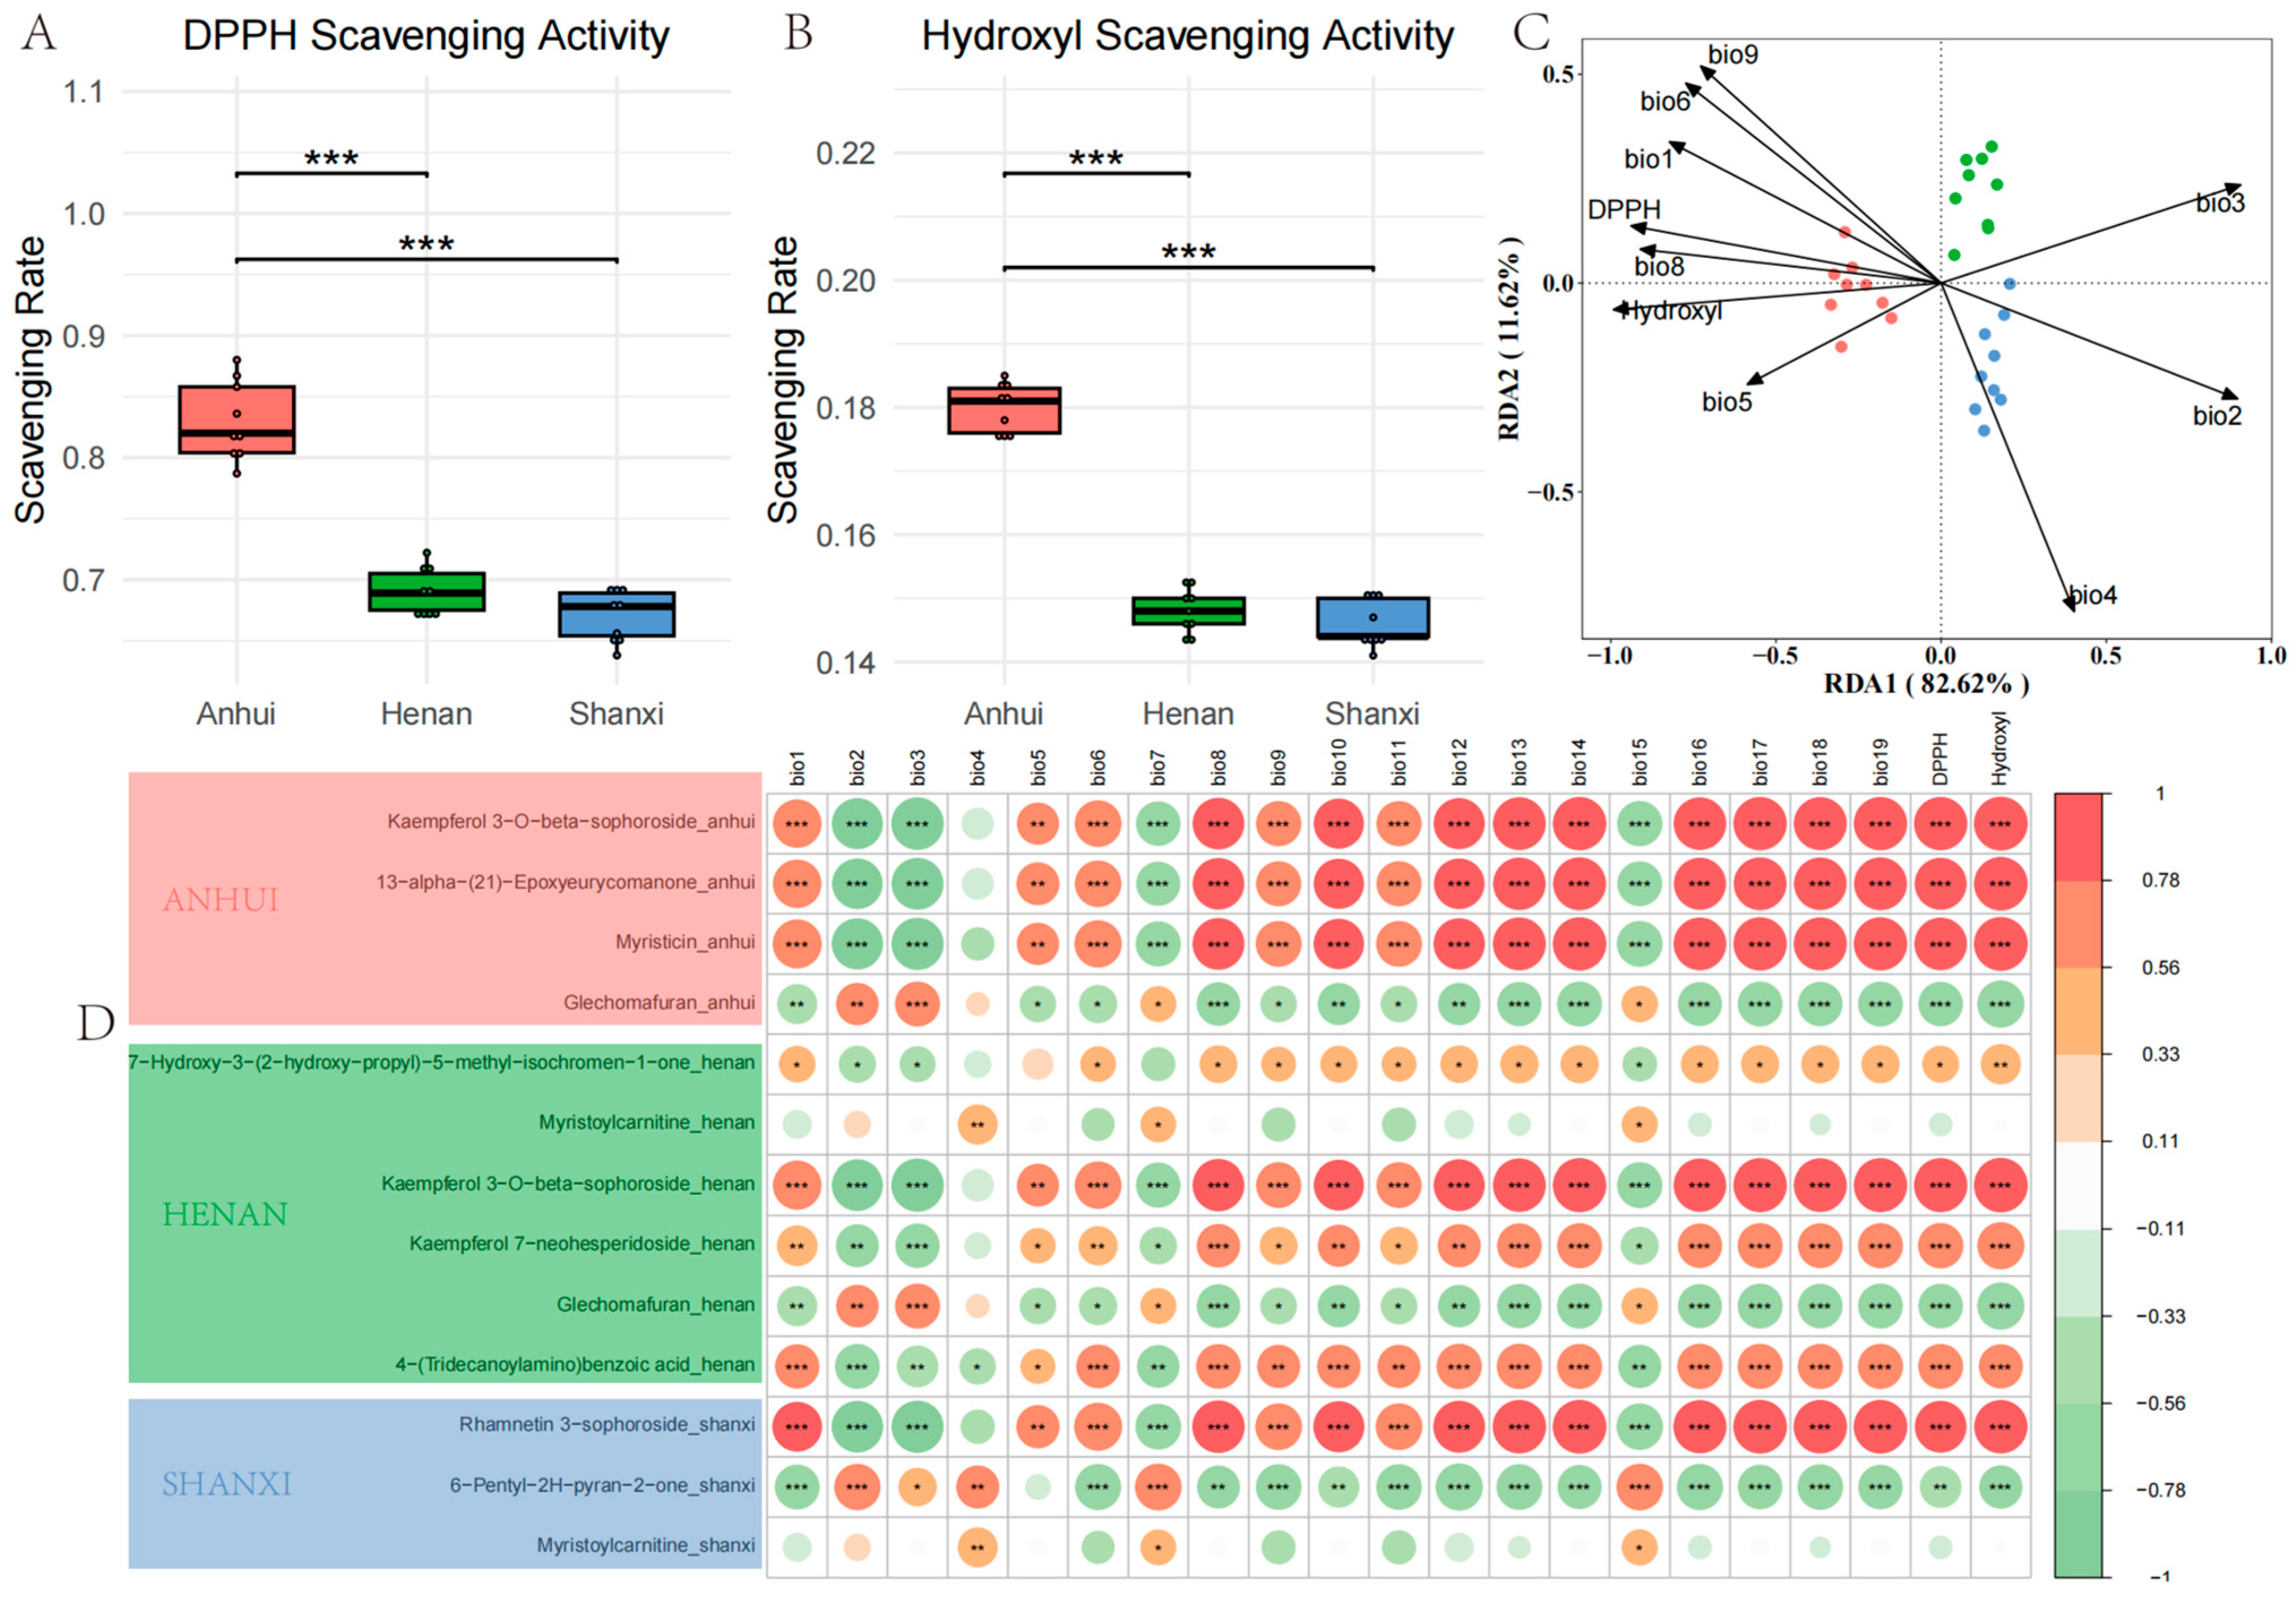
RDA and Pearson correlation models elucidated the climatic and topographical drivers of antioxidant activity. Anhui’s superior DPPH and hydroxyl radical scavenging rates were tightly linked to Rhamnetin 3-sophoroside and 6-Pentyl-2H-pyran-2-one, which correlated positively with annual precipitation (bio12) and negatively with temperature seasonality (bio4). This mirrors findings in Camellia sinensis, where stable rainfall enhances phenolic accumulation [
33]. Conversely, Shanxi’s reduced hydroxyl activity under precipitation fluctuations (bio4) may reflect trade-offs between antioxidant synthesis and drought resilience mechanisms. The inverse correlation between temperature variables (bio1, bio8) and DPPH activity underscores the role of cool climates in promoting flavonoid biosynthesis, as low temperatures upregulate phenylalanine ammonia-lyase (PAL) activity [
34]. Similarly, the altitude-dependent enrichment of Myristoylcarnitine in Shanxi (r = 0.63) suggests adaptive lipid metabolism to counter hypoxia-induced oxidative stress, a phenomenon observed in high-altitude medicinal plants. The negative correlation between Kaempferol 7-neohesperidoside in Henan samples and diurnal temperature variation suggests the regulatory effect of temperature stability on flavonoid glycosyltransferase activity.
The quantitative integration of climate variables with specific metabolites provides predictive models for cultivation optimization, enhanced by the RF-LASSO pipeline’s superior specificity in reducing false-positive biomarker identification. However, limitations include restricted sampling across three provinces and single-year data collection, necessitating broader geographic and longitudinal studies to assess biomarker universality and climate change impacts on metabolite stability, alongside the incorporation of rhizosphere microbiome analyses through metagenomics to elucidate plant-microbe co-metabolism effects. For quality control and cultivation optimization, actionable strategies emerge: Anhui Province should prioritize low-temperature/high-precipitation microclimates to maximize neuroactive flavonoids (e.g., Kaempferol glycosides), Shanxi Province can enhance alkamide production (Myristoylcarnitine) by targeting high-soil organic carbon zones, and Henan Province requires diurnal temperature management to balance lipid-regulating and antioxidant metabolites, with stable biomarkers like 13-alpha-Epoxyeurycomanone serving as key quality indicators.
Author Contributions
Conceptualization, J.W.; methodology, C.W. and K.C.; validation, C.W. and G.Z.; formal analysis, C.W.; writing—original draft preparation, C.W. and H.Y.; writing—review and editing, C.W. and J.W.; visualization, C.W. and J.W.; supervision, J.W.; funding acquisition, C.W. and J.W. All authors have read and agreed to the published version of the manuscript.
Funding
This study was funded by the National Natural Science Foundation of China (Grant No. 81773857), the Postgraduate Research & Practice Innovation Program of Jiangsu Province (KYCX24_0689), and the Fundamental Research Funds for the Central Universities, No. 2025101001.
Institutional Review Board Statement
Not applicable.
Informed Consent Statement
Not applicable.
Data Availability Statement
The original contributions presented in this study are included in the article; further inquiries can be directed to the corresponding author.
Conflicts of Interest
The authors declare no conflicts of interest.
Abbreviations
The following abbreviations are used in this manuscript:
| TCM | Traditional Chinese Medicine |
| LC-MS | Liquid Chromatography-Mass Spectrometry |
| UPLC-QTOF-MS | Ultra-Performance Liquid Chromatography-Quadrupole Time-of-Flight Mass Spectrometry |
| PCA | Principal Component Analysis |
| PLS-DA | Partial Least Squares Discriminant Analysis |
| VIP | Variable Importance in Projection |
| RF | Random Forest |
| LASSO | Least Absolute Shrinkage and Selection Operator |
| RDA | Redundancy Analysis |
| DPPH | 2 |
| HMDB | Human Metabolome Database |
| KEGG | Kyoto Encyclopedia of Genes and Genomes |
| GO | Gene Ontology |
| ANOVA | Analysis of Variance |
| ROS | Reactive Oxygen Species |
| NOS3 | Nitric Oxide Synthase 3 |
| AGE-RAGE | Advanced Glycation End Products-Receptor for Advanced Glycation End Products |
| EGFR | Epidermal Growth Factor Receptor |
| PI3K-Akt | Phosphatidylinositol 3-Kinase-Protein Kinase B |
| ADORA1 | Adenosine A1 Receptor |
| PTGFR | Prostaglandin F2α Receptor |
| PTGS2 | Prostaglandin-Endoperoxide Synthase 2 |
| AKT1 | Protein Kinase B Alpha |
| PRKACA | Protein Kinase A Catalytic Subunit Alpha |
| GSK3B | Glycogen Synthase Kinase 3 Beta |
| CHRM2/CHRM3/CHRM4 | Cholinergic Receptor Muscarinic 2/3/4 |
| HTR2A | 5-Hydroxytryptamine Receptor 2A |
| DRD2 | Dopamine Receptor D2 |
| CHRM3 | Cholinergic Receptor Muscarinic 3 |
References
- Guan, Y.; Xu, L.; Peng, G.; Han, Q.; Wang, T.; Xu, Z.; Wen, X.; Lou, H.; Shen, T. Total alkaloids from Thesium chinense inhibit lipopolysaccharide-induced respiratory inflammation by modulating Nrf2/NF-κB/NLRP3 signaling pathway. Chin. J. Nat. Med. 2025, 23, 421–430. [Google Scholar] [CrossRef]
- Xu, H.; Zhang, F.; Che, Y.; Sun, T.; Che, K.; Cui, Y.; Zhou, N.; Wan, J.; Chang, W.; Guan, Y.; et al. Thesium chinense Turcz. and its compound astragalin alleviate lipopolysaccharide-induced acute lung injury via the PI3K/AKT/p53 signaling pathway. J. Ethnopharmacol. 2025, 346, 119691. [Google Scholar] [CrossRef]
- Xu, H.; Zhang, F.; Huang, Y.; Yao, Q.; Guan, Y.; Chen, H. Thesium chinense Turcz. alleviates antibiotic-associated diarrhea in mice by modulating gut microbiota structure and regulating the EGFR/PI3K/Akt signaling pathway. Nan Fang Yi Ke Da Xue Xue Bao 2025, 45, 285–295. [Google Scholar] [PubMed]
- Shao, L.; Ling, B.; Jiang, H.; Wang, W.; Chu, Q.; Wu, S. The emulsifying capacity and mechanism of Thesium chinense Turcz. Polysaccharides based on synergistic effect of insoluble and soluble fractions. Int. J. Biol. Macromol. 2025, 302, 140545. [Google Scholar] [CrossRef]
- Zhang, F.; Zhang, G.; Wang, C.; Xu, H.; Che, K.; Sun, T.; Yao, Q.; Xiong, Y.; Zhou, N.; Chen, M.; et al. Geographical variation in metabolite profiles and bioactivity of Thesium chinense Turcz. Revealed by uplc-q-tof-ms-based metabolomics. Front. Plant Sci. 2024, 15, 1471729. [Google Scholar] [CrossRef] [PubMed]
- Zhang, S.; Chen, H.; Hua, J.; Luo, S. Cytotoxic activity of phenolic compounds in bairui granules obtained from the chinese medicinal plant Thesium chinense. Front. Chem. 2024, 12, 1506792. [Google Scholar] [CrossRef]
- Ling, B.; Shao, L.; Jiang, H.; Wu, S. Wide ph, adaptable high internal phase pickering emulsion stabilized by a crude polysaccharide from Thesium chinense Turcz. Molecules 2024, 29, 4312. [Google Scholar] [CrossRef]
- Liu, M.J.; Xu, Z.P.; Guan, Y.Q.; Wang, Y.Y.; Wen, X.S.; Li, G.H.; Wang, X.N.; Shen, T. Ethyl acetate fraction of Thesium chinense Turcz. Alleviates chronic obstructive pulmonary disease through inhibition of ferroptosis mediated by activating nrf2/slc7a11/gpx4 axis. J. Ethnopharmacol. 2025, 337, 118776. [Google Scholar] [CrossRef]
- Wang, R.; Ding, A.; Wang, J.; Wang, J.; Zhou, Y.; Chen, M.; Ju, S.; Tan, M.; Xiang, Z. Astragalin from Thesium chinense: A novel anti-aging and antioxidant agent targeting IGFR/CD38/Sirtuins. Antioxidants 2024, 13, 859. [Google Scholar] [CrossRef]
- Peng, G.C.; Hao, J.H.; Guan, Y.Q.; Wang, Y.Y.; Liu, M.J.; Li, G.H.; Xu, Z.P.; Wen, X.S.; Shen, T. Systematic investigation of the material basis, effectiveness and safety of Thesium chinense Turcz. And its preparation bairui granules against lung inflammation. Chin. Med. 2024, 19, 67. [Google Scholar] [CrossRef]
- Lê Cao, K.A.; Boitard, S.; Besse, P. Sparse pls discriminant analysis: Biologically relevant feature selection and graphical displays for multiclass problems. BMC Bioinform. 2011, 12, 253. [Google Scholar] [CrossRef] [PubMed]
- Ringnér, M. What is principal component analysis? Nat. Biotechnol. 2008, 26, 303–304. [Google Scholar] [CrossRef]
- Tiozon, R.J.N.; Sreenivasulu, N.; Alseekh, S.; Sartagoda, K.J.D.; Usadel, B.; Fernie, A.R. Metabolomics and machine learning technique revealed that germination enhances the multi-nutritional properties of pigmented rice. Commun. Biol. 2023, 6, 1000. [Google Scholar] [CrossRef] [PubMed]
- Vergara-Diaz, O.; Vatter, T.; Vicente, R.; Obata, T.; Nieto-Taladriz, M.T.; Aparicio, N.; Kefauver, S.C.; Fernie, A.; Araus, J.L. Metabolome profiling supports the key role of the spike in wheat yield performance. Cells 2020, 9, 1025. [Google Scholar] [CrossRef]
- Pang, Z.; Chong, J.; Zhou, G.; de Lima Morais, D.A.; Chang, L.; Barrette, M.; Gauthier, C.; Jacques, P.; Li, S.; Xia, J. Metaboanalyst 5.0: Narrowing the gap between raw spectra and functional insights. Nucleic Acids Res. 2021, 49, W388–W396. [Google Scholar] [CrossRef] [PubMed]
- Kanehisa, M.; Furumichi, M.; Sato, Y.; Kawashima, M.; Ishiguro-Watanabe, M. Kegg for taxonomy-based analysis of pathways and genomes. Nucleic Acids Res. 2023, 51, D587–D592. [Google Scholar] [CrossRef] [PubMed]
- Nan, Y.D.; Mu, B.D.; Ge, C.X.; Chen, S.Q.; Cui, M.X.; Li, H.M.; Zhao, C.C.; Wang, J.; Piao, C.X.; Li, G.H. Exploring the novel antioxidant peptides in low-salt dry-cured ham: Preparation, purification, identification and molecular docking. Food Chem. 2024, 446, 138697. [Google Scholar] [CrossRef]
- Yan, M.; Zhao, Y.; Feng, S.; Zheng, J.; Diao, M.; Zhang, T. Hydroxyl group-induced enhancement of antioxidant activity of resveratrol over pterostilbene by binding to lactoferrin. Food Chem. 2024, 441, 138356. [Google Scholar] [CrossRef]
- Poggio, L.; Simonetti, E.; Gimona, A. Enhancing the worldclim data set for national and regional applications. Sci. Total Environ. 2018, 625, 1628–1643. [Google Scholar] [CrossRef]
- Duan, R.Y.; Kong, X.Q.; Huang, M.Y.; Fan, W.Y.; Wang, Z.G. The predictive performance and stability of six species distribution models. PLoS ONE 2014, 9, e112764. [Google Scholar] [CrossRef]
- Wang, X.; Cao, J.; Tian, L.; Liu, B.; Fan, Y.; Wang, Q. Elucidating flavonoid and antioxidant activity in edible and medicinal herbs Woodwardia japonica (L.f.) Sm. Based on HPLC-ESI-TOF-MS and artificial neural network model: Response to climatic factors. Molecules 2023, 28, 1985. [Google Scholar] [CrossRef]
- Tong, L.; Jiang, Y.; Zhang, X.; Zhang, X.; Zhang, W.; Ren, G.; Chen, Z.; Zhao, Y.; Guo, S.; Yan, H.; et al. Metabolic and molecular basis of flavonoid biosynthesis in Lycii fructus: An integration of metabolomic and transcriptomic analysis. J. Pharm. Biomed. Anal. 2025, 255, 116653. [Google Scholar] [CrossRef] [PubMed]
- Guo, J.; Zhou, X.; Wang, T.; Wang, G.; Cao, F. Regulation of flavonoid metabolism in ginkgo leaves in response to different day-night temperature combinations. Plant Physiol. Biochem. 2020, 147, 133–140. [Google Scholar] [CrossRef] [PubMed]
- Spagnuolo, C.; Moccia, S.; Russo, G.L. Anti-inflammatory effects of flavonoids in neurodegenerative disorders. Eur. J. Med. Chem. 2018, 153, 105–115. [Google Scholar] [CrossRef] [PubMed]
- Shen, N.; Wang, T.; Gan, Q.; Liu, S.; Wang, L.; Jin, B. Plant flavonoids: Classification, distribution, biosynthesis, and antioxidant activity. Food Chem. 2022, 383, 132531. [Google Scholar] [CrossRef]
- Calderaro, A.; Patanè, G.T.; Tellone, E.; Barreca, D.; Ficarra, S.; Misiti, F.; Laganà, G. The neuroprotective potentiality of flavonoids on Alzheimer's disease. Int. J. Mol. Sci. 2022, 23, 14835. [Google Scholar] [CrossRef]
- Shen, G.; Di, S.; Dixon, R.A.; Pang, Y. Characterization of UGT716A1 as a multi-substrate UDP: Flavonoid glucosyltransferase gene in Ginkgo biloba. Front. Plant Sci. 2017, 8, 2085. [Google Scholar] [CrossRef]
- Seo, S.M.; Jung, C.S.; Kang, J.; Lee, H.R.; Kim, S.W.; Hyun, J.; Park, I.K. Larvicidal and acetylcholinesterase inhibitory activities of apiaceae plant essential oils and their constituents against Aedes albopictus and formulation development. J. Agric. Food Chem. 2015, 63, 9977–9986. [Google Scholar] [CrossRef]
- Qiao, M.; Sun, R.; Wang, Z.; Dumack, K.; Xie, X.; Dai, C.; Wang, E.; Zhou, J.; Sun, B.; Peng, X.; et al. Legume rhizodeposition promotes nitrogen fixation by soil microbiota under crop diversification. Nat. Commun. 2024, 15, 2924. [Google Scholar] [CrossRef]
- Bhatia, N. Polypodium leucotomos: A potential new photoprotective agent. Am. J. Clin. Dermatol. 2015, 16, 73–79. [Google Scholar] [CrossRef]
- Sun, Q.; Ma, L.; Zhu, X. Metabolomics-based exploration the response mechanisms of saussurea involucrata leaves under different levels of low temperature stress. BMC Genom. 2023, 24, 297. [Google Scholar] [CrossRef] [PubMed]
- Liu, M.; Niu, Q.; Wang, Z.; Qi, H.; Liang, X.; Gai, Y.; Wang, B.; Yin, S. Comparative physiological and transcriptome analysis provide insights into the inhibitory effect of 6-pentyl-2h-pyran-2-one on Clarireedia jacksonii. Pestic. Biochem. Physiol. 2023, 193, 105456. [Google Scholar] [CrossRef] [PubMed]
- Yao, L.; Caffin, N.; D’Arcy, B.; Jiang, Y.; Shi, J.; Singanusong, R.; Liu, X.; Datta, N.; Kakuda, Y.; Xu, Y. Seasonal variations of phenolic compounds in australia-grown tea (Camellia sinensis). J. Agric. Food Chem. 2005, 53, 6477–6483. [Google Scholar] [CrossRef] [PubMed]
- Wang, N.; Zhu, Y.; Zhou, Y.; Gao, F.; Cui, S. Transcriptome analysis reveals the crucial role of phenylalanine ammonia-lyase in low temperature response in Ammopiptanthus mongolicus. Genes 2024, 15, 1465. [Google Scholar] [CrossRef]
Figure 1.
Detailed sample information of the geographical origins.
Figure 2.
Multivariate analysis and metabolic pathway characteristics of T. chinense Turcz. samples from Anhui, Henan, and Shanxi. PCA score plots in positive (POS) (A) and negative (NEG) (B) ion modes; PLS-DA score plots in POS (C) and NEG (D) modes; (E) heatmap of differential metabolites; (F) metabolic pathway enrichment analysis.
Figure 3.
PLS-DA analysis and top 10 characteristic compounds of T. chinense Turcz. from Anhui vs. other regions. ** p < 0.01, *** p < 0.001, vs. Other group.
Figure 4.
PLS-DA analysis and top 10 characteristic compounds of T. chinense Turcz. from Shanxi vs. other regions. * p < 0.05, ** p < 0.01, *** p < 0.001, vs. Other group.
Figure 5.
PLS-DA analysis and top 10 characteristic compounds of T. chinense Turcz. from Henan vs. other regions. * p < 0.05, ** p < 0.01, vs. Other group.
Figure 6.
Machine learning-based screening of region-specific biomarkers in T. chinense Turcz. (A) RF importance ranking; (B) LASSO coefficient profiles for three regions; (C) Venn diagrams of RF-LASSO overlapping biomarkers.
Figure 7.
Functional enrichment analysis of T. chinense Turcz. biomarkers. (A) GO terms categorized into biological process (BP), cellular component (CC), and molecular function (MF); (B) KEGG pathway enrichment.
Figure 8.
Region-specific compound–target–pathway networks: Anhui (A), Henan (B), and Shanxi (C).
Figure 9.
Antioxidant activity and eco-geographical correlation analysis of T. chinense Turcz. (A) DPPH radical scavenging rates; (B) hydroxyl radical inhibition rates; (C) RDA triplot of climatic factors, antioxidant activities, and biomarkers. The climatic variables used in the redundancy analysis (RDA) are based on the WorldClim Bioclimatic Variables and include the following: bio1: Annual mean temperature (°C), bio2: Mean diurnal range (mean of monthly (max temp—min temp)) (°C), bio3: Isothermality (bio2/bio7) (×100), bio4: Temperature seasonality (standard deviation × 100) (%), bio5: Max temperature of warmest month (°C), bio6: Min temperature of coldest month (°C), bio8: Mean temperature of wettest quarter (°C), bio9: Mean temperature of driest quarter (°C); (D) Pearson correlation heatmap of region-specific metabolites with geo-climatic variables and antioxidant indices. * p < 0.05, ** p < 0.01, *** p < 0.001, vs. Anhui group.
Table 1.
Environmental variables recorded for each sample area.
| Field | Description | Units |
|---|
| bio1 | annual mean temperature | °C |
| bio2 | mean diurnal range (mean of monthly (max temp—min temp)) | °C |
| bio3 | isothermality (bio2/bio7) (×100) | °C |
| bio4 | temperature seasonality (standard deviation × 100) | % |
| bio5 | max temperature of warmest month | °C |
| bio6 | min temperature of coldest month | °C |
| bio7 | temperature annual range(bio5-bio6) | °C |
| bio8 | mean temperature of wettest quarter | °C |
| bio9 | mean temperature of driest quarter | °C |
| bio10 | mean temperature of warmest quarter | °C |
| bio11 | mean temperature of coldest quarter | °C |
| bio12 | annual precipitation | mm |
| bio13 | precipitation of wettest month | mm |
| bio14 | precipitation of driest month | mm |
| bio15 | precipitation seasonality (coefficient of variation) | % |
| bio16 | precipitation of wettest quarter | mm |
| bio17 | precipitation of driest quarter | mm |
| bio18 | precipitation of warmest quarter | mm |
| bio19 | precipitation of coldest quarter | mm |
| Disclaimer/Publisher’s Note: The statements, opinions and data contained in all publications are solely those of the individual author(s) and contributor(s) and not of MDPI and/or the editor(s). MDPI and/or the editor(s) disclaim responsibility for any injury to people or property resulting from any ideas, methods, instructions or products referred to in the content. |
© 2025 by the authors. Licensee MDPI, Basel, Switzerland. This article is an open access article distributed under the terms and conditions of the Creative Commons Attribution (CC BY) license (https://creativecommons.org/licenses/by/4.0/).


