Targeted Metabolomic Serum Analysis of Patients with High and Low Risk of Endometrial Cancer Recurrence and Positive and Negative Lymph Node Status

 , , , , and
Abstract
1. Introduction
2. Materials and Methods
2.1. Study Groups and Sample Collection
2.2. Sample Preparation
2.3. High-Performance Liquid Chromatography–Mass Spectrometry Analysis
2.4. Data Analysis
3. Results
4. Discussion
5. Conclusions
Supplementary Materials
Author Contributions
Funding
Institutional Review Board Statement
Informed Consent Statement
Data Availability Statement
Acknowledgments
Conflicts of Interest
Abbreviations
| Ala | Alanine |
| Asn | Asparagine |
| ATX | Autotaxin |
| AUC | Area Under the Curve |
| C10 | Decanoylcarnitine |
| C12 | Lauroyl-L-carnitine |
| EC | Endometrial Cancer |
| ESGO | European Society of Gynaecological Oncology |
| ESMO | European Society for Medical Oncology |
| ESTRO | European Society for Radiotherapy and Oncology |
| FIGO | International Federation of Gynecology and Obstetrics |
| FIA-MS | Flow-Injection Analysis–Mass Spectrometry |
| HPLC-MS | High-Performance Liquid Chromatography–Mass Spectrometry |
| His | Histidine |
| IDO | Indoleamine-2,3-Dioxygenase |
| ISTD | Internal Standard |
| LC-MS | Liquid Chromatography–Mass Spectrometry |
| LNM | Lymph Node Metastasis |
| LPC | Lysophosphatidylcholine |
| MRM | Multiple Reaction Monitoring |
| PC | Phosphatidylcholine |
| Phe | Phenylalanine |
| PLS-DA | Partial Least Squares Discriminant Analysis |
| PORTEC-3 | Post Operative Radiation Therapy in Endometrial Cancer 3 (study) |
| Pro | Proline |
| QC | Quality Control |
| ROC | Receiver Operating Characteristic |
| Thr | Threonine |
| Trp | Tryptophan |
| Tyr | Tyrosine |
References
- American Cancer Society. Key Statistics for Endometrial Cancer; American Cancer Society: Atlanta, GA, USA.
- Joe, S.; Lee, M.; Kang, J.; Kim, J.; Hong, S.-H.; Lee, S.J.; Lee, K.H.; Lee, A. Enhanced Risk Stratification in Early-Stage Endometrial Cancer: Integrating POLE through Droplet Digital PCR and L1CAM. Cancers 2023, 15, 4899. [Google Scholar] [CrossRef]
- Daix, M.; Angeles, M.A.; Migliorelli, F.; Kakkos, A.; Gomez, C.M.; Delbecque, K.; Mery, E.; Tock, S.; Gabiache, E.; Decuypere, M.; et al. Concordance between preoperative ESMO-ESGO-ESTRO risk classification and final histology in early-stage endometrial cancer. J. Gynecol. Oncol. 2021, 32, e48. [Google Scholar] [CrossRef] [PubMed]
- de Biase, D.; Maloberti, T.; Corradini, A.G.; Rosini, F.; Grillini, M.; Ruscelli, M.; Coluccelli, S.; Altimari, A.; Gruppioni, E.; Sanza, V.; et al. Integrated clinicopathologic and molecular analysis of endometrial carcinoma: Prognostic impact of the new ESGO-ESTRO-ESP endometrial cancer risk classification and proposal of histopathologic algorithm for its implementation in clinical practice. Front. Med. 2023, 10, 1146499. [Google Scholar] [CrossRef]
- Concin, N.; Planchamp, F.; Abu-Rustum, N.R.; Ataseven, B.; Cibula, D.; Fagotti, A.; Fotopoulou, C.; Knapp, P.; Marth, C.; Morice, P.; et al. European Society of Gynaecological Oncology quality indicators for the surgical treatment of endometrial carcinoma. Int. J. Gynecol. Cancer 2021, 31, 1508–1529. [Google Scholar] [CrossRef] [PubMed]
- Kang, S. Comparing prediction models for lymph node metastasis risk in endometrial cancer: The winner may not take it all. J. Gynecol. Oncol. 2017, 28, e92. [Google Scholar] [CrossRef]
- Li, H.; Wang, J.; Zhang, G.; Li, L.; Shen, Z.; Zhai, Z.; Wang, Z.; Wang, J. Predictive models for lymph node metastasis in endometrial cancer: A systematic review and bibliometric analysis. Women's Health 2024, 20, 17455057241248398. [Google Scholar] [CrossRef]
- Schmidt, D.R.; Patel, R.; Kirsch, D.G.; Lewis, C.A.; Vander Heiden, M.G.; Locasale, J.W. Metabolomics in cancer research and emerging applications in clinical oncology. CA Cancer J. Clin. 2021, 71, 333–358. [Google Scholar] [CrossRef] [PubMed]
- Kaur, R.; Gupta, S.; Kulshrestha, S.; Khandelwal, V.; Pandey, S.; Kumar, A.; Sharma, G.; Kumar, U.; Parashar, D.; Das, K. Metabolomics-Driven Biomarker Discovery for Breast Cancer Prognosis and Diagnosis. Cells 2024, 14, 5. [Google Scholar] [CrossRef]
- Patti, G.J.; Yanes, O.; Siuzdak, G. Metabolomics: The apogee of the omics trilogy. Nat. Rev. Mol. Cell Biol. 2012, 13, 263–269. [Google Scholar] [CrossRef]
- Li, J.; Yang, H.; Zhang, L.; Zhang, S.; Dai, Y. Metabolic reprogramming and interventions in endometrial carcinoma. Biomed. Pharmacother. 2023, 161, 114526. [Google Scholar] [CrossRef]
- Morice, P.; Leary, A.; Creutzberg, C.; Abu-Rustum, N.; Darai, E. Endometrial cancer. Lancet 2016, 387, 1094–1108. [Google Scholar] [CrossRef] [PubMed]
- Gao, S.; Wang, X.; Huang, J.; Zhu, Y.; Zhang, R.; He, J.; Abliz, Z. Development and validation of a sensitive and reliable targeted metabolomics method for the quantification of cardiovascular disease-related biomarkers in plasma using ultrahigh-performance liquid chromatography–tandem mass spectrometry. Rapid Commun. Mass Spectrom. 2022, 36, e9292. [Google Scholar] [CrossRef] [PubMed]
- Qiu, S.; Cai, Y.; Yao, H.; Lin, C.; Xie, Y.; Tang, S.; Zhang, A. Small molecule metabolites: Discovery of biomarkers and therapeutic targets. Signal Transduct. Target. Ther. 2023, 8, 132. [Google Scholar] [CrossRef]
- Audet-Delage, Y.; Villeneuve, L.; Grégoire, J.; Plante, M.; Guillemette, C. Identification of Metabolomic Biomarkers for Endometrial Cancer and Its Recurrence after Surgery in Postmenopausal Women. Front. Endocrinol. 2018, 9, 87. [Google Scholar] [CrossRef] [PubMed]
- Troisi, J.; Mollo, A.; Lombardi, M.; Scala, G.; Richards, S.M.; Symes, S.J.K.; Travaglino, A.; Neola, D.; de Laurentiis, U.; Insabato, L.; et al. The Metabolomic Approach for the Screening of Endometrial Cancer: Validation from a Large Cohort of Women Scheduled for Gynecological Surgery. Biomolecules 2022, 12, 1229. [Google Scholar] [CrossRef]
- Knific, T.; Vouk, K.; Smrkolj, Š.; Prehn, C.; Adamski, J.; Rižner, T.L. Models including plasma levels of sphingomyelins and phosphatidylcholines as diagnostic and prognostic biomarkers of endometrial cancer. J. Steroid Biochem. Mol. Biol. 2018, 178, 312–321. [Google Scholar] [CrossRef]
- Pang, Z.; Lu, Y.; Zhou, G.; Hui, F.; Xu, L.; Viau, C.; Spigelman, A.F.; MacDonald, P.E.; Wishart, D.S.; Li, S.; et al. MetaboAnalyst 6.0: Towards a unified platform for metabolomics data processing, analysis and interpretation. Nucleic Acids Res. 2024, 52, W398–W406. [Google Scholar] [CrossRef]
- Niemi, R.J.; Braicu, E.I.; Kulbe, H.; Koistinen, K.M.; Sehouli, J.; Puistola, U.; Mäenpää, J.U.; Hilvo, M. Ovarian tumours of different histologic type and clinical stage induce similar changes in lipid metabolism. Br. J. Cancer 2018, 119, 847–854. [Google Scholar] [CrossRef]
- Strand, E.; Tangen, I.L.; Fasmer, K.E.; Jacob, H.; Halle, M.K.; Hoivik, E.A.; Delvoux, B.; Trovik, J.; Haldorsen, I.S.; Romano, A.; et al. Blood Metabolites Associate with Prognosis in Endometrial Cancer. Metabolites 2019, 9, 302. [Google Scholar] [CrossRef]
- de Jong, R.A.; Nijman, H.W.; Boezen, H.M.; Volmer, M.; Hoor, K.A.T.; Krijnen, J.; van der Zee, A.G.; Hollema, H.; Kema, I.P. Serum Tryptophan and Kynurenine Concentrations as Parameters for Indoleamine 2,3-Dioxygenase Activity in Patients with Endometrial, Ovarian, and Vulvar Cancer. Int. J. Gynecol. Cancer 2011, 21, 1320–1327. [Google Scholar] [CrossRef]
- Zhai, L.; Yang, X.; Cheng, Y.; Wang, J. Glutamine and amino acid metabolism as a prognostic signature and therapeutic target in endometrial cancer. Cancer Med. 2023, 12, 16337–16358. [Google Scholar] [CrossRef] [PubMed]
- Nie, G.; Yang, X.; Wang, Y.; Liang, W.; Li, X.; Luo, Q.; Yang, H.; Liu, J.; Wang, J.; Guo, Q.; et al. The Effects of Menopause Hormone Therapy on Lipid Profile in Postmenopausal Women: A Systematic Review and Meta-Analysis. Front. Pharmacol. 2022, 13, 850815. [Google Scholar] [CrossRef] [PubMed]
- Hishinuma, E.; Shimada, M.; Matsukawa, N.; Shima, Y.; Li, B.; Motoike, I.N.; Shibuya, Y.; Hagihara, T.; Shigeta, S.; Tokunaga, H.; et al. Identification of predictive biomarkers for endometrial cancer diagnosis and treatment response monitoring using plasma metabolome profiling. Cancer Metab. 2023, 11, 16. [Google Scholar] [CrossRef]
- Pietkiewicz, D.; Klupczynska-Gabryszak, A.; Plewa, S.; Misiura, M.; Horala, A.; Miltyk, W.; Nowak-Markwitz, E.; Kokot, Z.J.; Matysiak, J. Free Amino Acid Alterations in Patients with Gynecological and Breast Cancer: A Review. Pharmaceuticals 2021, 14, 731. [Google Scholar] [CrossRef]
- Yan, J.; Chen, D.; Ye, Z.; Zhu, X.; Li, X.; Jiao, H.; Duan, M.; Zhang, C.; Cheng, J.; Xu, L.; et al. Molecular mechanisms and therapeutic significance of Tryptophan Metabolism and signaling in cancer. Mol. Cancer 2024, 23, 241. [Google Scholar] [CrossRef] [PubMed]
- Yoshida, N.; Ino, K.; Ishida, Y.; Kajiyama, H.; Yamamoto, E.; Shibata, K.; Terauchi, M.; Nawa, A.; Akimoto, H.; Takikawa, O.; et al. Overexpression of Indoleamine 2,3-Dioxygenase in Human Endometrial Carcinoma Cells Induces Rapid Tumor Growth in a Mouse Xenograft Model. Clin. Cancer Res. 2008, 14, 7251–7259. [Google Scholar] [CrossRef]
- Ino, K.; Yamamoto, E.; Shibata, K.; Kajiyama, H.; Yoshida, N.; Terauchi, M.; Nawa, A.; Nagasaka, T.; Takikawa, O.; Kikkawa, F. Inverse Correlation between Tumoral Indoleamine 2,3-Dioxygenase Expression and Tumor-Infiltrating Lymphocytes in Endometrial Cancer: Its Association with Disease Progression and Survival. Clin. Cancer Res. 2008, 14, 2310–2317. [Google Scholar] [CrossRef]
- Medina, V.A.; Rivera, E.S. Histamine receptors and cancer pharmacology. Br. J. Pharmacol. 2010, 161, 755–767. [Google Scholar] [CrossRef]
- Hodakoski, C.; Hopkins, B.D.; Zhang, G.; Su, T.; Cheng, Z.; Morris, R.; Rhee, K.Y.; Goncalves, M.D.; Cantley, L.C. Rac-Mediated Macropinocytosis of Extracellular Protein Promotes Glucose Independence in Non-Small Cell Lung Cancer. Cancers 2019, 11, 37. [Google Scholar] [CrossRef]
- Sirniö, P.; Väyrynen, J.P.; Klintrup, K.; Mäkelä, J.; Karhu, T.; Herzig, K.-H.; Minkkinen, I.; Mäkinen, M.J.; Karttunen, T.J.; Tuomisto, A. Alterations in serum amino-acid profile in the progression of colorectal cancer: Associations with systemic inflammation, tumour stage and patient survival. Br. J. Cancer 2019, 120, 238–246. [Google Scholar] [CrossRef]
- Trousil, S.; Lee, P.; Pinato, D.J.; Ellis, J.K.; Dina, R.; Aboagye, E.O.; Keun, H.C.; Sharma, R. Alterations of choline phospholipid metabolism in endometrial cancer are caused by choline kinase alpha overexpression and a hyperactivated deacylation pathway. Cancer Res. 2014, 74, 6867–6877. [Google Scholar] [CrossRef] [PubMed]
- Dos Santos, G.C.; Saldanha-Gama, R.; De Brito, N.M.; Renovato-Martins, M.; Barja-Fidalgo, C. Metabolomics in cancer and cancer-associated inflammatory cells. J. Cancer Metastasis Treat. 2021, 2021. [Google Scholar] [CrossRef]
- Skorupa, A.; Poński, M.; Ciszek, M.; Cichoń, B.; Klimek, M.; Witek, A.; Pakuło, S.; Boguszewicz, Ł.; Sokół, M. Grading of endometrial cancer using 1H HR-MAS NMR-based metabolomics. Sci. Rep. 2021, 11, 1. [Google Scholar] [CrossRef] [PubMed]
- Zhang, S.; Han, X. The Regulatory Role of Lipid Metabolism in Endometrial Cancer. J. Oncol. 2022, 2022, 6458877. [Google Scholar] [CrossRef]
- Albertí-Valls, M.; Megino-Luque, C.; Macià, A.; Gatius, S.; Matias-Guiu, X.; Eritja, N. Metabolomic-Based Approaches for Endometrial Cancer Diagnosis and Prognosis: A Review. Cancers 2023, 16, 185. [Google Scholar] [CrossRef] [PubMed]
- Madan, D.; Ferguson, C.G.; Lee, W.Y.; Prestwich, G.D.; Testa, C.A.; Bogyo, M. Non-Invasive Imaging of Tumors by Monitoring Autotaxin Activity Using an Enzyme-Activated Near-Infrared Fluorogenic Substrate. PLoS ONE 2013, 8, e79065. [Google Scholar] [CrossRef]
- Yun, C.C. Lysophosphatidic Acid and Autotaxin-associated Effects on the Initiation and Progression of Colorectal Cancer. Cancers 2019, 11, 958. [Google Scholar] [CrossRef]
- E. Reuter, S.; Evans, A.M.; Chace, D.H.; Fornasini, G. Determination of the reference range of endogenous plasma carnitines in healthy adults. Ann. Clin. Biochem. Int. J. Biochem. Lab. Med. 2008, 45, 585–592. [Google Scholar] [CrossRef]
- Guo, H.; Kong, W.; Zhang, L.; Han, J.; Clark, L.H.; Yin, Y.; Fang, Z.; Sun, W.; Wang, J.; Gilliam, T.P.; et al. Reversal of obesity-driven aggressiveness of endometrial cancer by metformin. Am. J. Cancer Res. 2019, 9, 2170–2193. [Google Scholar]
- Razghonova, Y.; Mika, A.; Czapiewska, M.; Stanczak, A.; Zygowska, P.; Wydra, D.G.; Sledzinski, T.; Abacjew-Chmylko, A. Endometrial Cancer Is Associated with Altered Metabolism and Composition of Fatty Acids. Int. J. Mol. Sci. 2025, 26, 3322. [Google Scholar] [CrossRef]
- Arioz, D.T.; Kanat-Pektas, M.; Tuncer, N.; Koken, T.; Unlu, B.S.; Koken, G.; Yilmazer, M. l-Carnitine: A new insight into the pathogenesis of endometrial cancer. Arch. Gynecol. Obstet. 2015, 291, 1147–1152. [Google Scholar] [CrossRef] [PubMed]

| Group | Low-Risk | High-Risk | LNP | LNN |
|---|---|---|---|---|
| Number of patients | 68 | 55 | 16 | 107 |
| Age (years) | 62 (58–66) | 64 (59–68) | 66 (63–70) | 60 (57–64) |
| BMI (kg/m2) | 32 (30–35) | 28 (26–30) | 28 (26–30) | 31 (28–33) |
| FIGO stage | ||||
| IA | 20 | 5 | - | 48 |
| IB | 8 | 6 | - | 16 |
| II | 4 | 9 | 2 | 8 |
| III | 6 | 38 | 14 | 32 |
| IV | 2 | - | 3 | |
| Grade | ||||
| 1 | 24 | 17 | 3 | 48 |
| 2 | 13 | 16 | 5 | 31 |
| 3 | 1 | 27 | 8 | 28 |
| Histology | ||||
| Endometrioid | 68 | 45 | 10 | 94 |
| Non-endometrioid | - | 10 | 6 | 13 |
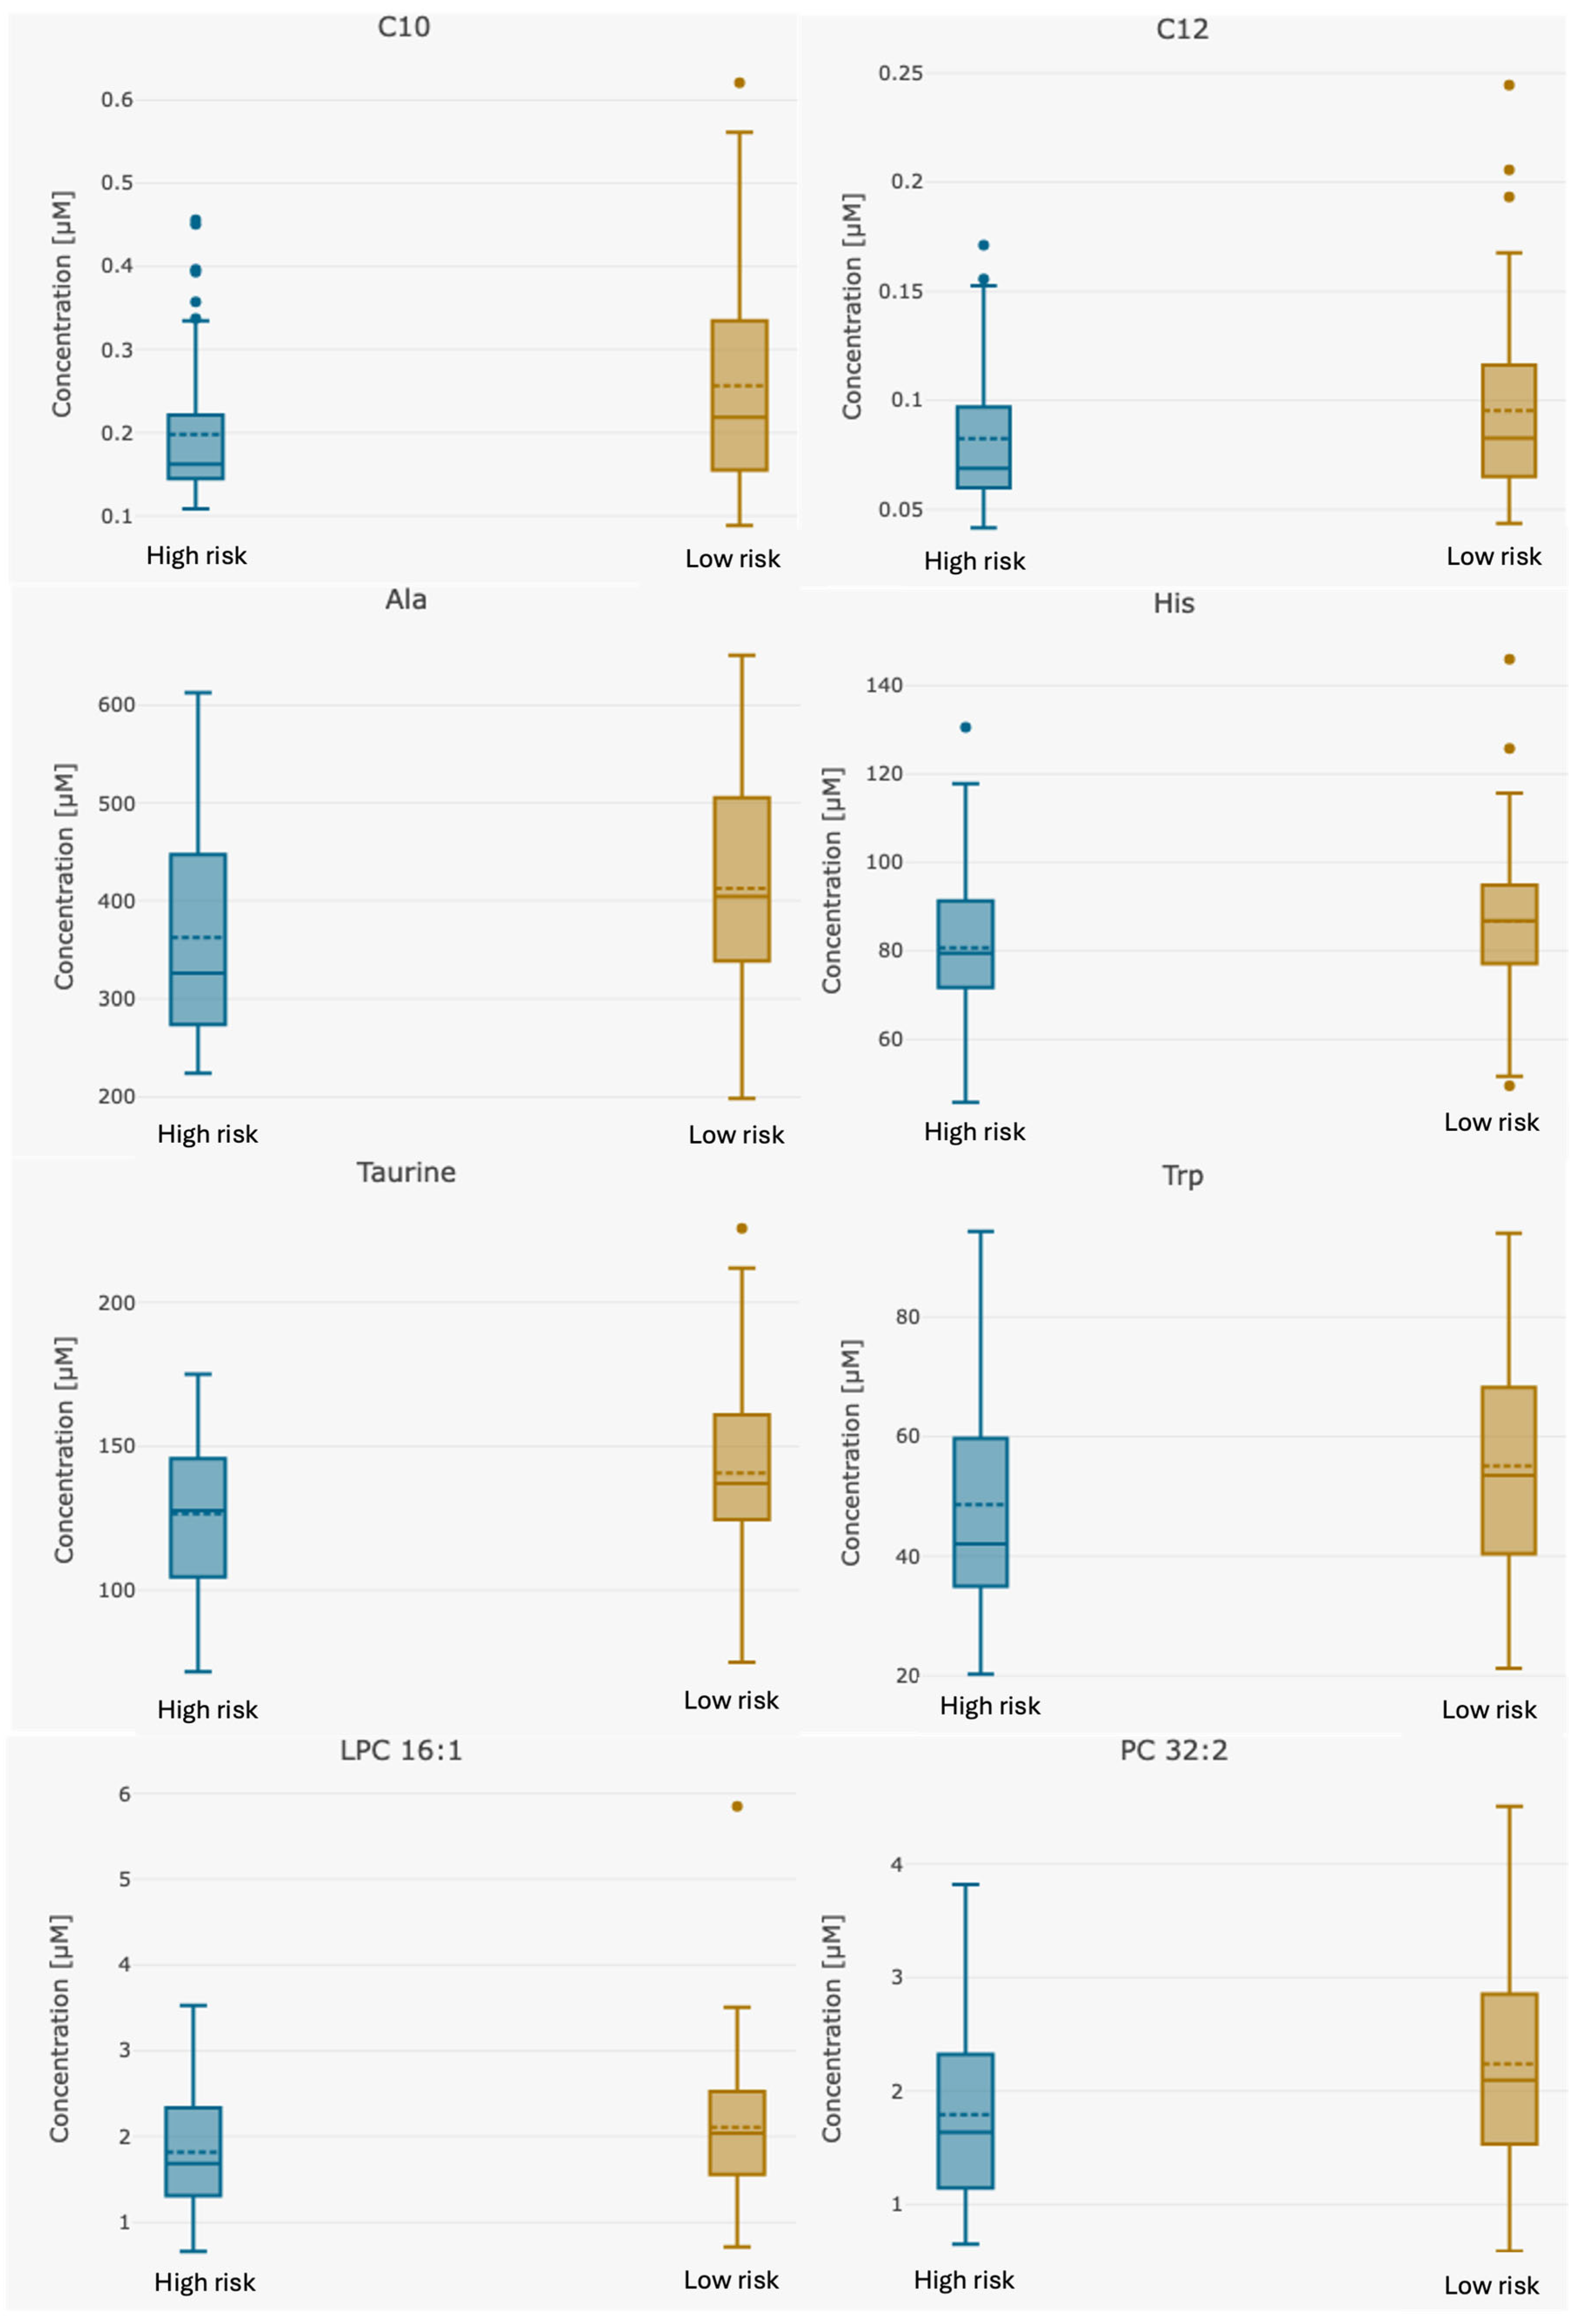
| Analyte [µM] | Whole Group n = 123 | High-Risk Group n = 55 | Low-Risk Group n = 68 | p-Value Group 1 vs. 2 |
|---|---|---|---|---|
| C10 | 0.16 (0.00–0.573) | 0.12 (0.00–0.479) | 0.19 (0–0.57) | 0.0027 |
| C12 | 0.06 (0.00–0.229) | 0.06 (0.00–0.165.0) | 0.07 (0–0.23) | 0.05 |
| Alanine | 387.74 (198.0–651.0) | 357.28 (224.0–613.0) | 412.69 (198.0–651.0) | 0.0087 |
| Histidine | 83.30 (45.7–146.0) | 79.05 (45.7–118.0) | 86.66 (49.5–146.0) | 0.046 |
| Tryptophan | 52.05 (20.02–94.4) | 48.04 (20.2–94.4) | 55.32 (21.3–94.0) | 0.049 |
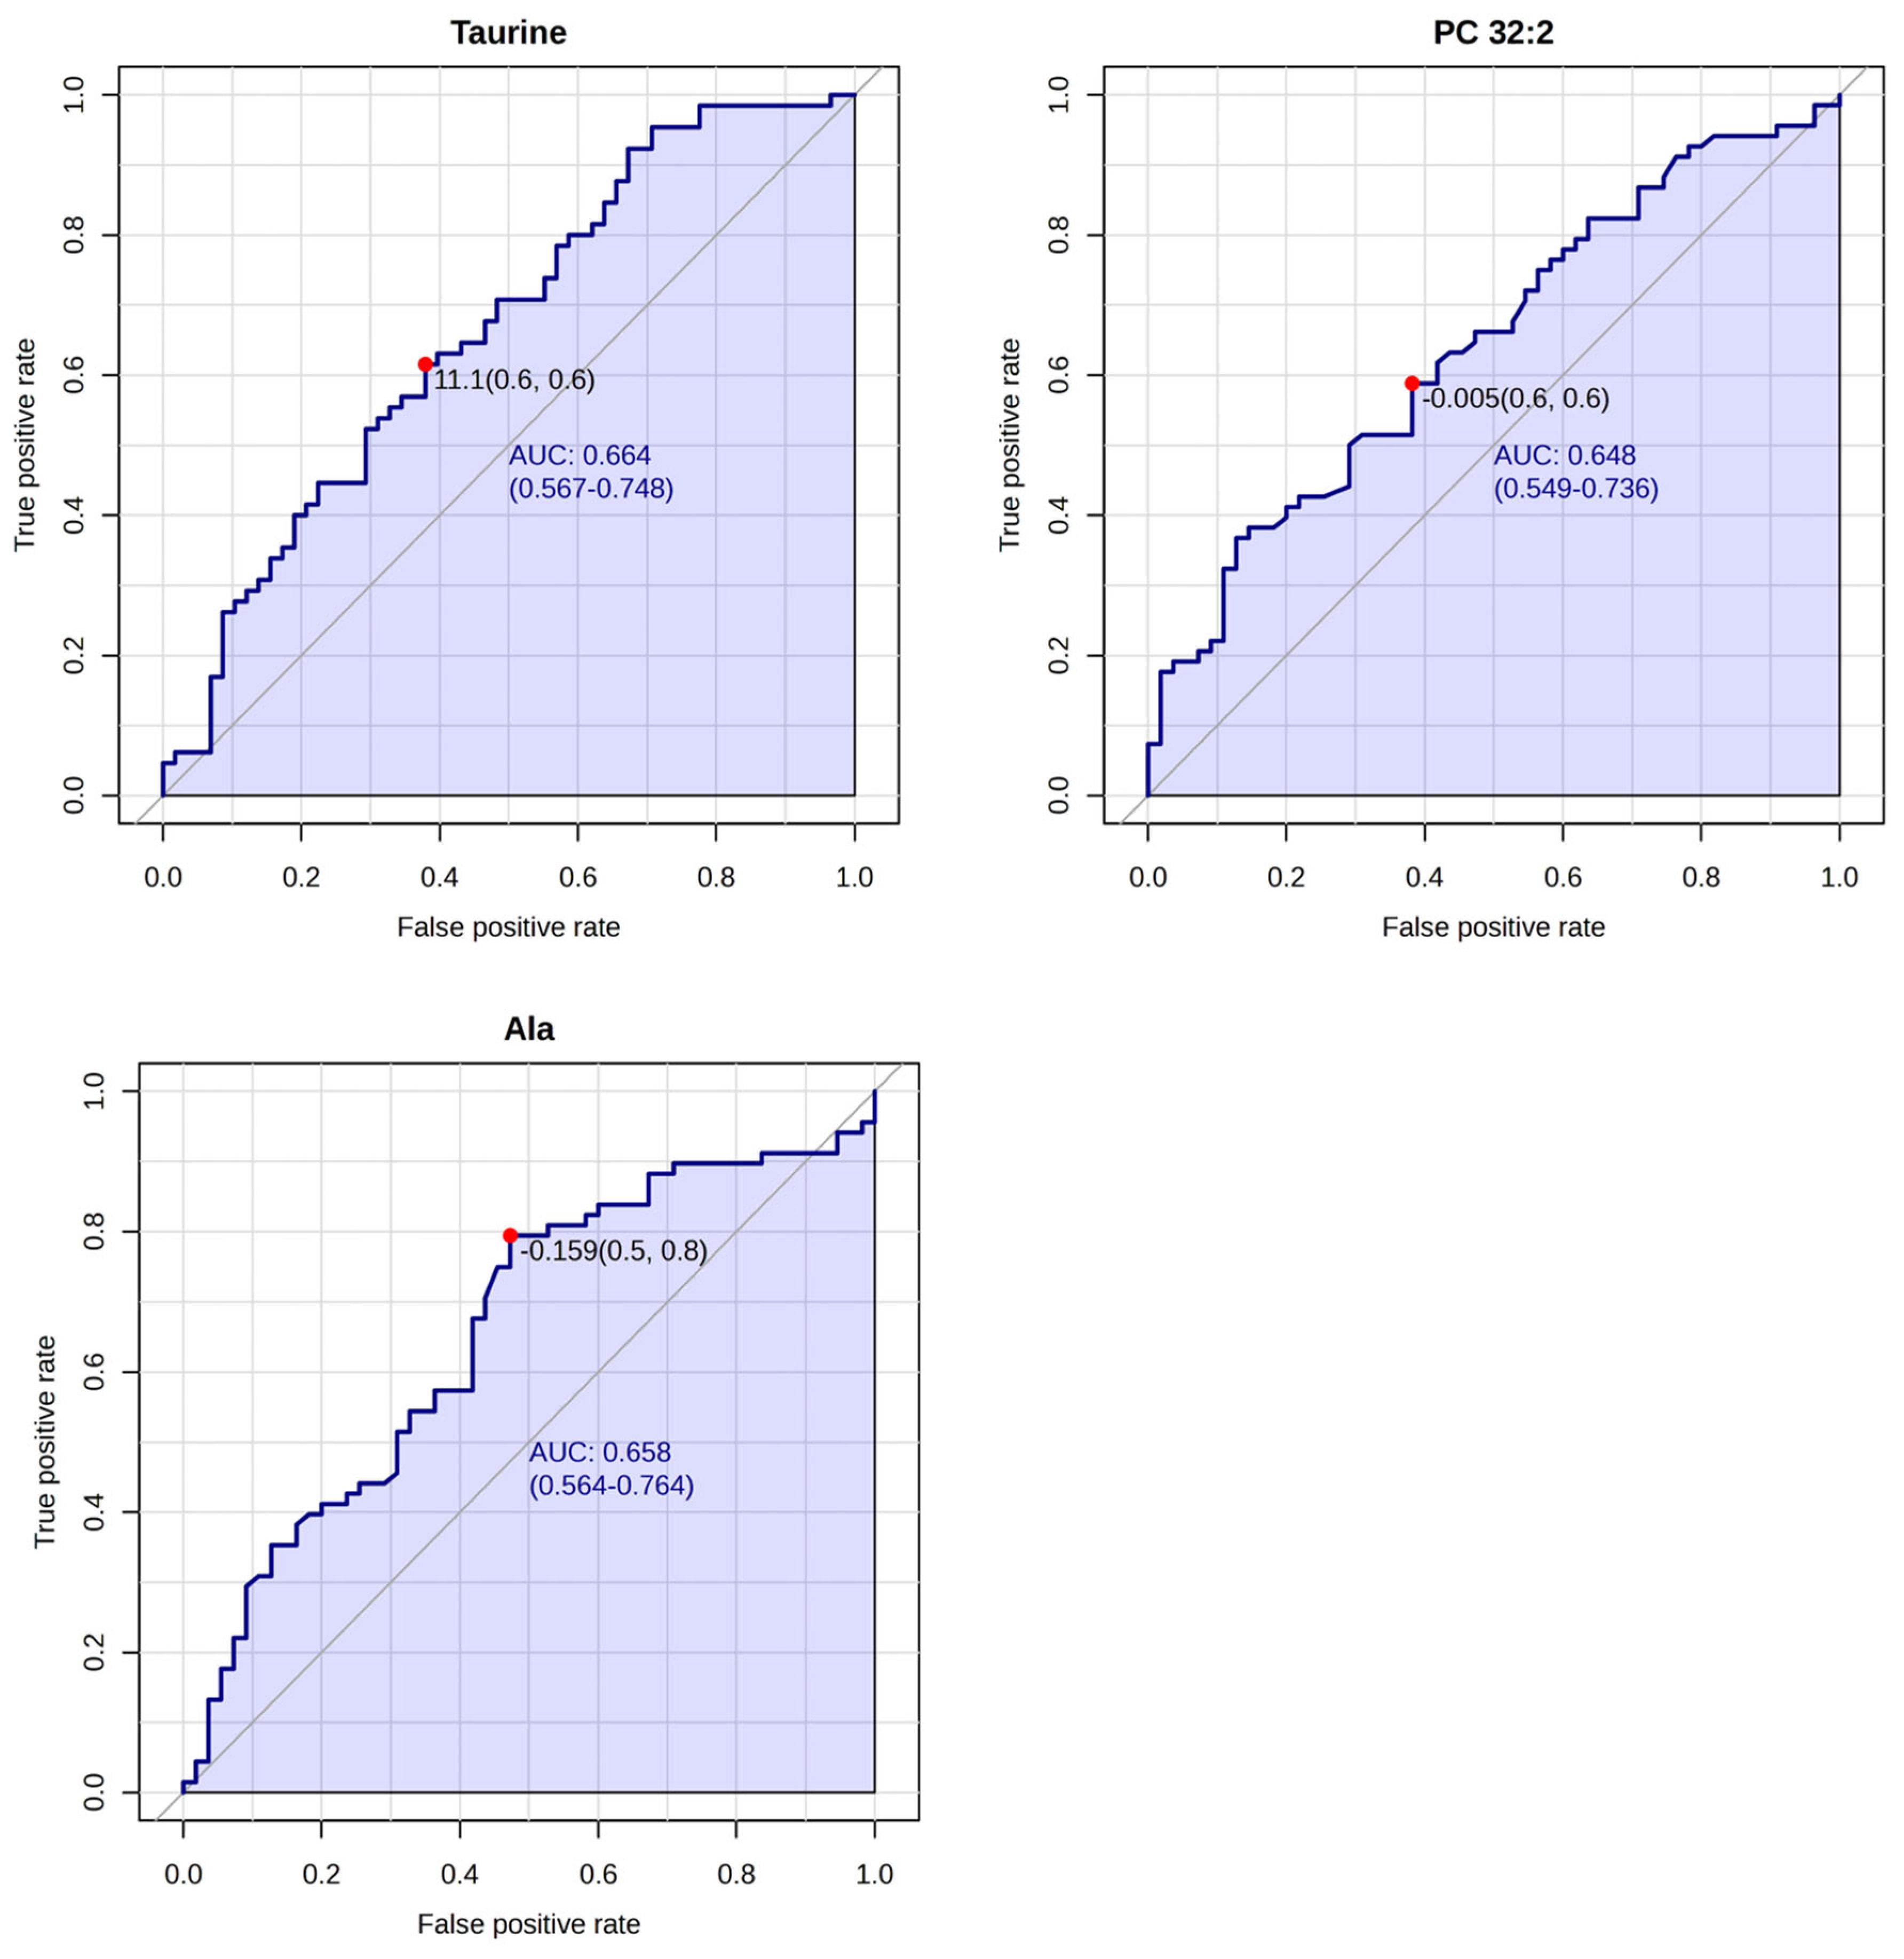
| Taurine | 132.95 (71.6–226.0) | 124.31 (71.6–175) | 139.62 (75–226.0) | 0.0064 |
| LPC 16:1 | 1.97 (0.659–5.85) | 1.78 (0.659–3.53) | 2.11 (0.712–5.85) | 0.03 |
| PC 32:2 | 2.03 (0.584–4.51) | 1.75 (0.649–3.82) | 2.24 (0.584–4.51) | 0.0045 |
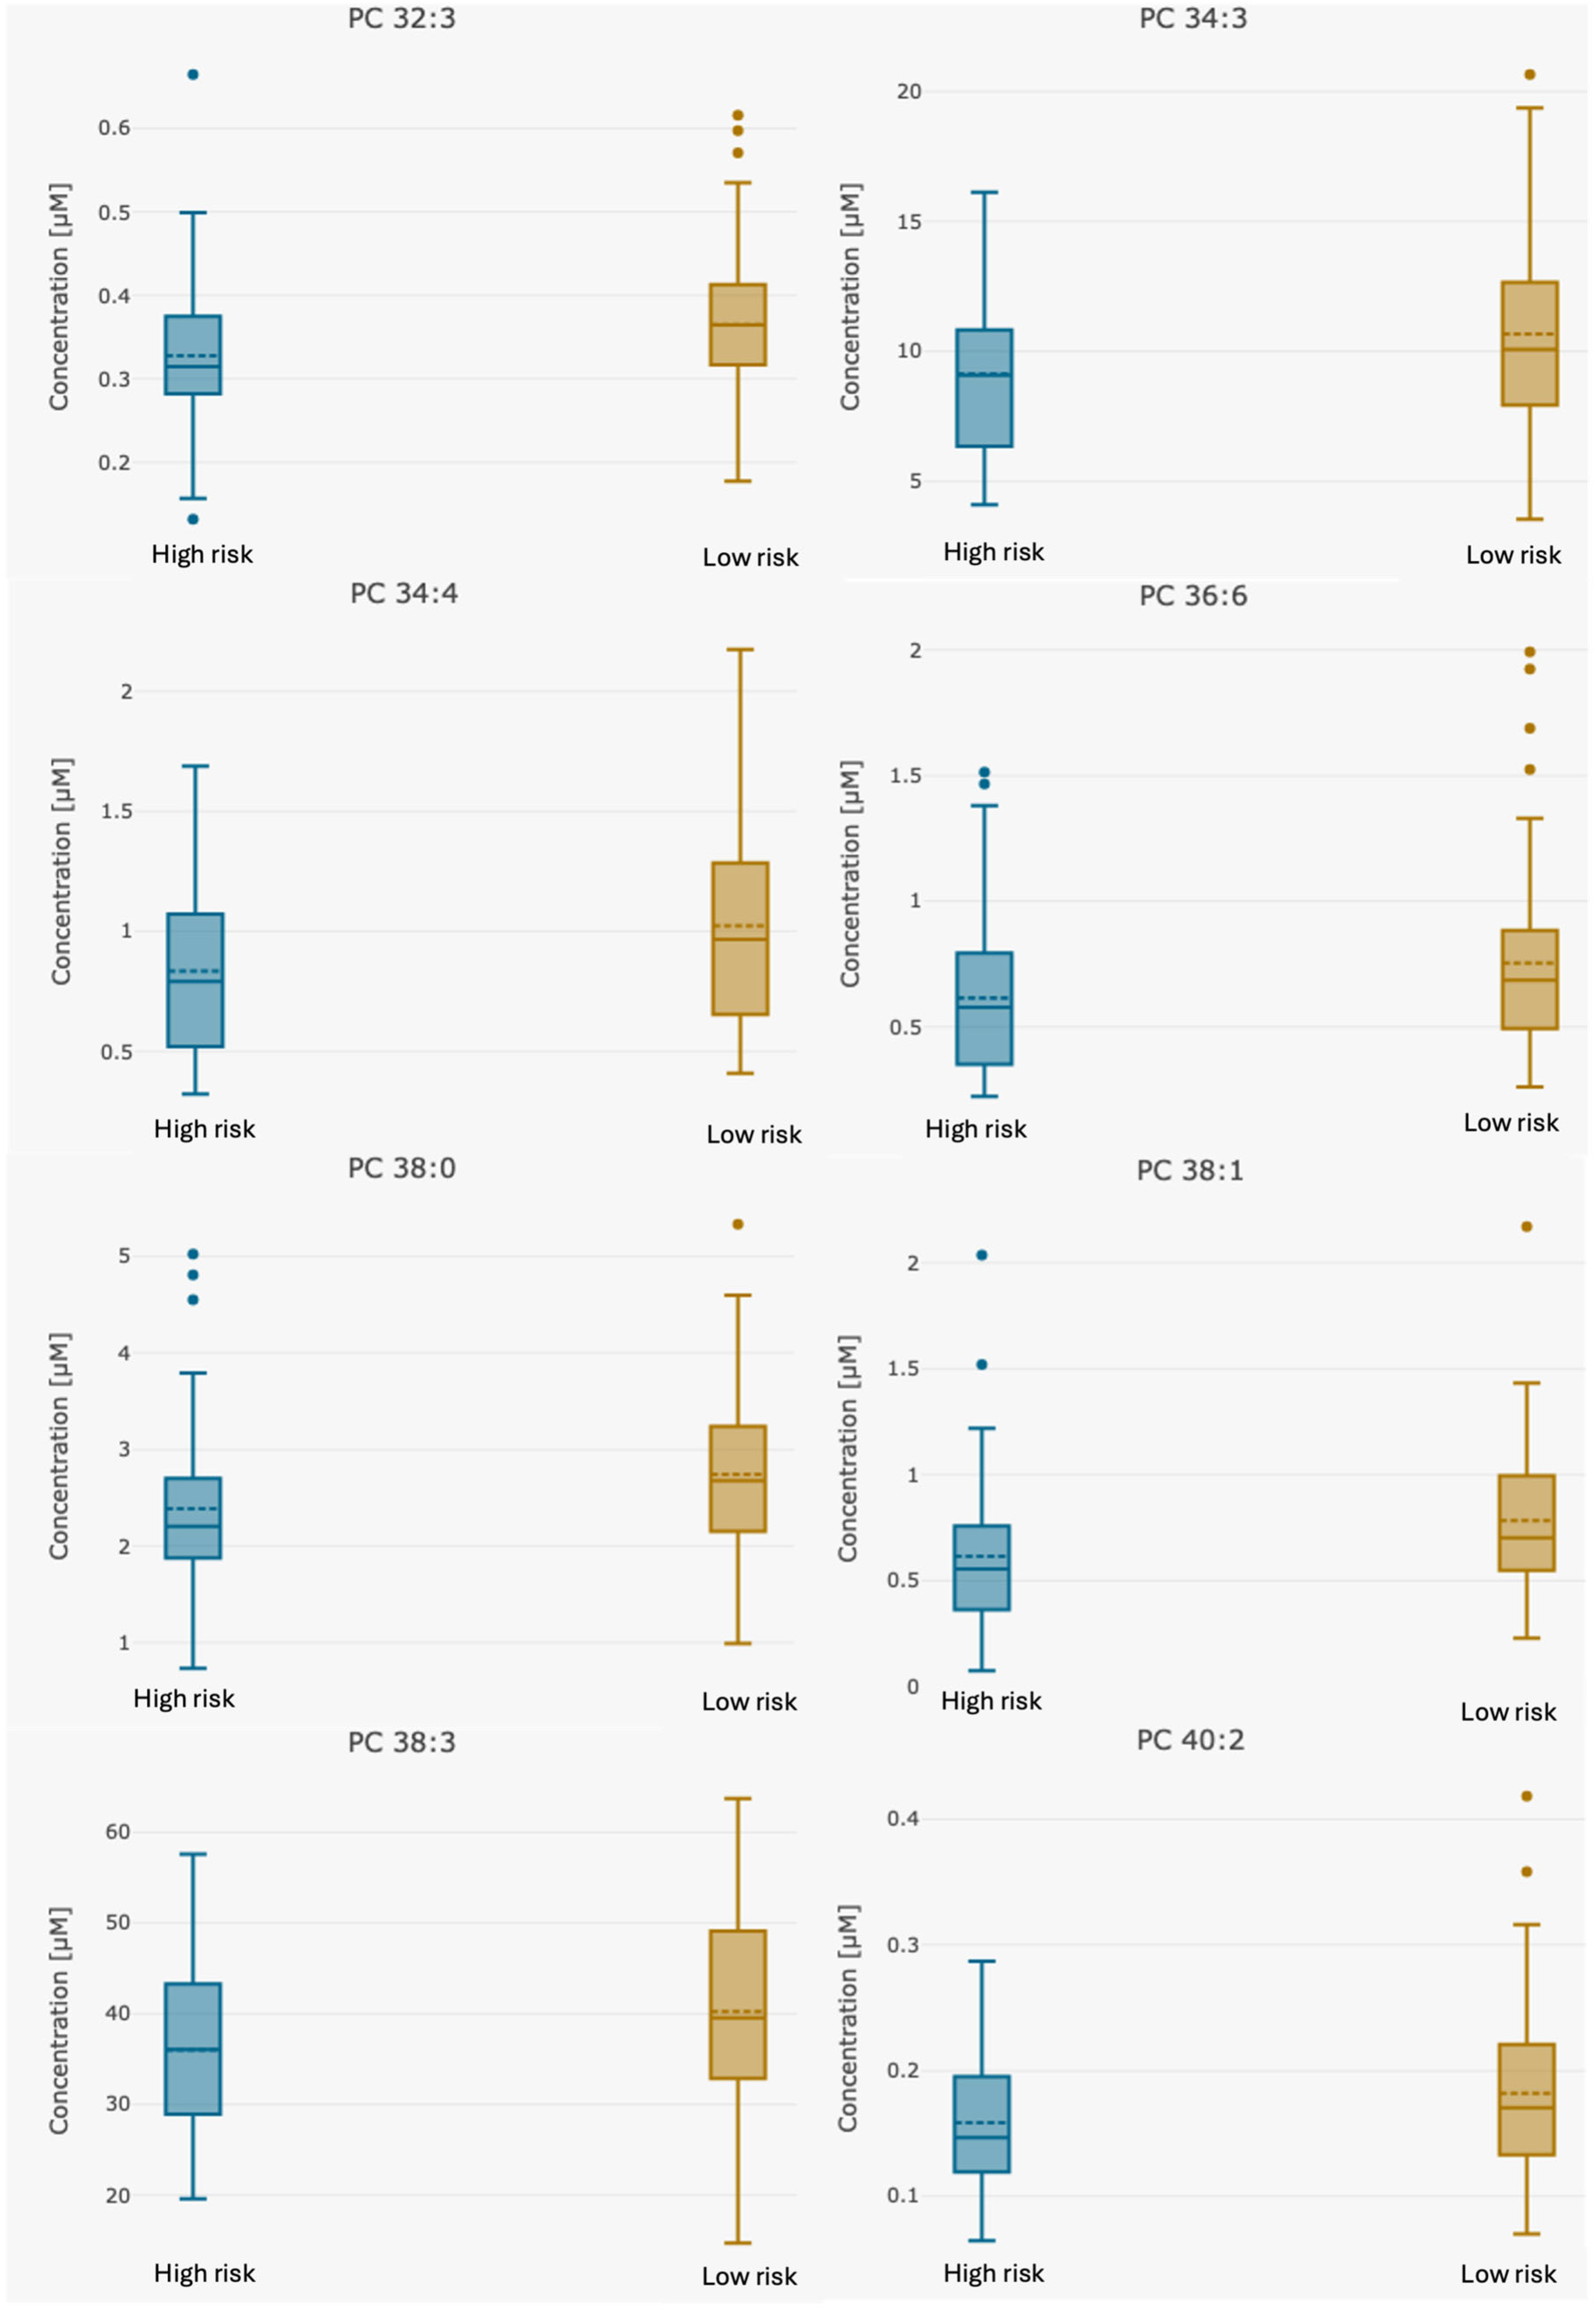
| PC 32:3 | 0.35 (0.132–0.665) | 0.32 (0.132–0.665) | 0.36 (0.178–0.62) | 0.021 |
| PC 34:3 | 9.95 (3.53–20.7) | 9.00 (4.1–16.1) | 10.69 (3.53–20.7) | 0.014 |
| PC 34:4 | 0.93 (0.322–2.17) | 0.80 (0.322–1.69) | 1.02 (0.41–2.17) | 0.0093 |
| PC 36:6 | 0.68 (0.223–1.99) | 0.58 (0.223–1.38) | 0.75 (0.261–1.99) | 0.024 |
| PC 38:0 | 2.52 (0.731–5.34) | 2.24 (0.731–3.79) | 2.75 (0.989–5.34) | 0.02 |
| PC 38:1 | 0.68 (0.00–2.17) | 0.56 (0.00–1.24) | 0.77 (0.00–2.17) | 0.008 |
| PC 38:3 | 37.92 (14.7–63.7) | 34.83 (19.6–57.2) | 40.37 (14.7–63.7) | 0.016 |
| PC 40:2 | 0.17 (0.064–0.418) | 0.15 (0.064–0.26) | 0.18 (0.07–0.42) | 0.028 |
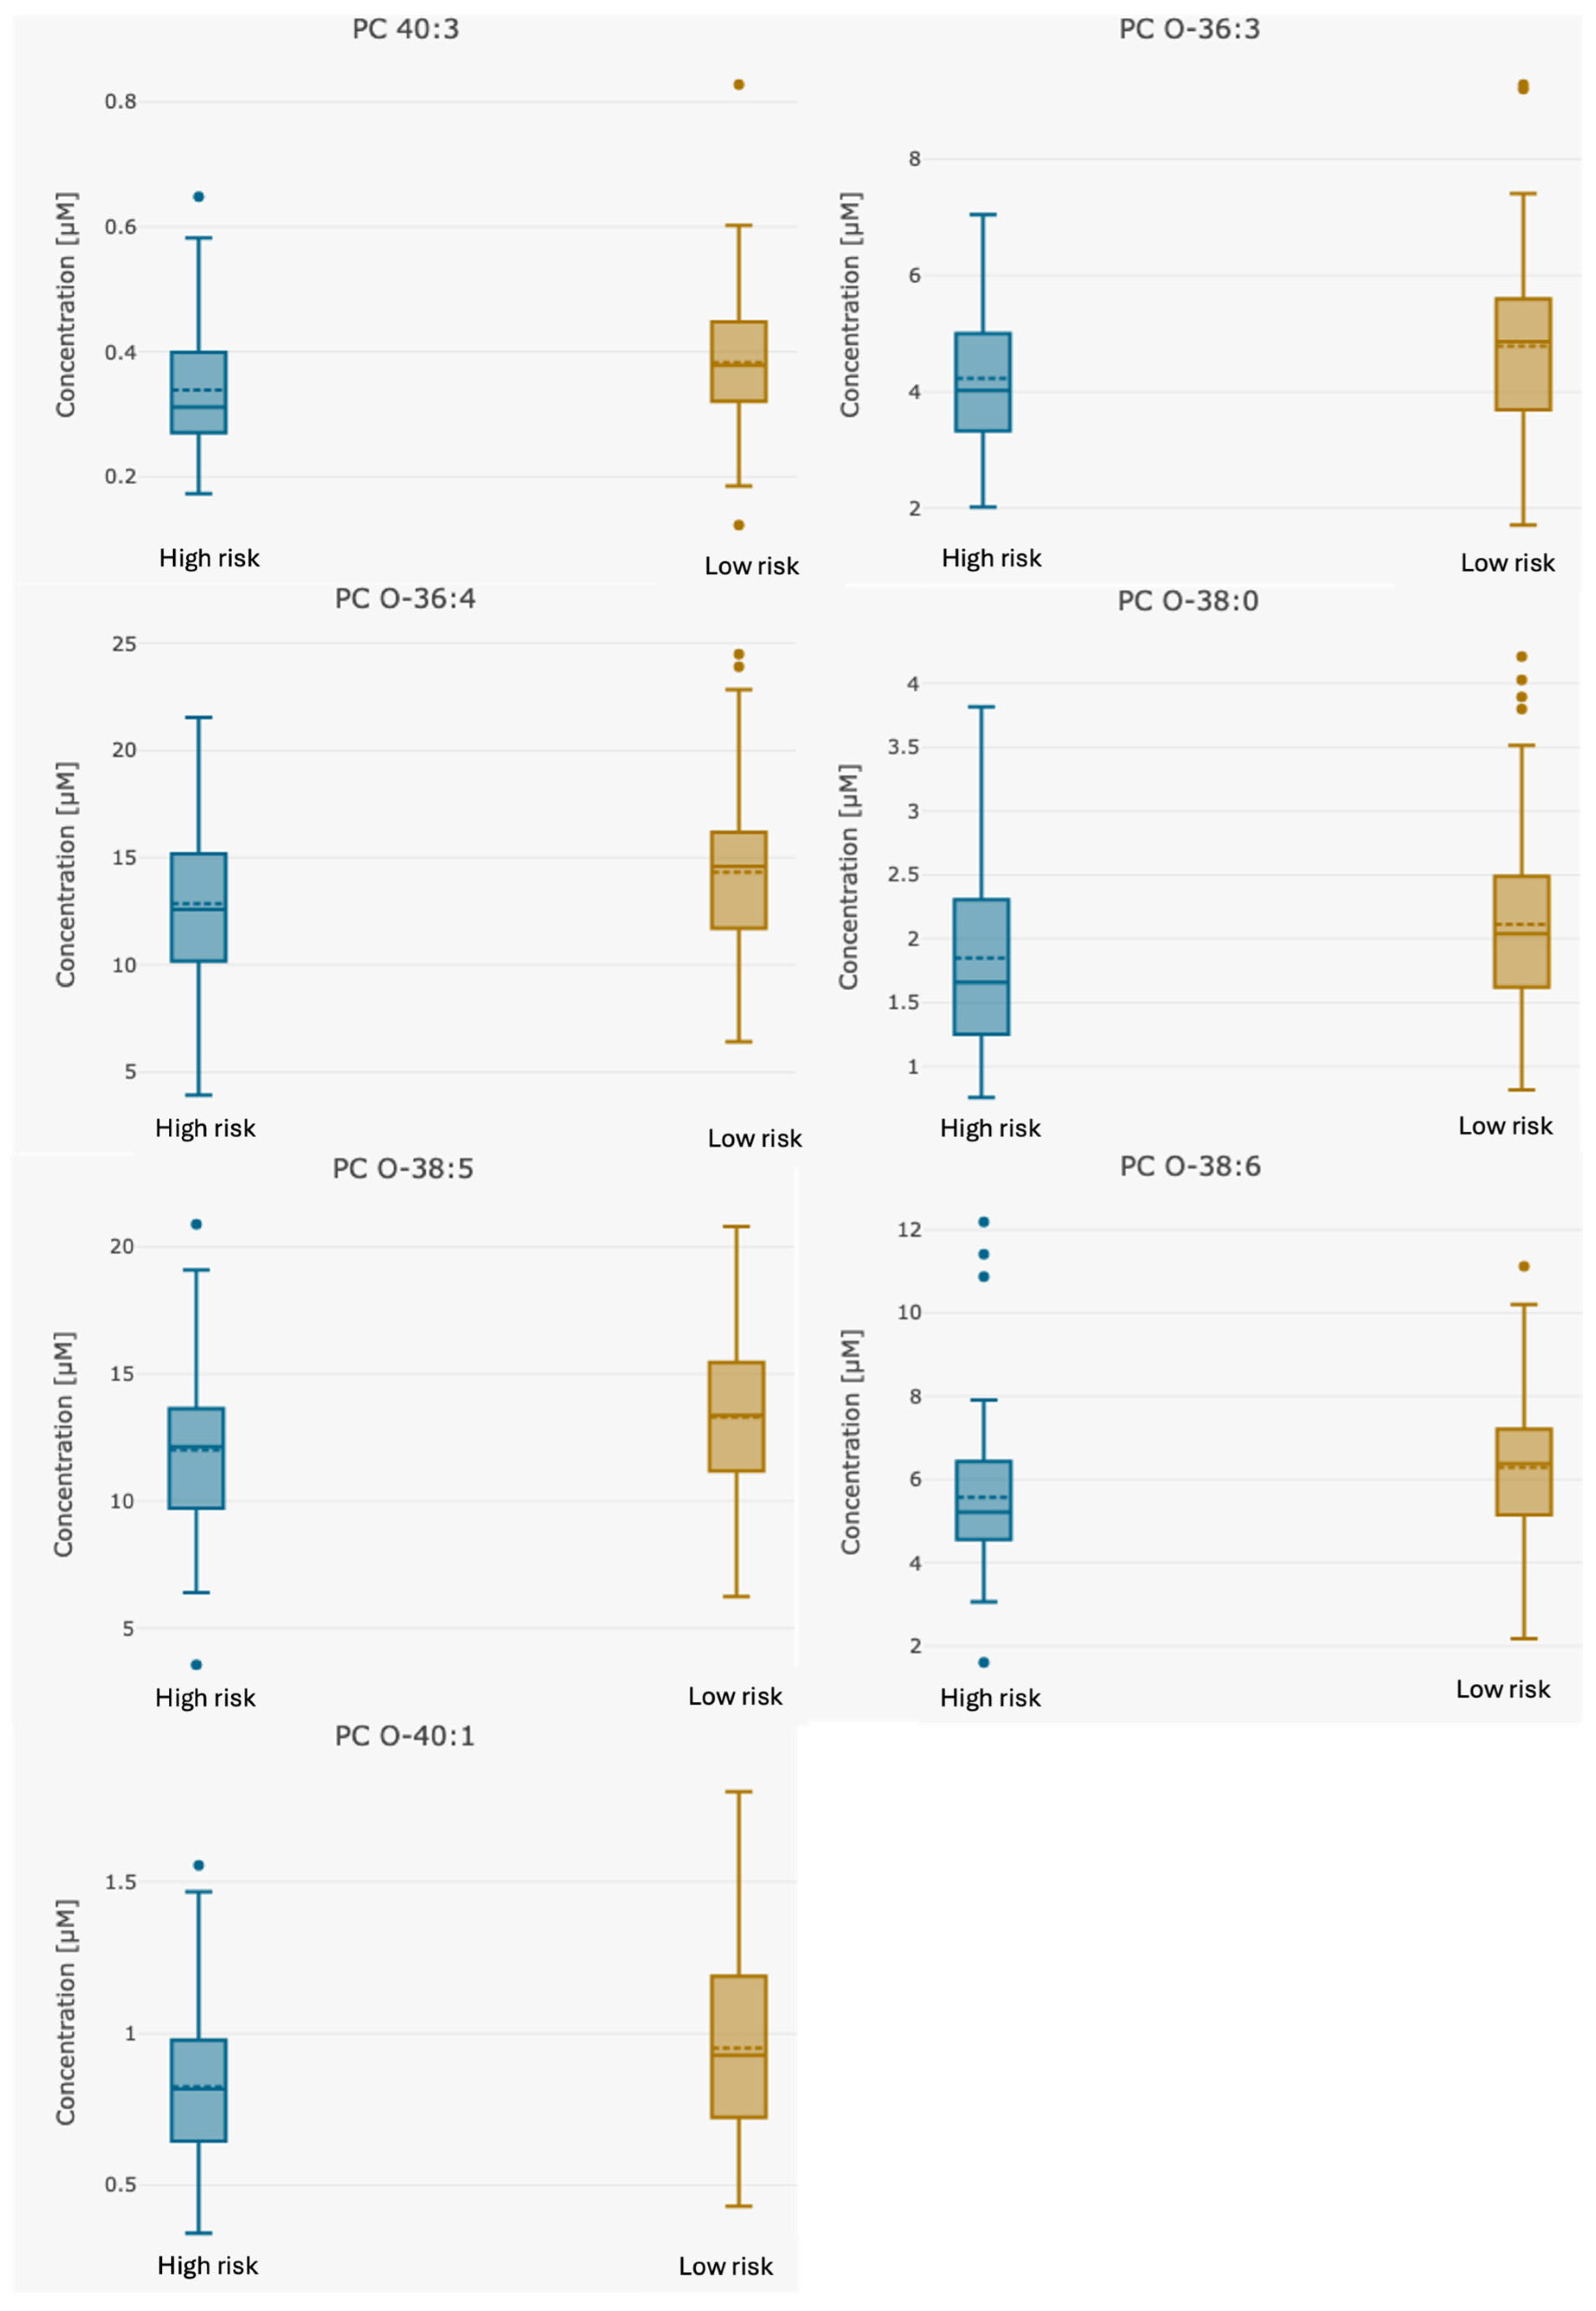
| PC 40:3 | 0.36 (0.122–0.828) | 0.33 (0.173–0.582) | 0.38 (0.122–0.83) | 0.021 |
| PC O-36:3 | 4.51 (1.71–9.28) | 4.17 (2.02–7.05) | 4.79 (1.71–9.28) | 0.03 |
| PC O-36:4 | 13.51 (3.93–24.5) | 12.51 (3.93–21.3) | 14.34 (6.43–24.5) | 0.039 |
| PC O-38:0 | 1.95 (0.756–4.21) | 1.75 (0.756–3.3) | 2.11 (0.819–4.21) | 0.046 |
| PC O-38:5 | 12.54 (3.55–20.8) | 11.60 (3.55–17.1) | 13.31 (6.24–20.8) | 0.034 |
| PC O-38:6 | 5.83 (1.6–11.1) | 5.25 (1.6–8.2) | 6.28 (2.18–11.1) | 0.031 |
| PC O-40:1 | 0.88 (0.341–1.8) | 0.78 (0.341–1.27) | 0.96 (0.43–1.8) | 0.018 |
| Analyte [µM] | Whole Group n = 123 | Group 1 LNN Group n = 107 | Group 2 LNP Group n = 16 | p Group 1 vs. 2 |
|---|---|---|---|---|
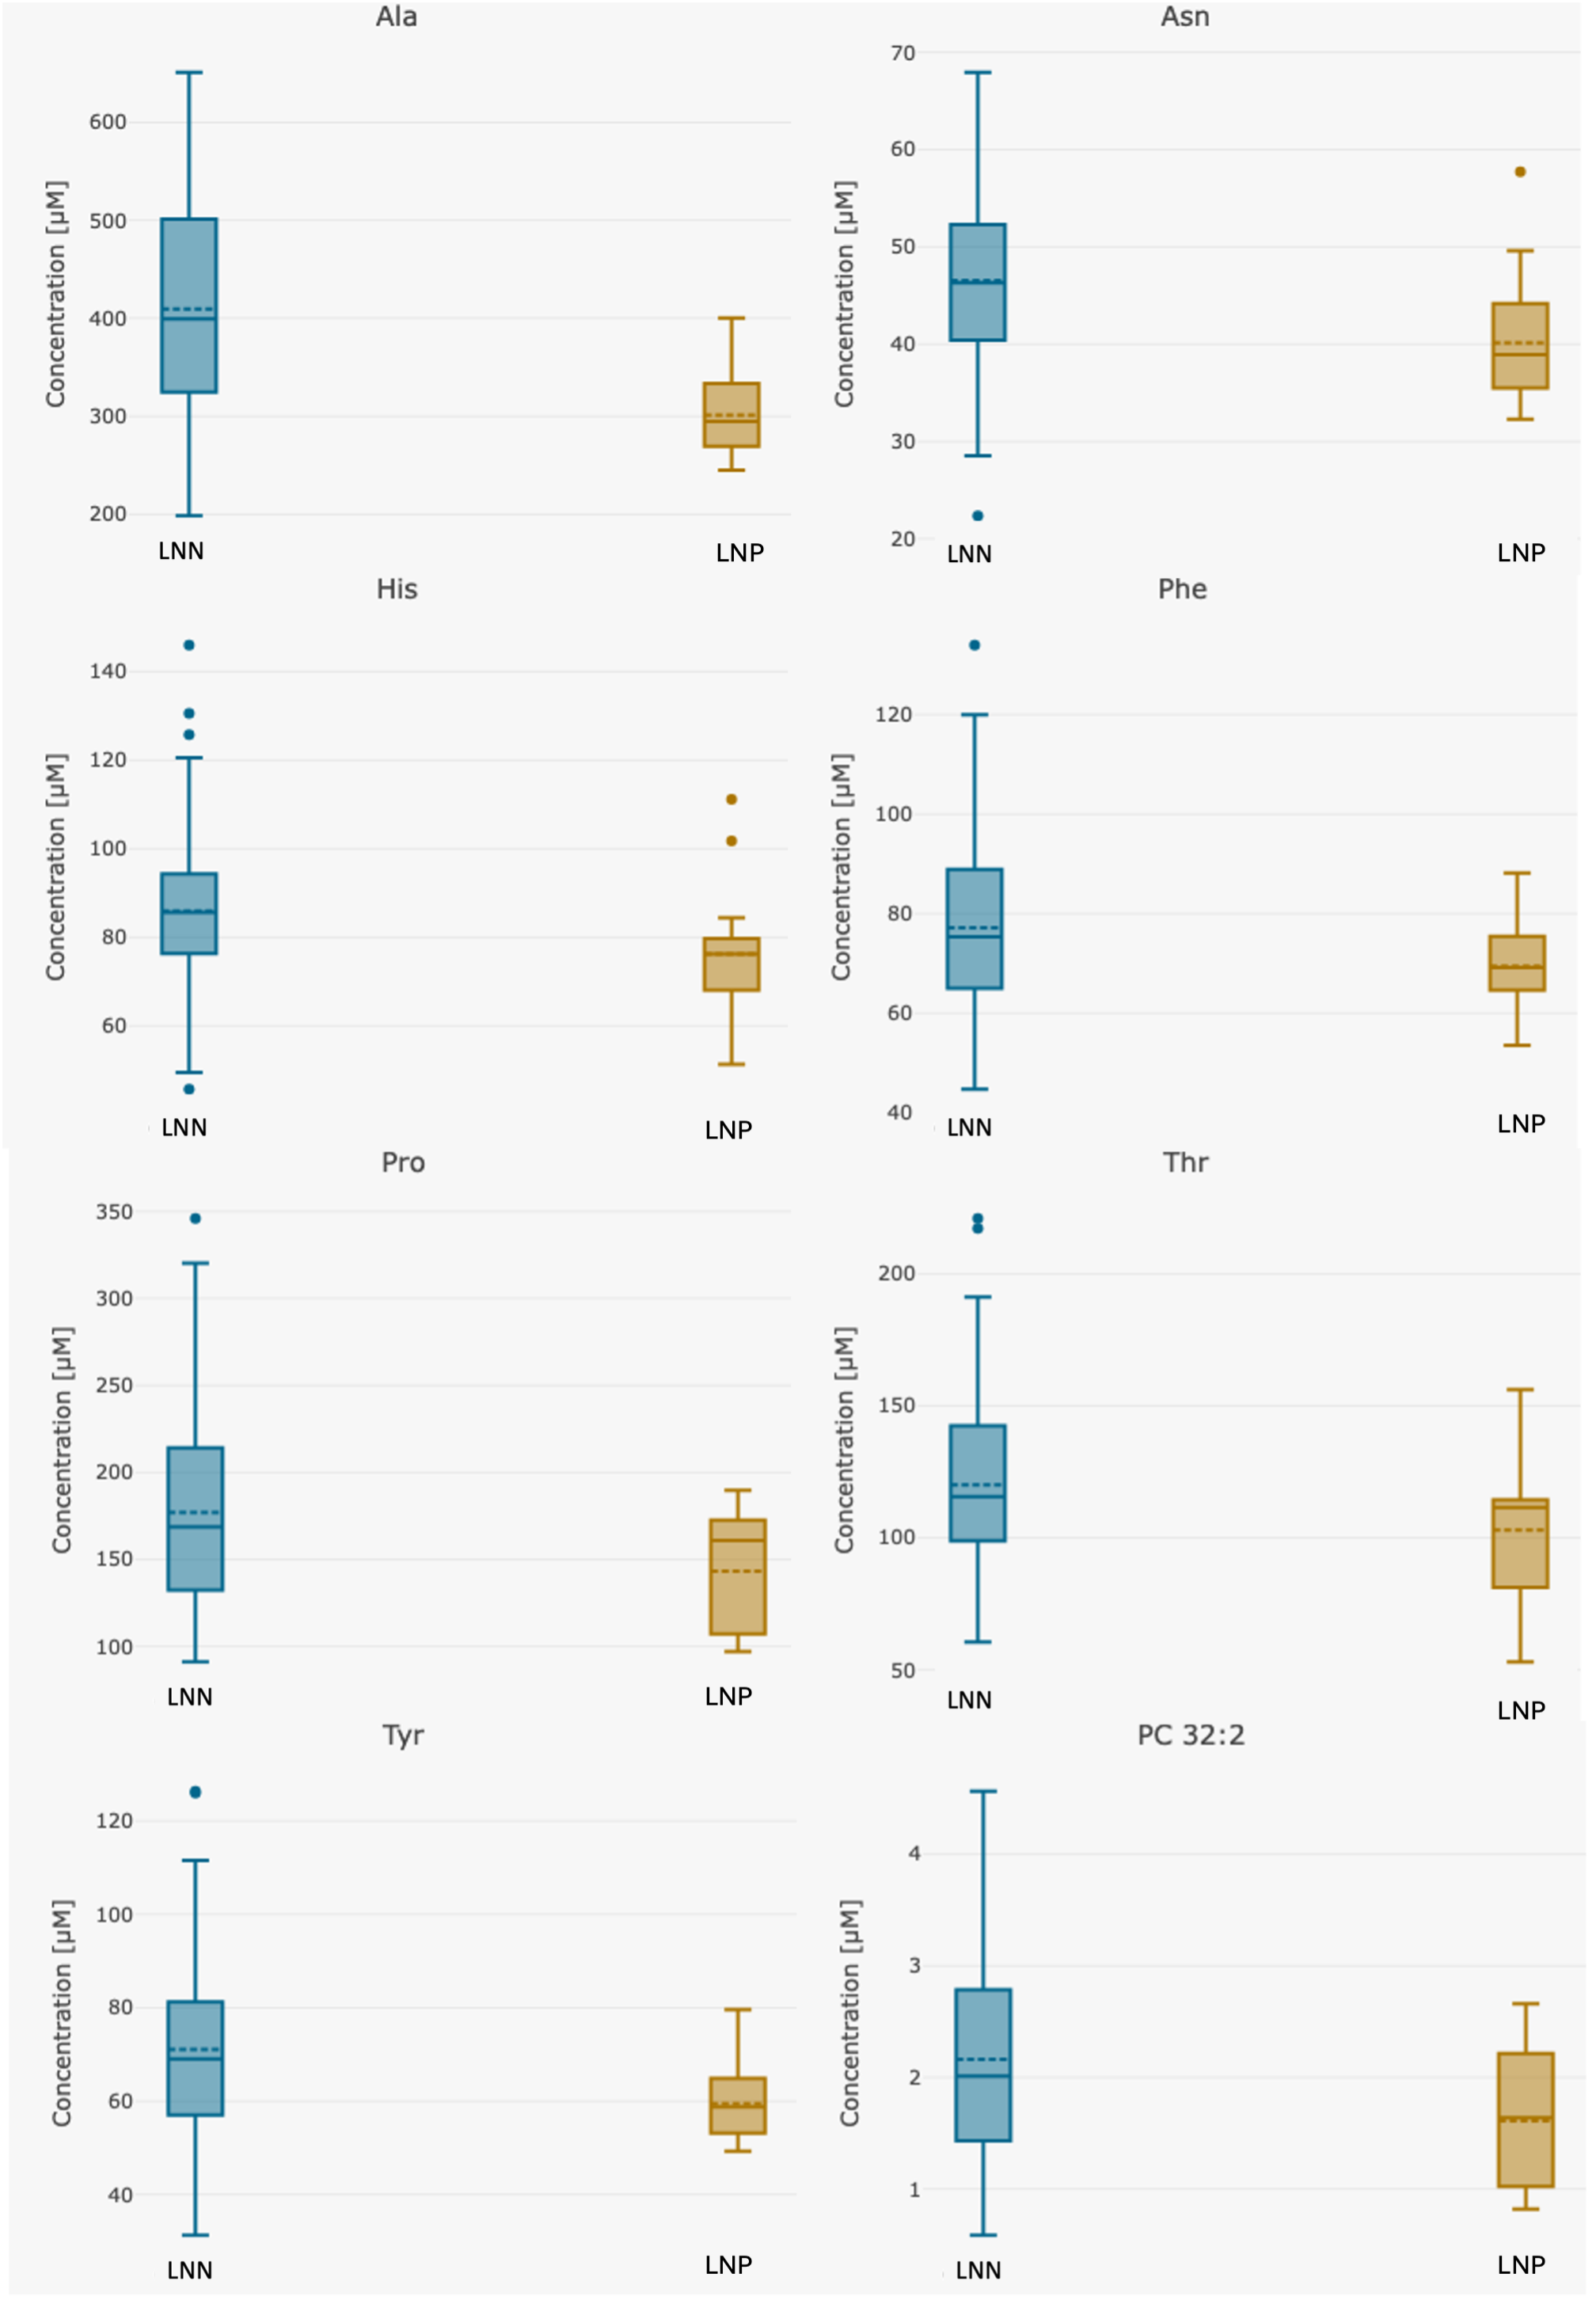
| Alanine | 396.47 (198.0–651.0) | 409.46 (198.0–651.0) | 309.63 (245.0–433.0) | 0.00000076 |
| Asparagine | 45.73 (22.3–68.0) | 46.52 (22.3–68.0) | 40.46 (32.3–57.7) | 0.004 |
| Histidine | 84.65 (45.7–146.0) | 85.97 (45.7–146.0) | 75.85 (51.3–111.0) | 0.034 |
| Phenylalanine | 76.39 (44.7–134.0) | 77.15 (44.7–134.0) | 71.34 (53.5–99.7) | 0.016 |
| Proline | 173.85 (91.0–346.0) | 177.09 (91.0–346.0) | 152.16 (97.1–285.0) | 0.0031 |
| Threonine | 118.00 (53.0–221.0) | 120.12 (60.5–221.0) | 103.81 (53.0–156.0) | 0.035 |
| Tyrosine | 69.94 (31.2–126.0) | 71.10 (31.2–126.0) | 62.23 (49.3–104.0) | 0.00018 |
| PC 32:2 | 2.09 (0.6–4.6) | 2.16 (0.6–4.6) | 1.65 (0.8–2.7) | 0.0069 |
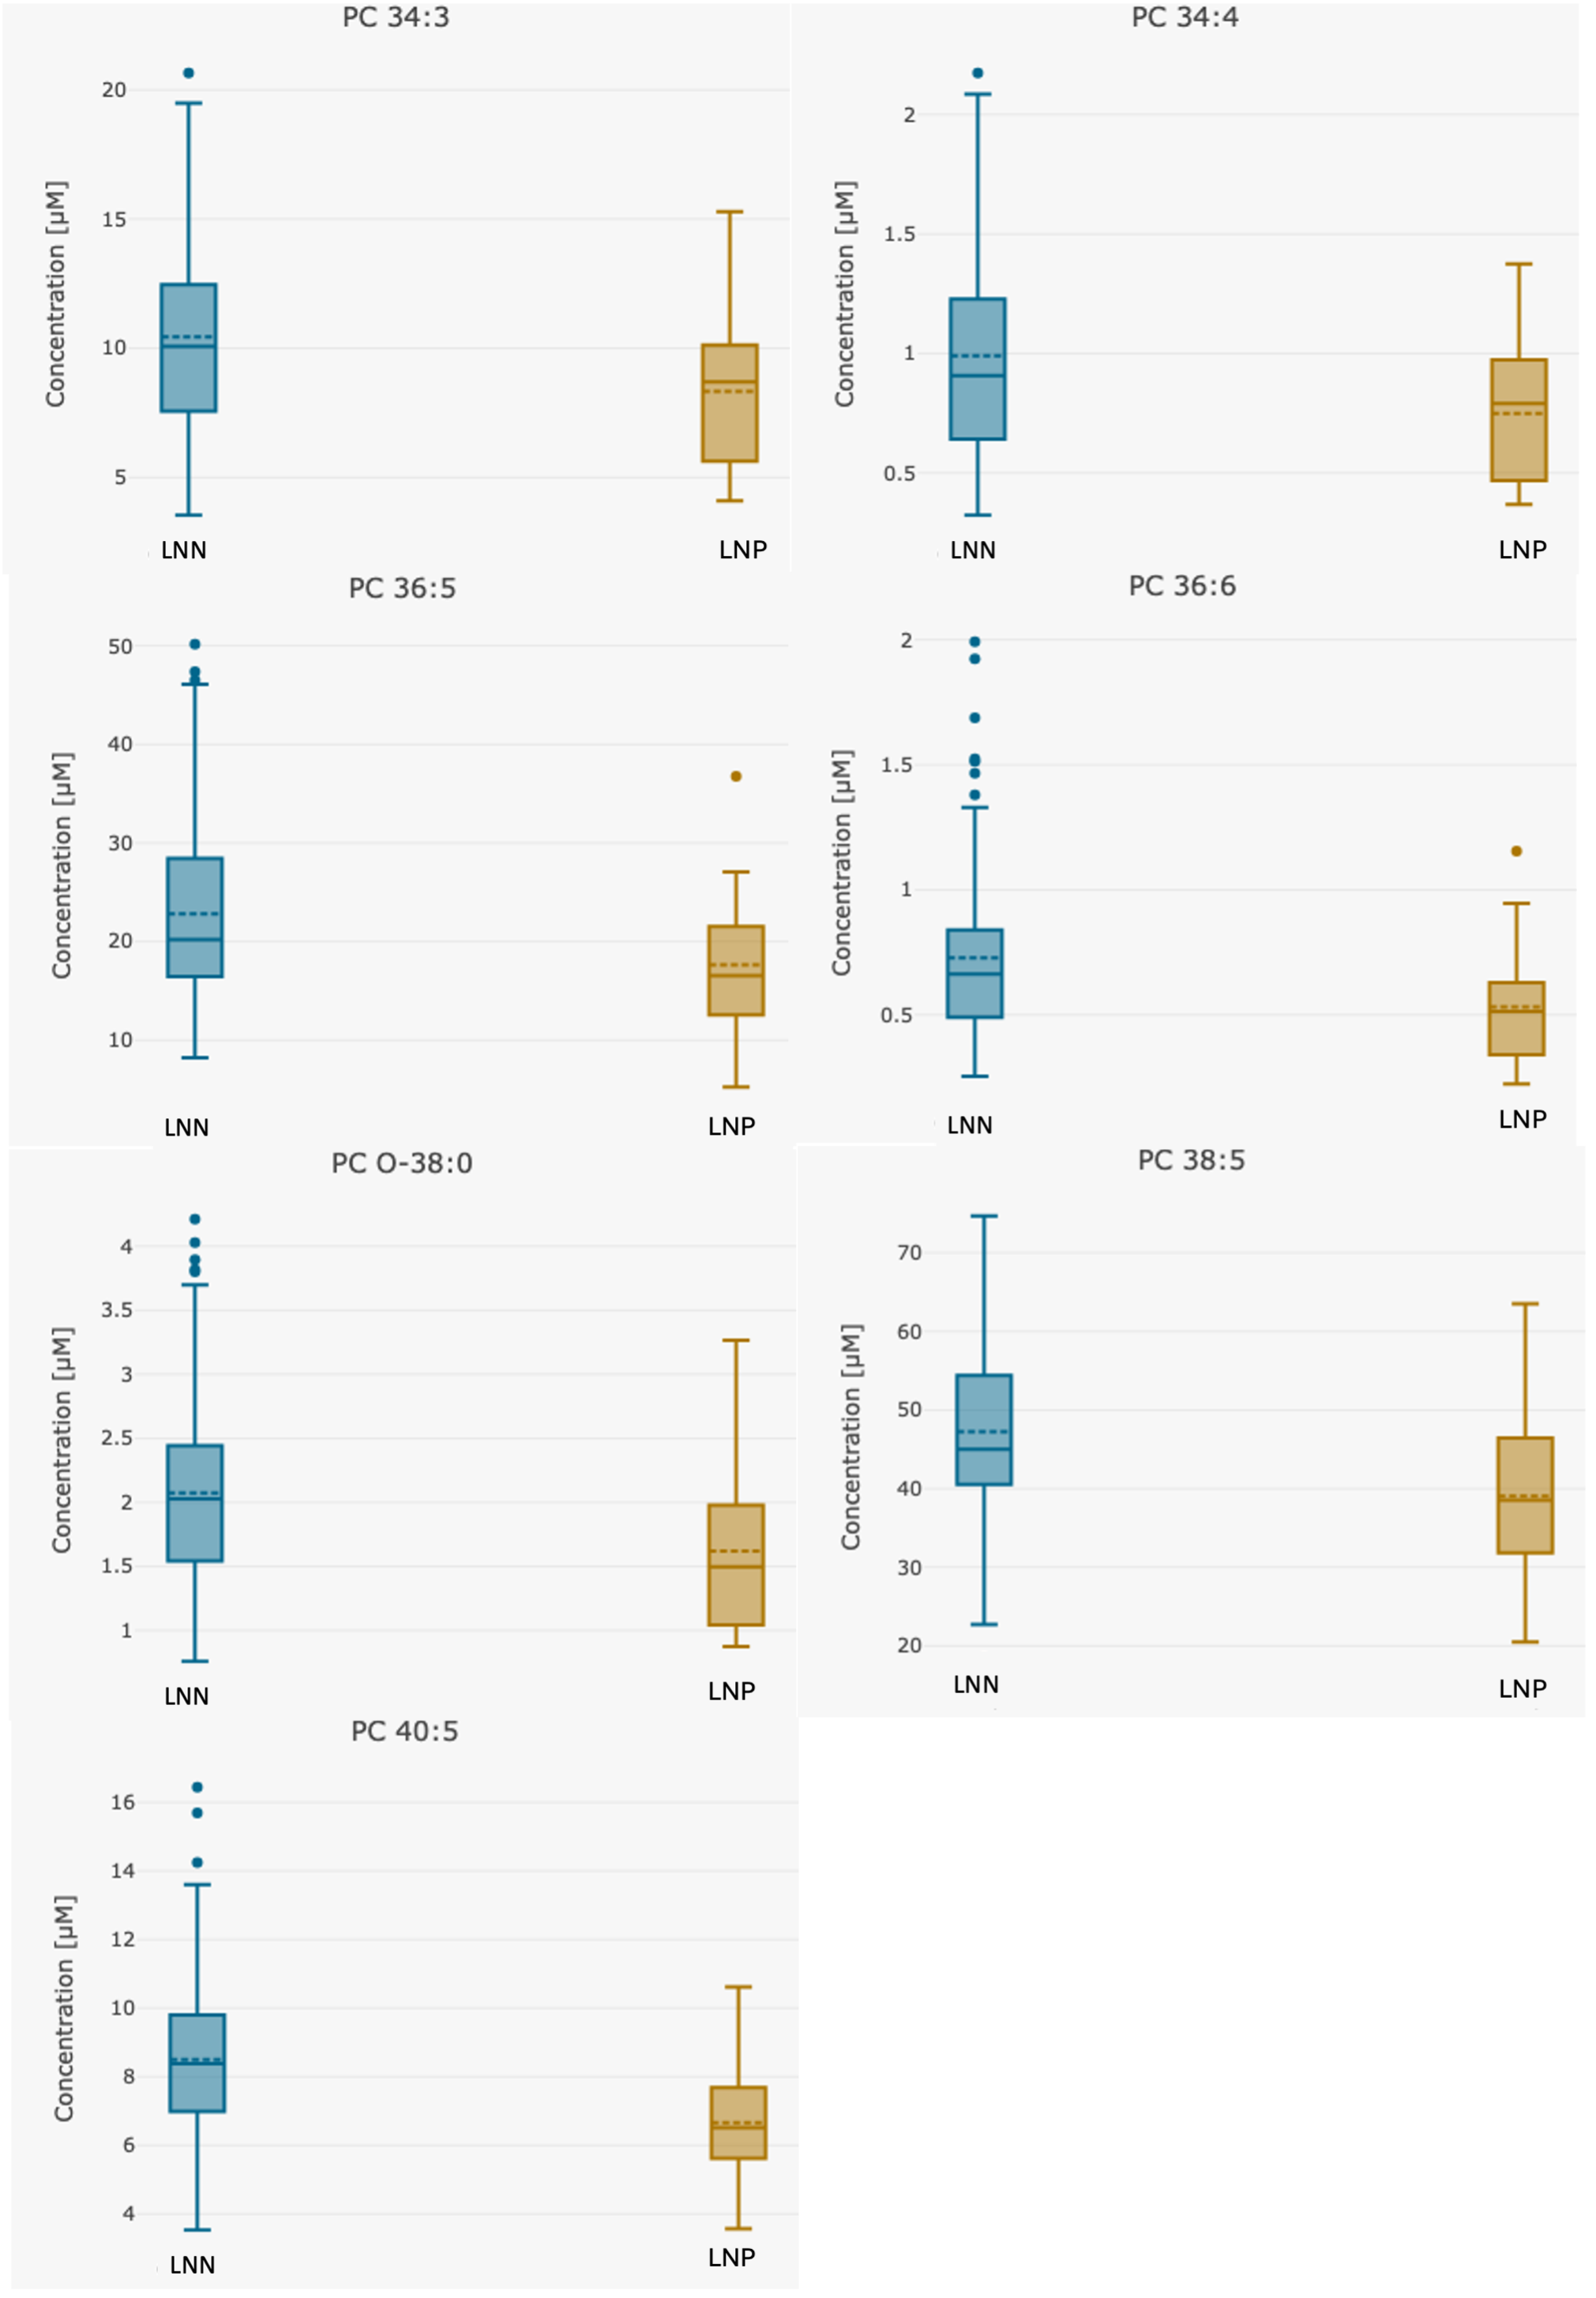
| PC 34:3 | 10.16 (3.5–20.7) | 10.44 (3.5–20.7) | 8.32 (4.1–15.3) | 0.032 |
| PC 34:4 | 0.96 (0.3–2.2) | 0.99 (0.3–2.2) | 0.78 (0.4–1.4) | 0.016 |
| PC 36:5 | 22.18 (5.2–50.2) | 22.82 (8.2–50.2) | 17.96 (5.2–36.8) | 0.033 |
| PC 36:6 | 0.71 (0.2–2.0) | 0.73 (0.3–2.0) | 0.57 (0.2–1.2) | 0.017 |
| PC 38:5 | 46.12 (18.4–74.7) | 47.22 (18.4–74.7) | 38.81 (20.5–63.5) | 0.016 |
| PC 40:5 | 8.24 (3.5–16.4) | 8.50 (3.5–16.4) | 6.54 (3.57–10.6) | 0.0013 |
| PC O-38:0 | 2.02 (0.8–4.2) | 2.07 (0.8–4.2) | 1.66 (0.873–3.27) | 0.029 |
Disclaimer/Publisher’s Note: The statements, opinions and data contained in all publications are solely those of the individual author(s) and contributor(s) and not of MDPI and/or the editor(s). MDPI and/or the editor(s) disclaim responsibility for any injury to people or property resulting from any ideas, methods, instructions or products referred to in the content. |
© 2025 by the authors. Licensee MDPI, Basel, Switzerland. This article is an open access article distributed under the terms and conditions of the Creative Commons Attribution (CC BY) license (https://creativecommons.org/licenses/by/4.0/).
Share and Cite
Pietkiewicz, D.; Zaborowski, M.P.; Plewa, S.; Potograbski, M.; Miedziarek, C.; Kluz, T.; Nowak-Markwitz, E.; Matysiak, J. Targeted Metabolomic Serum Analysis of Patients with High and Low Risk of Endometrial Cancer Recurrence and Positive and Negative Lymph Node Status. Metabolites 2025, 15, 422. https://doi.org/10.3390/metabo15070422
Pietkiewicz D, Zaborowski MP, Plewa S, Potograbski M, Miedziarek C, Kluz T, Nowak-Markwitz E, Matysiak J. Targeted Metabolomic Serum Analysis of Patients with High and Low Risk of Endometrial Cancer Recurrence and Positive and Negative Lymph Node Status. Metabolites. 2025; 15(7):422. https://doi.org/10.3390/metabo15070422
Chicago/Turabian StylePietkiewicz, Dagmara, Mikołaj Piotr Zaborowski, Szymon Plewa, Michał Potograbski, Cezary Miedziarek, Tomasz Kluz, Ewa Nowak-Markwitz, and Jan Matysiak. 2025. "Targeted Metabolomic Serum Analysis of Patients with High and Low Risk of Endometrial Cancer Recurrence and Positive and Negative Lymph Node Status" Metabolites 15, no. 7: 422. https://doi.org/10.3390/metabo15070422
APA StylePietkiewicz, D., Zaborowski, M. P., Plewa, S., Potograbski, M., Miedziarek, C., Kluz, T., Nowak-Markwitz, E., & Matysiak, J. (2025). Targeted Metabolomic Serum Analysis of Patients with High and Low Risk of Endometrial Cancer Recurrence and Positive and Negative Lymph Node Status. Metabolites, 15(7), 422. https://doi.org/10.3390/metabo15070422