


Impact of Dietary Carbohydrate Levels on Growth Performance, Feed Efficiency, and Immune Response in Litopenaeus vannamei Cultured in Biofloc Systems

Abstract
1. Introduction
2. Materials and Methods
2.1. Experimental Diets
2.2. Culture Experiment
2.3. Water Quality Parameter Measurement
2.4. Sample Collection
2.5. Proximate Composition Analysis
2.6. Hepatopancreas and Hemolymph Parameter Measurement
2.7. Statistical Analysis
3. Results
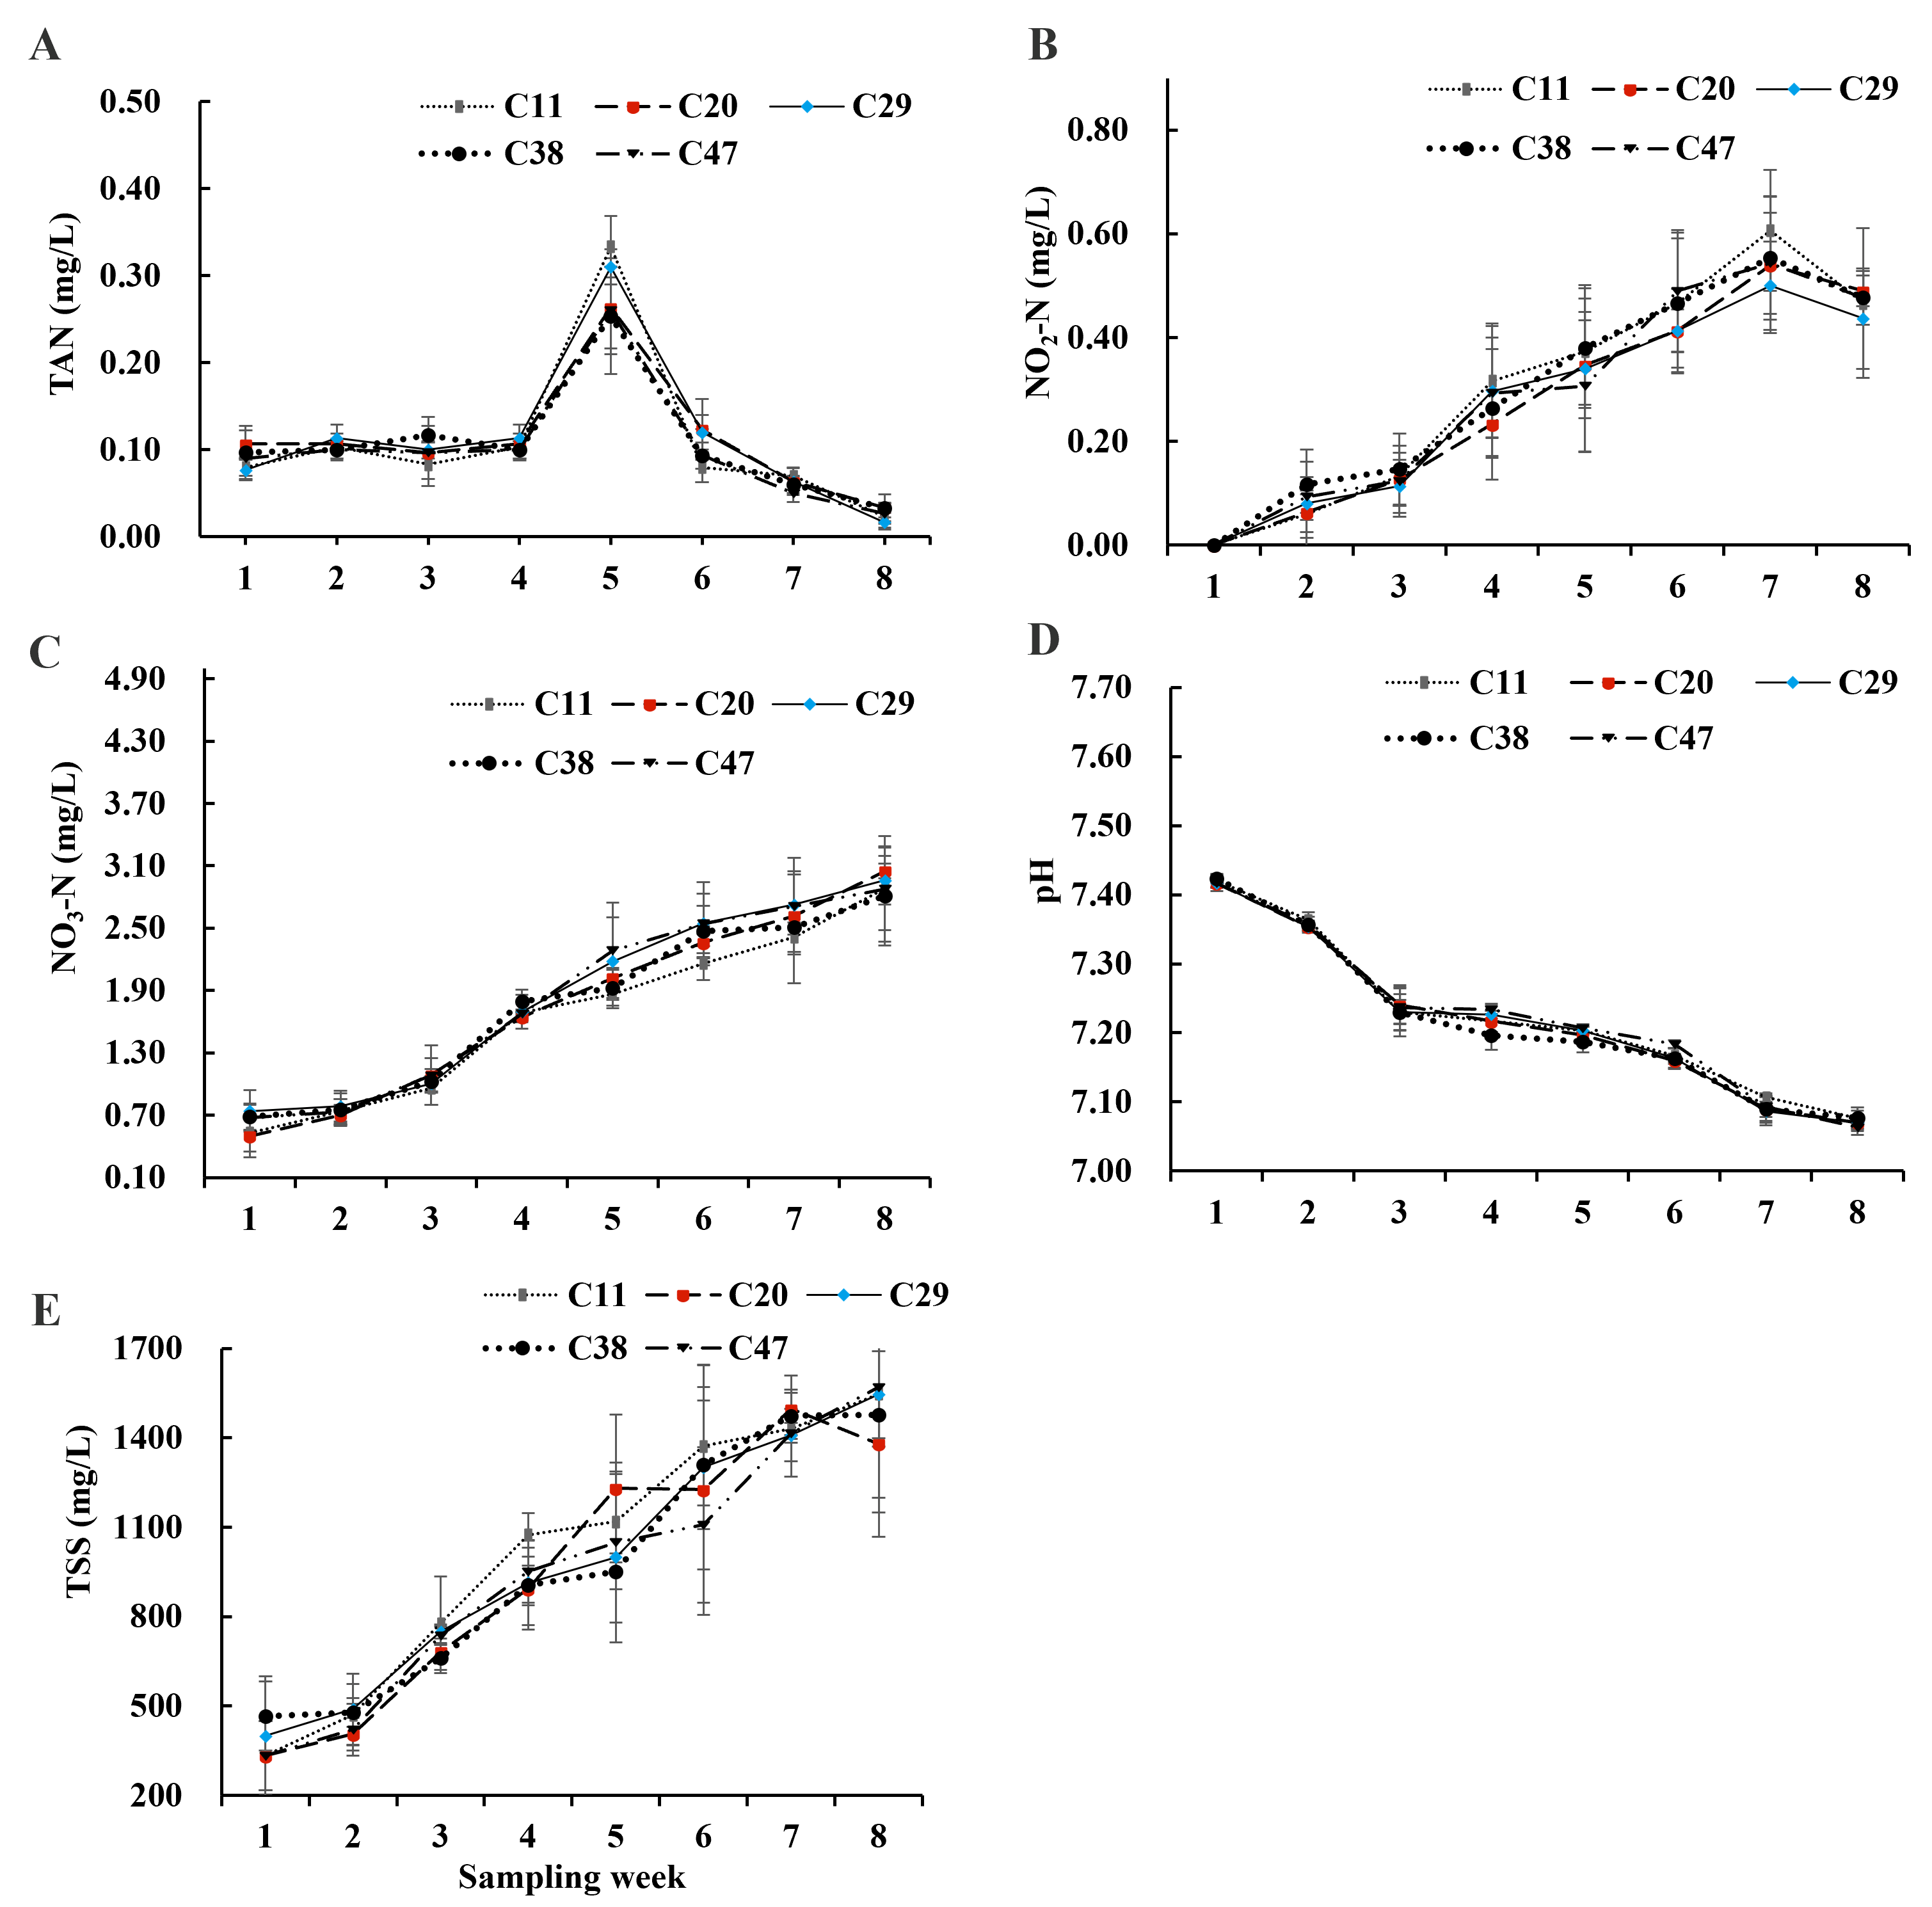
3.1. Water Quality
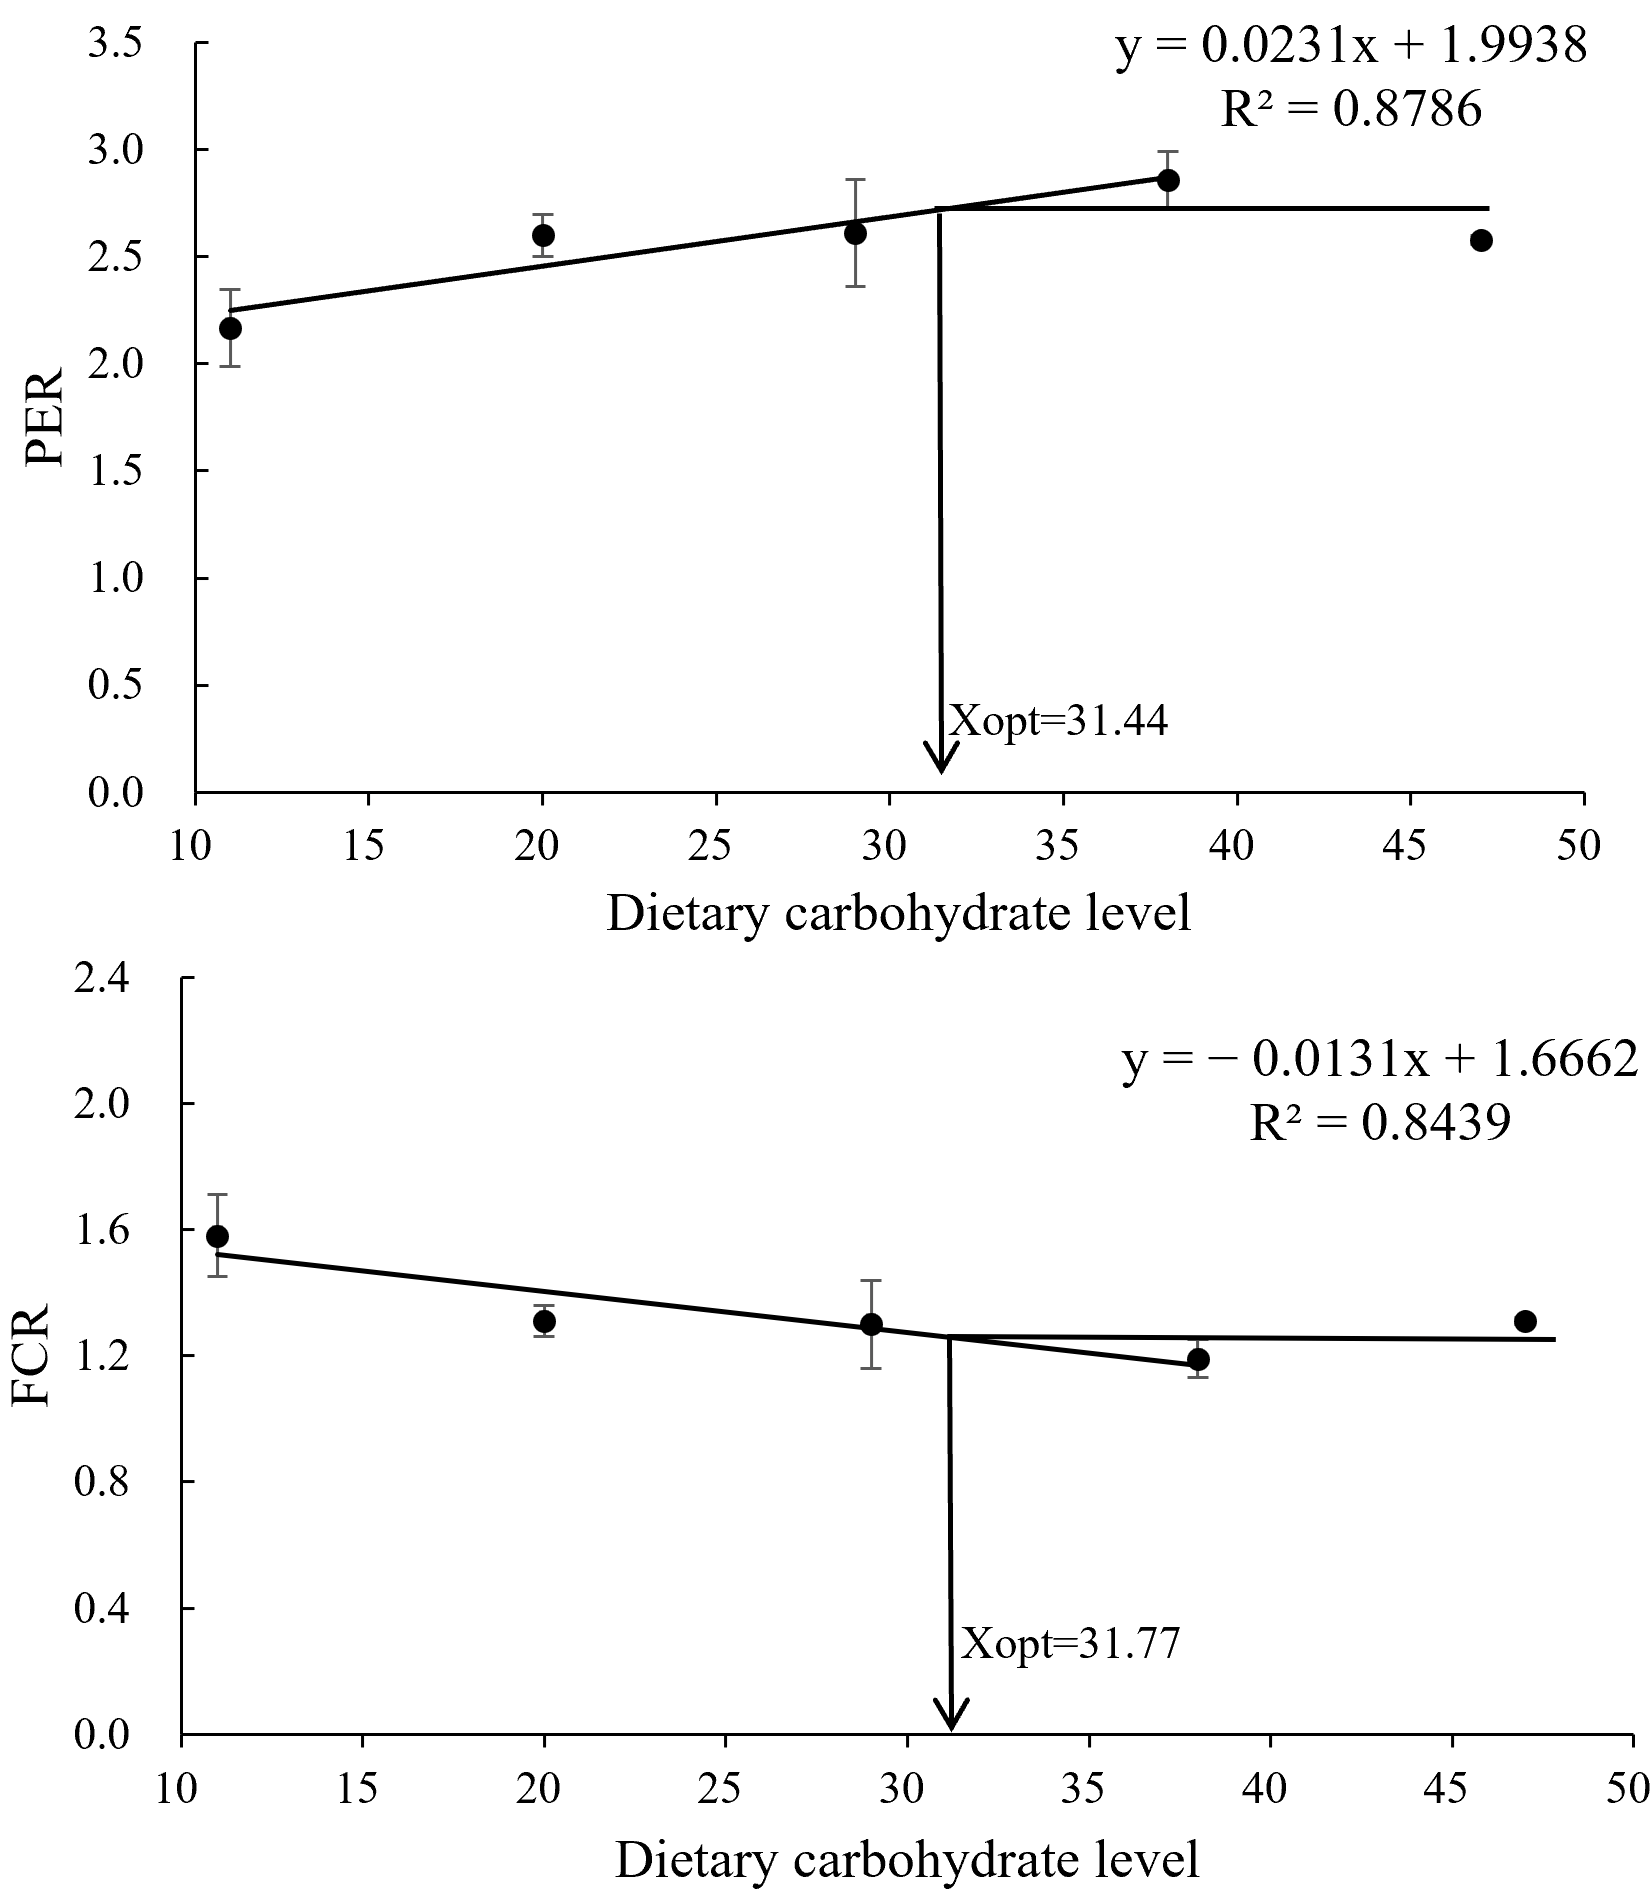
3.2. Growth Performance, Survival, and Feed Utilization
3.3. Proximate Composition of Shrimp and Biofloc
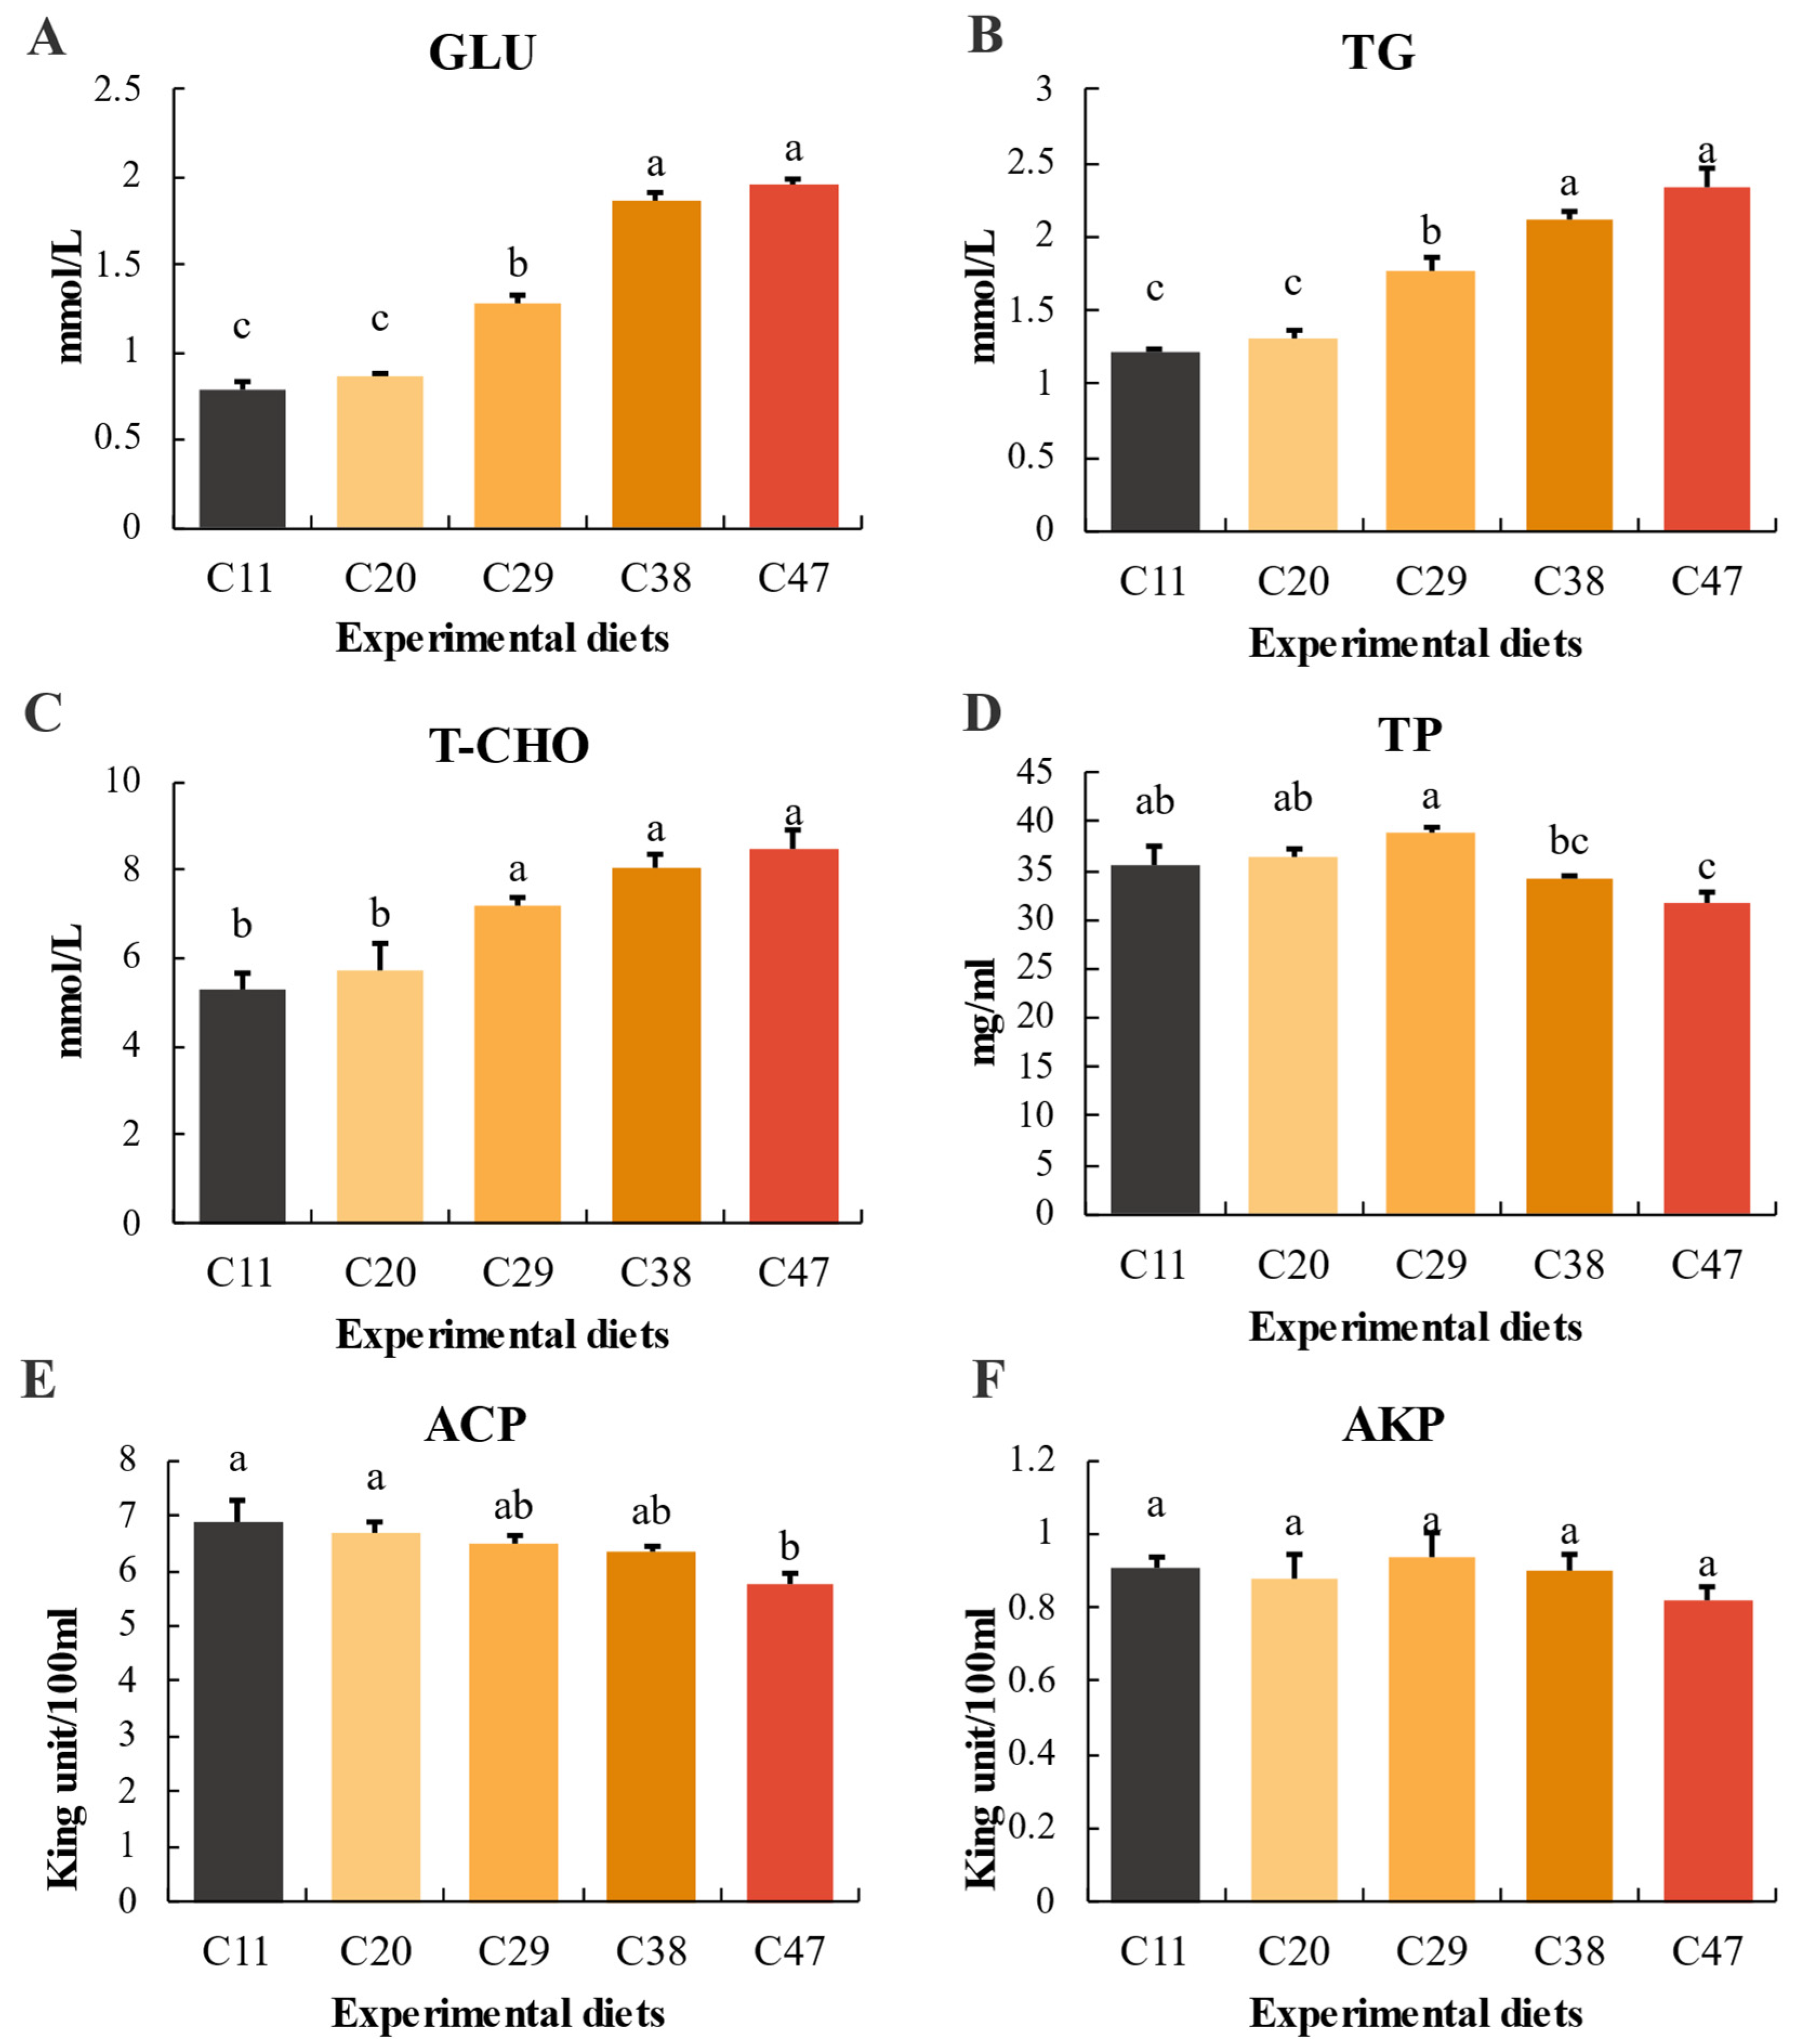
3.4. Hemolymph Biochemical Parameters
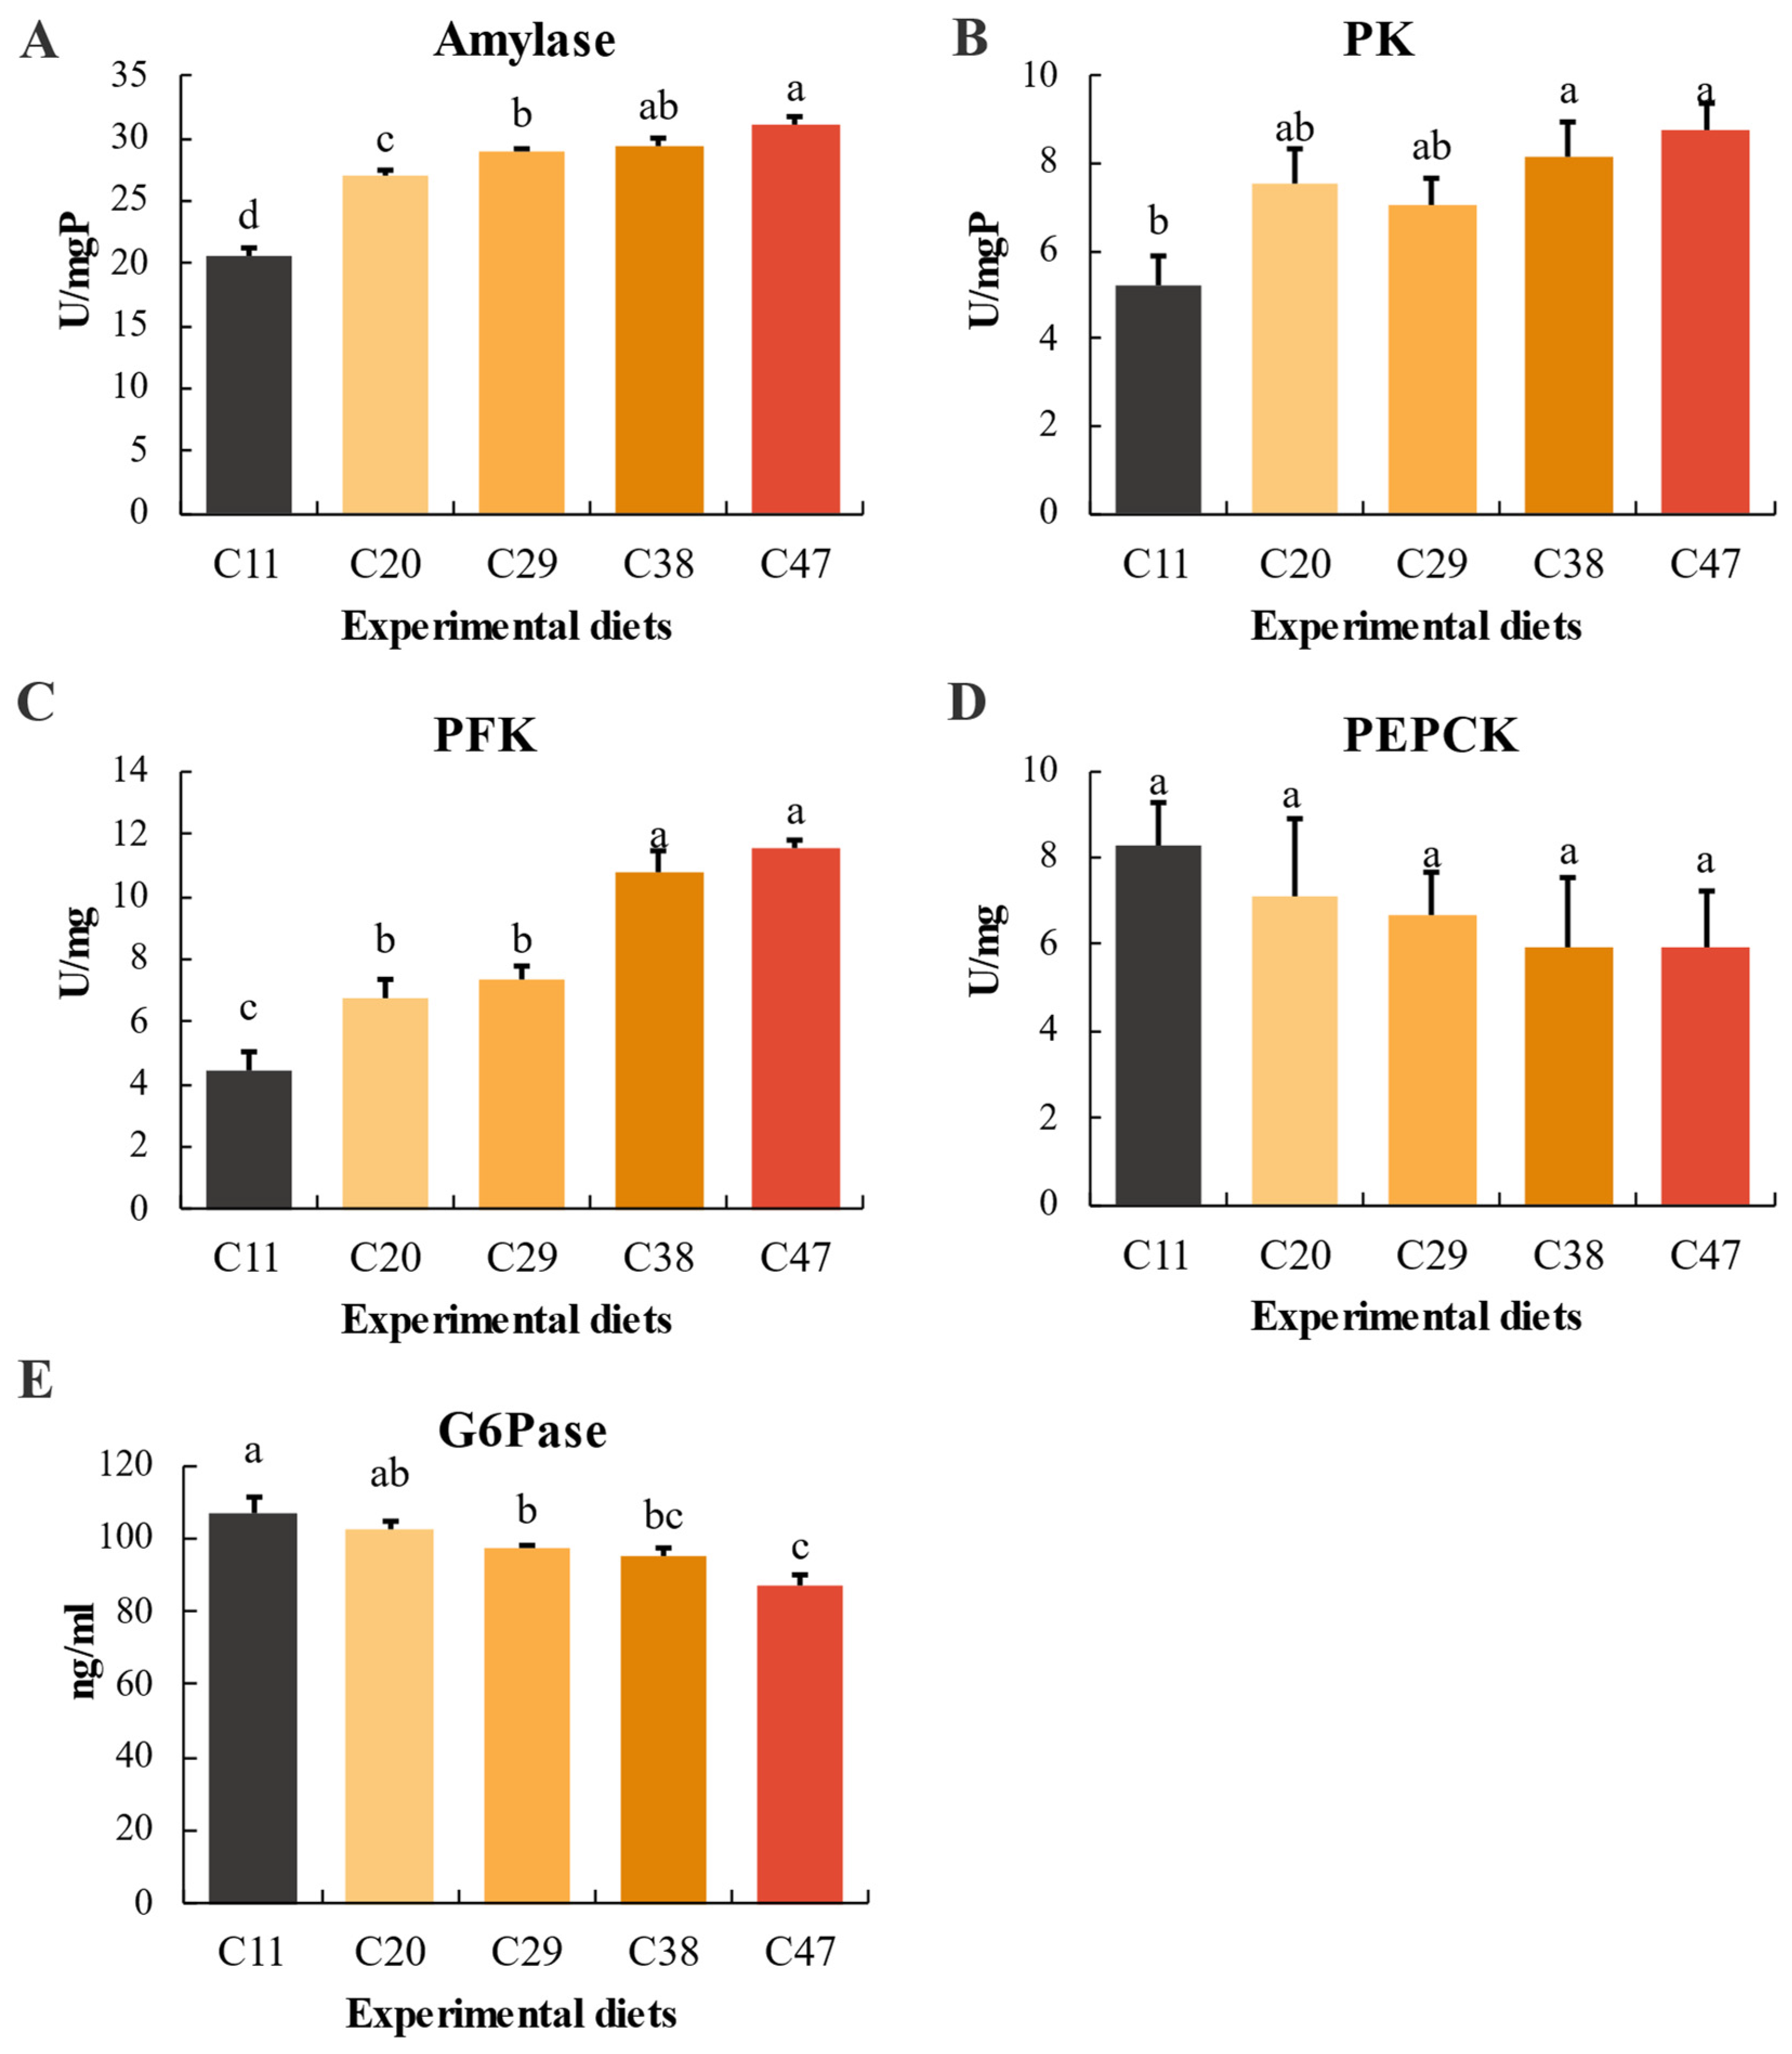
3.5. Amylase and Carbohydrate Metabolism Enzyme Activity
3.6. Antioxidant Enzymes
4. Discussion
5. Conclusions
Author Contributions
Funding
Informed Consent Statement
Data Availability Statement
Conflicts of Interest
References
- Tian, J.; Wu, W.; Li, J.; Wan, X.; Zhao, Z.; Xi, R.; Hu, X.; Pan, M.; Xue, Y.; Yu, W. Development Dilemma of Litopenaeus vannamei Industry in China, Current Countermeasures Taken and Its Implications for the World Shrimp Aquaculture Industry. Isr. J. Aquac.-Bamidgeh 2024, 76, 3. [Google Scholar] [CrossRef]
- Iber, B.T.; Kasan, N.A. Recent advances in Shrimp aquaculture wastewater management. Heliyon 2021, 7, e08283. [Google Scholar] [CrossRef]
- Emerenciano, M.G.C.; Khanjani, M.H.; Sharifinia, M.; Miranda-Baeza, A. Could Biofloc Technology (BFT) Pave the Way Toward a More Sustainable Aquaculture in Line With the Circular Economy? Aquac. Res. 2025, 2025, 1020045. [Google Scholar] [CrossRef]
- Xu, W.; Wen, G.; Su, H.; Xu, Y.; Hu, X.; Cao, Y. Effect of input C/N ratio on bacterial community of water biofloc and shrimp gut in a commercial zero-exchange system with intensive production of Penaeus vannamei. Microorganisms 2022, 10, 1060. [Google Scholar] [CrossRef] [PubMed]
- Abakari, G.; Luo, G.; Kombat, E.O. Dynamics of nitrogenous compounds and their control in biofloc technology (BFT) systems: A review. Aquac. Fish. 2021, 6, 441–447. [Google Scholar] [CrossRef]
- Khanjani, M.H.; Eslami, J.; Emerenciano, M.G.C. Wheat flour as carbon source on water quality, growth performance, hemolymph biochemical and immune parameters of Pacific white shrimp (Penaeus vannamei) juveniles in biofloc technology (BFT). Aquac. Rep. 2025, 40, 102623. [Google Scholar] [CrossRef]
- Huang, L.; Guo, H.; Liu, Z.; Chen, C.; Wang, K.; Huang, X.; Chen, W.; Zhu, Y.; Yan, M.; Zhang, D. Contrasting patterns of bacterial communities in the rearing water and gut of Penaeus vannamei in response to exogenous glucose addition. Mar. Life Sci. Technol. 2022, 4, 222–236. [Google Scholar] [CrossRef]
- Avnimelech, Y. Biofloc Technology: A Practical Guide Book; World Aquaculture Society: Baton Rouge, LA, USA, 2009. [Google Scholar]
- Emerenciano, M.; Ballester, E.L.; Cavalli, R.O.; Wasielesky, W. Biofloc technology application as a food source in a limited water exchange nursery system for pink shrimp Farfantepenaeus brasiliensis (Latreille, 1817). Aquac. Res. 2012, 43, 447–457. [Google Scholar] [CrossRef]
- Jatobá, A.; da Silva, B.C.; da Silva, J.S.; do Nascimento Vieira, F.; Mouriño, J.L.P.; Seiffert, W.Q.; Toledo, T.M. Protein levels for Litopenaeus vannamei in semi-intensive and biofloc systems. Aquaculture 2014, 432, 365–371. [Google Scholar] [CrossRef]
- Yun, H.; Shahkar, E.; Katya, K.; Jang, I.K.; Kim, S.K.; Bai, S.C. Effects of bioflocs on dietary protein requirement in juvenile whiteleg shrimp, Litopenaeus vannamei. Aquac. Res. 2016, 47, 3203–3214. [Google Scholar] [CrossRef]
- Xu, W.-J.; Pan, L.-Q.; Zhao, D.-H.; Huang, J. Preliminary investigation into the contribution of bioflocs on protein nutrition of Litopenaeus vannamei fed with different dietary protein levels in zero-water exchange culture tanks. Aquaculture 2012, 350, 147–153. [Google Scholar] [CrossRef]
- Becerra-Dorame, M.J.; Martínez-Porchas, M.; Martínez-Córdova, L.R.; Rivas-Vega, M.E.; Lopez-Elias, J.A.; Porchas-Cornejo, M.A. Production response and digestive enzymatic activity of the Pacific white shrimp Litopenaeus vannamei (Boone, 1931) intensively pregrown in microbial heterotrophic and autotrophic-based systems. Sci. World J. 2012, 1, 723654. [Google Scholar]
- Guo, R.; Liu, Y.; Tian, L.; Yang, H.; Liang, G.; Huang, J. The effects of different carbohydrate sources on the growth, survival rate and body composition of Penaeus vannamei. Acta Sci. Nat. Univ. Sunyatseni 2005, 4, 90–92. [Google Scholar]
- Zainuddin, H.; Aslamyah, S. Effect of dietary carbohydrate levels and feeding frequencies on growth and carbohydrate digestibility by white shrimp Litopenaeus vannamei under laboratory conditions. J. Aquac. Res. Dev. 2014, 5, 274. [Google Scholar]
- Rosas, C.; Cuzon, G.; Gaxiola, G.; Le Priol, Y.; Pascual, C.; Rossignyol, J.; Contreras, F.; Sanchez, A.; Van Wormhoudt, A. Metabolism and growth of juveniles of Litopenaeus vannamei: Effect of salinity and dietary carbohydrate levels. J. Exp. Mar. Biol. Ecol. 2001, 259, 1–22. [Google Scholar] [CrossRef]
- Cardona, E.; Lorgeoux, B.; Geffroy, C.; Richard, P.; Saulnier, D.; Gueguen, Y.; Guillou, G.; Chim, L. Relative contribution of natural productivity and compound feed to tissue growth in blue shrimp (Litopenaeus stylirostris) reared in biofloc: Assessment by C and N stable isotope ratios and effect on key digestive enzymes. Aquaculture 2015, 448, 288–297. [Google Scholar] [CrossRef]
- Zhu, J.; Bu, H.; Hu, C.; Miao, S. Effects of molasses supplementation on growth and water quality in giant freshwater prawn Macrobrachium rosenbergii ponds. Fish. Sci. 2017, 36, 202–206. [Google Scholar]
- Guo, R.; Liu, Y.J.; Tian, L.X.; Huang, J.W. Effect of dietary cornstarch levels on growth performance, digestibility and microscopic structure in the white shrimp, Litopenaeus vannamei reared in brackish water. Aquac. Nutr. 2006, 12, 83–88. [Google Scholar] [CrossRef]
- Hu, Y.; Tan, B.; Mai, K.; Ai, Q.; Zheng, S.; Cheng, K. Influence of dietary carbohydrate levels on growth and some physiological-biochemical index in juvenile Litopenaeus vannamei. Acta Hydrobiol Sin 2009, 33, 289–295. [Google Scholar]
- Avnimelech, Y. Carbon/nitrogen ratio as a control element in aquaculture systems. Aquaculture 1999, 176, 227–235. [Google Scholar] [CrossRef]
- Giner-Sanz, J.J.; Leverick, G.; Perez-Herranz, V.; Shao-Horn, Y. Optimization of the salicylate method for ammonia quantification from nitrogen electroreduction. J. Electroanal. Chem. 2021, 896, 115250. [Google Scholar] [CrossRef]
- Duan, G.Y.; Ren, Y.; Tang, Y.; Sun, Y.Z.; Chen, Y.M.; Wan, P.Y.; Yang, X.J. Improving the reliability and accuracy of ammonia quantification in electro-and photochemical synthesis. ChemSusChem 2020, 13, 88–96. [Google Scholar] [CrossRef] [PubMed]
- Zhang, Y.; Feng, W.; Xu, H.; Wang, J.; Sun, Y.; Wang, H.; Liu, X.; Han, T. Effects of low-protein diets with varying carbohydrate-to-lipid ratios on growth performance, antioxidant activity of Litopenaeus vannamei, and microbiome in biofloc systems. Aquaculture 2025, 599, 742122. [Google Scholar] [CrossRef]
- Cunniff, P.; Washington, D. Official methods of analysis of AOAC International. J. AOAC Int. 1997, 80, 127A. [Google Scholar]
- Ekasari, J.; Nugroho, U.A.; Fatimah, N.; Angela, D.; Hastuti, Y.P.; Pande, G.S.J.; Natrah, F. Improvement of biofloc quality and growth of Macrobrachium rosenbergii in biofloc systems by Chlorella addition. Aquac. Int. 2021, 29, 2305–2317. [Google Scholar] [CrossRef]
- Khanjani, M.H.; Mohammadi, A.; Emerenciano, M.G.C. Water quality in biofloc technology (BFT): An applied review for an evolving aquaculture. Aquac. Int. 2024, 32, 9321–9374. [Google Scholar] [CrossRef]
- Crab, R.; Chielens, B.; Wille, M.; Bossier, P.; Verstraete, W. The effect of different carbon sources on the nutritional value of bioflocs, a feed for Macrobrachium rosenbergii postlarvae. Aquac. Res. 2010, 41, 559–567. [Google Scholar] [CrossRef]
- Emerenciano, M.G.C.; Martínez-Córdova, L.R.; Martínez-Porchas, M.; Miranda-Baeza, A. Biofloc technology (BFT): A tool for water quality management in aquaculture. Water Qual. 2017, 5, 92–109. [Google Scholar]
- Luo, G.; Xu, J.; Meng, H. Nitrate accumulation in biofloc aquaculture systems. Aquaculture 2020, 520, 734675. [Google Scholar] [CrossRef]
- Lim, Y.S.; Ganesan, P.; Varman, M.; Hamad, F.; Krishnasamy, S. Effects of microbubble aeration on water quality and growth performance of Litopenaeus vannamei in biofloc system. Aquac. Eng. 2021, 93, 102159. [Google Scholar] [CrossRef]
- Miao, S.; Sun, L.; Bu, H.; Zhu, J.; Chen, G. Effect of molasses addition at C: N ratio of 20: 1 on the water quality and growth performance of giant freshwater prawn (Macrobrachium rosenbergii). Aquac. Int. 2017, 25, 1409–1425. [Google Scholar] [CrossRef]
- Gaona, C.A.P.; Serra, F.d.P.; Furtado, P.S.; Poersch, L.H.; Wasielesky, W. Biofloc management with different flow rates for solids removal in the Litopenaeus vannamei BFT culture system. Aquac. Int. 2016, 24, 1263–1275. [Google Scholar] [CrossRef]
- Ferreira, G.S.; Santos, D.; Schmachtl, F.; Machado, C.; Fernandes, V.; Bögner, M.; Schleder, D.D.; Seiffert, W.Q.; Vieira, F.N. Heterotrophic, chemoautotrophic and mature approaches in biofloc system for Pacific white shrimp. Aquaculture 2021, 533, 736099. [Google Scholar] [CrossRef]
- El-Sayed, A.F.M. Use of biofloc technology in shrimp aquaculture: A comprehensive review, with emphasis on the last decade. Rev. Aquac. 2021, 13, 676–705. [Google Scholar] [CrossRef]
- Wang, J.; Li, X.; Han, T.; Yang, Y.; Jiang, Y.; Yang, M.; Xu, Y.; Harpaz, S. Effects of different dietary carbohydrate levels on growth, feed utilization and body composition of juvenile grouper Epinephelus akaara. Aquaculture 2016, 459, 143–147. [Google Scholar] [CrossRef]
- Zhou, C.; Ge, X.; Niu, J.; Lin, H.; Huang, Z.; Tan, X. Effect of dietary carbohydrate levels on growth performance, body composition, intestinal and hepatic enzyme activities, and growth hormone gene expression of juvenile golden pompano, Trachinotus ovatus. Aquaculture 2015, 437, 390–397. [Google Scholar] [CrossRef]
- Li, X.Y.; Wang, J.T.; Han, T.; Hu, S.X.; Jiang, Y.D. Effects of dietary carbohydrate level on growth and body composition of juvenile giant croaker Nibea japonica. Aquac. Res. 2015, 46, 2851–2858. [Google Scholar] [CrossRef]
- Xia, B.; Gao, Q.-F.; Wang, J.; Li, P.; Zhang, L.; Zhang, Z. Effects of dietary carbohydrate level on growth, biochemical composition and glucose metabolism of juvenile sea cucumber Apostichopus japonicus (Selenka). Aquaculture 2015, 448, 63–70. [Google Scholar] [CrossRef]
- Dong, L.; Zhang, Q.; Xu, M.; Su, Q.; Nie, Z.; Xie, D.; Yang, J.; Tong, T. Effects of dietary carbohydrate to lipid ratio on growth performance, body composition and digestive enzyme activities of juvenile crab Scylla paramamosain. Chin. J. Anim. Nutr. 2017, 29, 979–986. [Google Scholar]
- Shiau, S.-Y. Nutrient requirements of penaeid shrimps. Aquaculture 1998, 164, 77–93. [Google Scholar] [CrossRef]
- Niu, J.; Lin, H.-Z.; Jiang, S.-G.; Chen, X.; Wu, K.-C.; Tian, L.-X.; Liu, Y.-J. Effect of seven carbohydrate sources on juvenile Penaeus monodon growth performance, nutrient utilization efficiency and hepatopancreas enzyme activities of 6-phosphogluconate dehydrogenase, hexokinase and amylase. Anim. Feed. Sci. Technol. 2012, 174, 86–95. [Google Scholar] [CrossRef]
- Kong, Y.; Ding, Z.; Zhang, Y.; Zhou, P.; Wu, C.; Zhu, M.; Ye, J. Types of carbohydrate in feed affect the growth performance, antioxidant capacity, immunity, and activity of digestive and carbohydrate metabolism enzymes in juvenile Macrobrachium nipponense. Aquaculture 2019, 512, 734282. [Google Scholar] [CrossRef]
- Zhu, Y.; Liao, K.; Liu, Y.; Huang, H.; Ma, Y.; Chen, D.; Ma, B.; Xu, J. Effects of dietary carbohydrate/lipid ratios on growth, body composition, amylase activity, oxidative status, and mTOR/autophagy pathway in juvenile clam, Sinonovacula constricta. Aquaculture 2024, 578, 740119. [Google Scholar] [CrossRef]
- Mohammadzadeh, S.; Noverian, H.; Ouraji, H.; Falahatkar, B. Growth, body composition and digestive enzyme responses of Caspian Kutum, Rutilus frisii (Kamenskii, 1901), juveniles fed different levels of carbohydrates. J. Appl. Ichthyol. 2017, 33, 983–990. [Google Scholar] [CrossRef]
- Zhan, Q.-Y.; Zheng, P.-Q.; Wang, J.-T.; Han, T. Utilization and metabolism of carbohydrate in shrimps and crabs. Chin. J. Anim. Nutr. 2020, 32, 1062–1075. [Google Scholar]
- Jiang, T.; Yu, W.; Zhao, X.; Ren, C.; Xie, P.; Kong, Y.; Zhang, Y.; Ye, J.; Ding, Z. Effects of dietary carbohydrate to lipid ratio on growth performance, hepatopancreas metabolic enzyme activities and expression of fatty acid transport-and Toll-like receptor pathway-related genes of oriental river prawn (Macrobrachium nipponense). Chin. J. Anim. Nutr. 2018, 30, 4538–4550. [Google Scholar]
- Li, S.; Li, Z.; Zhang, J.; Sang, C.; Chen, N. The impacts of dietary carbohydrate levels on growth performance, feed utilization, glycogen accumulation and hepatic glucose metabolism in hybrid grouper (Epinephelus fuscoguttatus♀× E. lanceolatus♂). Aquaculture 2019, 512, 734351. [Google Scholar] [CrossRef]
- Melo, J.; Lundstedt, L.; Inoue, L.; Metón, I.; Baanante, I.; Moraes, G. Glycolysis and gluconeogenesis in the liver of catfish fed with different concentrations of proteins, lipids and carbohydrates. Arq. Bras. Med. Veterinária E Zootecnia 2016, 68, 1251–1258. [Google Scholar] [CrossRef]
- Lu, S.; Wu, X.; Gao, Y.; Gatlin, D.M., III; Wu, M.; Yao, W.; Jin, Z.; Li, X.; Dong, Y. Effects of dietary carbohydrate sources on growth, digestive enzyme activity, gene expression of hepatic GLUTs and key enzymes involved in glycolysis-gluconeogenesis of giant grouper Epinephelus lanceolatus larvae. Aquaculture 2018, 484, 343–350. [Google Scholar] [CrossRef]
- Li, S.; Yang, Z.; Tian, H.; Ren, S.; Zhang, W.; Wang, A. Effects of dietary carbohydrate-to-lipid ratios on growth performance, intestinal digestion, lipid and carbohydrate metabolism of red swamp crayfish (Procambarus clarkii). Aquac. Rep. 2022, 24, 101117. [Google Scholar] [CrossRef]
- Ma, H.-J.; Mou, M.-M.; Pu, D.-C.; Lin, S.-M.; Chen, Y.-J.; Luo, L. Effect of dietary starch level on growth, metabolism enzyme and oxidative status of juvenile largemouth bass, Micropterus salmoides. Aquaculture 2019, 498, 482–487. [Google Scholar] [CrossRef]
- Su, M.; Zhang, X.; Yuan, J.; Zhang, X.; Li, F. The role of insulin-like peptide in maintaining hemolymph glucose homeostasis in the pacific white shrimp Litopenaeus vannamei. Int. J. Mol. Sci. 2022, 23, 3268. [Google Scholar] [CrossRef]
- Zhou, P.; Wang, M.; Xie, F.; Deng, D.-F.; Zhou, Q. Effects of dietary carbohydrate to lipid ratios on growth performance, digestive enzyme and hepatic carbohydrate metabolic enzyme activities of large yellow croaker (Larmichthys crocea). Aquaculture 2016, 452, 45–51. [Google Scholar] [CrossRef]
- Liu, H.; Yang, J.-J.; Dong, X.-H.; Tan, B.-P.; Zhang, S.; Chi, S.-Y.; Yang, Q.-H.; Liu, H.-Y.; Yang, Y.-Z. Effects of different dietary carbohydrate-to-lipid ratios on growth, plasma biochemical indexes, digestive, and immune enzymes activities of sub-adult orange-spotted grouper Epinephelus coioides. Fish Physiol. Biochem. 2020, 46, 1409–1420. [Google Scholar] [CrossRef]
- Boonanuntanasarn, S.; Kumkhong, S.; Yoohat, K.; Plagnes-Juan, E.; Burel, C.; Marandel, L.; Panserat, S. Molecular responses of Nile tilapia (Oreochromis niloticus) to different levels of dietary carbohydrates. Aquaculture 2018, 482, 117–123. [Google Scholar] [CrossRef]
- Jafri, A. Protein-sparing effect of dietary carbohydrate in diets for fingerling Labeo rohita. Aquaculture 1995, 136, 331–339. [Google Scholar]
- Shi, H.J.; Li, X.F.; Xu, C.; Zhang, D.; Zhang, L.; Xia, S.L.; Liu, W. Nicotinamide improves the growth performance, intermediary metabolism and glucose homeostasis of blunt snout bream Megalobrama amblycephala fed high-carbohydrate diets. Aquac. Nutr. 2020, 26, 1311–1328. [Google Scholar] [CrossRef]
- Zhao, W.; Jin, M.; Zhu, T.; Xie, S.; Yang, Y.; Li, X.; Zhou, Q. Dietary starch level regulates the growth and glycolipid metabolism through the insulin-PI3K-AKT signaling pathway of juvenile mud crab (Scylla paramamosain). Aquac. Rep. 2024, 36, 102124. [Google Scholar] [CrossRef]
- Khanjani, M.H.; Sharifinia, M.; Emerenciano, M.G.C. A detailed look at the impacts of biofloc on immunological and hematological parameters and improving resistance to diseases. Fish Shellfish. Immunol. 2023, 137, 108796. [Google Scholar] [CrossRef]
- Wang, X.; Li, E.; Xu, Z.; Li, T.; Xu, C.; Chen, L. Molecular response of carbohydrate metabolism to dietary carbohydrate and acute low salinity stress in Pacific white shrimp Litopenaeus vannamei. Turk. J. Fish. Aquat. Sci. 2017, 17, 153–169. [Google Scholar]
- Babaei, S.; Abedian-Kenari, A.; Hedayati, M.; Yazdani-Sadati, M.A. Growth response, body composition, plasma metabolites, digestive and antioxidant enzymes activities of Siberian sturgeon (Acipenser baerii, Brandt, 1869) fed different dietary protein and carbohydrate: Lipid ratio. Aquac. Res. 2017, 48, 2642–2654. [Google Scholar] [CrossRef]
- Wang, Q.; Luo, S.; Ghonimy, A.; Chen, Y.; Guo, Z.; Liu, H.; Zhang, D. Effect of dietary L-carnitine on growth performance and antioxidant response in Amur minnow (Phoxinus lagowskii Dybowskii). Aquac. Nutr. 2019, 25, 749–760. [Google Scholar] [CrossRef]
- Hamidoghli, A.; Won, S.; Aya, F.A.; Yun, H.; Bae, J.; Jang, I.K.; Bai, S.C. Dietary lipid requirement of whiteleg shrimp Litopenaeus vannamei juveniles cultured in biofloc system. Aquac. Nutr. 2020, 26, 603–612. [Google Scholar] [CrossRef]
- Wu, C.; Ye, J.; Gao, J.e.; Chen, L.; Lu, Z. The effects of dietary carbohydrate on the growth, antioxidant capacities, innate immune responses and pathogen resistance of juvenile Black carp Mylopharyngodon piceus. Fish Shellfish. Immunol. 2016, 49, 132–142. [Google Scholar] [CrossRef] [PubMed]
- Zhang, Q.; Chen, Y.; Xu, W.; Zhang, Y. Effects of dietary carbohydrate level on growth performance, innate immunity, antioxidant ability and hypoxia resistant of brook trout Salvelinus fontinalis. Aquac. Nutr. 2021, 27, 297–311. [Google Scholar] [CrossRef]
- Dotan, Y.; Lichtenberg, D.; Pinchuk, I. Lipid peroxidation cannot be used as a universal criterion of oxidative stress. Prog. Lipid research 2004, 43, 200–227. [Google Scholar] [CrossRef]
- Enes, P.; Sanchez-Gurmaches, J.; Navarro, I.; Gutiérrez, J.; Oliva-Teles, A. Role of insulin and IGF-I on the regulation of glucose metabolism in European sea bass (Dicentrarchus labrax) fed with different dietary carbohydrate levels. Comp. Biochem. Physiol. Part A Mol. Integr. Physiol. 2010, 157, 346–353. [Google Scholar] [CrossRef]
- Lin, S.-M.; Shi, C.-M.; Mu, M.-M.; Chen, Y.-J.; Luo, L. Effect of high dietary starch levels on growth, hepatic glucose metabolism, oxidative status and immune response of juvenile largemouth bass, Micropterus salmoides. Fish Shellfish. Immunol. 2018, 78, 121–126. [Google Scholar] [CrossRef]
- Li, W.; Zhang, Y.; Wang, Z.; Zhang, N.; Sheng, Z.; Chen, N.; Li, S. Effects of dietary starch levels on growth performance, hepatic proximate composition and non-specific immunity of snakehead (Channa argus). Aquac. Res. 2022, 53, 5971–5978. [Google Scholar] [CrossRef]
- Dong, L.F.; Tong, T.; Zhang, Q.; Wang, Q.C.; Xu, M.Z.; Yu, H.R.; Wang, J. Effects of dietary carbohydrate to lipid ratio on growth, feed utilization, body composition and digestive enzyme activities of golden pompano (Trachinotus ovatus). Aquac. Nutr. 2018, 24, 341–347. [Google Scholar] [CrossRef]
- Chen, G.; Qian, J.; Liu, H.; Tan, B.; Dong, X.; Yang, Q.; Chi, S.; Zhang, S. Dietary carbohydrate-to-lipid ratios modulate juvenile hybrid grouper (♀ Epinephelus fuscoguttatus×♂ E. lanceolatus): Effects on growth, serum biochemistry, intestinal digestion and hepatic metabolism of glucose and lipid. Aquac. Nutr. 2021, 27, 1370–1382. [Google Scholar] [CrossRef]
- Yang, X.; Song, X.; Zhang, C.; Pang, Y.; Song, Y.; Cheng, Y.; Nie, L.; Zong, X. Effects of dietary melatonin on hematological immunity, antioxidant defense and antibacterial ability in the Chinese mitten crab, Eriocheir sinensis. Aquaculture 2020, 529, 735578. [Google Scholar] [CrossRef]
- Xu, Z.; Cao, J.; Qin, X.; Qiu, W.; Mei, J.; Xie, J. Toxic effects on bioaccumulation, hematological parameters, oxidative stress, immune responses and tissue structure in fish exposed to ammonia nitrogen: A review. Animals 2021, 11, 3304. [Google Scholar] [CrossRef]
- Wen, C.; Ma, S.; Tian, H.; Jiang, W.; Jia, X.; Zhang, W.; Jiang, G.; Li, X.; Chi, C.; He, C. Evaluation of the protein-sparing effects of carbohydrates in the diet of the crayfish, Procambarus clarkii. Aquaculture 2022, 556, 738275. [Google Scholar] [CrossRef]
- Han, G.-M.; Zhang, J.-H.; Wu, L.-M.; Kou, X.-M.; Ye, X.-M.; Qin, B.-L.; Bi, J.-H.; Wang, S.-H.; Xu, R.; Ma, L.-J. Effects of replacing fish meal with black soldier fly larvae meal on growth, body composition and immunity of red swamp crayfish (Procambarus clarkii). Chin. J. Anim. Nutr. 2023, 35, 4495–4506. [Google Scholar]
- Strebel, L.M.; Nguyen, K.; Araujo, A.; Corby, T.; Rhodes, M.; Beck, B.H.; Roy, L.A.; Davis, D.A. On demand feeding and the response of Pacific white shrimp (Litopenaeus vannamei) to varying dietary protein levels in semi-intensive pond production. Aquaculture 2023, 574, 739698. [Google Scholar] [CrossRef]
- Deng, M.; Chen, J.; Gou, J.; Hou, J.; Li, D.; He, X. The effect of different carbon sources on water quality, microbial community and structure of biofloc systems. Aquaculture 2018, 482, 103–110. [Google Scholar] [CrossRef]
- Li, C.; Zhang, X.; Chen, Y.; Zhang, S.; Dai, L.; Zhu, W.; Chen, Y. Optimized utilization of organic carbon in aquaculture biofloc systems: A review. Fishes 2023, 8, 465. [Google Scholar] [CrossRef]
- Ramiro, B.d.O.; Wasielesky, W., Jr.; Pimentel, O.A.L.F.; Sun, T.; McAlhaney, E.; Urick, S.; Gonçalves, F.H.; van Senten, J.; Schwarz, M.H.; Krummenauer, D. Assessment of Water Quality, Growth of Penaeus vannamei, and Partial Budget in Super-Intensive BFT and RAS: A Comparison Between Sustainable Aquaculture Systems. Sustainability 2024, 16, 11005. [Google Scholar] [CrossRef]
- Dauda, A.B. Biofloc technology: A review on the microbial interactions, operational parameters and implications to disease and health management of cultured aquatic animals. Rev. Aquac. 2020, 12, 1193–1210. [Google Scholar] [CrossRef]
- Feng, W.; Wang, H.; Wang, J.; Liu, X.; Xu, H.; Han, T.; Yu, Y. Impact of low-protein diets with varied lipid levels on growth, metabolism of Penaeus vannamei, and carbon and nitrogen cycling in biofloc systems. Aquaculture 2025, 607, 742637. [Google Scholar] [CrossRef]


| Composition (%) | Dietary Carbohydrate Level | ||||
|---|---|---|---|---|---|
| 11 | 20 | 29 | 38 | 47 | |
| a Fish meal | 39.51 | 39.51 | 39.51 | 39.51 | 39.51 |
| Corn starch | 11.00 | 20.00 | 29.00 | 38.00 | 47.00 |
| Fish oil | 1.11 | 1.11 | 1.11 | 1.11 | 1.11 |
| Soybean oil | 2.59 | 2.59 | 2.59 | 2.59 | 2.59 |
| Phospholipid | 1.00 | 1.00 | 1.00 | 1.00 | 1.00 |
| Cholesterol | 0.60 | 0.60 | 0.60 | 0.60 | 0.60 |
| b Vitamin mix | 1.80 | 1.80 | 1.80 | 1.80 | 1.80 |
| Choline chloride | 0.30 | 0.30 | 0.30 | 0.30 | 0.30 |
| c Mineral mix | 0.50 | 0.50 | 0.50 | 0.50 | 0.50 |
| Calcium dihydrogen phosphate | 1.50 | 1.50 | 1.50 | 1.50 | 1.50 |
| Cellulose | 37.09 | 28.09 | 19.09 | 10.09 | 1.09 |
| Taurine | 1.00 | 1.00 | 1.00 | 1.00 | 1.00 |
| Sodium alginate | 2.00 | 2.00 | 2.00 | 2.00 | 2.00 |
| Proximate composition (%) | |||||
| Crude protein | 29.32 | 29.42 | 29.67 | 29.20 | 29.44 |
| Crude lipid | 8.13 | 8.11 | 7.93 | 8.02 | 8.29 |
| Moisture | 11.73 | 10.36 | 11.03 | 11.20 | 9.67 |
| Ash | 6.81 | 6.58 | 6.59 | 6.34 | 6.59 |
| d Energy (kJ g−1) | 12.02 | 13.59 | 15.12 | 16.60 | 18.33 |
| Experimental Diet | |||||
|---|---|---|---|---|---|
| C11 | C20 | C29 | C38 | C47 | |
| IBW 1 | 0.78 ± 0.01 | 0.79 ± 0.02 | 0.79 ± 0.01 | 0.79 ± 0.01 | 0.80 ± 0.01 |
| FBW 2 | 5.52 ± 0.27 d | 6.88 ± 0.06 c | 7.10 ± 0.27 bc | 7.78 ± 0.65 a | 7.55 ± 0.16 ab |
| WG 3 | 606.93 ± 35.60 c | 773.18 ± 15.66 b | 797.60 ± 43.15 ab | 887.49 ± 91.13 a | 843.67 ± 13.79 ab |
| SGR 4 | 3.49 ± 0.09 c | 3.87 ± 0.03 b | 3.92 ± 0.09 ab | 4.08 ± 0.16 a | 4.01 ± 0.03 ab |
| FCR 5 | 1.49 ± 0.09 a | 1.28 ± 0.06 b | 1.28 ± 0.12 b | 1.17 ± 0.06 b | 1.28 ± 0.02 b |
| PER 6 | 2.32 ± 0.14 a | 2.70 ± 0.14 b | 2.72 ± 0.24 b | 2.95 ± 0.16 b | 2.70 ± 0.05 b |
| Survival rate (%) 7 | 90.00 ± 5.00 | 96.67 ± 2.89 | 93.33 ± 7.64 | 96.67 ± 5.77 | 86.67 ± 5.77 |
| Experimental Diet | |||||
|---|---|---|---|---|---|
| C11 | C20 | C29 | C38 | C47 | |
| Nitrogen | |||||
| DNI 1 (g kg ABW−1 day−1) | 1.85 ± 0.11 | 1.68 ± 0.09 | 1.69 ± 0.14 | 1.58 ± 0.06 | 1.71 ± 0.03 |
| DNG 2 (g kg ABW−1 day−1) | 1.07 ± 0.02 | 1.05 ± 0.04 | 1.06 ± 0.06 | 1.04 ± 0.04 | 1.04 ± 0.02 |
| NR 3 (% intake) | 57.66 ± 3.80 | 62.20 ± 3.66 | 62.81 ± 3.50 | 65.68 ± 0.12 | 60.83 ± 1.02 |
| Lipid | |||||
| DLI 4 (g kg ABW−1 day−1) | 3.25 ± 0.19 a | 2.95 ± 0.15 bc | 2.89 ± 0.24 bc | 2.73 ± 0.10 c | 3.06 ± 0.05 ab |
| DLG 5 (g kg ABW−1 day−1) | 0.89 ± 0.01 | 0.91 ± 0.10 | 0.89 ± 0.03 | 0.91 ± 0.15 | 0.96 ± 0.06 |
| LR 6 (% intake) | 27.33 ± 1.75 | 30.90 ± 3.30 | 31.02 ± 2.07 | 33.36 ± 4.44 | 31.25 ± 1.58 |
| Experimental Diet | |||||
|---|---|---|---|---|---|
| C11 | C20 | C29 | C38 | C47 | |
| Whole shrimp | |||||
| Moisture (%) | 68.24 ± 0.49 | 68.87 ± 0.91 | 69.42 ± 0.73 | 70.58 ± 1.65 | 69.63 ± 0.21 |
| Crude protein (%) | 74.67 ± 0.63 | 71.76 ± 1.14 | 73.57 ± 2.77 | 73.90 ± 0.92 | 72.33 ± 1.37 |
| Crude lipid (%) | 9.72 ± 0.28 | 9.76 ± 0.83 | 9.75 ± 0.13 | 10.17 ± 1.15 | 10.38 ± 0.59 |
| Ash (%) | 13.00 ± 0.43 a | 13.03 ± 0.43 a | 13.04 ± 0.53 a | 12.81 ± 0.65 a | 11.81 ± 0.52 b |
| Biofloc | |||||
| Moisture (%) | 87.40 ± 0.98 | 86.15 ± 1.49 | 86.63 ± 0.94 | 85.63 ± 0.71 | 87.38 ± 0.52 |
| Crude protein (%) | 30.24 ± 2.68 | 29.78 ± 1.85 | 29.45 ± 2.71 | 28.71 ± 1.15 | 29.53 ± 3.35 |
| Crude lipid (%) | 9.63 ± 0.43 ab | 9.11 ± 0.65 a | 10.68 ± 0.13 b | 10.03 ± 0.87 ab | 9.86 ± 0.31 ab |
| Ash (%) | 25.53 ± 0.87 | 24.95 ± 2.43 | 25.03 ± 1.60 | 23.68 ± 2.18 | 25.74 ± 1.11 |
Disclaimer/Publisher’s Note: The statements, opinions and data contained in all publications are solely those of the individual author(s) and contributor(s) and not of MDPI and/or the editor(s). MDPI and/or the editor(s) disclaim responsibility for any injury to people or property resulting from any ideas, methods, instructions or products referred to in the content. |
© 2025 by the authors. Licensee MDPI, Basel, Switzerland. This article is an open access article distributed under the terms and conditions of the Creative Commons Attribution (CC BY) license (https://creativecommons.org/licenses/by/4.0/).
Share and Cite
Sun, Y.; Zhang, S.; Feng, W.; Zhang, Y.; Han, T.; Wang, J. Impact of Dietary Carbohydrate Levels on Growth Performance, Feed Efficiency, and Immune Response in Litopenaeus vannamei Cultured in Biofloc Systems. Metabolites 2025, 15, 409. https://doi.org/10.3390/metabo15060409
Sun Y, Zhang S, Feng W, Zhang Y, Han T, Wang J. Impact of Dietary Carbohydrate Levels on Growth Performance, Feed Efficiency, and Immune Response in Litopenaeus vannamei Cultured in Biofloc Systems. Metabolites. 2025; 15(6):409. https://doi.org/10.3390/metabo15060409
Chicago/Turabian StyleSun, Yulong, Shuailiang Zhang, Wenping Feng, Yunqi Zhang, Tao Han, and Jiteng Wang. 2025. "Impact of Dietary Carbohydrate Levels on Growth Performance, Feed Efficiency, and Immune Response in Litopenaeus vannamei Cultured in Biofloc Systems" Metabolites 15, no. 6: 409. https://doi.org/10.3390/metabo15060409
APA StyleSun, Y., Zhang, S., Feng, W., Zhang, Y., Han, T., & Wang, J. (2025). Impact of Dietary Carbohydrate Levels on Growth Performance, Feed Efficiency, and Immune Response in Litopenaeus vannamei Cultured in Biofloc Systems. Metabolites, 15(6), 409. https://doi.org/10.3390/metabo15060409