Article

Plasma Dickkopf-1 Levels Are Associated with Chronic Kidney Disease

1
Department of Digital Medicine, Taichung Veterans General Hospital, Taichung 407219, Taiwan
2
Department of Computer Science & Information Engineering, National Taiwan University, Taipei 106319, Taiwan
3
School of Medicine, National Yang Ming Chiao Tung University, Taipei 112304, Taiwan
4
Institute of Biomedical Sciences, National Chung Hsing University, Taichung 402002, Taiwan
5
Division of Endocrinology and Metabolism, Department of Internal Medicine, Taichung Veterans General Hospital, Taichung 407219, Taiwan
6
School of Medicine, Chung Shan Medical University, Taichung 402306, Taiwan
7
Department of Post-Baccalaureate Medicine, College of Medicine, National Chung Hsing University, Taichung 402002, Taiwan
*
Author to whom correspondence should be addressed.
Metabolites 2025, 15(5), 300; https://doi.org/10.3390/metabo15050300
Submission received: 1 April 2025 / Revised: 23 April 2025 / Accepted: 29 April 2025 / Published: 30 April 2025
(This article belongs to the Special Issue Metabolism in Kidney Disease)

Abstract

:
Background: Wnt/β-catenin signaling is important in the development and repair of the kidney. Dickkopf-1 (DKK-1) is characterized as an inhibitor of the Wnt/β-catenin signaling pathway. Purpose: We examined the relationship between plasma DKK-1 levels and the risk of chronic kidney disease (CKD). Methods: In this cross-sectional study, patients without known diabetes mellitus who were admitted for coronary angiography due to angina were enrolled. Fasting blood samples were collected at a predetermined outpatient visit. Results: Among 373 enrolled patients, 62 (16.6%) were in the CKD group, and 311 (83.4%) were in the nonCKD group. Plasma DKK-1 levels were significantly higher in the CKD group than in the nonCKD group (697.2 ± 174.7 vs. 589.0 ± 193.3 pg/mL; p < 0.001). Plasma DKK-1 levels were inversely correlated with the eGFR (Pearson’s correlation coefficient = −0.265; p < 0.001). On the basis of multivariable logistic regression analyses, patients in the highest DKK-1 quartile had a significantly greater risk of CKD (OR = 4.188; 95% CI: 1.564, 11.212; p = 0.004) than did those in the lowest DKK-1 quartile. Conclusions: Plasma DKK-1 levels are associated with the risk of CKD in patients with angina. Further studies investigating the underlying mechanisms involved in the relationship between DKK-1 and CKD are warranted.

1. Introduction

Chronic kidney disease (CKD) is prevalent worldwide, and approximately 674 million patients with CKD were reported globally in 2021 [1]. CKD has been a heavy burden on global health in the past 30 years, with an increasing trend of mortality and disability resulting from CKD [1,2]. Although diabetes mellitus (DM) is an important cause of CKD, most (more than 70%) CKD cases are due to unspecified causes [1].
Wnt/β-catenin signaling plays a crucial role in kidney development [3]. Moreover, Wnt/β-catenin signaling may play a role in maintaining renal function and regeneration after acute kidney injury in adults [4]. However, dysregulation of Wnt/β-catenin signaling can induce renal fibrosis and CKD progression [5]. Moreover, the Wnt/β-catenin signaling pathway is reportedly associated with cardiorenal syndrome [6,7].
Dickkopf-1 (DKK-1), a secreted glycoprotein, is characterized as an inhibitor of the canonical β-catenin-dependent Wnt pathway [8]. Recently, we reported that plasma DKK-1 levels are predictive of major adverse cardiac events (MACEs) in patients with angina [9]. Downregulation of DKK-1 expression was shown to decrease renal fibrosis in a streptozotocin-induced diabetic model of rats [10]. In contrast, inhibition of Wnt/β-catenin signaling via delivery of the DKK-1 gene can decrease fibrosis after obstructive injury to the kidney in mice [11]. Therefore, we aimed to examine the relationship between circulating DKK-1 levels and the risk of CKD in a cross-sectional study.

2. Materials and Methods

2.1. Study Design and Population

In this cross-sectional study, we enrolled adults who were admitted for selective coronary angiography due to angina. Subjects were excluded from enrollment if they had been diagnosed with DM; had severe systemic diseases, including infection or inflammation; or were pregnant. This study was approved by the Institutional Review Board of Taichung Veterans General Hospital and complied with the Declaration of Helsinki. After the participants provided written informed consent, an outpatient interview was arranged for the study procedure. Furthermore, subjects were excluded from the analyses if they had previously undergone coronary intervention treatment before admission. After the anthropometric measurements, blood and urine samples were collected in the morning after overnight fasting.

2.2. Measurement

Plasma DKK-1 levels were measured using an immunoassay kit (R&D Systems, Minneapolis, MN, USA) with an interassay coefficient of variation (CV) of 8.1% and an intraassay CV of 2.6%. Plasma glucose was measured by the oxidative peroxidase method (Wako Diagnostics, Tokyo, Japan). HbA1c levels were measured using boronate affinity high-performance liquid chromatography (NGSP certified, Primus Corp., Kansas City, MO, USA). Serum levels of creatinine, high-sensitivity C-reactive protein (hsCRP), and lipids were measured using commercial kits (Beckman Coulter, Fullerton, CA, USA). The estimated glomerular filtration rate (eGFR) was calculated using the Chronic Kidney Disease Epidemiology Collaboration equation [12]. CKD was defined as an eGFR < 60 mL/min/1.73 m2 [13]. The urine albumin-to-creatinine ratio (UACR) was calculated by dividing the levels of urine albumin (mg) by those of urine creatinine (g), and increased albuminuria was defined as a UACR ≥ 30 mg/g. Obesity was defined as BMI ≥ 27 kg/m2 [14]. Central obesity was defined as a waist circumference > 90 cm in men or >80 cm in women [15]. Metabolic syndrome was defined on the basis of the American Heart Association and National Heart, Lung, and Blood Institute Scientific Statement [16]. Hypertension was defined as a systolic blood pressure ≥ 130 mmHg, a diastolic blood pressure ≥ 80 mmHg, or a history of antihypertensive medication use. CAD was defined as a history of MI and/or a coronary lesion with lumen narrowing ≥ 50% according to angiography during this hospitalization.

2.3. Statistical Analysis
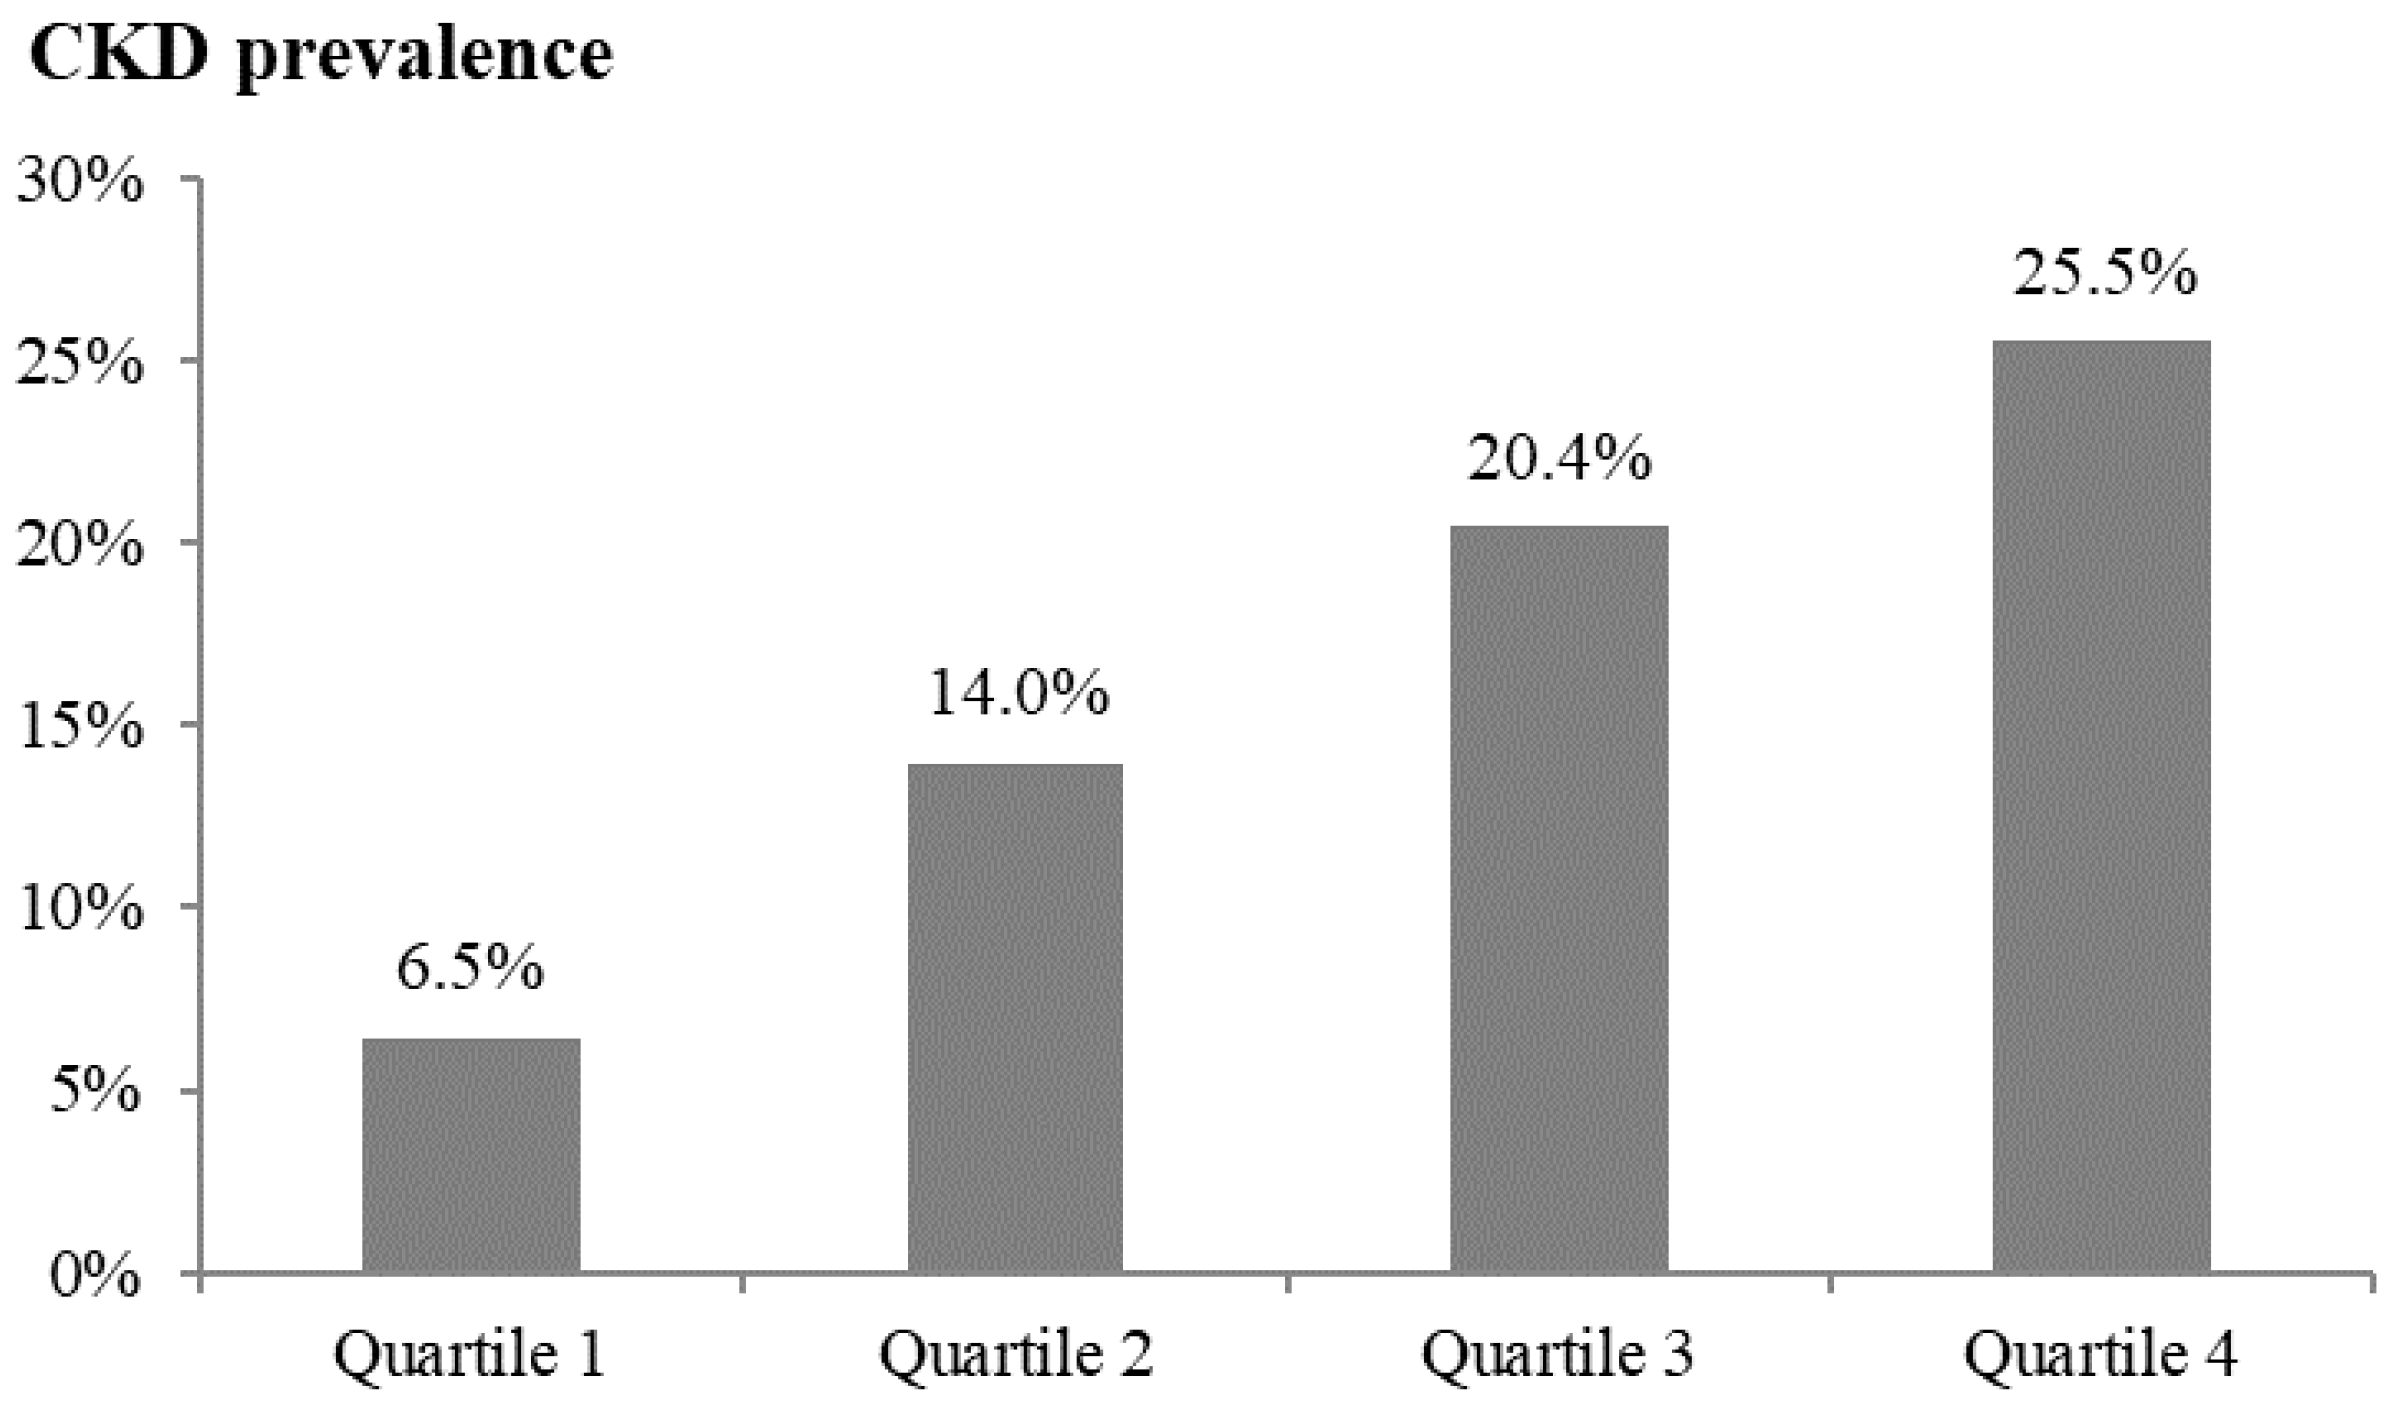
Continuous variables are presented as the means ± standard deviations, and categorical variables are presented as numbers (percentages). We examined the statistical significance of the between-group differences using independent t tests for continuous variables and chi-square tests for categorical variables. The correlation coefficient between DKK-1 and the eGFR was determined using Spearman’s rank correlation. Receiver operating characteristic (ROC) curve analysis was performed to differentiate CKD according to the DKK-1 levels.
We further divided all of the enrolled participants into four quartiles on the basis of their DKK-1 levels to investigate the trend of CKD prevalence across different DKK-1 levels. Trend analysis was used to evaluate differences across the DKK-1 quartiles. Logistic regression analyses were performed to estimate the odds ratios (ORs) and the associated 95% confidence intervals (CIs) for the risk of CKD of the higher quartiles of DKK-1 compared with the lowest quartile of DKK-1 after adjusting for potential confounding variables that were significantly associated with both CKD status and DKK-1 levels. A two-sided p value < 0.05 was considered to indicate statistical significance. Statistical analysis was conducted using SPSS v22.0 (IBM, Armonk, NY, USA), and the area under the curve in the multivariable model was calculated using Python 3.10.

3. Results

In the present study, a total of 373 participants were enrolled, including 149 subjects with an eGFR ≥ 90 mL/min/1.73 m2, 162 subjects with an eGFR between 60 and 89.9 mL/min/1.73 m2, 57 subjects with an eGFR between 30 and 59.9 mL/min/1.73 m2, 2 subjects with an eGFR between 15.0 and 29.9 mL/min/1.73 m2, and 3 subjects with an eGFR < 15 mL/min/1.73 m2. No subjects receiving renal replacement therapy were enrolled. Therefore, 62 (16.6%) subjects were categorized into the CKD group and 311 (83.4%) into the nonCKD group. Table 1 shows the baseline characteristics of the participants in the CKD and nonCKD groups. The subjects were significantly older in the CKD group than in the nonCKD group (68.5 ± 10.7 vs. 58.2 ± 10.8 years; p < 0.001). The subjects in the CKD group had significantly higher systolic blood pressure than those in the nonCKD group (132.7 ± 17.5 vs. 127.0 ± 17.5 mmHg; p = 0.020). The hsCRP levels were significantly greater in the CKD group than in the nonCKD group (3.5 ± 3.2 vs. 2.1 ± 2.2 mg/L; p < 0.001). The prevalence of an increased UACR was significantly greater in the CKD group than in the nonCKD group (35.5% vs. 10.9%; p < 0.001). The proportion of subjects using diuretics was significantly greater in the CKD group than in the nonCKD group (25.8% vs. 11.6%; p = 0.006). The plasma levels of DKK-1 were significantly greater in the CKD group than in the nonCKD group (697.2 ± 174.7 vs. 589.0 ± 193.3 pg/mL; p < 0.001).
On the basis of the ROC curve for differentiating CKD (Figure 1), a cutoff value of 641.8 pg/mL for plasma DKK-1 levels provided a sensitivity of 66.1% and specificity of 66.7% for differentiating CKD (area under the curve = 0.661; 95% CI: 0.593–0.729; p < 0.001). According to Spearman’s rank correlation, plasma DKK-1 levels were inversely correlated with the eGFR (correlation coefficient [σ] = −0.265; p < 0.001; Figure 2). In addition, plasma DKK-1 levels were also significantly correlated with age (σ = 0.142; p = 0.006), total cholesterol (σ = 0.112; p = 0.031), triglycerides (σ = 0.192; p < 0.001), and UACR (σ = 0.113; p = 0.029; Table 2). To examine the increasing trend of plasma DKK-1 levels toward CKD, we further divided all of the subjects into four groups on the basis of plasma DKK-1 quartiles. The prevalence of CKD showed a significant increase from the lowest to the highest DKK-1 quartiles (p value for trend < 0.001, Figure 3).
To assess the factors associated with plasma DKK-1 levels, we compared DKK-1 levels between the dichotomous groups of CKD risk factors (Table 3). Higher plasma DKK-1 levels were observed in patients with lower HDL cholesterol and higher triglyceride and hsCRP levels (p = 0.009, 0.032, and 0.007, respectively). Notably, hsCRP should be considered a confounding factor because of its significant associations with CKD status (Table 1) and DKK-1 levels (Table 3). After adjustment for age, sex, and hsCRP levels, CKD risk was significantly associated with the DKK-1 quartile (p = 0.024). Furthermore, the subjects in the fourth (highest) DKK-1 quartile group had the highest risk of CKD (OR = 4.188; 95% CI: 1.564, 11.212; p = 0.004), followed by those in the third quartile (OR = 3.580, 95% CI: 1.307; 9.801; p = 0.013), and then by those in the first (lowest) DKK-1 quartile group (Table 4). However, there was no significant difference in CKD risk between the second and lowest quartiles of DKK-1 (p > 0.05). On the basis of the ROC curve, the area under the curve for differentiating CKD is significantly increased by adding DKK-1 data with a cutoff of 641.8 pg/mL in the age + sex + hsCRP model (0.735 vs. 0.697; difference = 0.038; 95% CI = 0.008–0.066; p = 0.007).

4. Discussion

Our main finding in the present study is that plasma DKK-1 levels are inversely correlated with the eGFR in patients who have undergone coronary angiography for angina. Moreover, high plasma DKK-1 levels are significantly associated with CKD risk. Similarly, Wang et al. [17] reported that the mean plasma DKK-1 levels were significantly greater in 50 patients with lupus nephritis than in 40 healthy controls. DKK-1 can increase the expression of profibrotic factors in mesangial cells in a hyperglycemic model and induce renal fibrosis in streptozotocin-induced diabetic rats [18]. Therefore, increased plasma DKK-1 levels may reflect renal fibrosis induced by dysregulation of the Wnt/β-catenin signaling pathway.
Mihai et al. [19] reported that 24 biomarkers were significantly associated with CKD status on the basis of 105 proteins assessed using the Proteome Profiler Cytokine Array Kit in 76 subjects, and DKK-1 was included among the CKD-associated biomarkers. The relationship between DKK-1 levels and CKD status might involve inflammatory or mineral biomarkers. However, in contrast to our results, serum DKK-1 levels were significantly lower in patients with CKD than in controls [19]. Behets et al. [20] reported that serum DKK-1 levels were significantly lower in patients with CKD than in controls without CKD, but serum DKK-1 levels were not significantly different across different CKD stages in patients not on dialysis. Hamada-Ode et al. [21] reported that serum DKK-1 levels were significantly lower in Japanese individuals with an eGFR < 30 mL/min/1.73 m2 than in those with an eGFR ≥ 30 mL/min/1.73 m2. Discrepantly, Hsu et al. [22] reported that serum DKK-1 levels were significantly greater in patients with an eGFR < 30 mL/min/1.73 m2 than in healthy controls, and that serum DKK-1 levels were predictive of the onset of end-stage renal disease in patients with CKD during an eight-year follow-up. Serum DKK-1 levels vary widely across studies, and the variation in serum DKK-1 levels might result from differences in blood platelet counts [20].
In the present study, plasma DKK-1 levels were not significantly different between patients with and without obstructive coronary artery disease. Similarly, Wang et al. [23] reported that plasma DKK-1 levels were not significantly associated with vessel number or the stenosis degree of coronary arteries in patients with acute coronary syndrome. However, plasma DKK-1 was a significant predictor of MACE during a median two-year follow-up. Since CKD is a prognostic factor in patients with CAD, the relationship between DKK-1 levels and CKD may play a role in the prognosis of CAD. Furthermore, the mean plasma DKK-1 level of patients without CKD in the present study is similar to those reported in other studies, e.g., those reported in healthy controls and subjects who did not experience MACE [17,23]. Therefore, the plasma level, rather than the serum level, of DKK-1 could be a biomarker for CKD.
DKK-1 plays an important role in chronic inflammation [24,25]. A high CRP level has been thought to indicate a proinflammatory state and to be a risk factor of cardiovascular disease [26]. In the present study, plasma DKK-1 was significantly associated with hsCRP levels. In line with our findings, Wang et al. [23] reported that plasma DKK-1 levels were positively correlated with hsCRP levels in patients with acute coronary syndrome. Because hsCRP can facilitate the epithelial–mesenchymal transition and promote fibrosis through the Wnt/β-catenin signaling pathway in proximal tubular cells, decreases in mesangial matrix deposition and glomerular basement membrane thickness were observed in streptozotocin-induced diabetic rats after the knockdown of hsCRP [27]. Our results showed that plasma DKK-1 levels are an independent factor for CKD after adjusting for hsCRP levels.
In the present study, dyslipidemia status, characterized by hypertriglyceridemia and low HDL cholesterol levels, was associated with plasma DKK-1 levels. Goliasch et al. [28] reported that high Wnt-1 protein levels are associated with dyslipidemia in patients after myocardial infarction. Moreover, Wnt activation has been reported to inhibit adipocyte formation, and DKK-1 overexpression can attenuate the effects of Wnt and promote lipogenesis in mice with obesity induced by a high-fat diet [29]. Furthermore, metabolic syndrome, characterized by central obesity, high blood pressure, high fasting glucose, and dyslipidemia, is associated with meta-inflammation and chronic kidney disease [30]. However, dyslipidemia status was not significantly associated with CKD risk in the present study.
The strengths of our study include demonstrating that plasma DKK-1 levels are inversely correlated with the eGFR and that the Wnt/β-catenin signaling pathway may be involved in the underlying mechanism of CKD in patients without known DM. However, the area under the ROC curve for differentiating CKD was only 0.661 according to the plasma DKK-1 levels in the present study. The etiology of CKD is complex, and new biomarkers may provide further information to enable us to better understand the underlying mechanisms. There are several limitations in the present study. First, we did not investigate the real mechanism underlying the relationship between DKK-1 levels and CKD. Second, we did not examine the source of increased DKK-1 protein in the plasma. Third, we did not investigate whether reducing DKK-1 as a treatment target can prevent CKD development. Fourth, we did not identify the real etiology of CKD, which should be proven by biopsy. Finally, we enrolled patients with angina, a population at high risk of developing CKD, so our findings cannot be expanded to other populations.

5. Conclusions

Plasma DKK-1 levels are associated with CKD in patients with angina. Because DKK-1 is a potential antagonist of the Wnt/β-catenin signaling pathway, further studies to investigate the role of dysregulated Wnt/β-catenin signaling in the development of CKD are warranted.

Author Contributions

Conceptualization, Y.-H.L., Y.-C.C., J.W. and I.-T.L.; Data Curation, I.-T.L.; Formal Analysis, I.-T.L.; Funding Acquisition, I.-T.L.; Investigation, Y.-H.L. and I.-T.L.; Methodology, Y.-H.L., Y.-C.C. and I.-T.L.; Project Administration, I.-T.L.; Resources, I.-T.L.; Software, I.-T.L.; Supervision, I.-T.L.; Validation, I.-T.L.; Visualization, I.-T.L.; Writing—Original Draft, Y.-H.L., Y.-C.C. and J.W.; Writing—Review and Editing, I.-T.L. All authors have read and agreed to the published version of the manuscript.

Funding

This research was funded by grants from the Taichung Veterans General Hospital, Taiwan (grant number TCVGH-1140501C), and the National Science and Technology Council, Taiwan (grant number NSTC113-2314-B-075A-011-MY3). The funding bodies had no role in the decision to submit the manuscript for publication.

Institutional Review Board Statement

This study was conducted in accordance with the Declaration of Helsinki and approved by the Institutional Review Board of Taichung Veterans General Hospital (TCVGH-IRB No: C08215B; date of approval: 3 February 2009).

Informed Consent Statement

Informed consent was obtained from all subjects involved in this study.

Data Availability Statement

The datasets used and/or analyzed during the current study are available from the corresponding author on reasonable request.

Acknowledgments

We thank the Cardiovascular Center of Taichung Veterans General Hospital for their support. The statistical analysis was performed by the Biostatistics Task Force of Taichung Veterans General Hospital.

Conflicts of Interest

The authors declare no conflicts of interest.

Abbreviations

CIConfidence interval
CKDChronic kidney disease
hsCRPHigh-sensitivity C-reactive protein
CVCoefficient of variation
DKK-1Dickkopf-1
DMDiabetes mellitus
eGFREstimated glomerular filtration rate
MACEMajor adverse cardiac event
OROdds ratio
ROCReceiver operating characteristic
UACRUrine albumin-to-creatinine ratio
CIConfidence interval

References

  1. Guo, J.; Liu, Z.; Wang, P.; Wu, H.; Fan, K.; Jin, J.; Zheng, L.; Liu, Z.; Xie, R.; Li, C. Global, regional, and national burden inequality of chronic kidney disease, 1990–2021: A systematic analysis for the global burden of disease study 2021. Front. Med. 2024, 11, 1501175. [Google Scholar] [CrossRef] [PubMed]
  2. Ying, M.; Shao, X.; Qin, H.; Yin, P.; Lin, Y.; Wu, J.; Ren, J.; Zheng, Y. Disease Burden and Epidemiological Trends of Chronic Kidney Disease at the Global, Regional, National Levels from 1990 to 2019. Nephron 2024, 148, 113–123. [Google Scholar] [CrossRef] [PubMed]
  3. Yu, C.; Zheng, B.; Zhang, L.; Zhang, A.; Jia, Z.; Ding, G. Wnt/beta-Catenin Signaling and Congenital Abnormalities of Kidney and Urinary Tract. Kidney Dis. 2024, 10, 588–599. [Google Scholar]
  4. Saxena, S.; Dagar, N.; Shelke, V.; Puri, B.; Gaikwad, A.B. Wnt/beta-catenin modulation: A promising frontier in chronic kidney disease management. Fundam. Clin. Pharmacol. 2024, 38, 1020–1030. [Google Scholar] [CrossRef]
  5. Schunk, S.J.; Floege, J.; Fliser, D.; Speer, T. WNT-beta-catenin signalling—A versatile player in kidney injury and repair. Nat. Rev. Nephrol. 2021, 17, 172–184. [Google Scholar] [CrossRef]
  6. Zhao, B.R.; Hu, X.R.; Wang, W.D.; Zhou, Y. Cardiorenal syndrome: Clinical diagnosis, molecular mechanisms and therapeutic strategies. Acta Pharmacol. Sin. 2025. [Google Scholar] [CrossRef]
  7. Zhao, Y.; Wang, C.; Hong, X.; Miao, J.; Liao, Y.; Hou, F.F.; Zhou, L.; Liu, Y. Wnt/beta-catenin signaling mediates both heart and kidney injury in type 2 cardiorenal syndrome. Kidney Int. 2019, 95, 815–829. [Google Scholar] [CrossRef] [PubMed]
  8. Baetta, R.; Banfi, C. Dkk (Dickkopf) Proteins. Arterioscler. Thromb. Vasc. Biol. 2019, 39, 1330–1342. [Google Scholar] [CrossRef]
  9. Li, Y.H.; Wu, M.H.; Lee, W.J.; Lee, I.T. A Synergistic Effect between Plasma Dickkopf-1 and Obstructive Coronary Artery Disease on the Prediction of Major Adverse Cardiac Events in Patients with Angina: An Observational Study. Biomolecules 2022, 12, 1408. [Google Scholar] [CrossRef]
  10. Hsu, Y.C.; Ho, C.; Shih, Y.H.; Ni, W.C.; Li, Y.C.; Chang, H.C.; Lin, C.L. Knockout of KLF10 Ameliorated Diabetic Renal Fibrosis via Downregulation of DKK-1. Molecules 2022, 27, 2644. [Google Scholar] [CrossRef]
  11. He, W.; Dai, C.; Li, Y.; Zeng, G.; Monga, S.P.; Liu, Y. Wnt/beta-catenin signaling promotes renal interstitial fibrosis. J. Am. Soc. Nephrol. 2009, 20, 765–776. [Google Scholar] [CrossRef] [PubMed]
  12. Levey, A.S.; Stevens, L.A.; Schmid, C.H.; Zhang, Y.L.; Castro, A.F., 3rd; Feldman, H.I.; Kusek, J.W.; Eggers, P.; Van Lente, F.; Greene, T.; et al. A new equation to estimate glomerular filtration rate. Ann. Intern. Med. 2009, 150, 604–612. [Google Scholar] [CrossRef] [PubMed]
  13. Inker, L.A.; Astor, B.C.; Fox, C.H.; Isakova, T.; Lash, J.P.; Peralta, C.A.; Kurella Tamura, M.; Feldman, H.I. KDOQI US commentary on the 2012 KDIGO clinical practice guideline for the evaluation and management of CKD. Am. J. Kidney Dis. 2014, 63, 713–735. [Google Scholar] [CrossRef]
  14. Lin, Y.C.; Yen, L.L.; Chen, S.Y.; Kao, M.D.; Tzeng, M.S.; Huang, P.C.; Pan, W.H. Prevalence of overweight and obesity and its associated factors: Findings from National Nutrition and Health Survey in Taiwan, 1993–1996. Prev. Med. 2003, 37, 233–241. [Google Scholar] [CrossRef]
  15. Alberti, K.G.; Eckel, R.H.; Grundy, S.M.; Zimmet, P.Z.; Cleeman, J.I.; Donato, K.A.; Fruchart, J.C.; James, W.P.; Loria, C.M.; Smith, S.C., Jr.; et al. Harmonizing the metabolic syndrome: A joint interim statement of the International Diabetes Federation Task Force on Epidemiology and Prevention; National Heart, Lung, and Blood Institute; American Heart Association; World Heart Federation; International Atherosclerosis Society; and International Association for the Study of Obesity. Circulation 2009, 120, 1640–1645. [Google Scholar]
  16. Grundy, S.M.; Cleeman, J.I.; Daniels, S.R.; Donato, K.A.; Eckel, R.H.; Franklin, B.A.; Gordon, D.J.; Krauss, R.M.; Savage, P.J.; Smith, S.C., Jr.; et al. Diagnosis and management of the metabolic syndrome: An American Heart Association/National Heart, Lung, and Blood Institute Scientific Statement. Circulation 2005, 112, 2735–2752. [Google Scholar] [CrossRef] [PubMed]
  17. Wang, X.D.; Huang, X.F.; Yan, Q.R.; Bao, C.D. Aberrant activation of the WNT/beta-catenin signaling pathway in lupus nephritis. PLoS ONE 2014, 9, e84852. [Google Scholar]
  18. Lin, C.L.; Wang, J.Y.; Ko, J.Y.; Huang, Y.T.; Kuo, Y.H.; Wang, F.S. Dickkopf-1 promotes hyperglycemia-induced accumulation of mesangial matrix and renal dysfunction. J. Am. Soc. Nephrol. 2010, 21, 124–135. [Google Scholar] [CrossRef]
  19. Mihai, S.; Codrici, E.; Popescu, I.D.; Enciu, A.M.; Rusu, E.; Zilisteanu, D.; Necula, L.G.; Anton, G.; Tanase, C. Inflammation-Related Patterns in the Clinical Staging and Severity Assessment of Chronic Kidney Disease. Dis. Markers 2019, 2019, 1814304. [Google Scholar] [CrossRef]
  20. Behets, G.J.; Viaene, L.; Meijers, B.; Blocki, F.; Brandenburg, V.M.; Verhulst, A.; D’Haese, P.C.; Evenepoel, P. Circulating levels of sclerostin but not DKK1 associate with laboratory parameters of CKD-MBD. PLoS ONE 2017, 12, e0176411. [Google Scholar] [CrossRef]
  21. Hamada-Ode, K.; Taniguchi, Y.; Shimamura, Y.; Fujimoto, S.; Terada, Y. Serum dickkopf-related protein 1 and sclerostin may predict the progression of chronic kidney disease in Japanese patients. Nephrol. Dial. Transplant. 2019, 34, 1426–1427. [Google Scholar] [CrossRef] [PubMed]
  22. Hsu, Y.C.; Chang, C.C.; Hsieh, C.C.; Huang, Y.T.; Shih, Y.H.; Chang, H.C.; Chang, P.J.; Lin, C.L. Dickkopf-1 Acts as a Profibrotic Mediator in Progressive Chronic Kidney Disease. Int. J. Mol. Sci. 2023, 24, 7679. [Google Scholar] [CrossRef]
  23. Wang, L.; Hu, X.B.; Zhang, W.; Wu, L.D.; Liu, Y.S.; Hu, B.; Bi, C.L.; Chen, Y.F.; Liu, X.X.; Ge, C.; et al. Dickkopf-1 as a novel predictor is associated with risk stratification by GRACE risk scores for predictive value in patients with acute coronary syndrome: A retrospective research. PLoS ONE 2013, 8, e54731. [Google Scholar] [CrossRef]
  24. Jaschke, N.P.; Pahlig, S.; Sinha, A.; Adolph, T.E.; Colunga, M.L.; Hofmann, M.; Wang, A.; Thiele, S.; Schwarzler, J.; Kleymann, A.; et al. Dickkopf1 fuels inflammatory cytokine responses. Commun. Biol. 2022, 5, 1391. [Google Scholar] [CrossRef]
  25. Park, M.H.; Shin, J.H.; Bothwell, A.L.M.; Chae, W.J. Dickkopf proteins in pathological inflammatory diseases. J. Leukoc. Biol. 2022, 111, 893–901. [Google Scholar] [CrossRef]
  26. Toso, A.; Leoncini, M.; Maioli, M.; Villani, S.; Bellandi, F. Biomarkers of residual risk and all-cause mortality after acute coronary syndrome. Am. J. Prev. Cardiol. 2025, 21, 100934. [Google Scholar] [CrossRef] [PubMed]
  27. Zhang, L.; Shen, Z.Y.; Wang, K.; Li, W.; Shi, J.M.; Osoro, E.K.; Ullah, N.; Zhou, Y.; Ji, S.R. C-reactive protein exacerbates epithelial-mesenchymal transition through Wnt/beta-catenin and ERK signaling in streptozocin-induced diabetic nephropathy. FASEB J. 2019, 33, 6551–6563. [Google Scholar] [CrossRef] [PubMed]
  28. Goliasch, G.; Wiesbauer, F.; Kastl, S.P.; Katsaros, K.M.; Blessberger, H.; Maurer, G.; Schillinger, M.; Huber, K.; Wojta, J.; Speidl, W.S. Premature myocardial infarction is associated with low serum levels of Wnt-1. Atherosclerosis 2012, 222, 251–256. [Google Scholar] [CrossRef]
  29. Gao, Y.; Li, J.; Xu, X.; Wang, S.; Yang, Y.; Zhou, J.; Zhang, L.; Zheng, F.; Li, X.; Wang, B. Embelin attenuates adipogenesis and lipogenesis through activating canonical Wnt signaling and inhibits high-fat diet-induced obesity. Int. J. Obes. 2017, 41, 729–738. [Google Scholar] [CrossRef]
  30. Yang, T.; Chou, Y.C.; Chu, C.H.; Lin, S.H.; Hsieh, P.C.; Hsu, C.H.; Bai, C.H.; You, S.L.; Sun, C.A. Metabolic syndrome and C-reactive protein concentration as independent correlates of chronic kidney disease. Endocr. Res. 2014, 39, 94–98. [Google Scholar] [CrossRef]
Figure 1. Receiver operating characteristic (ROC) curves for differentiating chronic kidney disease (CKD) status on the basis of plasma Dickkopf-1 levels. The area under the curve was 0.661 (95% CI: 0.593; 0.729; p < 0.001). The dashed diagonal line represents the line of no discrimination.
Metabolites 15 00300 g001
Figure 2. The significant inverse correlation between the estimated glomerular filtration rate (eGFR) and plasma Dickkopf-1 levels. The Spearman’s rank correlation coefficient was −0.265 (p < 0.001).
Metabolites 15 00300 g002
Figure 3. The prevalence of chronic kidney disease (CKD) presented as quartiles of plasma Dickkopf-1 levels (p value for trend < 0.001). The ranges of Dickkopf-1 are as follows: quartile 1 (n = 93) between 180.7 and 456.7; quartile 2 (n = 93) between 456.8 and 608.5; quartile 3 (n = 93) between 608.6 and 747.5; and quartile 4 (n = 94) between 747.6 and 1141.1.
Metabolites 15 00300 g003
Table 1. Characteristics of enrolled patients grouped by CKD status.
CKD
(n = 62)
nonCKD
(n = 311)
p
Age (year)68.5 ±10.7 58.2 ±10.8 <0.001
Male, n (%)49(79.0%)238(76.5%)0.793
Current smoker, n (%)17(27.4%)106(34.1%)0.384
CAD, n (%)37(59.7%)151(48.6%)0.144
Waist circumference (cm)90.2 ±8.7 91.0 ±9.7 0.578
BMI (kg/m2)25.4 ±3.2 26.3 ±3.9 0.078
Systolic BP (mmHg)132.7 ±17.5 127.0 ±17.5 0.020
Diastolic BP (mmHg)73.2 ±10.7 74.9 ±10.3 0.257
DKK-1 (pg/mL)697.2 ±174.7 589.0 ±193.3 <0.001
Fasting glucose (mmol/L)5.3 ±1.1 5.3 ±0.7 0.847
HbA1c (%)5.8 ±0.6 5.8 ±0.6 0.828
Total cholesterol (mmol/L)4.5 ±0.9 4.5 ±1.0 0.795
HDL cholesterol (mmol/L)1.2 ±0.3 1.3 ±0.3 0.558
Triglycerides (mmol/L)1.6 ±1.2 1.5 ±0.9 0.514
eGFR (mL/min/1.73 m2)53.7 ±14.1 90.3 ±23.5 <0.001
C-reactive protein (mg/L)3.5 ±3.2 2.1 ±2.2 <0.001
Increased UACR, n (%)22(35.5%)34(10.9%)<0.001
Metabolic syndrome, n (%)24(38.7%)138(44.4%)0.496
Use of antiplatelet agents, n (%)56(90.3%)295(94.9%)0.231
Use of statins, n (%)31(50.0%)148(47.6%)0.835
Hypertension, n (%)60(96.8%)289(92.9%)0.396
Use of antihypertensive agents, n (%)53(85.5%)269(86.5%)0.993
ACE inhibitor or ARB, n (%)38(61.3%)159(51.1%)0.185
α-blocker, n (%)5(8.1%)11(3.5%)0.159
β-blocker, n (%)19(30.6%)83(26.7%)0.630
Calcium channel blocker, n (%)35(56.5%)159(51.1%)0.530
Diuretics, n (%)16(25.8%)36(11.6%)0.006
ACE, angiotensin-converting enzyme; ARB, angiotensin II receptor blocker; BMI, body mass index; BP, blood pressure; CAD, coronary artery disease; CKD, chronic kidney disease; DKK-1, Dickkopf-1; eGFR, estimated glomerular filtration rate; HbA1c, glycated hemoglobin; HDL, high-density lipoprotein; UACR, urinary albumin-to-creatinine ratio.
Table 2. Spearman’s rank correlation coefficients (σ) between plasma DKK-1 and continuous variables of CKD risk factors.
Continuous Variableσp
Age0.1420.006
Waist−0.0140.787
BMI−0.0730.157
Systolic BP0.0540.298
Diastolic BP0.0050.920
Fasting glucose−0.0050.931
HbA1c0.0690.184
Total cholesterol0.1120.031
HDL cholesterol−0.0950.066
Triglycerides0.192<0.001
C-reactive protein0.0940.068
UACR0.1130.029
BMI, body mass index; BP, blood pressure; CKD, chronic kidney disease; DKK-1, Dickkopf-1; eGFR, estimated glomerular filtration rate; HbA1c, glycated hemoglobin; HDL, high-density lipoprotein; UACR, urinary albumin-to-creatinine ratio.
Table 3. Plasma DKK-1 levels in patients grouped according to CKD risk factors.
VariableGroupPatient NumberMean±SDDifference in Mean (95% CI)p
Age<60 years182589.3 ±199.7 −34.6 (−74.1, 4.9)0.086
≥60 years191623.9 ±188.1
SexFemale86611.1 ±184.2 5.3 (−41.8, 52.3)0.825
Male287605.8 ±197.6
Current smokerNo250593.2 ±196.6 −41.8 (−83.7, 0.1)0.051
Yes123635.0 ±187.5
CADNo185612.0 ±191.2 9.9 (−29.8, 49.5)0.625
Yes188602.1 ±197.8
HypertensionNo24611.3 ±229.4 4.6 (−76.2, 85.3)0.911
Yes349606.7 ±192.1
Central obesity *No161608.6 ±188.6 2.8 (−37.2, 42.8)0.890
Yes212605.8 ±199.0
BMI<27 kg/m2248614.3 ±191.0 21.6 (−20.3, 63.6)0.310
≥27 kg/m2125592.6 ±200.9
Systolic BP<130 mmHg202595.7 ±197.8 −24.7 (−64.4, 14.9)0.221
≥130 mmHg171620.4 ±189.9
Diastolic BP<80 mmHg258612.5 ±201.1 17.8 (−25.1, 60.6)0.416
≥80 mmHg115594.7 ±178.5
Fasting glucose<7.2 mmol/L52574.8 ±186.1 −31.6 (−90.8, 27.7)0.296
≥7.2 mmol/L255606.3 ±200.3
HbA1c<8.5%274605.9 ±194.9 −4.0 (−48.8, 40.9)0.862
≥8.5%99609.9 ±193.7
Total cholesterol<4.14 mmol/L139598.9 ±212.0 −13.0 (−53.9, 28.0)0.533
≥4.14 mmol/L234611.8 ±183.4
Low HDL cholesterol #No269590.8 ±188.8 −58.2 (−102.0, −14.5)0.009
Yes104649.0 ±203.0
Triglycerides<1.7 mmol/L253592.1 ±191.2 −46.2 (−88.4, −4.1)0.032
≥1.7 mmol/L120638.3 ±198.1
C-reactive protein<2 mg/L216584.0 ±181.9 −54.7 (−94.4, −15.0)0.007
≥2 mg/L157638.7 ±206.7
UACR<30 mg/g317601.3 ±193.1 −38.1 (−93.4, 17.3)0.177
≥30 mg/g56639.3 ±200.0
Metabolic syndromeNo211592.5 ±191.6 −33.5 (−73.3, 6.3)0.099
Yes162625.9 ±196.9
Use of statins No194607.9 ±187.0 1.9 (−37.7, 41.6)0.923
Yes179606.0 ±202.5
Use of antihypertensive drugs No51628.8 ±214.9 25.3 (−32.4, 82.9)0.389
Yes322603.5 ±191.0
Use of antiplatelet drugs No22584.9 ±222.4 −23.5 (−107.6, 60.6)0.583
Yes351608.4 ±192.7
ACE inhibitor or ARBNo176617.6 ±190.6 20.2 (−19.5, 59.8)0.318
Yes197597.5 ±197.7
α-blockerNo357608.5 ±195.1 34.0 (−63.8, 131.7)0.495
Yes16574.5 ±178.7
β-blockerNo271603.7 ±195.9 −12.1 (−56.5, 32.4)0.594
Yes102615.8 ±190.9
Calcium channel blockerNo179601.7 ±194.0 −10.2 (−49.8, 29.5)0.614
Yes194611.9 ±195.0
DiureticsNo321606.3 ±194.8 −5.0 (−62.2, 52.2)0.864
Yes52611.3 ±193.4
ACE, angiotensin-converting enzyme; ARB, angiotensin II receptor blocker; BMI, body mass index; BP, blood pressure; CAD, coronary artery disease; CKD, chronic kidney disease; DKK-1, Dickkopf-1; eGFR, estimated glomerular filtration rate; HbA1c, glycated hemoglobin; HDL, high-density lipoprotein; SD, standard deviation; UACR, urinary albumin-to-creatinine ratio. * Central obesity means waist circumference >90 cm in men or >80 cm in women. # Low HDL cholesterol means <40 mg/dL (1.0 mmol/L) in men or <50 mg/dL (1.3 mmol/L) in women.
Table 4. Odds ratios (95% CI) for chronic kidney disease (CKD) by quartiles of Dickkopf-1 levels.
Quartile 1
n = 93
(180.7–456.7 pg/mL)
Quartile 2
n = 93
(456.8–608.5 pg/mL)
Quartile 3
n = 93
(608.6–747.5 pg/mL)
Quartile 4
n = 94
(747.6–1141.1 pg/mL)
p
CKD/nonCKD6/8713/8019/7424/70
Crude1.000 (reference)2.356 (0.855, 6.494) **3.723 (1.413, 9.809) **4.971 (1.926, 12.833) **0.006
Model 11.000 (reference)2.173 (0.765, 6.173)3.769 (1.381, 10.285) **4.437 (1.664, 11.829) **0.014
Model 21.000 (reference)2.193 (0.771, 6.235)3.580 (1.307, 9.801) *4.188 (1.564, 11.212) **0.024
Model 1: adjusted for age and sex. Model 2: adjusted for age, sex, and C-reactive protein. * p < 0.05; ** p < 0.01.
Disclaimer/Publisher’s Note: The statements, opinions and data contained in all publications are solely those of the individual author(s) and contributor(s) and not of MDPI and/or the editor(s). MDPI and/or the editor(s) disclaim responsibility for any injury to people or property resulting from any ideas, methods, instructions or products referred to in the content.

