Intestinal Metabolome for Diagnosing and Prognosing Autism Spectrum Disorder in Children: A Systematic Review


Abstract
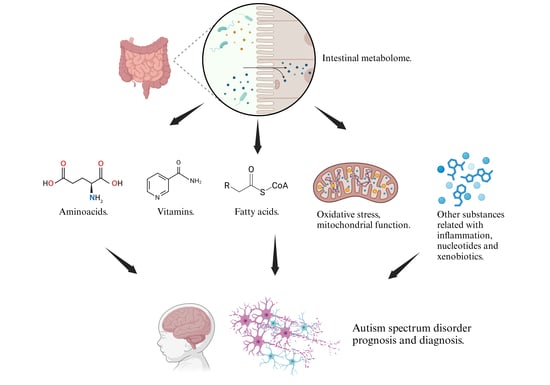
1. Introduction
2. Materials and Methods
2.1. Eligibility Criteria
2.2. Study Selection and Data Extraction
2.3. Risk of Bias Assessment
3. Results
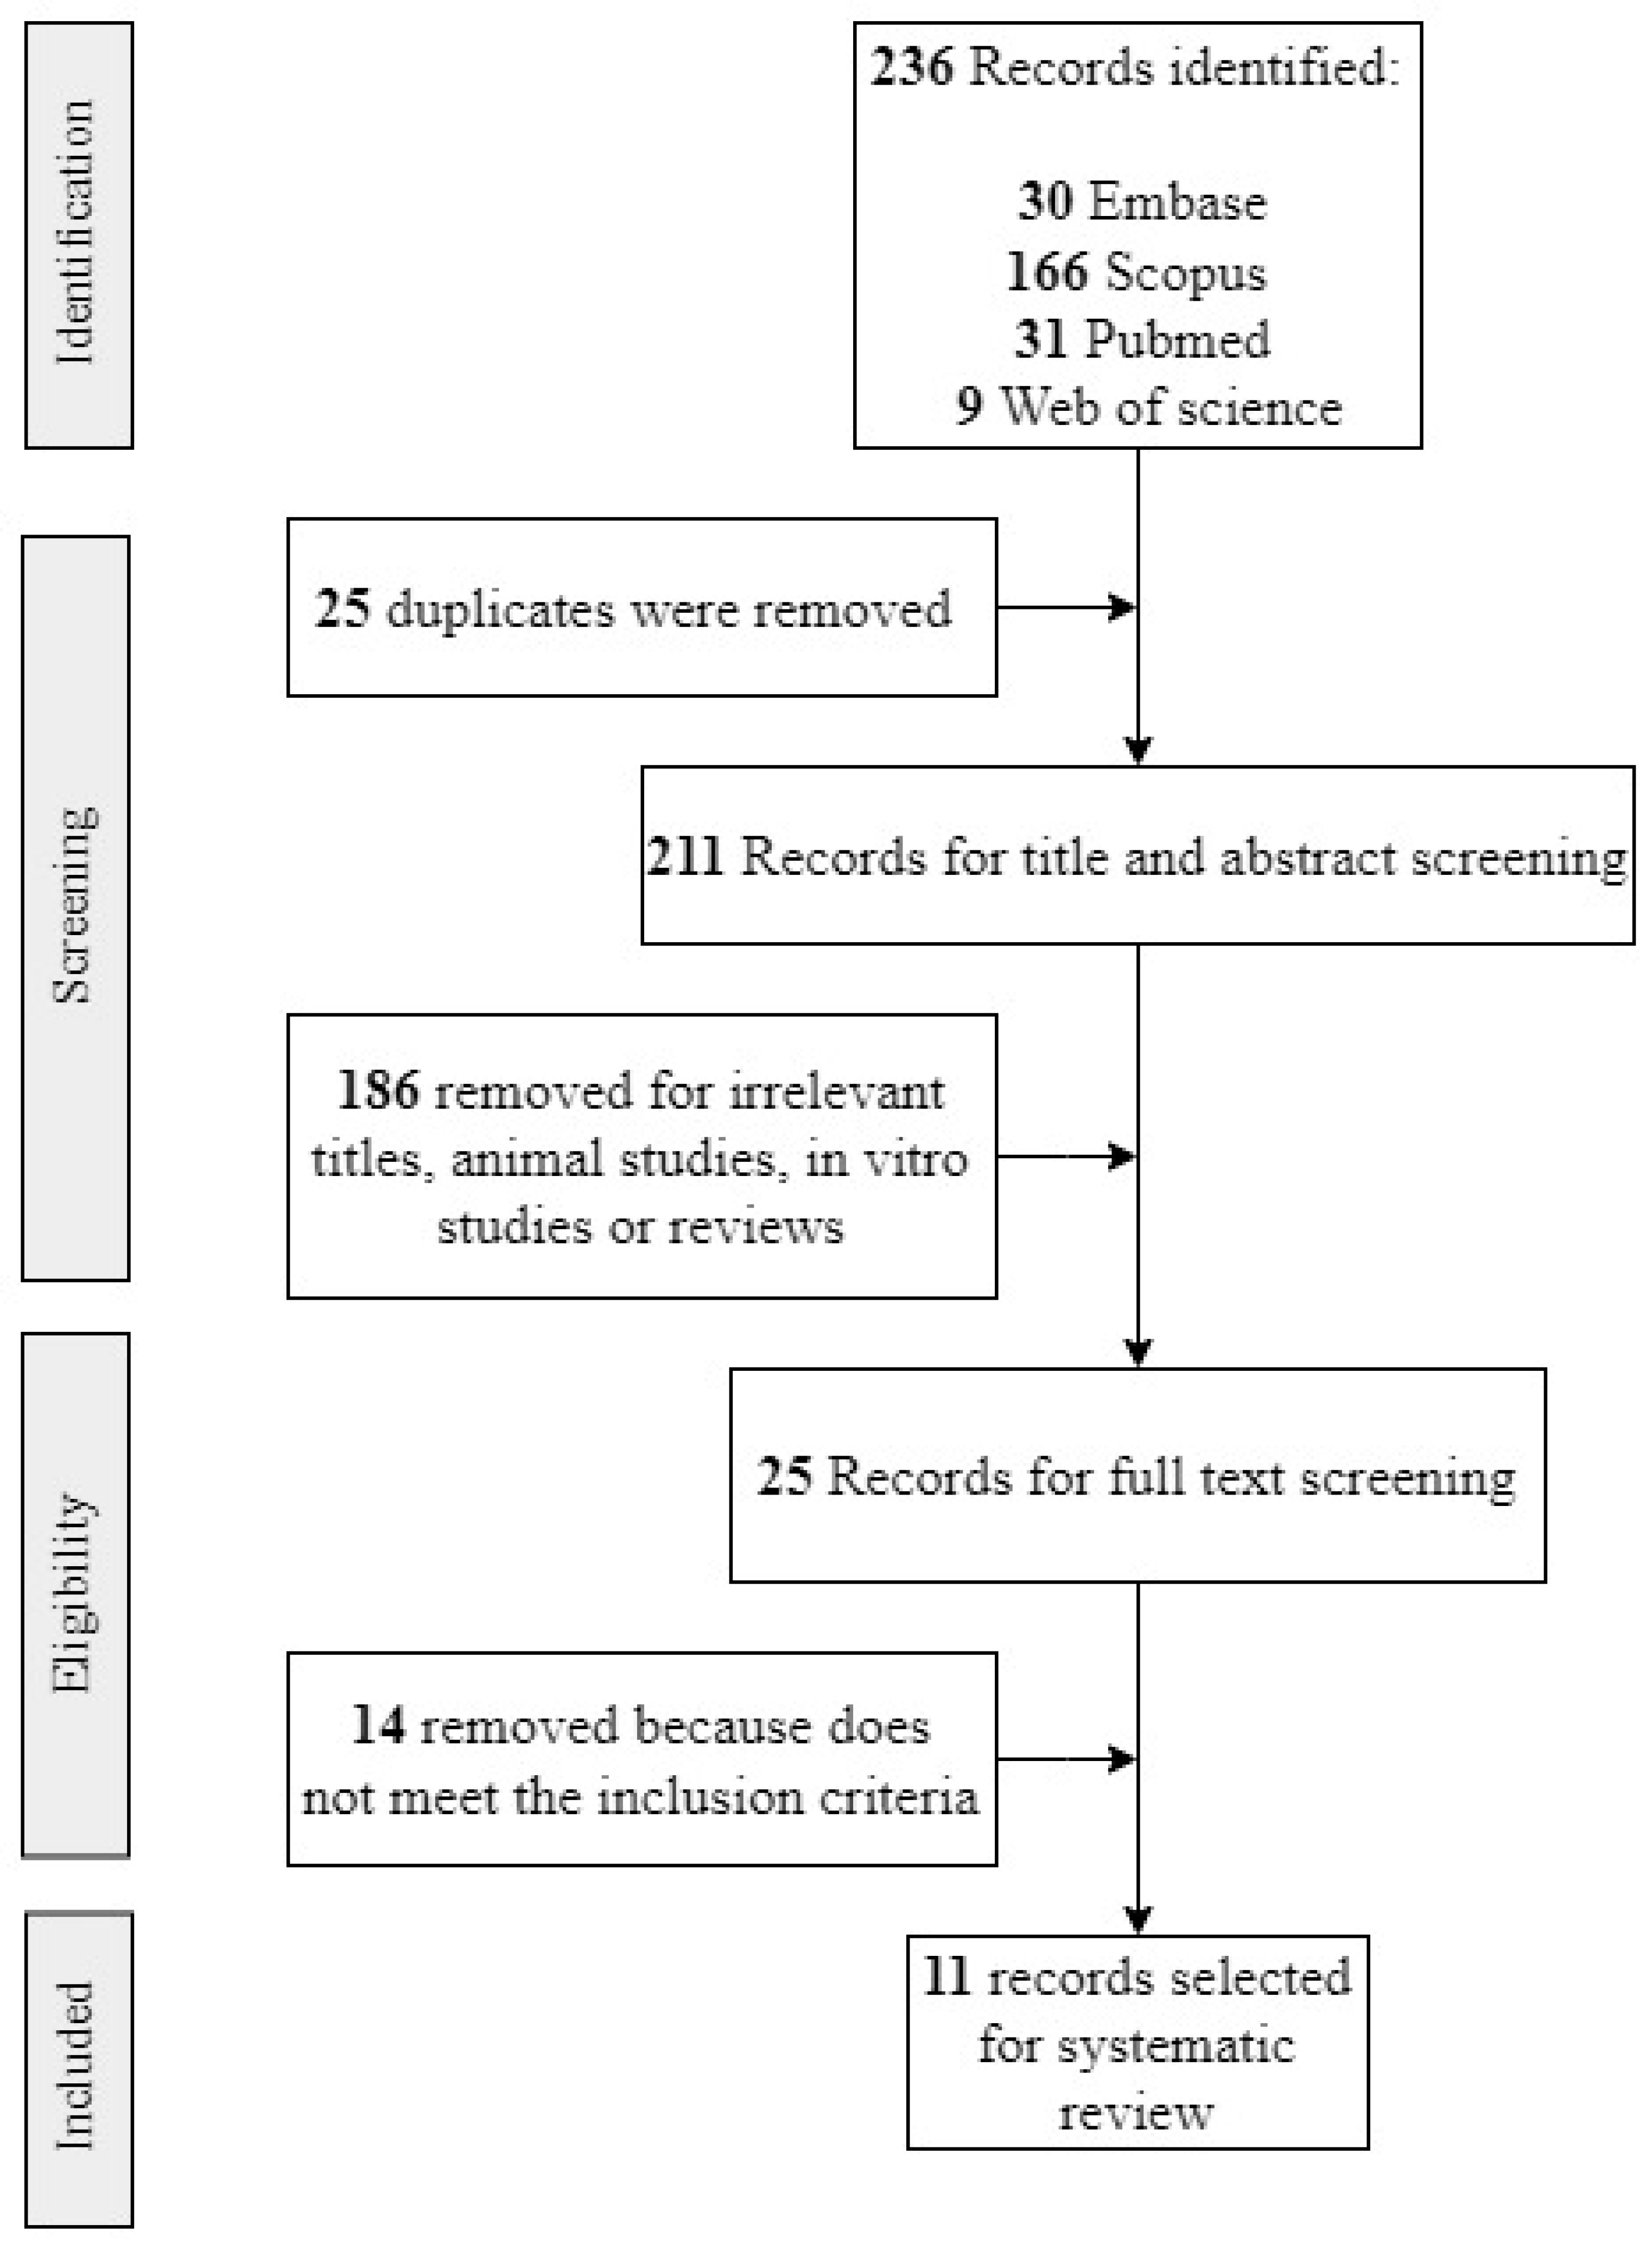
3.1. Study Selection
3.2. Characteristics of Included Studies
3.3. Intestinal Metabolome and ASD Diagnosis

| Author(s) | Title | Year | Metabolomics Method | Number of Participants | Age | Sex (M/F) | Country | Recruitment | ASD Diagnosis Method |
|---|---|---|---|---|---|---|---|---|---|
| Needham et al. [4] | Plasma and fecal metabolite profiles in autism spectrum disorder | 2021 | UHPLC-MS/MS | Plasma samples. ASD: 130, NA: 101. Fecal samples in a subset. ASD: 57, NA: 40 | ASD and NA: 3–12 years old | Not clear information. ASD: 48/7. NA: 36/3 | United States | Samples were collected in the MIND Institute, University of California, Davis. ASD diagnosis was confirmed by trained staff. NA participants were screened using the Social Communication Questionnaire and scored within the typical range. An additional evaluation to determine gastrointestinal (GI) symptoms was completed by 97 participants who also provided stool samples. GI status was determined using the GI symptom scale, based on Rome III Diagnostic Questionnaire on Pediatric Functional Gastrointestinal Disorders. | ADOS2, ADI-R, DSM5 |
| Zhu et al. [21] | Alterations in gut vitamin and amino acid metabolism are associated with symptoms and neurodevelopment in children with autism spectrum disorder | 2022 | LC–MS/MS | ASD: 120. NA: 60 | ASD and NA: 2 to 6 years. | ASD: 99/21. NA: 39/21 | China | The inclusion criteria were a diagnosis of ASD made by a developmental pediatrician. The exclusion criteria were other developmental disorders, psychiatric or neurological diseases, genetic or metabolic illness, major physical disease, a recent history of infection, special diets, or probiotic/antibiotic use. NA children were healthy, and showed no sign of developmental disorders, psychiatric diseases, or GI symptoms. | DSM5, CARS |
| Wang et al. [22] | Alterations in gut glutamate metabolism associated with changes in gut microbiota composition in children with autism spectrum disorder | 2019 | LC-MS | ASD: 92 (43 for the initial analysis and 49 for validation); NA: 42 (31 for the initial analysis and 11 for validation). | ASD and NA: Less than 14 years old. | ASD: 36/7. NA: 17/14 | China | ASD: Children younger than 14 years old and classified as “requiring very substantial support” were included. Exclusion criteria were: diagnosis of other mental illness, other neurodevelopmental condition, genetic metabolic disease, or severe neurological disease; history of brain injury; or history of other major physical illness. NA: Healthy children, with no mental illness, and age- and gender-matched with the patient group. Exclusion criteria were the same as for the ASD group. Signed informed consent was obtained from the parents of ASD and NA children. | DSM5 |
| Chamtouri et al. [23] | An overview on fecal profiles of amino acids and related amino-derived compounds in children with autism spectrum disorder in Tunisia | 2023 | UHPLC | ASD: 28; NA: 46 (divided in two groups: 18 siblings of the participants and 28 children from the general population matched with autists by gender, age, socio-economic status, and geographic region). | ASD and NA: 4 to 10 years old | ASD: 22/6. NA: 27/19 | Tunisia | Authors considered three groups: autistic children, siblings of autistic children and general population children. The last 2 are considered NA. NA children did not show signs of developmental disorders or psychiatric diseases. The exclusion criteria for the three groups were having suffered infections, antibiotics or anti-fungal treatment or having consumed probiotics and/or prebiotics in the previous month of recruitment, unbalanced or special diets, other neurological disorders not associated with autism, type 1 diabetes, genetic syndromes, celiac disease, food intolerance, or inflammatory bowel disease. | DSM5, ADOS2. ADI-R, CARS |
| Kang et al. [25] | Distinct fecal and plasma metabolites in children with autism spectrum disorders and their modulation after microbiota transfer therapy | 2020 | UHPLC-MS/MS | ASD: 18 NA: 20 | ASD and NA: 7–16 years old | ASD: 16/2. NA: 18/2 | United States | Participants were recruited primarily from the greater Phoenix, Arizona area. The study physician assessed eligibility criteria Once qualified, participants engaged in an initial 30-min meeting which included a general physical health examination by the study physician and discussion with a project member. Exclusion criteria included antibiotics use in the prior 6 months or probiotics use in the prior 3 months; dependence on tube feeding; severe GI problems that require immediate treatment; recent/scheduled surgeries; diagnosed as severely malnourished or underweight; and diagnosed with a single-gene disorder, major brain malformations, ulcerative colitis, Crohn’s disease, celiac disease, or eosinophilic esophagitis. None of the NA children had been diagnosed with mental disorders including ASD, attention-deficit hyperactivity disorder (ADHD), depression, or anxiety. None of the neurotypical children had first-degree relatives with ASD. | ADI-R |
| Jones et al. [29] | Changes to the gut microbiome in young children showing early behavioral signs of autism | 2022 | GC-MS | Not clear but a total of 24 children were enrolled Six of the 24 children provided stool samples one and two years post-baseline. | ASD and NA: 9–14 months at the beginning of the study | Change between time points of the study (A and B.) ASD: A:3/1, B: 8/3. NA: A: 5/0; B: 4/1 | Australia | Included children showing early social-communication delays as determined by Social Attention and Communication Surveillance–Revised (SACS-R) 12-month checklist. Families were referred by community clinicians and invited to participate. The infant displayed at least 3 of 5 specified behaviors indicating a high likelihood of ASD as defined by the Social Attention and Communication Surveillance–Revised (SACS-R) 12-month checklist and the primary caregiver spoke sufficient English to participate in the intervention. Infant were excluded if they had a neurological condition and other developmental problems and/or the family did not intend to remain residents in the local area during the study. | ADOS2 |
| Berding et al. [30] | Dietary patterns impact temporal dynamics of fecal microbiota composition in children with autism spectrum disorder | 2020 | GC | ASD: 26, NA: 32 | ASD and NA: 2–7 years old | ASD: 19/7. NA: 19/13 | United States | Participants were recruited in the Champaign-Urbana area. All subjects were free from functional digestive disorders, had not used antibiotics, probiotics or prebiotic in the 3 months prior to enrollment in the study, did not take any routine medications and did not follow any special diet (e.g., gluten-free/casein-free diet). Parents completed an online questionnaire, including questions regarding their child’s age, gender, mode of delivery, early feeding practices, nutritional supplement use, height and weight. | It is not clearly explained. |
| Deng et al. [31] | Gastrointestinal symptoms have a minor impact on autism spectrum disorder and associations with gut microbiota and short-chain fatty acids | 2022 | GC-MS | ASD: 45, NA: 45. | ASD: 5.95 ± 2.36 years old. NA: 6.13 ± 0.90 years old | ASD: 39/6. NA: 21/24 | China | Participants were enrolled from a local kindergarten. Children were excluded from the study if physical, neurological, and behavioral tests were performed for each participant. Children who had previously been diagnosed with genetic conditions (such as tuberous sclerosis, fragile X syndrome, and Rett syndrome), had received antibiotics or probiotics within 1 month, or were suffering from trauma, tumors, or other serious nervous system diseases. | DSM5 |
| Qureshi et al. [32] | Multivariate analysis of fecal metabolites from children with autism spectrum disorder and gastrointestinal symptoms before and after microbiota transfer therapy | 2020 | UHPLC-MS/MS | ASD: 18, NA: 20 | ASD and NA: 7–16 years old | ASD: 16/2. NA: 18/2 | United States | Participants were recruited primarily from the greater Phoenix, Arizona area. The study physician assessed eligibility criteria Once qualified, participants engaged in an initial 30-min meeting which included a general physical health examination by the study physician and discussion with a project member. Exclusion criteria included antibiotics use in the prior 6 months or probiotics use in the prior 3 months; dependence on tube feeding; severe GI problems that require immediate treatment; recent/scheduled surgeries; diagnosed as severely malnourished or underweight; and diagnosed with a single-gene disorder, major brain malformations, ulcerative colitis, Crohn’s disease, celiac disease, or eosinophilic esophagitis. None of the NA children had been diagnosed with mental disorders including ASD, attention-deficit hyperactivity disorder (ADHD), depression, or anxiety. None of the neurotypical children had first-degree relatives with ASD. | ADI-R |
| Dan et al. [33] | Altered gut microbial profile is associated with abnormal metabolism activity of autism spectrum disorder | 2020 | LC/MS and UHPLC-QE | ASD: 143 (metabolomics was made in 30 children); NA: 143. | ASD and NA: 2–13 years. | ASD: 127/16. NA: 130/13 | China | All of the children underwent physical, neurological, and behavioral examinations. The exclusion criteria were diseases such as depressive disorder, cerebral palsy, schizophrenia, bipolar disorder, significant sensory impairment, and clinically significant inflammatory conditions. All participants had not taken antibiotics, probiotics, and prebiotics in the 3 months prior to the feces collection. None of the participants were on anti-inflammatory or antioxidant drugs. | DSM5 |
| Laghi et al. [34] | Are fecal metabolome and microbiota profiles correlated with autism severity? A cross-sectional study on ASD preschoolers | 2021 | H-NMR | ASD: 80 | ASD: 18 to 72 months. NA: There is not a neurotypical group. | ASD: 66/14. NA: There is not a neurotypical group. | Italy | Participants were recruited during a clinical trial on the efficacy of probiotic supplementation in ASD preschoolers. Participants must have a diagnosis of ASD made by a senior child psychiatrist with a specific expertise in ASD. Exclusion criteria: brain anomalies detected by magnetic resonance imaging, neurological syndromes or focal neurological signs, birth asphyxia, severe premature birth (≤28 gestational weeks) or perinatal injuries, epilepsy, significant sensory impairment (blindness, deafness), diagnosis of organic GI disorder (gastro-esophageal reflux, food allergies, Inflammatory bowel disease),diagnosis of celiac disease, special diet (gluten-free diet, casein-free diet, high-protein diet, ketogenic diet). | DSM5, ADOS2 |
| Author(s) | Association with Diagnosis |
|---|---|
| Needham et al. [4] | Higher in ASD: Nicotinamide Higher in NA: 9-HOTrE |
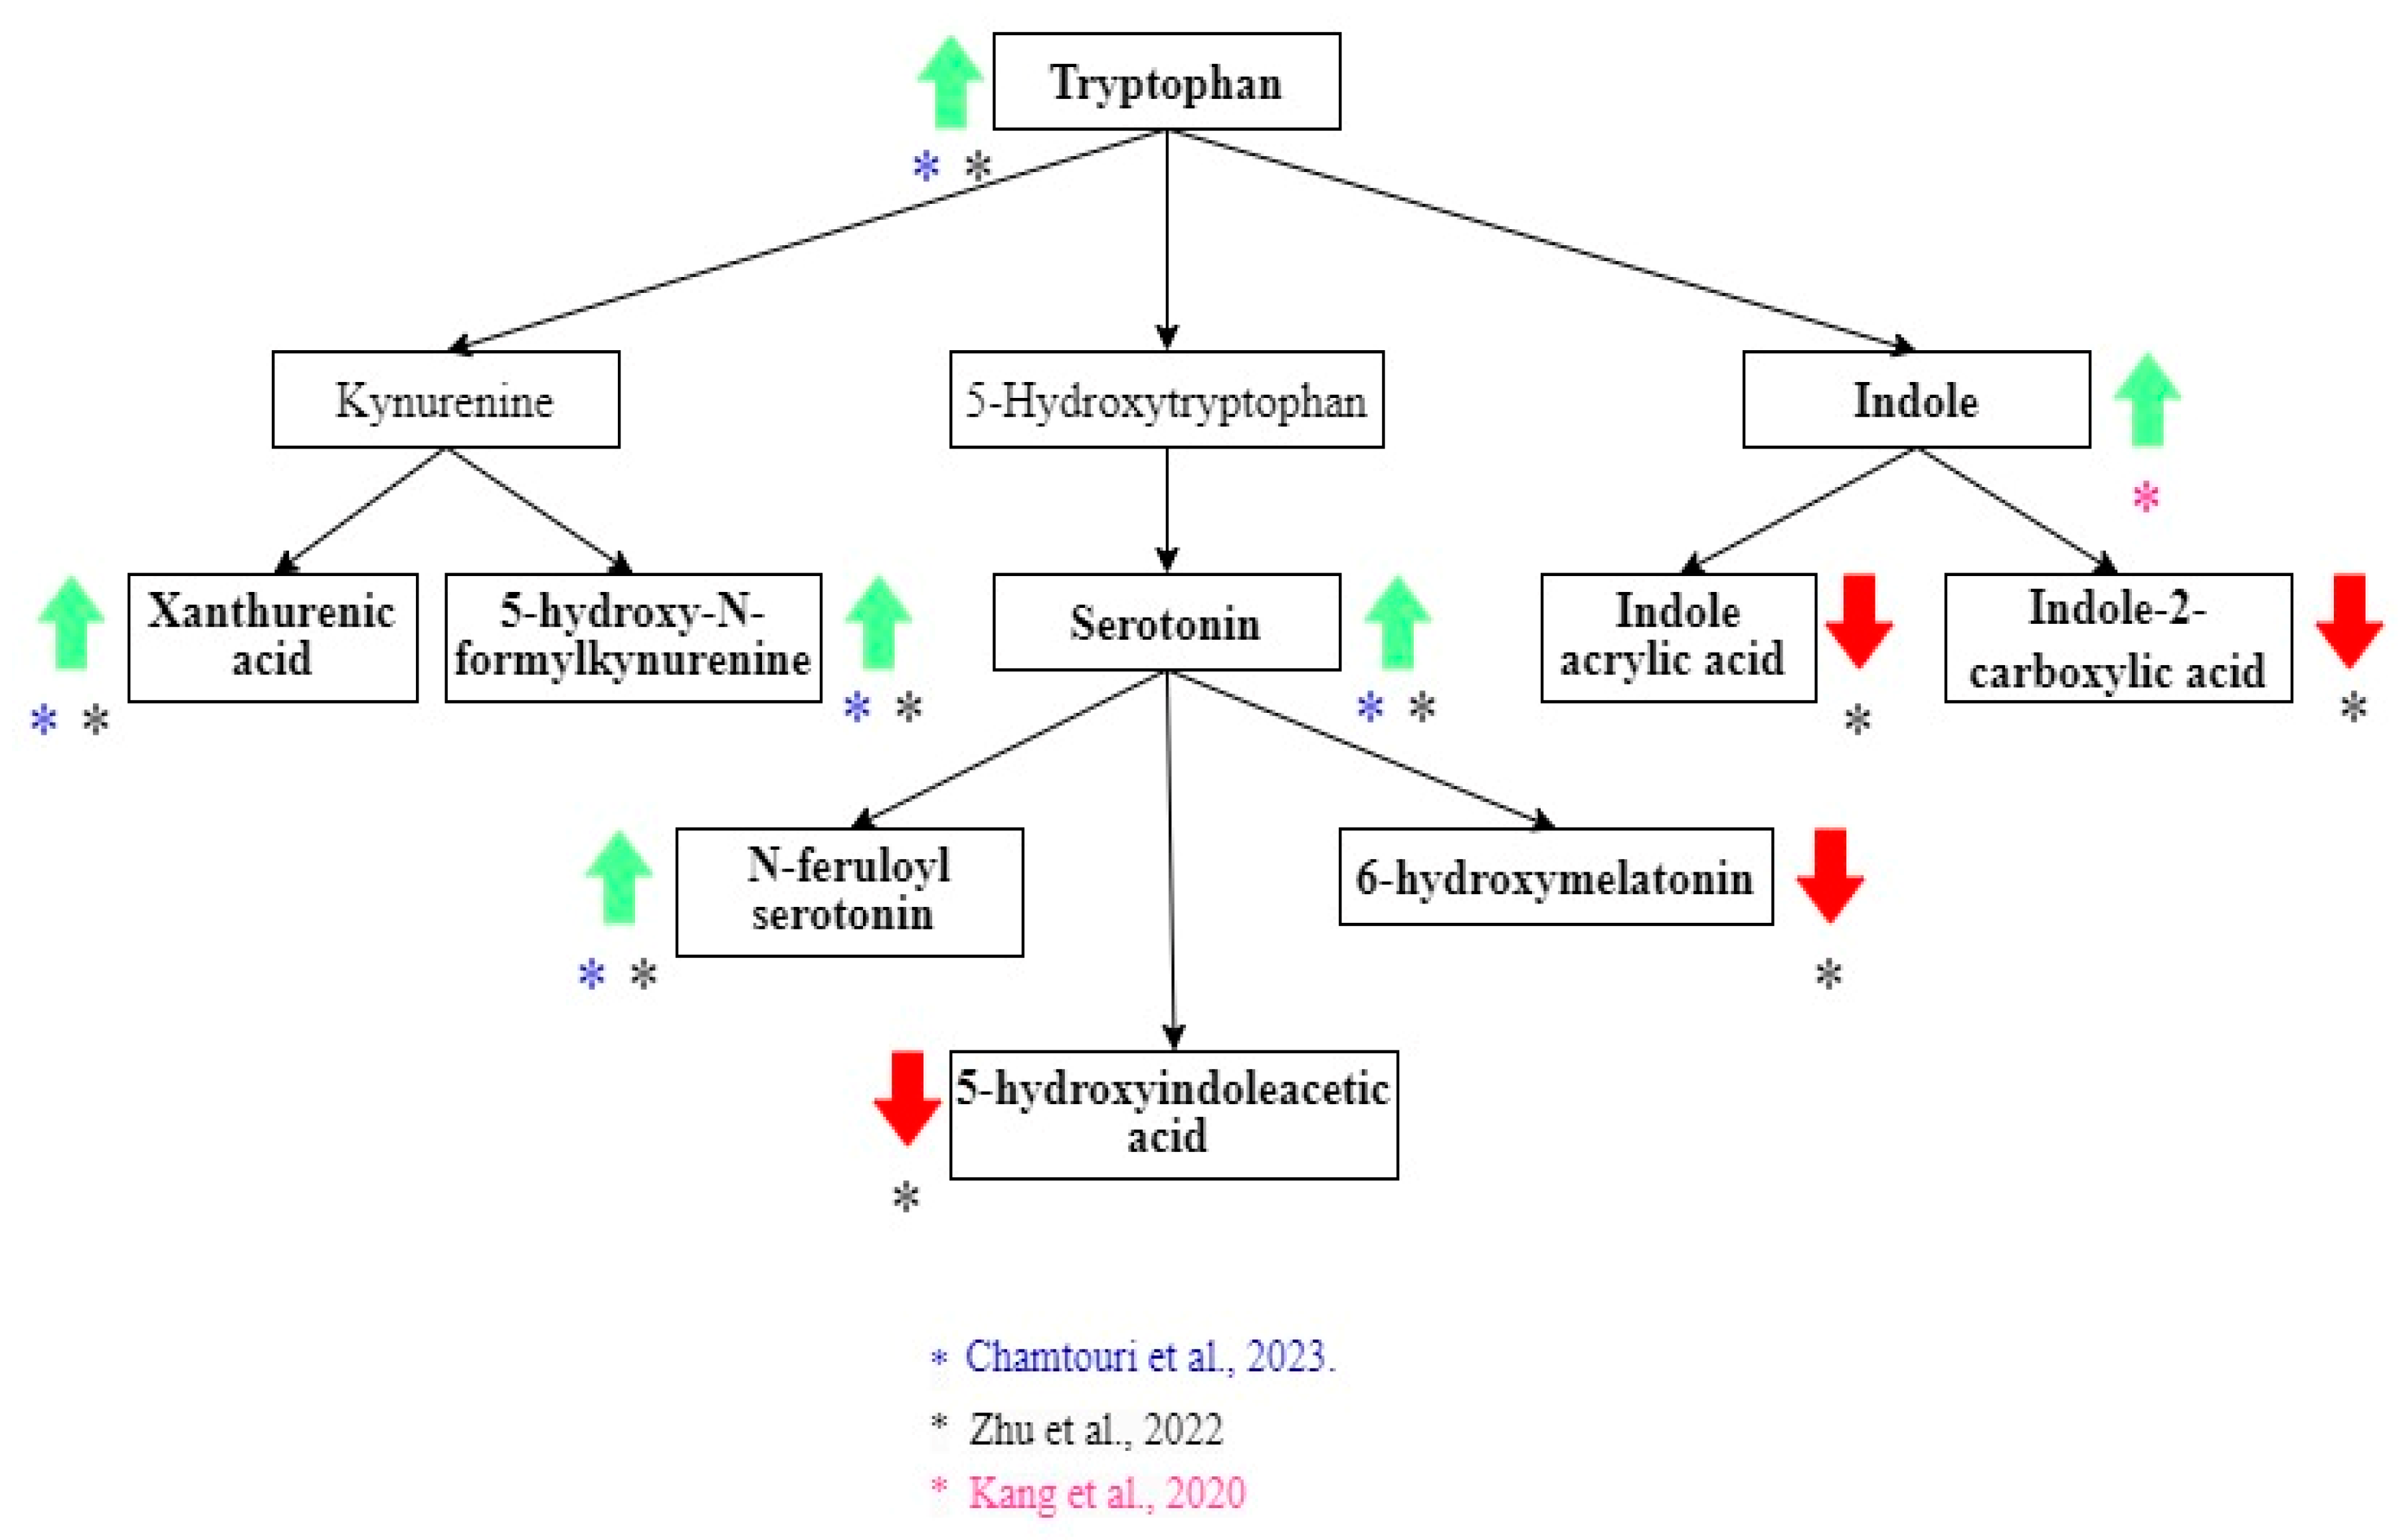
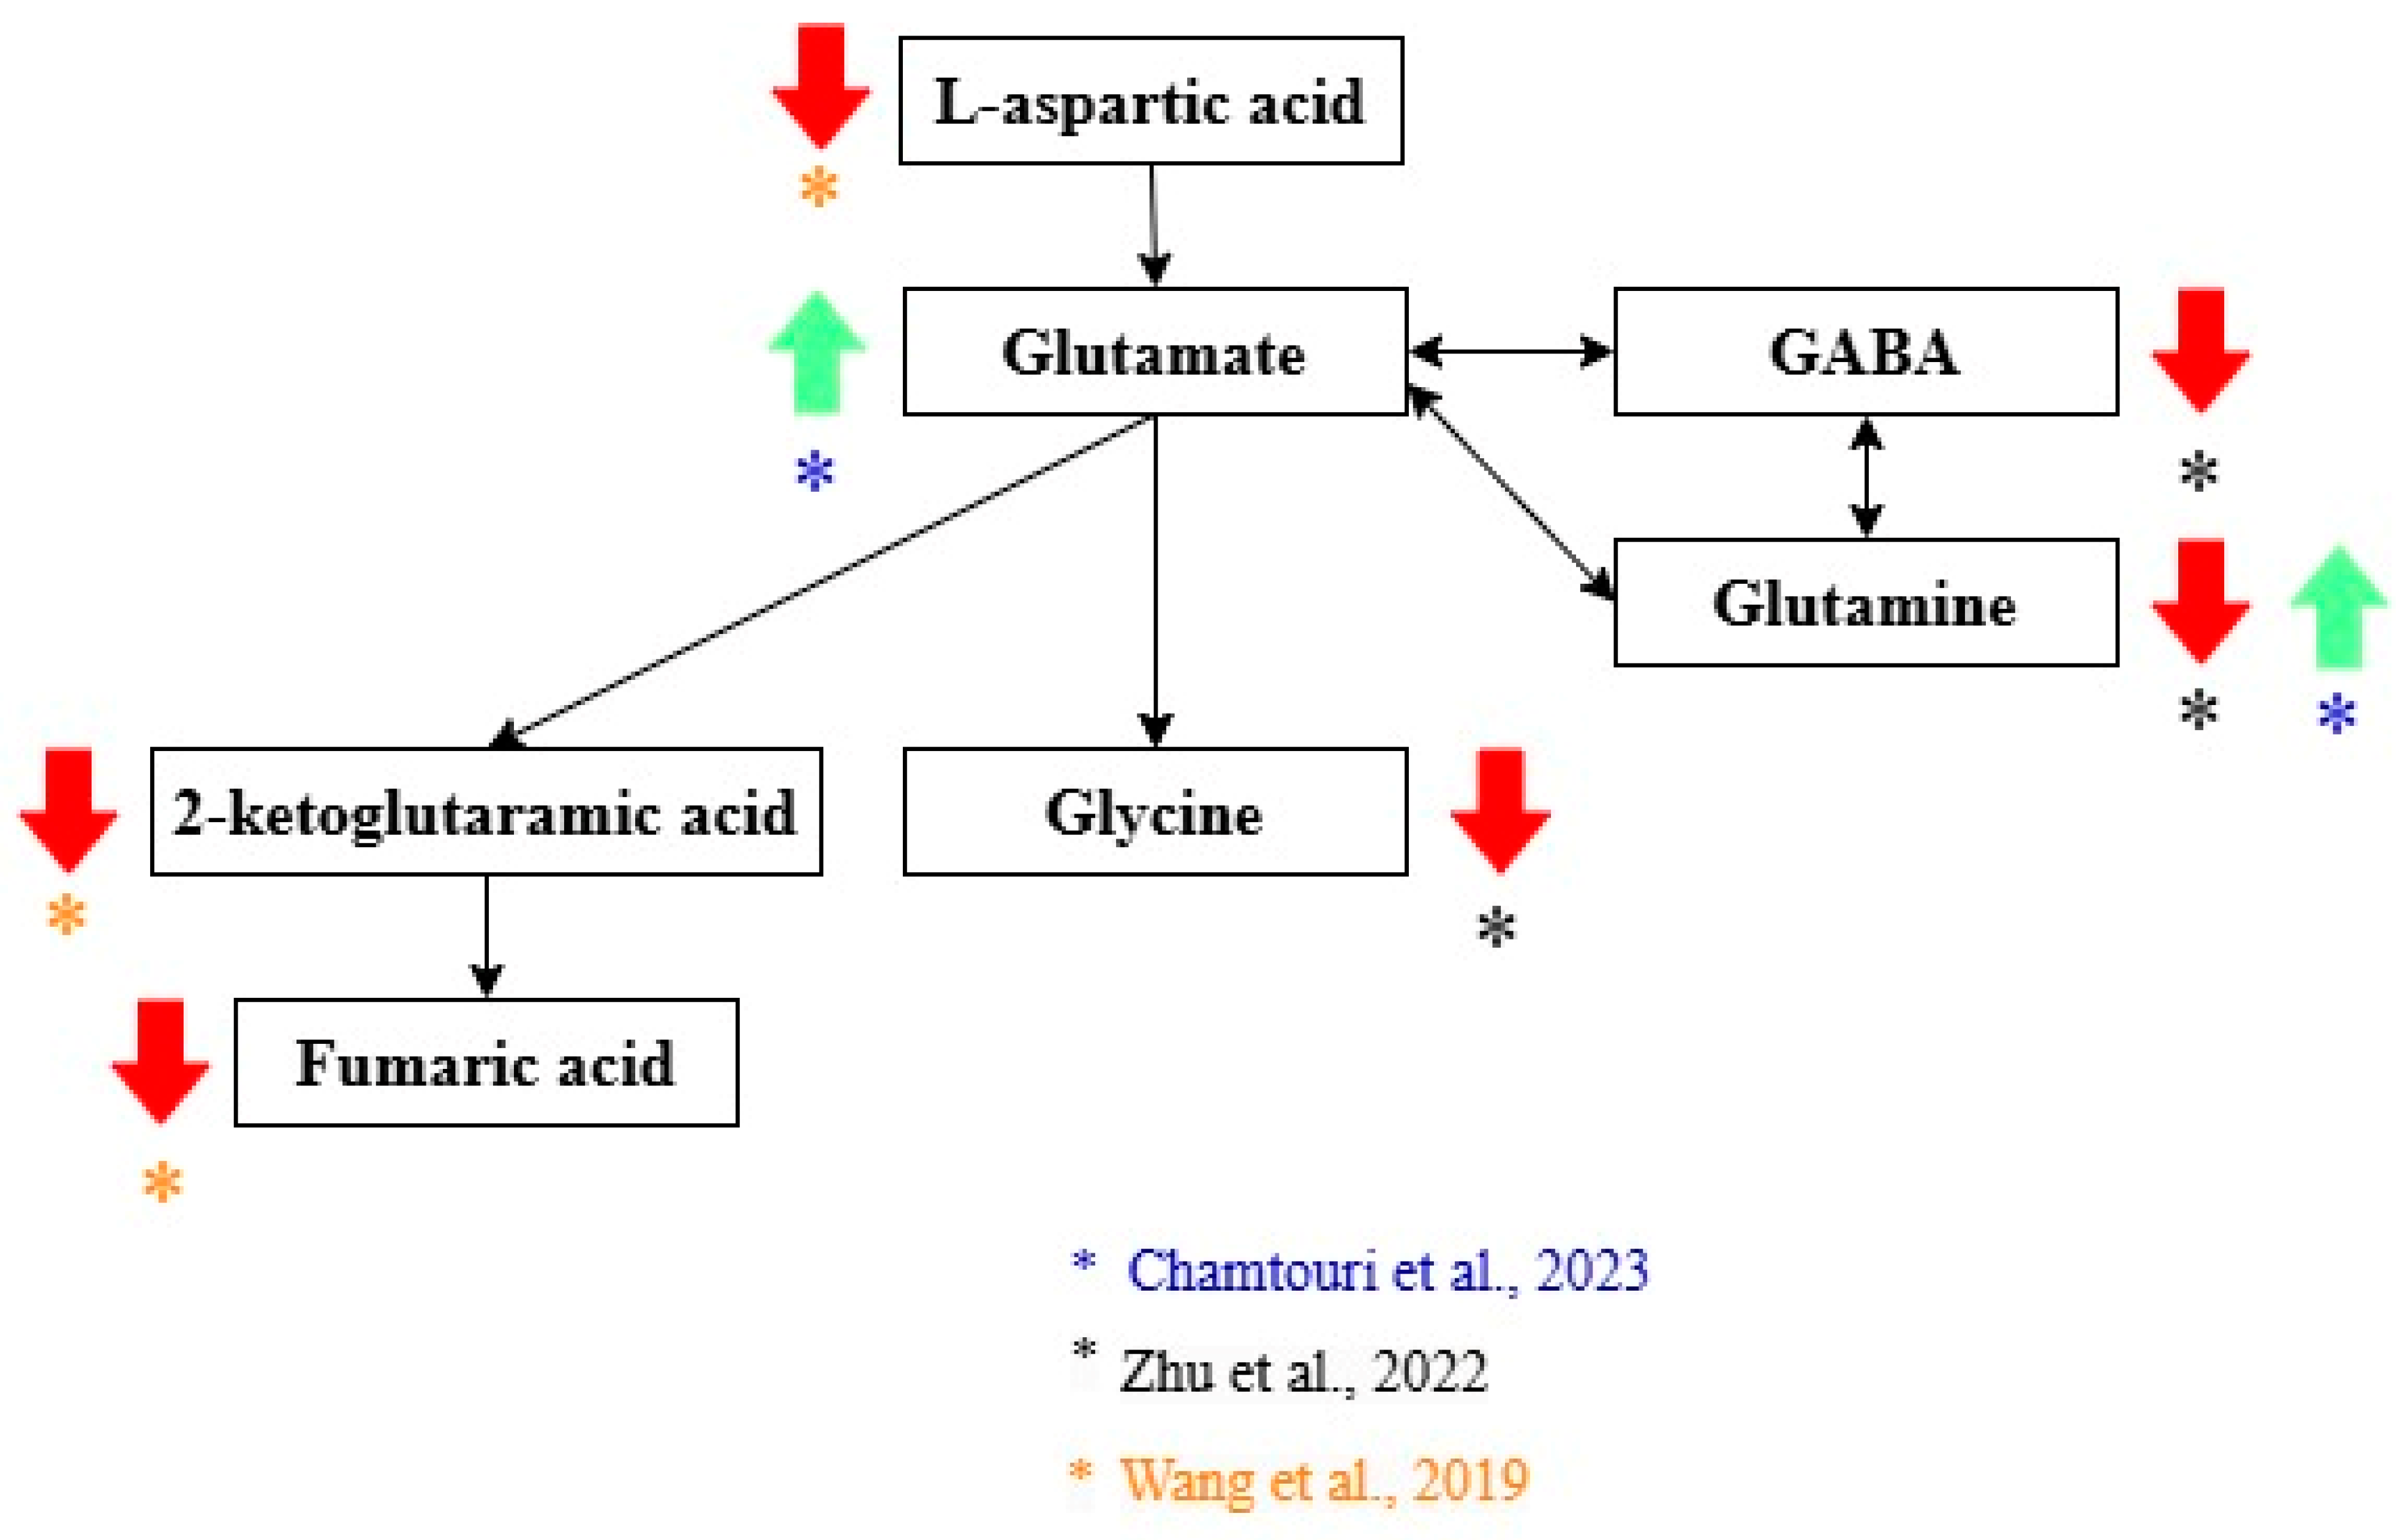
| Zhu et al. [21] | Higher in ASD: Xanthurenic acid, 5-hydroxy-N-formylkynurenine, 5-hydroxytryptophan (5-HTP), serotonin, N-feruloyl serotonin 4′-apo-beta-carotenal, b,e-carotene-3,3′-diol, retinal, homocysteine, and 8-hydroxy-deoxyguanosine. Higher in NA: 6-Hydroxymelatonin and 5-hydroxyindoleacetic acid, retinol levels, dihydrofolate (DHF), 5-methyltetrahydrofolate (5-MTHF), N-acetylcysteine (NAC), and S-aminoethyl-L-cysteine, thiamine pyrophosphate (TPP), riboflavin (vitamin B2), phosphopantothenic acid (vitamin B5 derivative), pyridoxamine (vitamin B6), vitamin C, agmatine, spermine, glutathione spermidine, glutamine, GABA, and glycine. |
| Wang et al. [22] | Higher in ASD: Taurocholic acid and chenodeoxycholic acid 3-sulfate. Higher in NA: 2-Keto-glutaramic Acid (validated as a potential biomarker), L-aspartic acid, fumaric acid, cortisol, epinephrine, benzaldehyde, and cinnamic acid. |
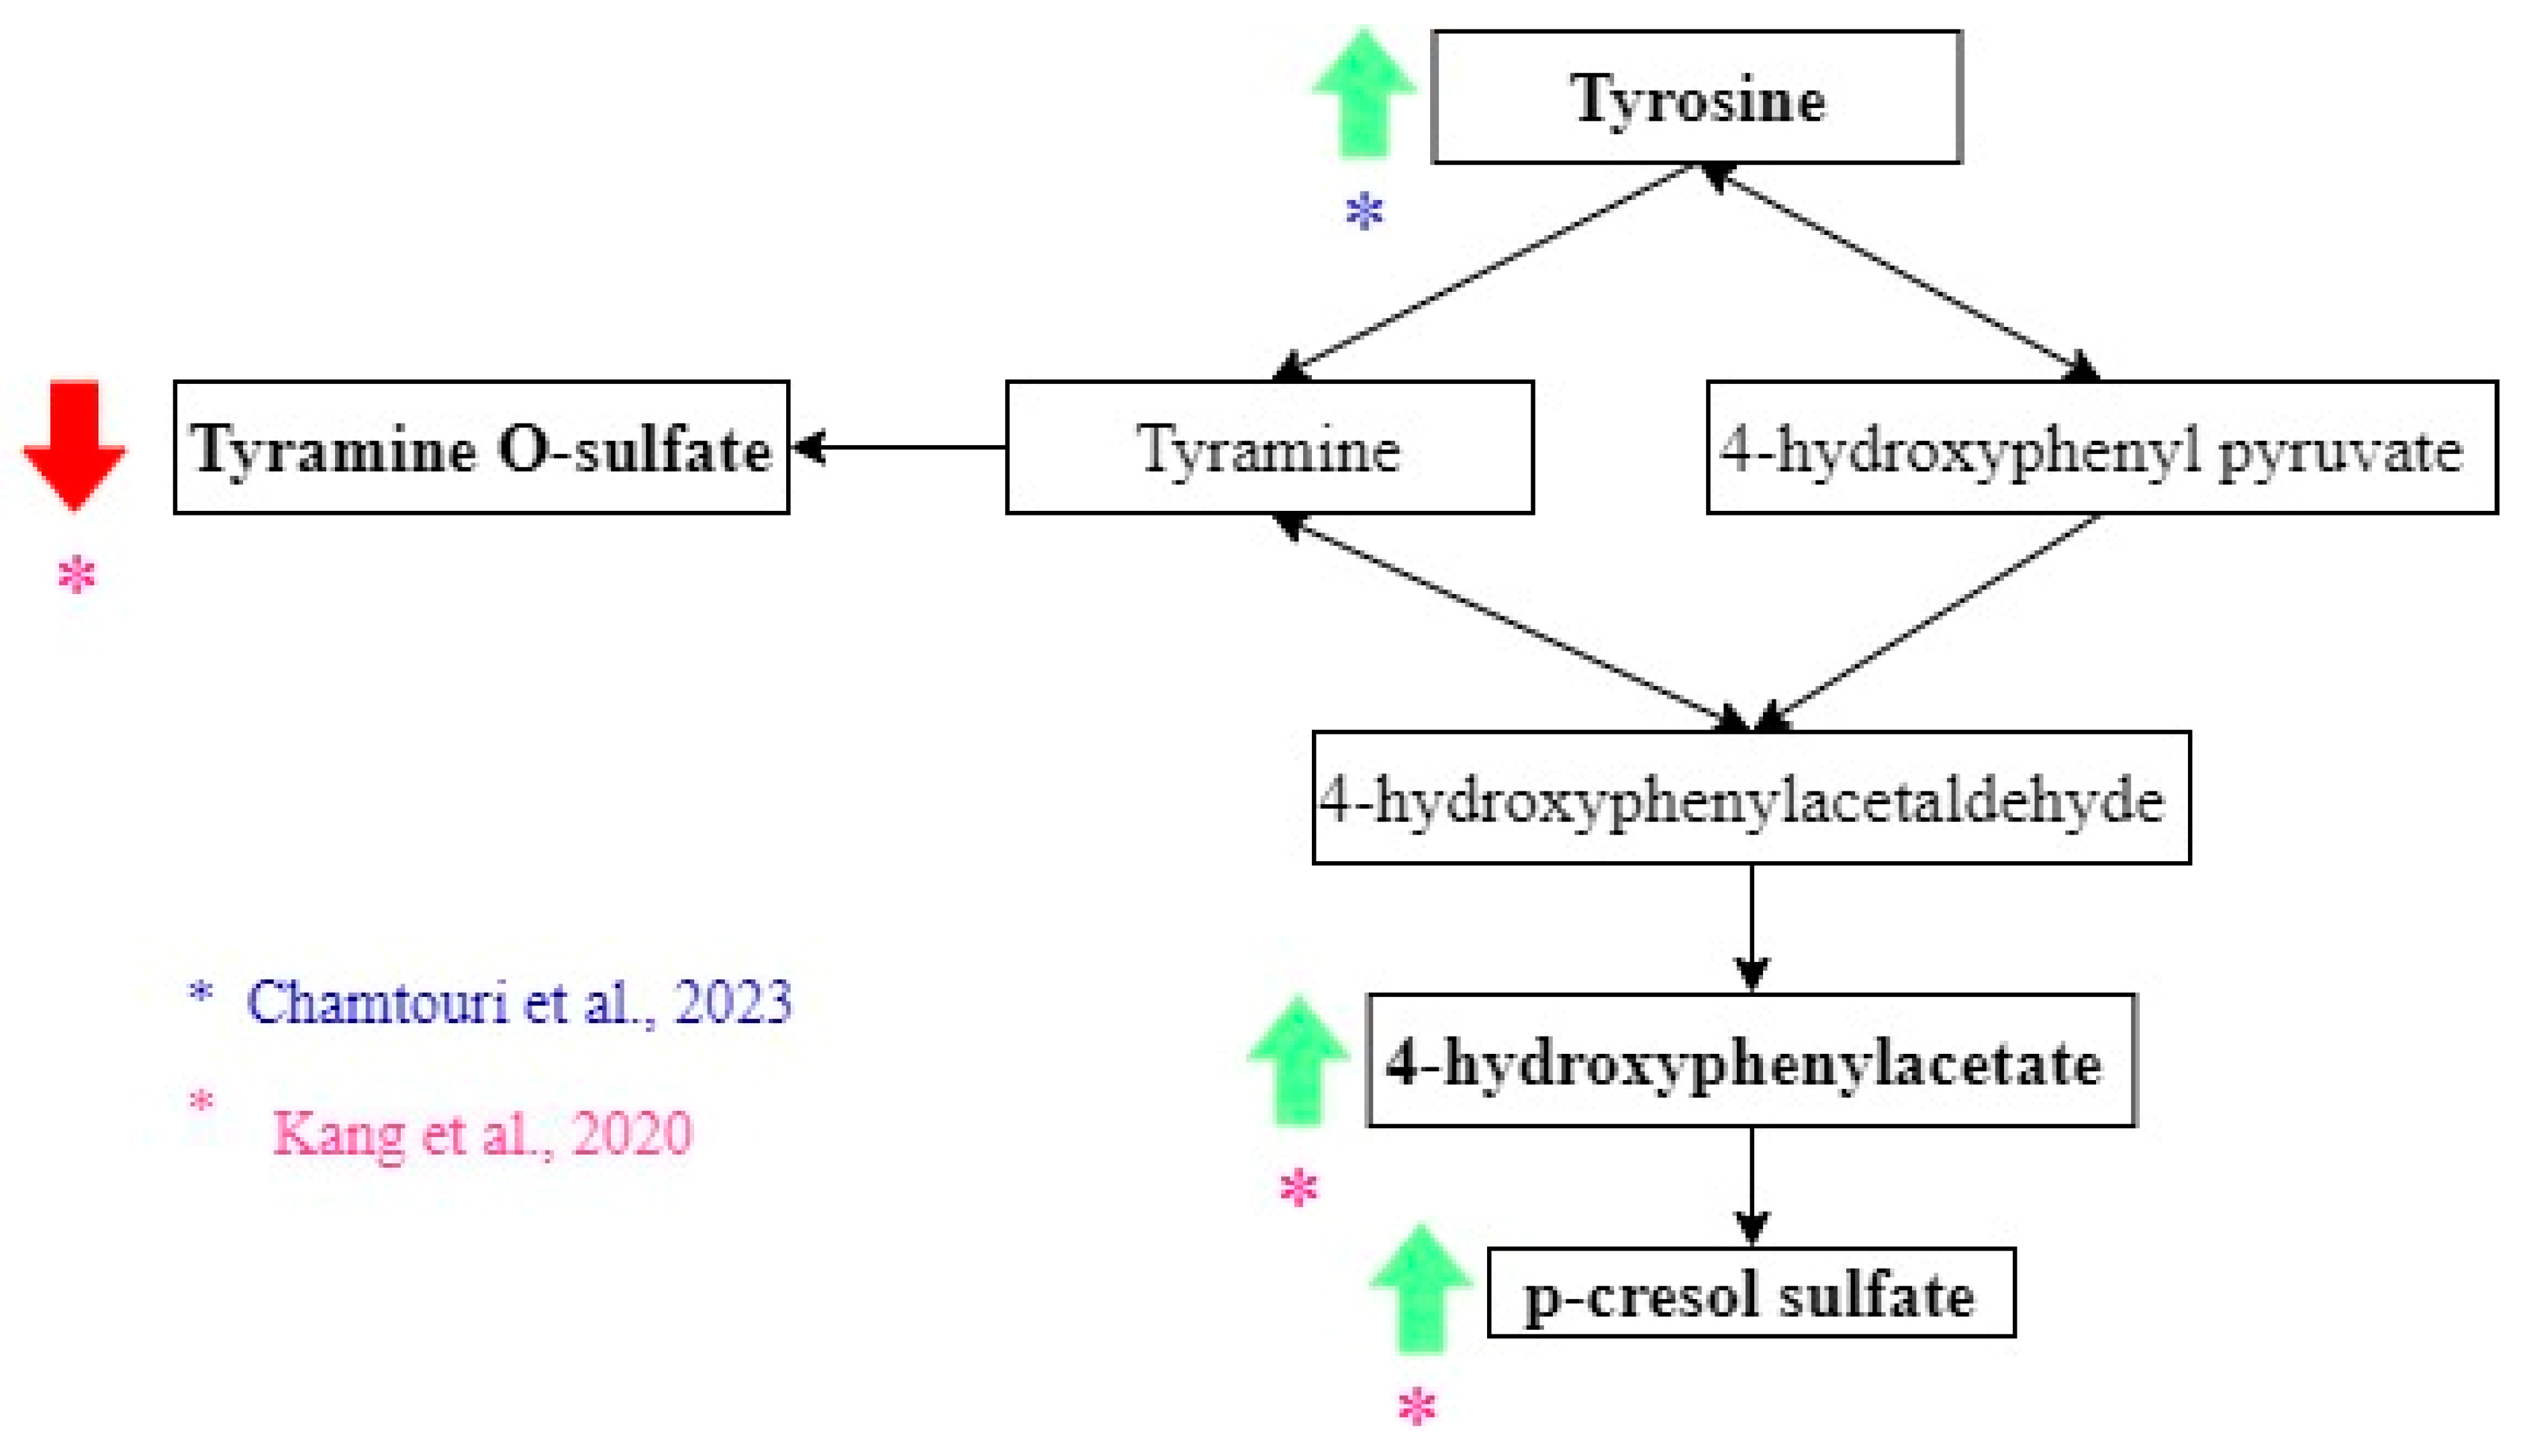
| Chamtouri et al. [23] | Higher in ASD: Total fecal amino acids, branched-chain amino acids (valine, leucine, isoleucine), aromatic amino acids (tyrosine, phenylalanine, tryptophan), aliphatic amino acids (alanine, glycine), glutamate, and glutamine were found in ASD children. |
| Kang et al. [25] | Higher in ASD: p-Cresol sulfate, 4-hydroxyphenylacetate, and indole. Higher in NA: Thyramine O-sulfate. However, these differences were not significant when the correction for multiple hypotheses was applied. |
| Jones et al. [29] | Higher in ASD: Acetic acid and total SCFAs (short-chain fatty acids). However non-significant differences. |
| Berding et al. [30] | Higher in ASD: Propionate, isobutyrate, valerate, and isovalerate. This was evaluated in children with two specific dietary patterns. DP1: characterized by vegetables, starchy vegetables, legumes, nuts and seeds, fruit, grains, juice and dairy. DP2: fried, protein and starchy foods, “kid’s meals”, condiments, and snacks. |
| Deng et al. [31] | Higher in ASD: Propionic acid, butyric acid, and valeric acid. |
| Qureshi et al. [32] | Higher in ASD + GI problems: Carnitine. Two groups of 5 metabolites OFM-A (imidazole propionate, hydroxyproline, theobromine, 2-hydroxy-3-methylvalerate, adenosine) and OFM-I (imidazole propionate, hydroxyproline, theobromine, 2-hydroxy-3-methylvalerate, Indole). Both OFM had 95% specificity and 94% sensitivity in distinguishing ASD + GI from neurotypicals. Multivariate statistical analysis showed that groups of metabolites are more useful to discriminate between groups. |
| Dan et al. [33] | Higher in ASD: Quinic acid, 3-dehydroquinate, Thr-Phe, desaminotyrosine, vanillactic acid, indole-3-carboxylic acid, hexanoic acid, 3-indoxyl-D-glucopyranoside, 2,5-dioxopentanoate, γ-glutamylglycine, phosphatidylcholine, D-4′-phosphopantothenate, pantothenic acid, 3-(uracil-1-yl)-L-alanine, 3-dehydrocarnitine, methylselenocysteine Se-oxide, deoxyinosine,1-methyladenosine, orotidine-5P, 2′-deoxyuridine. Higher in NA: Tyr-Leu, DL-P-hydroxyphenyl lactic acid, indoleacetaldehyde, imidazole-4-acetaldehyde, adenine, deoxyadenosine, 2′-deoxyguanosine. |
| Laghi et al. [34] | No metabolites associated with diagnosis |
3.4. Intestinal Metabolome and ASD Prognosis
3.5. Risk of Bias
4. Discussion
5. Conclusions
Supplementary Materials
Author Contributions
Funding
Institutional Review Board Statement
Informed Consent Statement
Data Availability Statement
Conflicts of Interest
Abbreviations
| ABC | Autism Behavior Checklist |
| ADI-R | Autism Diagnostic Interview-Revised |
| ADOS-2 | Autism Diagnostic Observation Schedule, Second Edition |
| ASD | Autism spectrum disorder |
| CARS | Childhood Autism Rating Scale |
| DSM-5 | Diagnostic and Statistical Manual of Mental Disorders, Fifth Edition |
| GABA | Gamma-aminobutyric acid |
| GC | Gas chromatography |
| GC-MS | Gas chromatography coupled with mass spectrometry |
| GI | Gastrointestinal |
| H-NMR | Proton nuclear magnetic resonance |
| LC–MS | Liquid chromatography-mass spectrometry |
| LC–MS/MS | Liquid chromatography-tandem mass spectrometry |
| MTT | Microbiota transfer therapy |
| NA | Non-autistic |
| OFM | Optimized fecal models |
| PRISMA | Preferred Reporting Items for Systematic Reviews and Meta-Analysis |
| ROBINS-I | Risk Of Bias In Non-Randomized Studies of Interventions |
| SCFA | Short-chain fatty acids. |
| UHPLC | Ultra-high performance liquid chromatography |
| UHPLC-MS/MS | Ultra-high performance liquid chromatography-tandem mass spectroscopy. |
| UHPLC-QE | Ultra-high performance liquid chromatography coupled with quadrupole electrospray ionization mass spectrometry |
References
- American Psychiatric Association. Diagnostic and Statistical Manual of Mental Disorders; American Psychiatric Association Publishing: Washington, DC, USA, 2022. [Google Scholar] [CrossRef]
- Li, Y.-A.; Chen, Z.-J.; Li, X.-D.; Gu, M.-H.; Xia, N.; Gong, C.; Zhou, Z.-W.; Yasin, G.; Xie, H.-Y.; Wei, X.-P.; et al. Epidemiology of Autism Spectrum Disorders: Global Burden of Disease 2019 and Bibliometric Analysis of Risk Factors. Front. Pediatr. 2022, 10, 972809. [Google Scholar] [CrossRef] [PubMed]
- Zeidan, J.; Fombonne, E.; Scorah, J.; Ibrahim, A.; Durkin, M.S.; Saxena, S.; Yusuf, A.; Shih, A.; Elsabbagh, M. Global Prevalence of Autism: A Systematic Review Update. Autism Res. 2022, 15, 778–790. [Google Scholar] [CrossRef]
- Needham, B.D.; Adame, M.D.; Serena, G.; Rose, D.R.; Preston, G.M.; Conrad, M.C.; Campbell, A.S.; Donabedian, D.H.; Fasano, A.; Ashwood, P.; et al. Plasma and Fecal Metabolite Profiles in Autism Spectrum Disorder. Biol. Psychiatry 2021, 89, 451–462. [Google Scholar] [CrossRef] [PubMed]
- Warren, Z.; McPheeters, M.L.; Sathe, N.; Foss-Feig, J.H.; Glasser, A.; Veenstra-VanderWeele, J. A Systematic Review of Early Intensive Intervention for Autism Spectrum Disorders. Pediatrics 2011, 127, e1303–e1311. [Google Scholar] [CrossRef]
- Shen, L.; Liu, X.; Zhang, H.; Lin, J.; Feng, C.; Iqbal, J. Biomarkers in Autism Spectrum Disorders: Current Progress. Clin. Chim. Acta 2020, 502, 41–54. [Google Scholar] [CrossRef] [PubMed]
- Bacon, E.C.; Moore, A.; Lee, Q.; Carter Barnes, C.; Courchesne, E.; Pierce, K. Identifying Prognostic Markers in Autism Spectrum Disorder Using Eye Tracking. Autism 2020, 24, 658–669. [Google Scholar] [CrossRef]
- Califf, R.M. Biomarker Definitions and Their Applications. Exp. Biol. Med. 2018, 243, 213–221. [Google Scholar] [CrossRef]
- Jensen, A.R.; Lane, A.L.; Werner, B.A.; McLees, S.E.; Fletcher, T.S.; Frye, R.E. Modern Biomarkers for Autism Spectrum Disorder: Future Directions. Mol. Diagn. Ther. 2022, 26, 483–495. [Google Scholar] [CrossRef]
- Frye, R.E.; Vassall, S.; Kaur, G.; Lewis, C.; Karim, M.; Rossignol, D. Emerging Biomarkers in Autism Spectrum Disorder: A Systematic Review. Ann. Transl. Med. 2019, 7, 792. [Google Scholar] [CrossRef]
- De Angelis, M.; Francavilla, R.; Piccolo, M.; De Giacomo, A.; Gobbetti, M. Autism Spectrum Disorders and Intestinal Microbiota. Gut Microbes 2015, 6, 207–213. [Google Scholar] [CrossRef]
- Morton, J.T.; Jin, D.-M.; Mills, R.H.; Shao, Y.; Rahman, G.; McDonald, D.; Zhu, Q.; Balaban, M.; Jiang, Y.; Cantrell, K.; et al. Multi-Level Analysis of the Gut–Brain Axis Shows Autism Spectrum Disorder-Associated Molecular and Microbial Profiles. Nat. Neurosci. 2023, 26, 1208–1217. [Google Scholar] [CrossRef] [PubMed]
- Gonçalves, C.L.; Doifode, T.; Rezende, V.L.; Costa, M.A.; Rhoads, J.M.; Soutullo, C.A. The Many Faces of Microbiota-Gut-Brain Axis in Autism Spectrum Disorder. Life Sci. 2024, 337, 122357. [Google Scholar] [CrossRef] [PubMed]
- De Sales-Millán, A.; Aguirre-Garrido, J.F.; González-Cervantes, R.M.; Velázquez-Aragón, J.A. Microbiome–Gut–Mucosal–Immune–Brain Axis and Autism Spectrum Disorder (ASD): A Novel Proposal of the Role of the Gut Microbiome in ASD Aetiology. Behav. Sci. 2023, 13, 548. [Google Scholar] [CrossRef]
- Zurita, M.F.; Cárdenas, P.A.; Sandoval, M.E.; Peña, M.C.; Fornasini, M.; Flores, N.; Monaco, M.H.; Berding, K.; Donovan, S.M.; Kuntz, T.; et al. Analysis of Gut Microbiome, Nutrition and Immune Status in Autism Spectrum Disorder: A Case-Control Study in Ecuador. Gut Microbes 2020, 11, 453–464. [Google Scholar] [CrossRef]
- Al-Ayadhi, L.; Zayed, N.; Bhat, R.S.; Moubayed, N.M.S.; Al-Muammar, M.N.; El-Ansary, A. The Use of Biomarkers Associated with Leaky Gut as a Diagnostic Tool for Early Intervention in Autism Spectrum Disorder: A Systematic Review. Gut Pathog. 2021, 13, 54. [Google Scholar] [CrossRef] [PubMed]
- Biomarkers on a roll. Nat. Biotechnol. 2010, 28, 431. [CrossRef]
- Bennett, M.R.; Devarajan, P. Characteristics of an Ideal Biomarker of Kidney Diseases. In Biomarkers of Kidney Disease; Elsevier: Amsterdam, The Netherlands, 2011; pp. 1–24. [Google Scholar] [CrossRef]
- van ’t Hof, M.; Tisseur, C.; van Berckelear-Onnes, I.; van Nieuwenhuyzen, A.; Daniels, A.M.; Deen, M.; Hoek, H.W.; Ester, W.A. Age at Autism Spectrum Disorder Diagnosis: A Systematic Review and Meta-Analysis from 2012 to 2019. Autism 2021, 25, 862–873. [Google Scholar] [CrossRef]
- Sterne, J.A.; Hernán, M.A.; Reeves, B.C.; Savović, J.; Berkman, N.D.; Viswanathan, M.; Henry, D.; Altman, D.G.; Ansari, M.T.; Boutron, I.; et al. ROBINS-I: A Tool for Assessing Risk of Bias in Non-Randomised Studies of Interventions. BMJ 2016, 355, i4919. [Google Scholar] [CrossRef]
- Zhu, J.; Hua, X.; Yang, T.; Guo, M.; Li, Q.; Xiao, L.; Li, L.; Chen, J.; Li, T. Alterations in Gut Vitamin and Amino Acid Metabolism Are Associated with Symptoms and Neurodevelopment in Children with Autism Spectrum Disorder. J. Autism Dev. Disord. 2022, 52, 3116–3128. [Google Scholar] [CrossRef]
- Wang, M.; Wan, J.; Rong, H.; He, F.; Wang, H.; Zhou, J.; Cai, C.; Wang, Y.; Xu, R.; Yin, Z.; et al. Alterations in Gut Glutamate Metabolism Associated with Changes in Gut Microbiota Composition in Children with Autism Spectrum Disorder. mSystems 2019, 4, e00321-18. [Google Scholar] [CrossRef]
- Chamtouri, M.; Merghni, A.; Salazar, N.; Redruello, B.; Gaddour, N.; Mastouri, M.; Arboleya, S.; de los Reyes-Gavilán, C.G. An Overview on Fecal Profiles of Amino Acids and Related Amino-Derived Compounds in Children with Autism Spectrum Disorder in Tunisia. Molecules 2023, 28, 3269. [Google Scholar] [CrossRef] [PubMed]
- Kanehisa Laboratories. Kyoto Encyclopedia of Genes and Genomes. Available online: https://www.genome.jp/kegg/ (accessed on 10 October 2024).
- Kang, D.-W.; Adams, J.B.; Vargason, T.; Santiago, M.; Hahn, J.; Krajmalnik-Brown, R. Distinct Fecal and Plasma Metabolites in Children with Autism Spectrum Disorders and Their Modulation after Microbiota Transfer Therapy. mSphere 2020, 5, 314–320. [Google Scholar] [CrossRef]
- Nývltová, E.; Šut’ák, R.; Žárský, V.; Harant, K.; Hrdý, I.; Tachezy, J. Lateral Gene Transfer of p-cresol- and Indole-producing Enzymes from Environmental Bacteria to Mastigamoeba balamuthi. Environ. Microbiol. 2017, 19, 1091–1102. [Google Scholar] [CrossRef]
- Rafehi, M.; Faltraco, F.; Matthaei, J.; Prukop, T.; Jensen, O.; Grytzmann, A.; Blome, F.G.; Berger, R.G.; Krings, U.; Vormfelde, S.V.; et al. Highly Variable Pharmacokinetics of Tyramine in Humans and Polymorphisms in OCT1, CYP2D6, and MAO-A. Front. Pharmacol. 2019, 10, 1297. [Google Scholar] [CrossRef]
- McAllister, M.I.; Boulho, C.; McMillan, L.; Gilpin, L.F.; Wiedbrauk, S.; Brennan, C.; Lennon, D. The Production of Tyramine via the Selective Hydrogenation of 4-Hydroxybenzyl Cyanide over a Carbon-Supported Palladium Catalyst. RSC Adv. 2018, 8, 29392–29399. [Google Scholar] [CrossRef]
- Jones, J.; Reinke, S.N.; Mousavi-Derazmahalleh, M.; Palmer, D.J.; Christophersen, C.T. Changes to the Gut Microbiome in Young Children Showing Early Behavioral Signs of Autism. Front. Microbiol. 2022, 13, 905901. [Google Scholar] [CrossRef] [PubMed]
- Berding, K.; Donovan, S.M. Dietary Patterns Impact Temporal Dynamics of Fecal Microbiota Composition in Children With Autism Spectrum Disorder. Front. Nutr. 2020, 6, 193. [Google Scholar] [CrossRef]
- Deng, W.; Wang, S.; Li, F.; Wang, F.; Xing, Y.P.; Li, Y.; Lv, Y.; Ke, H.; Li, Z.; Lv, P.J.; et al. Gastrointestinal Symptoms Have a Minor Impact on Autism Spectrum Disorder and Associations with Gut Microbiota and Short-Chain Fatty Acids. Front. Microbiol. 2022, 13, 1000419. [Google Scholar] [CrossRef] [PubMed]
- Qureshi, F.; Adams, J.; Hanagan, K.; Kang, D.W.; Krajmalnik-Brown, R.; Hahn, J. Multivariate Analysis of Fecal Metabolites from Children with Autism Spectrum Disorder and Gastrointestinal Symptoms before and after Microbiota Transfer Therapy. J. Pers. Med. 2020, 10, 152. [Google Scholar] [CrossRef]
- Dan, Z.; Mao, X.; Liu, Q.; Guo, M.; Zhuang, Y.; Liu, Z.; Chen, K.; Chen, J.; Xu, R.; Tang, J.; et al. Altered Gut Microbial Profile Is Associated with Abnormal Metabolism Activity of Autism Spectrum Disorder. Gut Microbes 2020, 11, 1246–1267. [Google Scholar] [CrossRef]
- Laghi, L.; Mastromarino, P.; Prosperi, M.; Morales, M.A.; Calderoni, S.; Santocchi, E.; Muratori, F.; Guiducci, L. Are Fecal Metabolome and Microbiota Profiles Correlated with Autism Severity? A Cross-Sectional Study on Asd Preschoolers. Metabolites 2021, 11, 654. [Google Scholar] [CrossRef]
- Joos, R.; Boucher, K.; Lavelle, A.; Arumugam, M.; Blaser, M.J.; Claesson, M.J.; Clarke, G.; Cotter, P.D.; De Sordi, L.; Dominguez-Bello, M.G.; et al. Examining the Healthy Human Microbiome Concept. Nat. Rev. Microbiol. 2024, 23, 192–205. [Google Scholar] [CrossRef]
- Hollestein, V.; Poelmans, G.; Forde, N.J.; Beckmann, C.F.; Ecker, C.; Mann, C.; Schäfer, T.; Moessnang, C.; Baumeister, S.; Banaschewski, T.; et al. Excitatory/Inhibitory Imbalance in Autism: The Role of Glutamate and GABA Gene-Sets in Symptoms and Cortical Brain Structure. Transl. Psychiatry 2023, 13, 18. [Google Scholar] [CrossRef]
- Tebartz van Elst, L.; Maier, S.; Fangmeier, T.; Endres, D.; Mueller, G.T.; Nickel, K.; Ebert, D.; Lange, T.; Hennig, J.; Biscaldi, M.; et al. Disturbed Cingulate Glutamate Metabolism in Adults with High-Functioning Autism Spectrum Disorder: Evidence in Support of the Excitatory/Inhibitory Imbalance Hypothesis. Mol. Psychiatry 2014, 19, 1314–1325. [Google Scholar] [CrossRef]
- Muller, C.L.; Anacker, A.M.J.; Veenstra-VanderWeele, J. The Serotonin System in Autism Spectrum Disorder: From Biomarker to Animal Models. Neuroscience 2016, 321, 24–41. [Google Scholar] [CrossRef]
- Ormstad, H.; Bryn, V.; Verkerk, R.; Skjeldal, O.H.; Halvorsen, B.; Saugstad, O.D.; Isaksen, J.; Maes, M. Serum Tryptophan, Tryptophan Catabolites and Brain-Derived Neurotrophic Factor in Subgroups of Youngsters with Autism Spectrum Disorders. CNS Neurol. Disord. Drug Targets 2018, 17, 626–639. [Google Scholar] [CrossRef]
- Mhanna, A.; Martini, N.; Hmaydoosh, G.; Hamwi, G.; Jarjanazi, M.; Zaifah, G.; Kazzazo, R.; Haji Mohamad, A.; Alshehabi, Z. The Correlation between Gut Microbiota and Both Neurotransmitters and Mental Disorders: A Narrative Review. Medicine 2024, 103, e37114. [Google Scholar] [CrossRef]
- Bilgiç, A.; Abuşoğlu, S.; Sadıç Çelikkol, Ç.; Oflaz, M.B.; Akça, Ö.F.; Sivrikaya, A.; Baysal, T.; Ünlü, A. Altered Kynurenine Pathway Metabolite Levels in Toddlers and Preschool Children with Autism Spectrum Disorder. Int. J. Neurosci. 2022, 132, 826–834. [Google Scholar] [CrossRef]
- Del Colle, A.; Israelyan, N.; Gross Margolis, K. Novel Aspects of Enteric Serotonergic Signaling in Health and Brain-Gut Disease. Am. J. Physiol. Gastrointest. Liver Physiol. 2020, 318, G130–G143. [Google Scholar] [CrossRef]
- Wu, Z.; Huang, S.; Zou, J.; Wang, Q.; Naveed, M.; Bao, H.; Wang, W.; Fukunaga, K.; Han, F. Autism Spectrum Disorder (ASD): Disturbance of the Melatonin System and Its Implications. Biomed. Pharmacother. 2020, 130, 110496. [Google Scholar] [CrossRef]
- Zheng, Y.; Prince, N.Z.; Peralta Marzal, L.N.; Ahmed, S.; Garssen, J.; Perez Pardo, P.; Kraneveld, A.D. The Autism Spectrum Disorder-Associated Bacterial Metabolite p-Cresol Derails the Neuroimmune Response of Microglial Cells Partially via Reduction of ADAM17 and ADAM10. Int. J. Mol. Sci. 2022, 23, 11013. [Google Scholar] [CrossRef] [PubMed]
- Pascucci, T.; Colamartino, M.; Fiori, E.; Sacco, R.; Coviello, A.; Ventura, R.; Puglisi-Allegra, S.; Turriziani, L.; Persico, A.M. P-Cresol Alters Brain Dopamine Metabolism and Exacerbates Autism-Like Behaviors in the BTBR Mouse. Brain Sci. 2020, 10, 233. [Google Scholar] [CrossRef]
- Liu, Z.; Wang, J.; Xu, Q.; Hong, Q.; Zhu, J.; Chi, X. Research Progress in Vitamin A and Autism Spectrum Disorder. Behav. Neurol. 2021, 2021, 1–10. [Google Scholar] [CrossRef] [PubMed]
- Lopatina, O.; Inzhutova, A.; Salmina, A.B.; Higashida, H. The Roles of Oxytocin and CD38 in Social or Parental Behaviors. Front. Neurosci. 2013, 6, 36441. [Google Scholar] [CrossRef]
- Lai, X.; Zhang, Q.; Zhu, J.; Yang, T.; Guo, M.; Li, Q.; Liu, H.; Wu, Q.-H.; Chen, J.; Li, T.-Y. A Weekly Vitamin A Supplementary Program Alleviates Social Impairment in Chinese Children with Autism Spectrum Disorders and Vitamin A Deficiency. Eur. J. Clin. Nutr. 2021, 75, 1118–1125. [Google Scholar] [CrossRef] [PubMed]
- Subramanian, V.S.; Nabokina, S.M.; Lin-Moshier, Y.; Marchant, J.S.; Said, H.M. Mitochondrial Uptake of Thiamin Pyrophosphate: Physiological and Cell Biological Aspects. PLoS ONE 2013, 8, e73503. [Google Scholar] [CrossRef]
- Rehman, T.; Shabbir, M.A.; Inam-Ur-Raheem, M.; Manzoor, M.F.; Ahmad, N.; Liu, Z.; Ahmad, M.H.; Siddeeg, A.; Abid, M.; Aadil, R.M. Cysteine and Homocysteine as Biomarker of Various Diseases. Food Sci. Nutr. 2020, 8, 4696–4707. [Google Scholar] [CrossRef]
- Fricker, R.A.; Green, E.L.; Jenkins, S.I.; Griffin, S.M. The Influence of Nicotinamide on Health and Disease in the Central Nervous System. Int. J. Tryptophan Res. 2018, 11, 117864691877665. [Google Scholar] [CrossRef]
- Silva, Y.P.; Bernardi, A.; Frozza, R.L. The Role of Short-Chain Fatty Acids From Gut Microbiota in Gut-Brain Communication. ront. Endocrinol. 2020, 11, 25. [Google Scholar] [CrossRef]
- Portincasa, P.; Bonfrate, L.; Vacca, M.; De Angelis, M.; Farella, I.; Lanza, E.; Khalil, M.; Wang, D.Q.-H.; Sperandio, M.; Di Ciaula, A. Gut Microbiota and Short Chain Fatty Acids: Implications in Glucose Homeostasis. Int. J. Mol. Sci. 2022, 23, 1105. [Google Scholar] [CrossRef]
- Fusco, W.; Lorenzo, M.B.; Cintoni, M.; Porcari, S.; Rinninella, E.; Kaitsas, F.; Lener, E.; Mele, M.C.; Gasbarrini, A.; Collado, M.C.; et al. Short-Chain Fatty-Acid-Producing Bacteria: Key Components of the Human Gut Microbiota. Nutrients 2023, 15, 2211. [Google Scholar] [CrossRef]
- Lange, O.; Proczko-Stepaniak, M.; Mika, A. Short-Chain Fatty Acids—A Product of the Microbiome and Its Participation in Two-Way Communication on the Microbiome-Host Mammal Line. Curr. Obes. Rep. 2023, 12, 108–126. [Google Scholar] [CrossRef] [PubMed]
- Lagod, P.P.; Naser, S.A. The Role of Short-Chain Fatty Acids and Altered Microbiota Composition in Autism Spectrum Disorder: A Comprehensive Literature Review. Int. J. Mol. Sci. 2023, 24, 17432. [Google Scholar] [CrossRef]
- Kang, D.-W.; Adams, J.B.; Gregory, A.C.; Borody, T.; Chittick, L.; Fasano, A.; Khoruts, A.; Geis, E.; Maldonado, J.; McDonough-Means, S.; et al. Microbiota Transfer Therapy Alters Gut Ecosystem and Improves Gastrointestinal and Autism Symptoms: An Open-Label Study. Microbiome 2017, 5, 10. [Google Scholar] [CrossRef]
- Wang, J.; Ma, B.; Wang, J.; Zhang, Z.; Chen, O. Global Prevalence of Autism Spectrum Disorder and Its Gastrointestinal Symptoms: A Systematic Review and Meta-Analysis. Front. Psychiatry 2022, 13, 963102. [Google Scholar] [CrossRef]
- Chauhan, A.; Chauhan, V. Oxidative Stress in Autism. Pathophysiology 2006, 13, 171–181. [Google Scholar] [CrossRef]
- Sharma, S.; Black, S.M. Carnitine Homeostasis, Mitochondrial Function and Cardiovascular Disease. Drug Discov. Today Dis. Mech. 2009, 6, e31–e39. [Google Scholar] [CrossRef]
- MacFabe, D.F. Enteric Short-Chain Fatty Acids: Microbial Messengers of Metabolism, Mitochondria, and Mind: Implications in Autism Spectrum Disorders. Microb. Ecol. Health Dis. 2015, 26, 28177. [Google Scholar] [CrossRef]
- Cojocaru, K.-A.; Luchian, I.; Goriuc, A.; Antoci, L.-M.; Ciobanu, C.-G.; Popescu, R.; Vlad, C.-E.; Blaj, M.; Foia, L.G. Mitochondrial Dysfunction, Oxidative Stress, and Therapeutic Strategies in Diabetes, Obesity, and Cardiovascular Disease. Antioxidants 2023, 12, 658. [Google Scholar] [CrossRef]
- Kadyan, S.; Park, G.; Wang, B.; Nagpal, R. Dietary Fiber Modulates Gut Microbiome and Metabolome in a Host Sex-Specific Manner in a Murine Model of Aging. Front. Mol. Biosci. 2023, 10, 1182643. [Google Scholar] [CrossRef]
- Di Minno, A.; Gelzo, M.; Caterino, M.; Costanzo, M.; Ruoppolo, M.; Castaldo, G. Challenges in Metabolomics-Based Tests, Biomarkers Revealed by Metabolomic Analysis, and the Promise of the Application of Metabolomics in Precision Medicine. Int. J. Mol. Sci. 2022, 23, 5213. [Google Scholar] [CrossRef] [PubMed]
- Ou, F.-S.; Michiels, S.; Shyr, Y.; Adjei, A.A.; Oberg, A.L. Biomarker Discovery and Validation: Statistical Considerations. J. Thorac. Oncol. 2021, 16, 537–545. [Google Scholar] [CrossRef]
- Hunter, D.J.; Losina, E.; Guermazi, A.; Burstein, D.; Lassere, M.N.; Kraus, V. A Pathway and Approach to Biomarker Validation and Qualification for Osteoarthritis Clinical Trials. Curr. Drug Targets 2010, 11, 536–545. [Google Scholar] [CrossRef]
| Database | Search Strategy |
|---|---|
| Medline | (“autism spectrum disorder” [MeSH Terms] OR autism spectrum disorder [Text Word] or ASD or neurodevelopmental disorders or asperger syndrome) and (intestinal metabolome or fecal metabolome or faecal metabolome or intestinal metabolites or fecal metabolites or faecal metabolites or colonic metabolome or colonic metabolites or colon metabolites or colon metabolites or colon metabolome or enteric metabolome or enteric metabolites or intestinal proteome or fecal proteome or faecal proteome or colonic proteome or colon proteome or enteric proteome or gut metabolome or gut proteome or gut metabolites) and (healthy children or neurotypical children or unaffected or typical or typically or control or controls) and (diagnosis or prognosis or severity) NOT (Review [Publication Type]) |
| Web of science | (autism spectrum disorder or ASD) and (intestinal metabolome or fecal metabolome or faecal metabolome or intestinal metabolites or fecal metabolites or faecal metabolites or colonic metabolome or colonic metabolites or colon metabolites or colon metabolites or colon metabolome or enteric metabolome or enteric metabolites or intestinal proteome or fecal proteome or faecal proteome or colonic proteome or colon proteome or enteric proteome) and (healthy children or neurotypical children or control or controls) and (diagnosis or prognosis) (“autism spectrum disorder” or ASD or “neurodevelopmental disorders” or “asperger syndrome”) and (“intestinal metabolome” or “fecal metabolome” or “faecal metabolome” or “intestinal metabolites” or “fecal metabolites” or “faecal metabolites” or “colonic metabolome” or “colonic metabolites” or “colon metabolites” or “colon metabolites” or “colon metabolome” or “enteric metabolome” or “enteric metabolites” or “intestinal proteome” or “fecal proteome” or “faecal proteome” or “colonic proteome” or “colon proteome” or “enteric proteome” or “gut metabolome” or “gut proteome” or “gut metabolites”) and (“healthy children” or “neurotypical children” or unaffected or typical or typically or control or controls) and (diagnosis or prognosis or severity) |
| Scopus | (“autism spectrum disorder” or ASD or “neurodevelopmental disorders” or “Asperger syndrome”) and (“intestinal metabolome” or “fecal metabolome” or “faecal metabolome” or “intestinal metabolites” or “fecal metabolites” or “faecal metabolites” or “colonic metabolome” or “colonic metabolites” or “colon metabolites” or “colon metabolites” or “colon metabolome” or “enteric metabolome” or “enteric metabolites” or “intestinal proteome” or “fecal proteome” or “faecal proteome” or “colonic proteome” or “colon proteome” or “enteric proteome” or “gut metabolome” or “gut metabolites” or “gut proteome”) and (“healthy children” or “neurotypical children” or typical or typically or control or controls) and (diagnosis or prognosis or severity) |
| Embase | (“Autism spectrum disorder” OR ASD OR “Asperger syndrome”) AND (“intestinal metabolome” OR “gut metabolome” OR “intestinal proteome” OR “gut proteome”) (“Autism spectrum disorder” OR ASD) AND intestinal metabolome) (“Autism spectrum disorder” OR ASD) AND gut metabolome |
| Author(s) | Association with Prognosis |
|---|---|
| Needham et al. [4] | Positive correlation with ADOS Severity Scale: cystine, glycerol 3-phosphate, choline phosphate, gamma-glutamyl isoleucine, gamma-glutamyl leucine, gamma-glutamyl-alpha lysine. |
| Zhu et al. [21] | Elevated levels of homocysteine were negatively correlated with adaptative behavior, fine motor, personal-social behavior, and development quotient scores. High homocysteine levels had a positive correlation with inappropriate speech. Serotonin and 5-hydroxy-N-formylkynurenine levels had a negative correlation with adaptative behavior, gross motor, fine motor, personal-social behavior, and development quotient scores. N-feruloyl serotonin levels were positively correlated with Gastrointestinal Severity Index scores and with autistic mannerism and sensory alterations. 8-Hydroxy-deoxyguanosine was negatively correlated with neurodevelopment categories (adaptative behavior, fine motor and development quotient score). Vitamin B6 was slightly negatively correlated with the Autism Behavior Checklist (ABC) and Childhood Autism Rating Scale (CARS) scores. Retinal had a positive correlation with social withdrawal and CARS score. 5-Hydroxyindoleacetic acid levels were positively correlated with social motivation and CARS. |
| Wang et al. [22] | No metabolites associated with prognosis. |
| Chamtouri et al. [23] | Lower levels of histidine were significantly associated with severe symptoms of autism determined by CARS. |
| Kang et al. [25] | In children with ASD, microbiota transfer therapy (MTT) lowered the p-cresol sulfate levels to a concentration similar to those of the neurotypical children. The difference was significant according to an unadjusted p-value. 2-Hydroxycinnamate, caproate, and N-acetylmuramate had a negative correlation with the daily stool record score (based in Bristol Stool Form scale). Caproate and 2,4-dihydroxyhydrocinnamate had a negative correlation with the Gastrointestinal Symptom Rating Scale. N-Acetylmuramate had a positive correlation with the Parental Global Impressions Revised. |
| Jones et al. [29] | The average total SCFA concentration and acetic acid were higher in children with ASD, and these concentrations were negatively correlated with the Mullens Scale of Early Learning (MSEL) scores. However, the results were not statistically significant. Butyric acid concentrations increased with stool looseness, suggesting its concentration might be influenced by gastrointestinal conditions. |
| Berding et al. [30] | No metabolites associated with prognosis. |
| Deng et al. [31] | The results show that butyric acid was moderately negatively correlated with the SRS (Social Responsiveness Scale) and moderately positively correlated with the CSHQ (Children Sleep Habits Questionnaire). |
| Qureshi et al. [32] | Metabolic profile changed with treatment and became more similar in the ASD and NA groups. The ASD + GI and neurotypical carnitine concentrations were less different after microbiota transfer therapy (MTT). The average difference in normalized metabolite levels between the ASD + GI and neurotypical groups decreased significantly after MTT. |
| Dan et al. [33] | Hexanoic acid, chloroneb, DL-2-aminooctanoic acid, 2,5-dioxopentanoate, and desaminotyrosine related with chronic constipation. |
| Laghi et al. [34] | N-methylhydantoin had a higher concentration in ASD children with higher ADOS-2 scores. Aspartate, isoleucine, leucine, phenylalanine, and tyrosine were higher in children with low ADOS-2 scores. Alanine, isoleucine, leucine, methionine, phenylalanine and tyrosine had lower concentration in ASD children with Gastrointestinal Severity Index score of 4 or more. Fucose, 1,3-dihydroxyacetone characterized the highest severity group. |
| Author(s) | How Large Was the Sample Size? | Were the Methods Sufficiently Described to Enable Them to Be Repeated? | Were Valid Methods Used to Determine ASD Diagnosis? | Are Sample Characteristics Clearly Described? | Are Complete Results Reported? | Were Potential Confounding Factors (Gender/Age/ASD Type or Severity) Accounted for? | Total Risk of Bias |
|---|---|---|---|---|---|---|---|
| Needham et al. [4] | 2 | 0 | 0 | 1 | 0 | 1 | 4 |
| Zhu et al. [21] | 1 | 0 | 1 | 0 | 0 | 1 | 3 |
| Wang et al. [22] | 1 | 1 | 1 | 0 | 0 | 1 | 4 |
| Chamtouri et al. [23] | 2 | 0 | 0 | 0 | 0 | 1 | 3 |
| Jones et al. [29] | 2 | 0 | 0 | 1 | 0 | 1 | 4 |
| Berding et al. [30] | 2 | 0 | 2 | 0 | 0 | 1 | 5 |
| Deng et al. [31] | 2 | 0 | 1 | 0 | 0 | 0 | 3 |
| Dan et al. [33] | 1 | 0 | 1 | 0 | 1 | 1 | 4 |
| Laghi et al. [34] | 2 | 0 | 0 | 0 | 0 | 2 | 4 |
| Author(s) | Bias Due to Confounding | Bias in Selection of Participants into the Study | Bias in Classification of Interventions | Bias Due to Deviations from Intended Interventions | Bias Due to Missing Data | Bias in Measurement of Outcomes | Bias in Selection of the Reported Results | Overall Bias |
|---|---|---|---|---|---|---|---|---|
| Kang et al. [25] | Serious. Favors experimental. | Low. Toward null. | Low. Toward null. | Low. Toward null. | Low. Toward null. | Low. Toward null. | Low. Unpredictable. | Low. Toward null. |
| Qureshi et al. [32] | Serious. Favors experimental. | Low. Toward null. | Low. Unpredictable | Low. Toward null. | Low. Toward null. | Low. Toward null. | Low. Toward null. | Low. Toward null. |
Disclaimer/Publisher’s Note: The statements, opinions and data contained in all publications are solely those of the individual author(s) and contributor(s) and not of MDPI and/or the editor(s). MDPI and/or the editor(s) disclaim responsibility for any injury to people or property resulting from any ideas, methods, instructions or products referred to in the content. |
© 2025 by the authors. Licensee MDPI, Basel, Switzerland. This article is an open access article distributed under the terms and conditions of the Creative Commons Attribution (CC BY) license (https://creativecommons.org/licenses/by/4.0/).
Share and Cite
Suárez-Jaramillo, A.; Cifuentes, S.G.; Baldeón, M.; Cárdenas, P. Intestinal Metabolome for Diagnosing and Prognosing Autism Spectrum Disorder in Children: A Systematic Review. Metabolites 2025, 15, 213. https://doi.org/10.3390/metabo15040213
Suárez-Jaramillo A, Cifuentes SG, Baldeón M, Cárdenas P. Intestinal Metabolome for Diagnosing and Prognosing Autism Spectrum Disorder in Children: A Systematic Review. Metabolites. 2025; 15(4):213. https://doi.org/10.3390/metabo15040213
Chicago/Turabian StyleSuárez-Jaramillo, Andrés, Sara G. Cifuentes, Manuel Baldeón, and Paúl Cárdenas. 2025. "Intestinal Metabolome for Diagnosing and Prognosing Autism Spectrum Disorder in Children: A Systematic Review" Metabolites 15, no. 4: 213. https://doi.org/10.3390/metabo15040213
APA StyleSuárez-Jaramillo, A., Cifuentes, S. G., Baldeón, M., & Cárdenas, P. (2025). Intestinal Metabolome for Diagnosing and Prognosing Autism Spectrum Disorder in Children: A Systematic Review. Metabolites, 15(4), 213. https://doi.org/10.3390/metabo15040213