Development of LC-MS/MS Database Based on 250 Potentially Highly Neuroactive Compounds and Their Metabolites
Abstract
1. Introduction
2. Materials and Methods
2.1. Chemicals, Reagents, and Standards
2.2. S9 Sample Preparation
2.3. Mass Spectrometry Analysis
2.4. Non-Targeted Metabolite Analysis
2.5. Targeted Metabolite Analysis
3. Results
3.1. S9 Method Validation
3.2. Parent Compound Detection
3.3. Non-Targeted Metabolite Annotation
3.4. Targeted Metabolite Annotation
4. Discussion
5. Conclusions
Supplementary Materials
Author Contributions
Funding
Institutional Review Board Statement
Informed Consent Statement
Data Availability Statement
Conflicts of Interest
Abbreviations
| ENRICH | Environmental Neuroactive Chemicals |
| NTA | Non-targeted analysis |
| NADPH | Tetrasodium salt |
| PRM | Parallel-reaction monitoring |
| AGC | Automatic gain control |
| MIT | Maximum injection time |
| DTT | DL-dithiothreitol |
| m/z | Mass-to-charge |
References
- Wild, C.P. Complementing the genome with an ‘exposome’: The outstanding challenge of environmental exposure measurement in molecular epidemiology. Cancer Epidemiol. Biomark. Prev. 2005, 14, 1847–1850. [Google Scholar] [CrossRef]
- Wild, C.P. The exposome: From concept to utility. Int. J. Epidemiol. 2012, 41, 24–32. [Google Scholar] [CrossRef]
- Siroux, V.; Agier, L.; Slama, R. The exposome concept: A challenge and a potential driver for environmental health research. Eur. Respir. Rev. 2016, 25, 124–129. [Google Scholar] [CrossRef]
- Samanipour, S.; Barron, L.P.; van Herwerden, D.; Praetorius, A.; Thomas, K.V.; O’Brien, J.W. Exploring the Chemical Space of the Exposome: How Far Have We Gone? JACS Au 2024, 4, 2412–2425. [Google Scholar] [CrossRef]
- Veasey, S.C. Advancing the Neural Exposome. In Environmental Neuroscience; Springer Nature: Cham, Switzerland, 2024; pp. 87–101. [Google Scholar] [CrossRef]
- Rager, J.E.; Koval, L.E.; Hickman, E.; Ring, C.; Teitelbaum, T.; Cohen, T.; Fragola, G.; Zylka, M.J.; Engel, L.S.; Lu, K.; et al. The environmental neuroactive chemicals list of prioritized substances for human biomonitoring and neurotoxicity testing: A database and high-throughput toxicokinetics approach. Environ. Res. 2025, 266, 120537. [Google Scholar] [CrossRef]
- de Leeuw, F.A.; Peeters, C.F.W.; Kester, M.I.; Harms, A.C.; Struys, E.A.; Hankemeier, T.; van Vlijmen, H.W.T.; van der Lee, S.J.; van Duijn, C.M.; Scheltens, P.; et al. Blood-based metabolic signatures in Alzheimer’s disease. Alzheimer’s Dement. Diagn. Assess. Dis. Monit. 2017, 8, 196–207. [Google Scholar] [CrossRef]
- Donatti, A.; Canto, A.M.; Godoi, A.B.; da Rosa, D.C.; Lopes-Cendes, I. Circulating metabolites as potential biomarkers for neurological disorders—Metabolites in neurological disorders. Metabolites 2020, 10, 389. [Google Scholar] [CrossRef]
- An, M.; Gao, Y. Urinary Biomarkers of Brain Diseases. Genom. Proteom. Bioinform. 2015, 13, 345–354. [Google Scholar] [CrossRef]
- Rozen, S.; Cudkowicz, M.E.; Bogdanov, M.; Matson, W.R.; Kristal, B.S.; Beecher, C.; Harrison, S.; Vouros, P.; Flarakos, J.; Vigneau-Callahan, K.; et al. Metabolomic analysis and signatures in motor neuron disease. Metabolomics 2005, 1, 101–108. [Google Scholar] [CrossRef]
- Flasch, M.; Fitz, V.; Rampler, E.; Ezekiel, C.N.; Koellensperger, G.; Warth, B. Integrated Exposomics/Metabolomics for Rapid Exposure and Effect Analyses. JACS Au 2022, 2, 2548–2560. [Google Scholar] [CrossRef]
- Sévin, D.C.; Kuehne, A.; Zamboni, N.; Sauer, U. Biological insights through nontargeted metabolomics. Curr. Opin. Biotechnol. 2015, 34, 1–8. [Google Scholar] [CrossRef]
- Sindelar, M.; Patti, G.J. Chemical Discovery in the Era of Metabolomics. J. Am. Chem. Soc. 2020, 142, 9097–9105. [Google Scholar] [CrossRef] [PubMed]
- Peng, B.; Zhao, H.; Huang, Y.; Fang, M.; Wang, X.; Shen, T.; Wang, G.; Hong, X.; Xie, J.; Tao, L.; et al. Gut microbial metabolite p-cresol alters biotransformation of bisphenol A: Enzyme competition or gene induction? J. Hazard Mater. 2022, 426, 128093. [Google Scholar] [CrossRef] [PubMed]
- Liu, M.; Jiang, J.; Zheng, J.; Huan, T.; Gao, B.; Fei, X.; Wang, Y.; Fang, M. RTP: One Effective Platform to Probe Reactive Compound Transformation Products and Its Applications for a Reactive Plasticizer BADGE. Env. Sci. Technol. 2021, 55, 16034–16043. [Google Scholar] [CrossRef]
- Fang, M.; Webster, T.F.; Ferguson, P.L.; Stapleton, H.M. Characterizing the Peroxisome Proliferator-Activated Receptor (PPAR γ ) Ligand Binding Potential of Several Major Flame Retardants, Their Metabolites, and Chemical Mixtures in House Dust. Env. Health Perspect. 2015, 123, 166–172. [Google Scholar] [CrossRef]
- Chen, P.-J.; Moore, T.; Nesnow, S. Cytotoxic effects of propiconazole and its metabolites in mouse and human hepatoma cells and primary mouse hepatocytes. Toxicol. Vitr. 2008, 22, 1476–1483. [Google Scholar] [CrossRef]
- Jain, A.; Li, X.H.; Chen, W.N. An untargeted fecal and urine metabolomics analysis of the interplay between the gut microbiome, diet and human metabolism in Indian and Chinese adults. Sci. Rep. 2019, 9, 9191. [Google Scholar] [CrossRef]
- Najdekr, L.; Blanco, G.R.; Dunn, W.B. Collection of untargeted metabolomic data for mammalian urine applying HILIC and reversed phase ultra performance liquid chromatography methods coupled to a Q exactive mass spectrometer. In Methods in Molecular Biology; Humana Press Inc.: Totowa, NJ, USA, 2019; Volume 1996, pp. 1–15. [Google Scholar] [CrossRef]
- Tsugawa, H.; Cajka, T.; Kind, T.; Ma, Y.; Higgins, B.; Ikeda, K.; Kanazawa, M.; VanderGheynst, J.; Fiehn, O.; Arita, M. MS-DIAL. Data-independent MS/MS deconvolution for comprehensive metabolome analysis. Nat. Methods 2015, 12, 523–526. [Google Scholar] [CrossRef]
- Zhao, H.; Hsiao, Y.-C.; Liu, C.-W.; Feng, J.; Wang, X.; Peng, J.; Teitelbaum, T.; Lu, K. Reaction-guided metabolomics accelerates high-throughput characterization of the xenobiotic metabolites for human exposome. ChemRxiv 2025. [Google Scholar] [CrossRef]
- Schollée, J.E. MSMSsim: Functions for Processing HRMS2 Spectra from Output from RMassBank, Mainly for Calculating Spectral Similarity; GitHub: San Francisco, CA, USA, 2017. [Google Scholar]
- Li, Y.; Kind, T.; Folz, J.; Vaniya, A.; Mehta, S.S.; Fiehn, O. Spectral entropy outperforms MS/MS dot product similarity for small-molecule compound identification. Nat. Methods 2021, 18, 1524–1531. [Google Scholar] [CrossRef]
- Stein, S.E.; Scott, D.R. Optimization and testing of mass spectral library search algorithms for compound identification. J. Am. Soc. Mass. Spectrom. 1994, 5, 859–866. [Google Scholar] [CrossRef]
- Wishart, D.S.; Tian, S.; Allen, D.; Oler, E.; Peters, H.; Lui, V.W.; Gautam, V.; Djoumbou-Feunang, Y.; Greiner, R.; Metz, T.O. BioTransformer 3.0—A web server for accurately predicting metabolic transformation products. Nucleic Acids Res. 2022, 50, W115–W123. [Google Scholar] [CrossRef]
- Raspotnig, G.; Rohlfs, M. A matter of confidence: Requirements and standards for compound identification in Chemoecology. Chemoecology 2023, 33, 145–146. [Google Scholar] [CrossRef]
- Sumner, L.W.; Amberg, A.; Barrett, D.; Beale, M.H.; Beger, R.; Daykin, C.A.; Fan, T.W.-M.; Fiehn, O.; Goodacre, R.; Griffin, J.L.; et al. Proposed minimum reporting standards for chemical analysis. Metabolomics 2007, 3, 211–221. [Google Scholar] [CrossRef] [PubMed]
- Schymanski, E.L.; Jeon, J.; Gulde, R.; Fenner, K.; Ruff, M.; Singer, H.P.; Hollender, J. Identifying Small Molecules via High Resolution Mass Spectrometry: Communicating Confidence. Env. Sci. Technol. 2014, 48, 2097–2098. [Google Scholar] [CrossRef] [PubMed]
- Reisdorph, N.A.; Walmsley, S.; Reisdorph, R. A Perspective and Framework for Developing Sample Type Specific Databases for LC/MS-Based Clinical Metabolomics. Metabolites 2019, 10, 8. [Google Scholar] [CrossRef] [PubMed]
- Neumann, S.; Böcker, S. Computational mass spectrometry for metabolomics: Identification of metabolites and small molecules. Anal. Bioanal. Chem. 2010, 398, 2779–2788. [Google Scholar] [CrossRef]
- Ridder, L.; van der Hooft, J.J.J.; Verhoeven, S. Automatic Compound Annotation from Mass Spectrometry Data Using MAGMa. Mass. Spectrom. 2014, 3, S0033. [Google Scholar] [CrossRef]
- Uppal, K.; Walker, D.I.; Liu, K.; Li, S.; Go, Y.M.; Jones, D.P. Computational Metabolomics: A Framework for the Million Metabolome. Chem. Res. Toxicol. 2016, 29, 1956–1975. [Google Scholar] [CrossRef]
- Schymanski, E.; Neumann, S. The Critical Assessment of Small Molecule Identification (CASMI): Challenges and Solutions. Metabolites 2013, 3, 517–538. [Google Scholar] [CrossRef]
- Oberacher, H.; Pavlic, M.; Libiseller, K.; Schubert, B.; Sulyok, M.; Schuhmacher, R.; Csaszar, E.; Köfeler, H.C. On the inter-instrument and the inter-laboratory transferability of a tandem mass spectral reference library: 2. Optimization and characterization of the search algorithm. J. Mass. Spectrom. 2009, 44, 494–502. [Google Scholar] [CrossRef]
- Pan, S.; Li, D.; Zhao, L.; Schenkman, J.B.; Rusling, J.F. Genotoxicity-Related Chemistry of Human Metabolites of Benzo[ghi]perylene (B[ghi]P) Investigated using Electro-Optical Arrays and DNA/Microsome Biocolloid Reactors with LC-MS/MS. Chem. Res. Toxicol. 2013, 26, 1229–1239. [Google Scholar] [CrossRef]
- Moos, R.K.; Angerer, J.; Dierkes, G.; Brüning, T.; Koch, H.M. Metabolism and elimination of methyl, iso- and n-butyl paraben in human urine after single oral dosage. Arch. Toxicol. 2016, 90, 2699–2709. [Google Scholar] [CrossRef]
- Nakagawa, Y. Metabolism and toxicity of benzophenone in isolated rat hepatocytes and estrogenic activity of its metabolites in MCF-7 cells. Toxicology 2000, 156, 27–36. [Google Scholar] [CrossRef] [PubMed]
- Hsiao, Y.C.; Liu, C.W.; Robinette, C.; Knight, N.; Lu, K.; Rebuli, M.E. Development of LC-HRMS untargeted analysis methods for nasal epithelial lining fluid exposomics. J. Expo. Sci. Env. Epidemiol. 2022, 32, 847–854. [Google Scholar] [CrossRef] [PubMed]
- Hsiao, Y.-C.; Matulewicz, R.S.; Sherman, S.E.; Jaspers, I.; Weitzman, M.L.; Gordon, T.; Liu, C.-W.; Yang, Y.; Lu, K.; Bjurlin, M.A. Untargeted Metabolomics to Characterize the Urinary Chemical Landscape of E-Cigarette Users. Chem. Res. Toxicol. 2023, 36, 630–642. [Google Scholar] [CrossRef] [PubMed]
- Thistle, J.E.; Liu, C.-W.; Rager, J.E.; Singer, A.B.; Chen, D.; Manley, C.K.; Piven, J.; Gilmore, J.H.; Keil, A.P.; Starling, A.P.; et al. Urinary metabolite concentrations of phthalate and plasticizers in infancy and childhood in the UNC baby connectome project. Environ. Res. 2024, 259, 119467. [Google Scholar] [CrossRef]
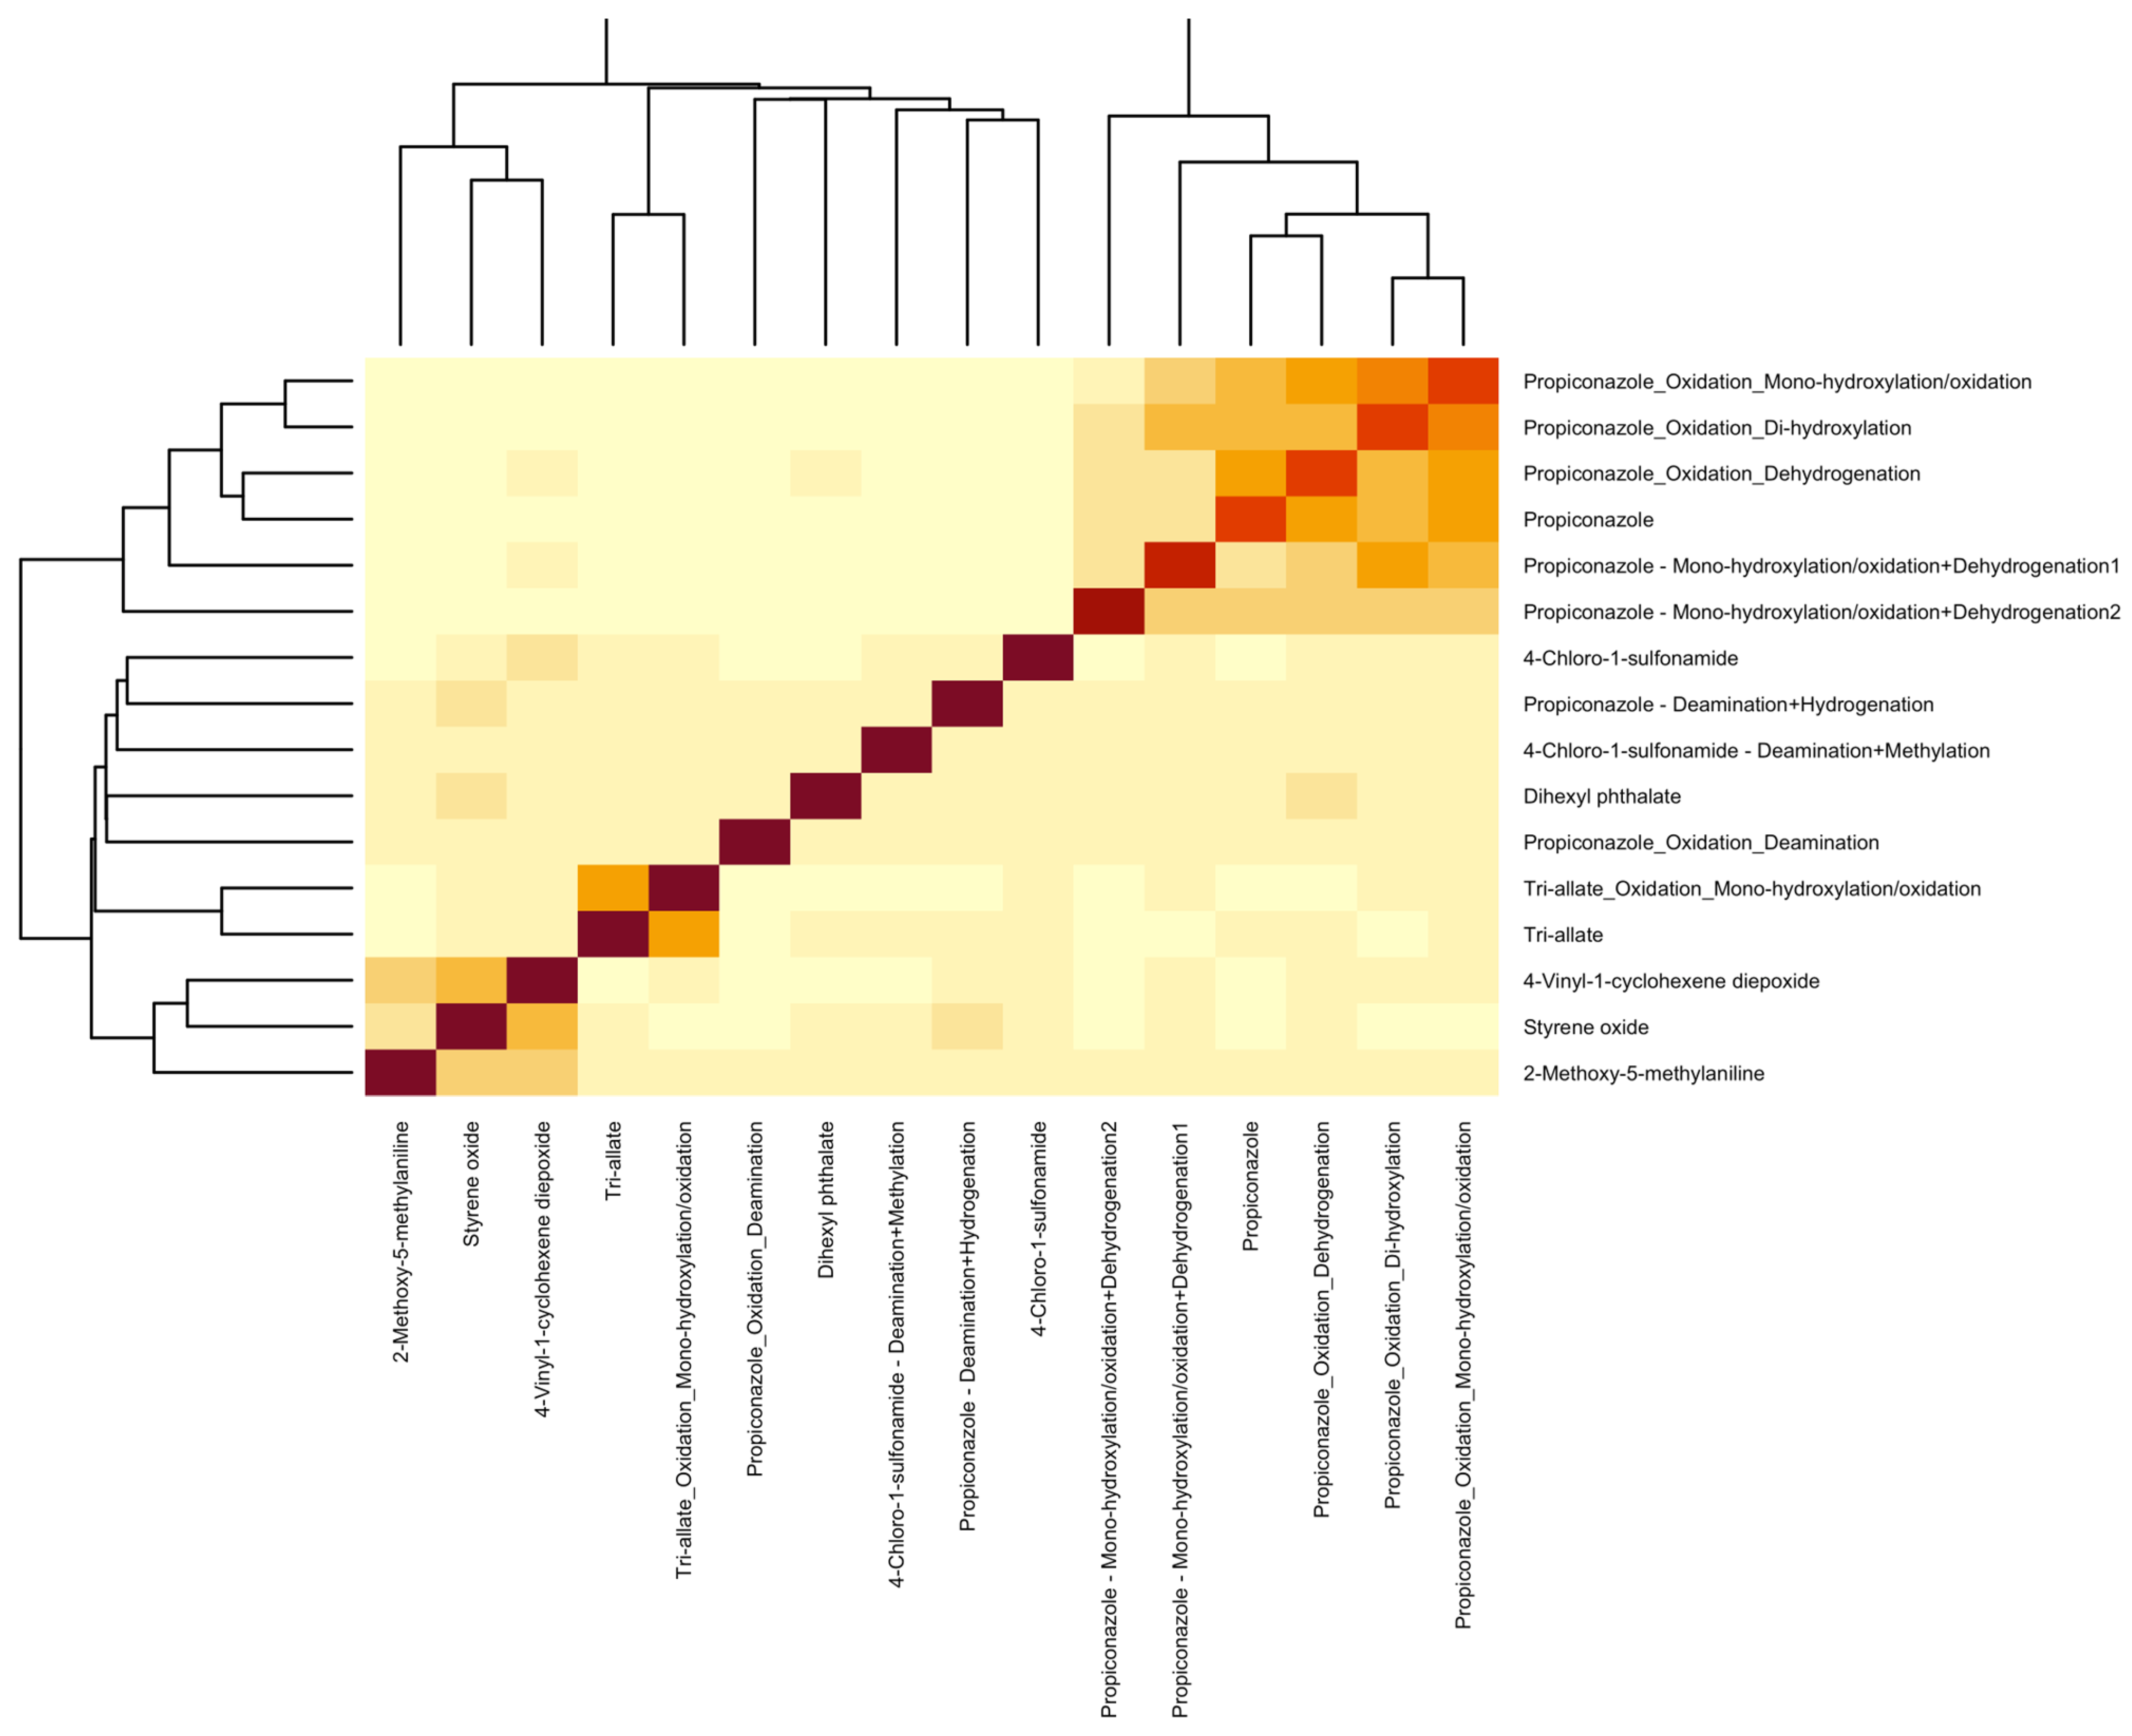
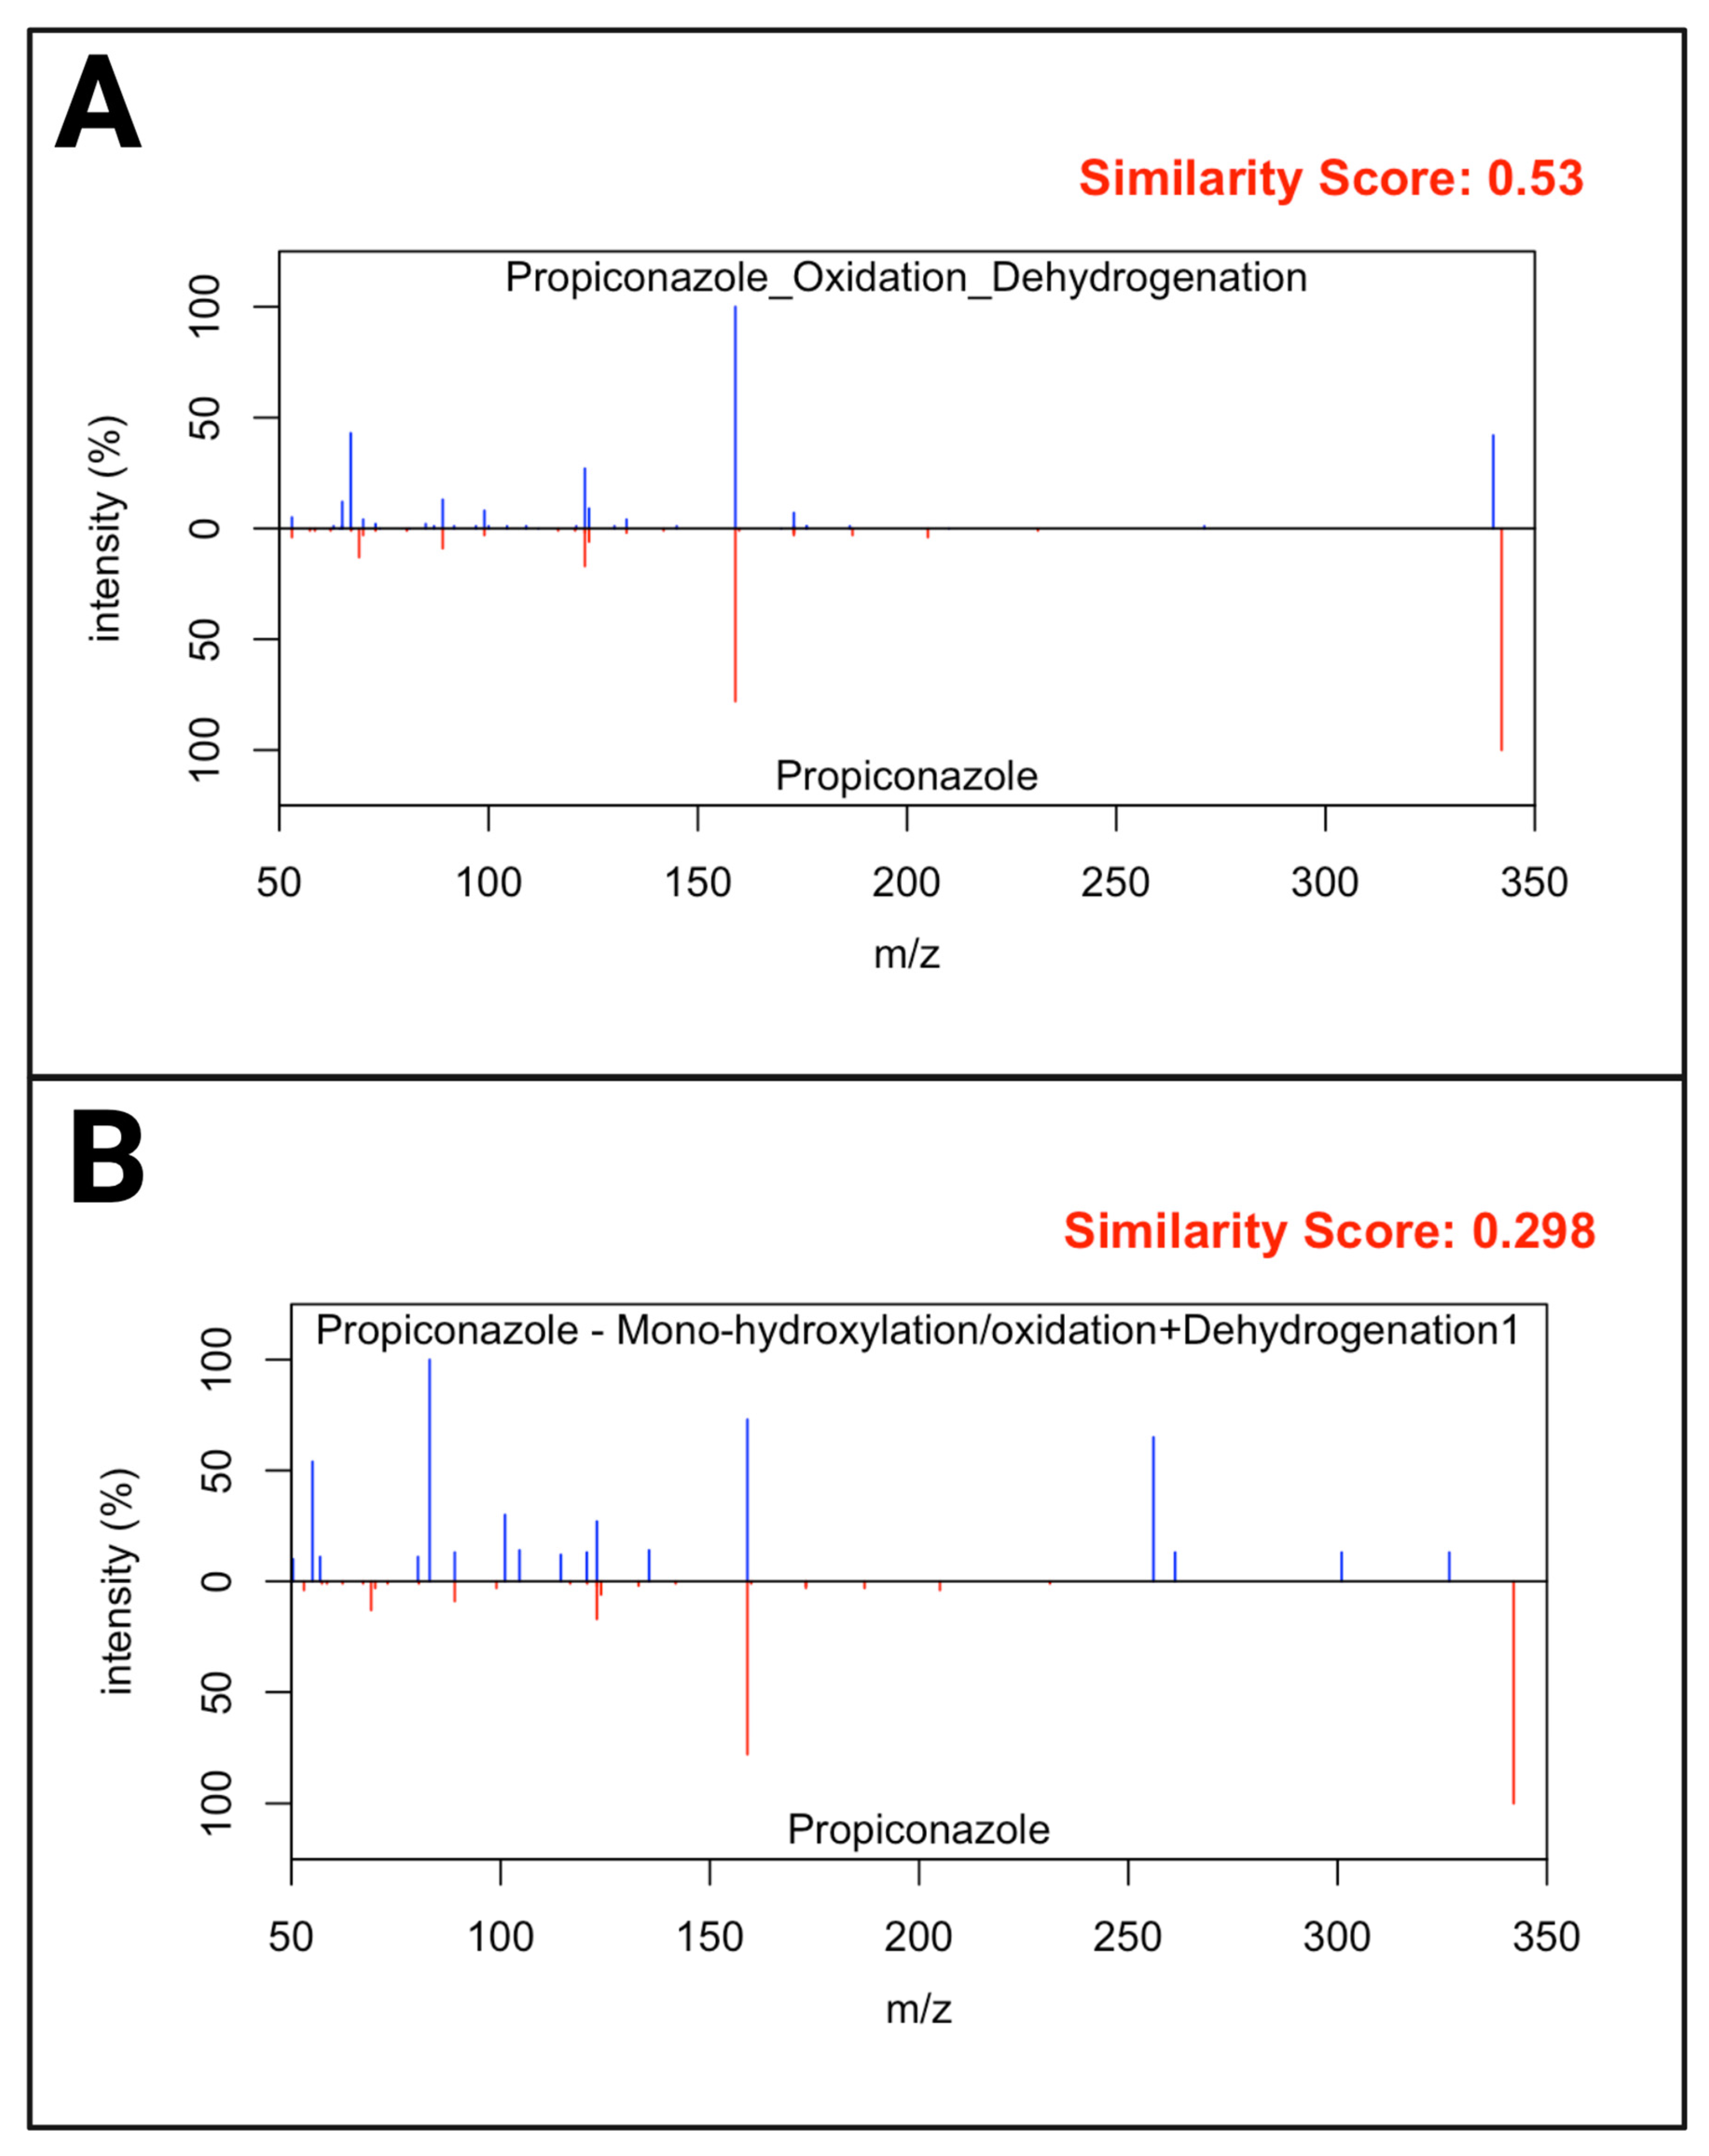

| Chemical Name | Formula | Compound Type | Mass-to-Charge Ratio | Retention Time (min) |
|---|---|---|---|---|
| 1-((4-allyl-2-(2,4-dichlorophenyl)-1,3-dioxolan-2-yl)methyl)-1H-1,2,4-triazole | C15H15Cl2N3O2 | Metabolite | 340.0614 | 8.31 |
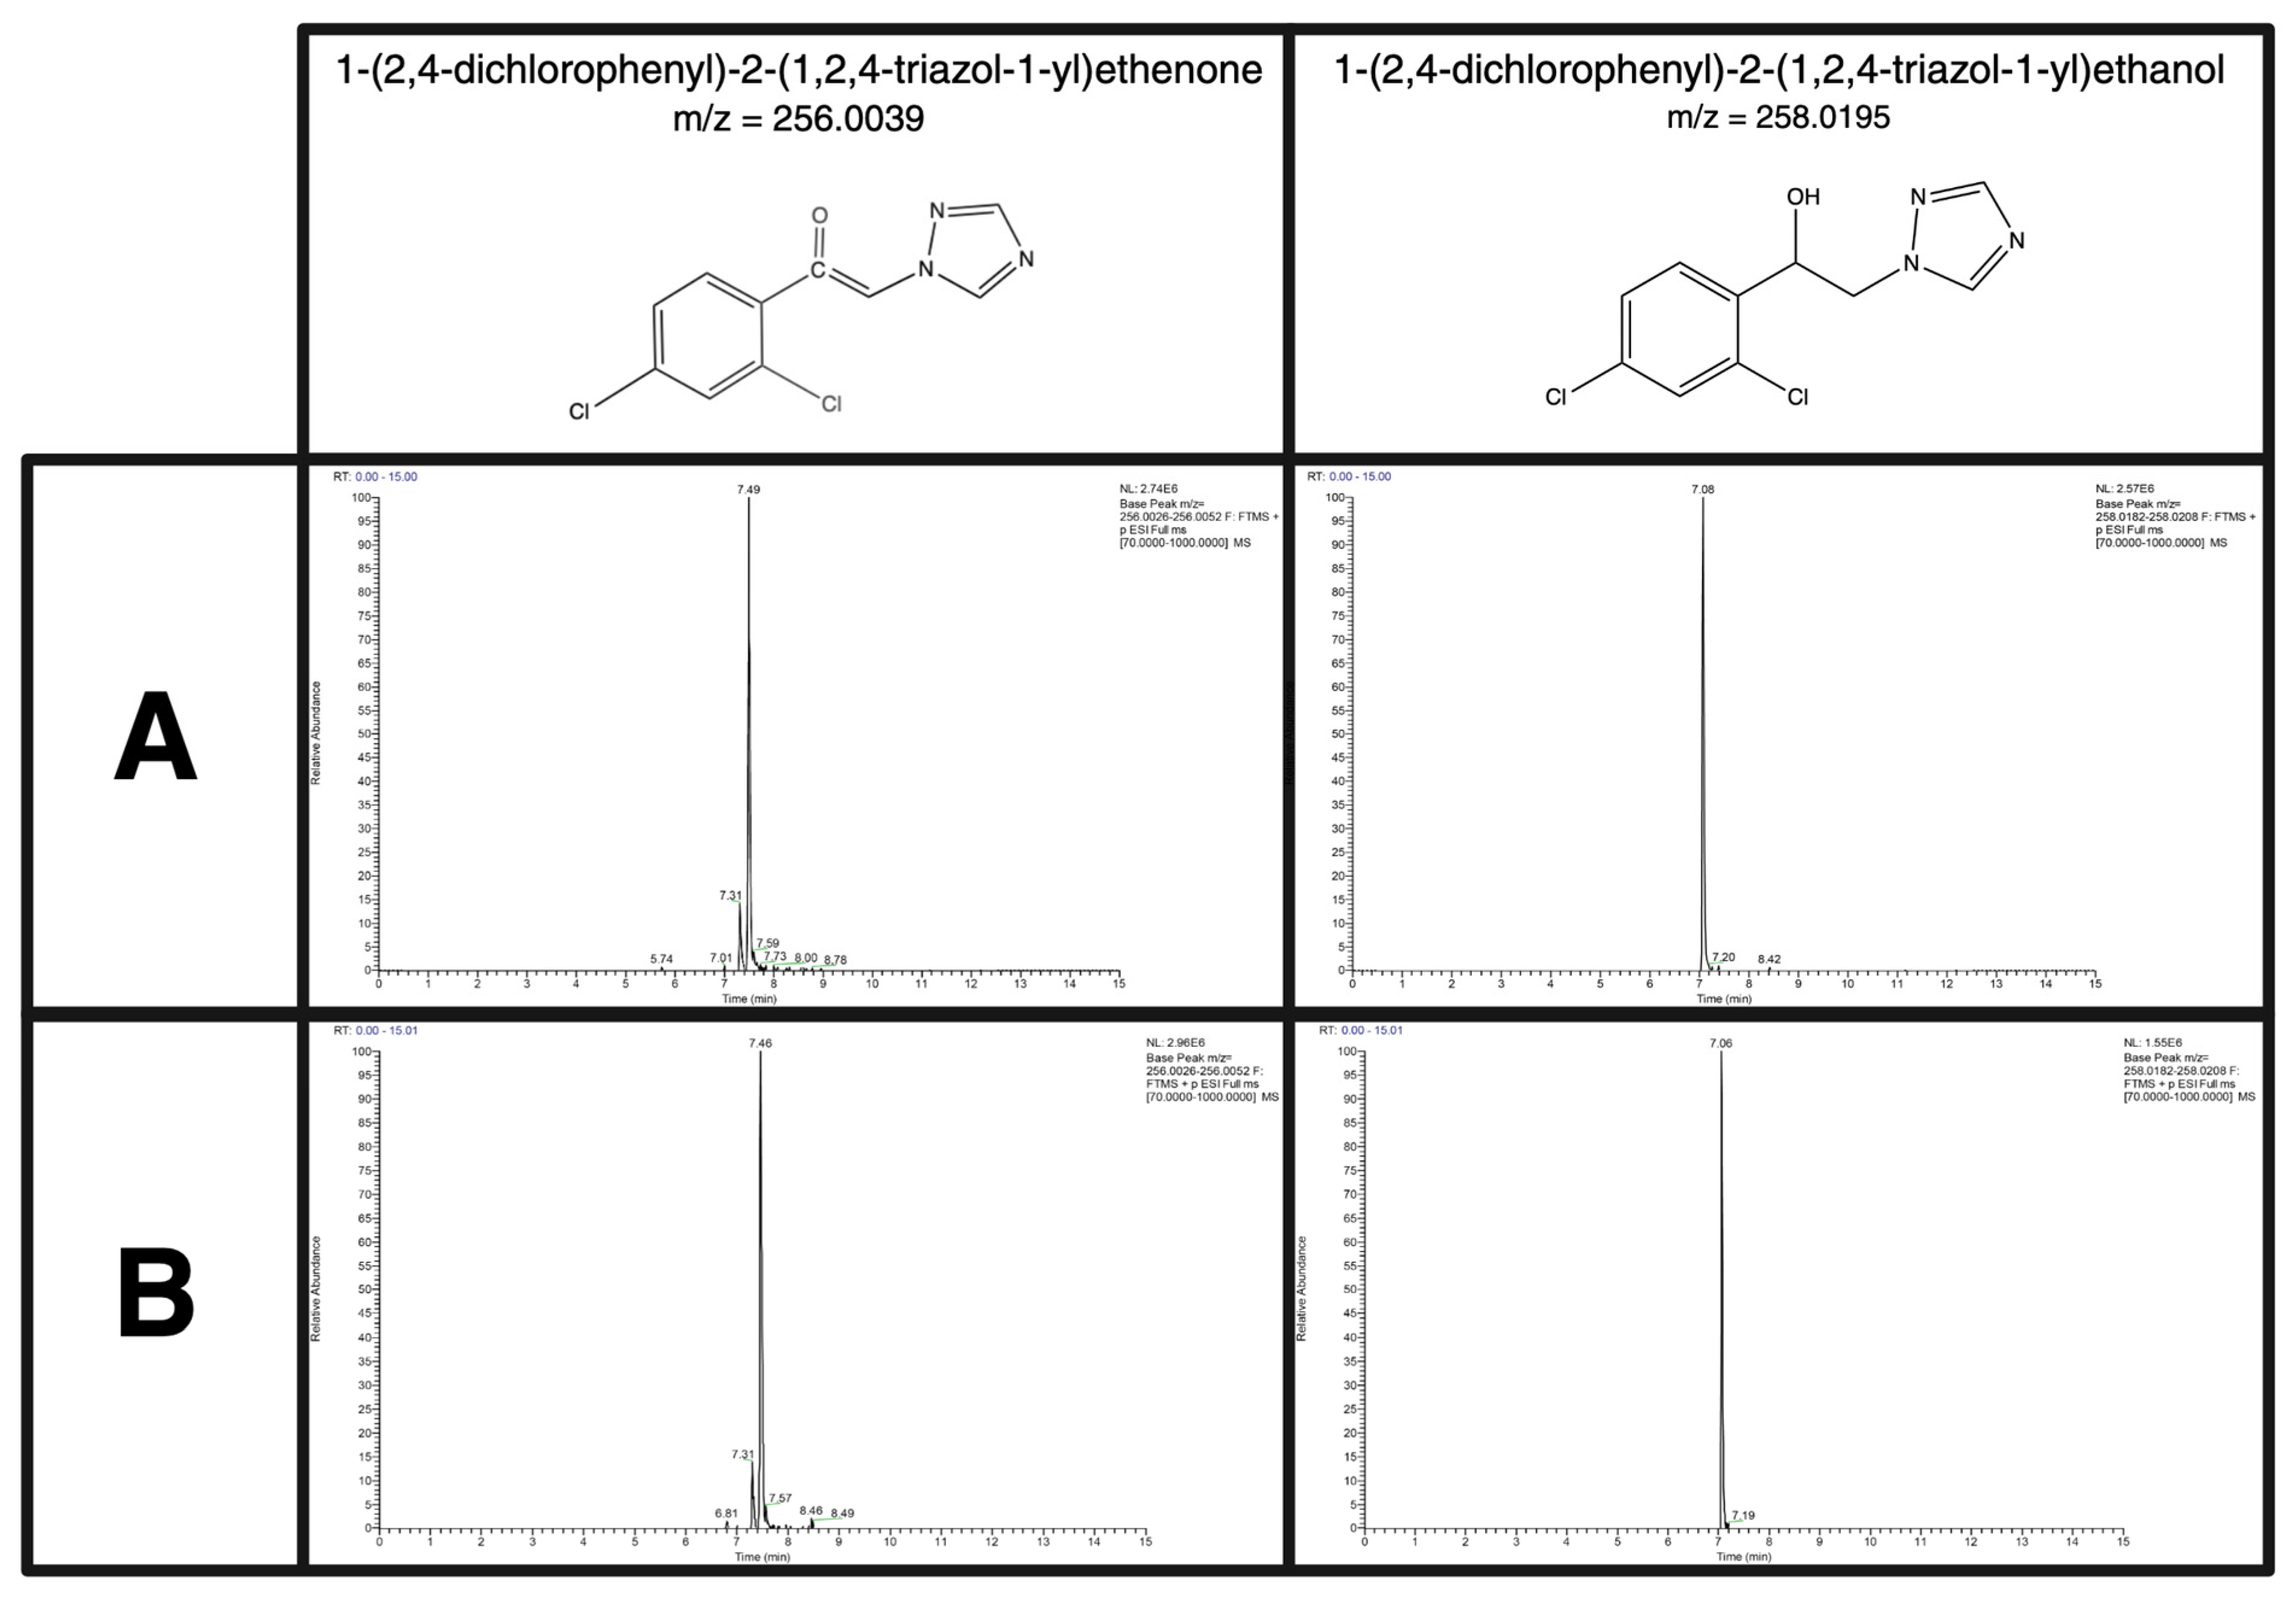
| 1-(2,4-dichlorophenyl)-2-(1,2,4-triazol-1-yl)ethanol | C10H9Cl2N3O | Metabolite | 258.0195 | 7.07 |
| 1-(2,4-Dichlorophenyl)-2-(1h-1,2,4-triazol-1-yl)ethanone | C10H7Cl2N3O | Metabolite | 256.0039 | 7.32 |
| 1-(4-Chlorophenyl)-4,4-dimethyl-3-(1,2,4-triazol-1-ylmethyl)pent-1-en-3-ol | C16H20ClN3O | Metabolite | 306.1368 | 8.28 |
| 1-(4-Hydroxyphenyl)-1-nonanone | C15H22O2 | Metabolite | 235.1693 | 8.77 |
| 1-(6-(hydroxymethyl)-2-(phenylamino)pyrimidin-4-yl)cyclopropan-1-ol | C14H15N3O2 | Metabolite | 258.1237 | 5.75 |
| 1-Acenaphthenone | C12H8O | Metabolite | 169.0648 | 7.25 |
| 1-Acenaphthenone | C12H8O | Metabolite | 169.0648 | 8.02 |
| 1-Amino-2-naphthol-6-sulfonic acid | C10H9NO4S | Metabolite | 240.0325 | 1.07 |
| 1-Amino-2-naphthol-6-sulfonic acid | C10H9NO4S | Metabolite | 240.0325 | 3.63 |
| 1-Aminonaphthalene | C10H9N | Parent | 144.0808 | 6.25 |
| 1-Naphthyl (hydroxymethyl)carbamate | C12H11NO3 | Metabolite | 218.0812 | 5.02 |
| 1-Naphthyl (hydroxymethyl)carbamate | C12H11NO3 | Metabolite | 218.0812 | 6.71 |
| 1-Naphthyl carbamate | C11H9NO2 | Metabolite | 188.0706 | 4.31 |
| 1,2-Benzisothiazol-3(2H)-one | C7H5NOS | Parent | 152.0165 | 5.61 |
| 1,2-benzisothiazol-3(2H)-one 1-oxide | C7H5NO2S | Metabolite | 168.0114 | 5.37 |
| 1,2-Benzisothiazol-3(2H)-one_Reduction_Hydrogenation | C7H7NOS | Metabolite | 154.0319 | 5.412 |
| 1,2-Diacetylbenzene | C10H10O2 | Parent | 163.0754 | 6.44 |
| 1,2-Diacetylbenzene_Reduction_Dehydroxylation/decarboxylation | C10H10O | Metabolite | 147.0804 | 7.608 |
| 1,2,3-Benzothiadiazole-7-carboxylic acid | C7H4N2O2S | Metabolite | 181.0066 | 6.36 |
| 1,3-Diphenylguanidine | C13H13N3 | Parent | 212.1182 | 5.36 |
| 1,3-Diphenylguanidine - Deamination + Dehydroxylation/decarboxylation | C13H10N2 | Metabolite | 195.0915 | 5.47 |
| 1,3-Diphenylguanidine - Deamination + Hydrogenation | C13H12N2O | Metabolite | 213.1020 | 7.797 |
| 1,3,5-Triazine-2,4-diamine, 6-chloro-n-ethyl-n’-hydroxy- | C5H8ClN5O | Metabolite | 190.0490 | 8.94 |
| 1[[2(2,4-dichlorophenyl)-4-hydroxypropyl-1,3-dioxolane-2-yl]methyl]1h-1,2,4triazole | C15H17Cl2N3O3 | Metabolite | 358.0720 | 7.49 |
| 2-(3,5-Dichlorophenylcarbamoyl)-1,2-dimethylcyclopropane-1-carboxylic acid | C13H13Cl2NO3 | Metabolite | 302.0345 | 5.16 |
| 2-(4-Oxopentoxycarbonyl)benzoic acid | C13H14O5 | Metabolite | 251.0914 | 3.38 |
| 2-(5-Carboxypentoxycarbonyl)benzoic acid | C14H16O6 | Metabolite | 281.1020 | 7.96 |
| 2-(Phenylazo)phenol | C12H10N2O | Metabolite | 199.0866 | 7.43 |
| 2-(Phenylazo)phenol | C12H10N2O | Metabolite | 199.0866 | 8.18 |
| 2-Anilino-6-cyclopropylpyrimidine-4-carbaldehyde | C14H13N3O | Metabolite | 240.1131 | 6 |
| 2-Anthrol | C14H10O | Metabolite | 195.0804 | 7.09 |
| 2-Butanone oxime | C4H9NO | Parent | 88.0757 | 4.6 |
| 2-Ethyl-6-oxohexyl diphenyl phosphate | C20H25O5P | Metabolite | 377.1512 | 8.59 |
| 2-ethylhex-5-en-1-yl bis(2-ethylhexyl) phosphate | C24H49O4P | Metabolite | 433.3441 | 12.22 |
| 2-ethylhex-5-en-1-yl bis(2-ethylhexyl) phosphate | C24H49O4P | Metabolite | 433.3441 | 12.47 |
| 2-ethylhex-5-en-1-yl diphenyl phosphate | C20H25O4P | Metabolite | 361.1563 | 9.03 |
| 2-Ethylhexyl diphenyl phosphate | C20H27O4P | Parent | 363.1720 | 9.27 |
| 2-Hydroxy-desmethyldiuron | C8H8Cl2N2O2 | Metabolite | 235.0036 | 7.68 |
| 2-hydroxy-N-methylsuccinimide | C5H7NO3 | Metabolite | 130.0499 | 0.68 |
| 2-hydroxy-N-methylsuccinimide | C5H7NO3 | Metabolite | 130.0499 | 1.17 |
| 2-hydroxy-N-methylsuccinimide | C5H7NO3 | Metabolite | 130.0499 | 1.23 |
| 2-Mercaptobenzo[d]thiazol-6-ol | C7H5NOS2 | Metabolite | 183.9885 | 7.22 |
| 2-Mercaptobenzothiazole | C7H5NS2 | Metabolite | 167.9936 | 7.23 |
| 2-Methoxy-5-methylaniline | C8H11NO | Parent | 138.0913 | 4.55 |
| 2-N-butan-2-yl-5-tert-butyl-3-nitrobenzene-1,2-diamine | C14H23N3O2 | Metabolite | 266.1863 | 8.94 |
| 2-n-Octyl-4-isothiazolin-3-one | C11H19NOS | Parent | 214.1260 | 8.18 |
| 2-n-Octyl-4-isothiazolin-3-one -Hydrogenation + Epoxide-hydration | C11H23NO2S | Metabolite | 234.1518 | 6.486 |
| 2-n-Octyl-4-isothiazolin-3-one -Mono-hydroxylation/oxidation + Epoxide-hydration | C11H21NO3S | Metabolite | 248.1311 | 6.409 |
| 2-Naphthol | C10H8O | Metabolite | 145.0648 | 5.72 |
| 2-Naphthylamine | C10H9N | Parent | 144.0808 | 5.75 |
| 2-Nitrobutane | C4H9NO2 | Metabolite | 104.0706 | 0.66 |
| 2-Octyl-1H-1lambda~4~,2-thiazole-1,3(2H)-dione | C11H19NO2S | Metabolite | 230.1209 | 3.07 |
| 2-Octyl-1H-1lambda~4~,2-thiazole-1,3(2H)-dione | C11H19NO2S | Metabolite | 230.1209 | 6.43 |
| 2-Octyl-1H-1lambda~4~,2-thiazole-1,3(2H)-dione | C11H19NO2S | Metabolite | 230.1209 | 6.7 |
| 2-Tert-butyl-4-ethenylphenol | C12H16O | Metabolite | 177.1274 | 7.61 |
| 2-Tert-butyl-4-ethenylphenol | C12H16O | Metabolite | 177.1274 | 7.98 |
| 2-Tert-butyl-4-ethenylphenol | C12H16O | Metabolite | 177.1274 | 8.02 |
| 2,3-Dihydroxypropanamide | C3H7NO3 | Metabolite | 106.0499 | 0.66 |
| 2,4-Diaminophenol | C6H8N2O | Metabolite | 125.0709 | 0.76 |
| 2,4-Diaminophenol | C6H8N2O | Metabolite | 125.0709 | 1.17 |
| 2,5-Di-tert-butylhydroquinone | C14H22O2 | Parent | 223.1693 | 9.16 |
| 2,5-Hexanedione | C6H10O2 | Metabolite | 115.0754 | 5.23 |
| 2,6-Diethylaniline | C10H15N | Parent | 150.1277 | 7.68 |
| 3-((1H-1,2,4-triazol-1-yl)methyl)-5-(4-chlorophenyl)-3-hydroxy-2,2-dimethylpentanoic acid | C16H20ClN3O3 | Metabolite | 338.1266 | 7.63 |
| 3-Acetamidobenzoic acid | C9H9NO3 | Metabolite | 180.0655 | 5.13 |
| 3-Amino-7-hydroxy-3,4-dihydrochromen-2-one | C9H9NO3 | Metabolite | 180.0655 | 5.13 |
| 3-Iodo-2-propynyl-N-butylcarbamate | C8H12INO2 | Parent | 281.9985 | 7.97 |
| 4-(But-2-en-2-yl)phenol | C10H12O | Metabolite | 149.0961 | 6.25 |
| 4-(But-2-en-2-yl)phenol | C10H12O | Metabolite | 149.0961 | 7.3 |
| 4-(Ethylamino)phenol | C8H11NO | Metabolite | 138.0913 | 2.22 |
| 4-(non-1-en-1-yl)phenol | C15H22O | Metabolite | 219.1743 | 8.1 |
| 4-chloro-2-cyano-5-(4-(hydroxymethyl)phenyl)N,N-dimethyl-1h-imidazole-1-sulfonamide | C13H13ClN4O3S | Metabolite | 341.0470 | 7.78 |
| 4-Chloro-2-cyano-N,N-dimethyl-5-(4-methylphenyl)-1H-imidazole-1-sulfonamide | C13H13ClN4O2S | Parent | 325.0521 | 8.49 |
| 4-Chloro-2-cyano-N,N-dimethyl-5-(4-methylphenyl)-1H-imidazole-1-sulfonamide - Deamination + Methylation | C14H12ClN3O3S | Metabolite | 338.0356 | 6.691 |
| 4-Chloro-5-(4-(hydroxymethyl)phenyl)-imidazole-2-carbonitrile | C11H8ClN3O | Metabolite | 234.0429 | 6.89 |
| 4-Chloroaniline | C6H6ClN | Parent | 128.0262 | 4.86 |
| 4-Hept-6-enylphenol | C13H18O | Metabolite | 191.1430 | 7.94 |
| 4-Hept-6-enylphenol | C13H18O | Metabolite | 191.1430 | 8.23 |
| 4-Hydroxyazepan-2-one | C6H11NO2 | Metabolite | 130.0863 | 0.57 |
| 4-Hydroxychlorpropham | C10H12ClNO3 | Metabolite | 230.0578 | 7.39 |
| 4-Hydroxychlorpropham | C10H12ClNO3 | Metabolite | 230.0578 | 7.47 |
| 4-Hydroxydiphenylamine | C12H11NO | Metabolite | 186.0913 | 7.62 |
| 4-Methylimidazole | C4H6N2 | Parent | 83.0604 | 0.74 |
| 4-Octanoylphenol | C14H20O2 | Metabolite | 221.1536 | 8.93 |
| 4-Vinyl-1-cyclohexene diepoxide | C8H12O2 | Parent | 141.0910 | 5.56 |
| 4,4_-Methylene-bis(2-methylaniline)_Oxidation_Dehydrogenation | C15H16N2 | Metabolite | 225.1392 | 4.56 |
| 4,4_-Methylene-bis(2-methylaniline)_Oxidation_Dehydrogenation | C15H16N2 | Metabolite | 225.1392 | 4.78 |
| 4,4_-Methylene-bis(2-methylaniline)_Reduction_Methylation | C16H20N2 | Metabolite | 241.1697 | 5.011 |
| 4,4′-Methylene-bis(2-methylaniline) | C15H18N2 | Parent | 227.1543 | 4.67 |
| 5-(4-Chlorophenyl)-2,2-dimethyl-3-(1H-1,2,4-triazol-1-ylmethyl)-1,3-pentanediol | C16H22ClN3O2 | Metabolite | 324.1473 | 7.74 |
| 5-[[2-(2-Ethylhexoxycarbonyl)benzoyl]oxymethyl]heptanoic acid | C24H36O6 | Metabolite | 421.2585 | 5.91 |
| 5-HO-Ehdpp | C20H27O5P | Metabolite | 379.1669 | 8.38 |
| 5-HO-Ehdpp | C20H27O5P | Metabolite | 379.1669 | 8.48 |
| 5-Hydroxy-1-methylpyrrolidin-2-one | C5H9NO2 | Metabolite | 116.0706 | 0.73 |
| 5,5′-Dimethoxy-3,3′-di-tert.-butyl-1,1′-biphenyl-2,2′-diol | C22H30O4 | Metabolite | 359.2217 | 6.74 |
| 5,5′-Dimethoxy-3,3′-di-tert.-butyl-1,1′-biphenyl-2,2′-diol | C22H30O4 | Metabolite | 359.2217 | 6.83 |
| 6-Butoxy-6-oxohexanoic acid | C10H18O4 | Metabolite | 203.1278 | 7.51 |
| 6-Methylquinoline | C10H9N | Parent | 144.0808 | 4.62 |
| 7,12-Benz(a)anthraquinone | C18H10O2 | Metabolite | 259.0753 | 8.23 |
| 7,12-Benz(a)anthraquinone | C18H10O2 | Metabolite | 259.0753 | 8.44 |
| 8-Quinolinol | C9H7NO | Parent | 146.0600 | 3.66 |
| 9-(Oxiran-2-yl)nonanoic acid | C11H20O3 | Metabolite | 201.1485 | 6.22 |
| Acedoben | C9H9NO3 | Metabolite | 180.0655 | 5.14 |
| Acenaphthylene oxide | C12H8O | Metabolite | 169.0648 | 6.13 |
| Acetamide, N-(2-methoxyphenyl)- | C9H11NO2 | Metabolite | 166.0863 | 3.29 |
| Acibenzolar-S-methyl | C8H6N2OS2 | Parent | 210.9994 | 8.23 |
| Acibenzolar-S-methyl_Oxidation_Desulphuration | C8H6N2O2S | Metabolite | 195.0222 | 7.798 |
| Amitraz | C19H23N3 | Parent | 294.1965 | 8.99 |
| Aniline, 4-tert-butyl-2,6-dinitro- | C10H13N3O4 | Metabolite | 240.0979 | 9.15 |
| Azobenzene | C12H10N2 | Parent | 183.0917 | 8.09 |
| Bensulide | C14H24NO4PS3 | Parent | 398.0678 | 8.56 |
| Bensulide oxon | C14H24NO5PS2 | Metabolite | 382.0906 | 7.94 |
| Benzaldehyde | C7H6O | Metabolite | 107.0491 | 3.27 |
| Benzidine | C12H12N2 | Metabolite | 185.1073 | 8.2 |
| benzo [8,9]tetrapheno [1,2-b]oxirene | C22H12O | Metabolite | 293.0961 | 0.73 |
| Benzo[a]anthracene-3,4-diol | C18H12O2 | Metabolite | 261.0910 | 6.83 |
| Benzyl butyl phthalate | C19H20O4 | Parent | 313.1434 | 8.8 |
| Bis(2-ethylhexyl) adipate | C22H42O4 | Parent | 371.3156 | 11.12 |
| Bis(2-ethylhexyl) phosphate | C16H35O4P | Metabolite | 323.2346 | 10.15 |
| Bis(2-ethylhexyl) phthalate | C24H38O4 | Parent | 391.2843 | 11.06 |
| but-3-en-1-yl dibutyl phosphate | C12H25O4P | Metabolite | 265.1563 | 8.52 |
| Butyl bis(3-hydroxybutyl) phosphate | C12H27O6P | Metabolite | 299.1618 | 6.43 |
| Butyl bis(3-hydroxybutyl) phosphate | C12H27O6P | Metabolite | 299.1618 | 6.56 |
| Butyl bis(3-hydroxybutyl) phosphate | C12H27O6P | Metabolite | 299.1618 | 6.77 |
| Butyl bis(3-hydroxybutyl) phosphate | C12H27O6P | Metabolite | 299.1618 | 7.15 |
| Butyl bis(3-hydroxybutyl) phosphate | C12H27O6P | Metabolite | 299.1618 | 7.32 |
| Butyl dihydrogen phosphate | C4H11O4P | Metabolite | 155.0468 | 7.7 |
| Butyl dihydrogen phosphate | C4H11O4P | Metabolite | 155.0468 | 7.85 |
| Butylate | C11H23NOS | Parent | 218.1573 | 9.02 |
| Butylparaben | C11H14O3 | Parent | 195.1016 | 7.99 |
| Caprolactam | C6H11NO | Parent/Metabolite | 114.0913 | 4.46 |
| Carbaryl | C12H11NO2 | Parent | 202.0863 | 7.61 |
| Chlorpropham | C10H12ClNO2 | Parent | 214.0629 | 8.33 |
| Chromone | C9H6O2 | Metabolite | 147.0441 | 1.49 |
| Coumarin | C9H6O2 | Parent | 147.0441 | 6.76 |
| Coumarin - Methylation + Epoxide-hydration | C10H10O3 | Metabolite | 179.0700 | 6.825 |
| Cycloate | C11H21NOS | Parent | 216.1417 | 8.88 |
| Cycloate_Oxidation_Mono-hydroxylation/oxidation | C11H21NO2S | Metabolite | 232.1363 | 7.268 |
| Cyclohexanone Oxime | C6H11NO | Metabolite | 114.0913 | 4.58 |
| Cyclohexyl phenyl ketone | C13H16O | Parent | 189.1274 | 8.7 |
| Cyclohexylamine | C6H13N | Parent | 100.1121 | 2.36 |
| Cyprodinil | C14H15N3 | Parent | 226.1339 | 7.97 |
| D-Sorbitol | C6H14O6 | Parent | 183.0863 | 0.66 |
| DEET | C12H17NO | Parent | 192.1383 | 7.72 |
| DEET_Oxidation_Mono-hydroxylation/oxidation | C12H17NO2 | Metabolite | 208.1331 | 6.175 |
| DEET_Oxidation_N/O-Dealkylation/demethylation | C11H15NO | Metabolite | 178.1226 | 7.257 |
| DEET_Reduction_Methylation | C13H19NO | Metabolite | 206.1538 | 7.911 |
| Deisopropyl Atrazine | C5H8ClN5 | Parent | 174.0541 | 5.28 |
| Di-(2-Ethylhexyl) (2-Ethyl-6-Hydroxyhexyl) Phosphate | C24H51O5P | Metabolite | 451.3547 | 10.27 |
| Di-(2-Ethylhexyl) (2-Ethyl-6-Hydroxyhexyl) Phosphate | C24H51O5P | Metabolite | 451.3547 | 10.53 |
| Di-(2-Ethylhexyl) (2-Ethyl-6-Hydroxyhexyl) Phosphate | C24H51O5P | Metabolite | 451.3547 | 10.77 |
| Di-(2-Ethylhexyl) (2-Ethyl-6-Hydroxyhexyl) Phosphate | C24H51O5P | Metabolite | 451.3547 | 10.91 |
| Di-(2-Ethylhexyl) (2-Ethyl-6-Hydroxyhexyl) Phosphate | C24H51O5P | Metabolite | 451.3547 | 10.98 |
| Di-n-octyl phthalate | C24H38O4 | Parent | 391.2843 | 11.26 |
| Diallyl phthalate | C14H14O4 | Parent | 247.0965 | 8.29 |
| Diamyl Phthalate | C18H26O4 | Parent | 307.1904 | 9.25 |
| Dibutyl 3-hydroxybutyl phosphate | C12H27O5P | Metabolite | 283.1669 | 7.82 |
| Dibutyl 3-hydroxybutyl phosphate | C12H27O5P | Metabolite | 283.1669 | 7.99 |
| Dibutyl adipate | C14H26O4 | Parent | 259.1904 | 8.86 |
| Dibutyl phosphate | C8H19O4P | Metabolite | 211.1094 | 7.73 |
| Dibutyl phosphate | C8H19O4P | Metabolite | 211.1094 | 8.53 |
| Dibutyl phosphate | C8H19O4P | Metabolite | 211.1094 | 8.7 |
| Dibutyl Sebacate | C18H34O4 | Parent | 315.2530 | 9.62 |
| Diethyl Succinate | C8H14O4 | Parent | 175.0965 | 7.23 |
| Diethylene glycol | C4H10O3 | Parent | 107.0703 | 1.15 |
| Diethylene glycol dimethyl ether | C6H14O3 | Parent | 135.1016 | 4.56 |
| Diethylene Glycol Monobutyl Ether | C8H18O3 | Parent | 163.1329 | 6.21 |
| Diethylene Glycol Monoethyl Ether | C6H14O3 | Parent | 135.1016 | 4.24 |
| Diethylene glycol monomethyl ether | C5H12O3 | Parent | 121.0859 | 3.06 |
| Diethylquinoneimine | C10H13NO | Metabolite | 164.1070 | 3.88 |
| Dihexyl phthalate | C20H30O4 | Parent | 335.2217 | 9.73 |
| Diisobutyl adipate | C14H26O4 | Parent | 259.1904 | 8.83 |
| Diisobutyl phthalate | C16H22O4 | Parent | 279.1591 | 8.88 |
| Dimethyl glutarate | C7H12O4 | Parent | 161.0808 | 6.24 |
| Dimethyl succinate | C6H10O4 | Parent | 147.0652 | 5.47 |
| Dimethyl sulfoxide | C2H6OS | Parent | 79.0212 | 0.74 |
| Diphenylamine | C12H11N | Parent | 170.0964 | 8.40 |
| Diphenylamine - Mono-hydroxylation/oxidation + Dehydrogenation | C12H9NO | Metabolite | 184.0757 | 7.689 |
| Diuron | C9H10Cl2N2O | Parent | 233.0243 | 7.74 |
| Ethoprophos | C8H19O2PS2 | Parent | 243.0637 | 8.32 |
| Ethoprophos - N/O-Dealkylation/demethylation + Desulphuration | C7H17O3PS | Metabolite | 213.0707 | 7.661 |
| Ethoprophos_Oxidation_N/O-Dealkylation/demethylation | C7H17O2PS2 | Metabolite | 229.0479 | 8.086 |
| Ethyl Dihydrogen Phosphate | C2H7O4P | Metabolite | 127.0155 | 5.18 |
| Flumioxazin | C19H15FN2O4 | Parent | 355.1089 | 8.08 |
| Flumioxazin_Reduction_Hydrogenation | C19H17FN2O4 | Metabolite | 357.1243 | 7.347 |
| Formamide, N,N-bis(2-methylpropyl)-1-(ethylsulfinyl)- | C11H23NO2S | Metabolite | 234.1522 | 8.07 |
| Formamide, N,N-bis(2-methylpropyl)-1-(ethylsulfinyl)- | C11H23NO2S | Metabolite | 234.1522 | 8.15 |
| Gallic Acid | C7H6O5 | Metabolite | 171.0288 | 6.42 |
| Hexamethylenetetramine | C6H12N4 | Parent | 141.1135 | 0.64 |
| Isophorone | C9H14O | Parent | 139.1117 | 7.39 |
| Linuron | C9H10Cl2N2O2 | Parent | 249.0192 | 8.13 |
| m-Nitroaniline | C6H6N2O2 | Metabolite | 139.0502 | 6.48 |
| m-Toluidine | C7H9N | Parent | 108.0808 | 3.37 |
| Malaoxon | C10H19O7PS | Parent | 315.0662 | 7.39 |
| Malaoxon_Oxidation_N/O-Dealkylation/demethylation | C9H17O7PS | Metabolite | 301.0504 | 5.706 |
| Maltol | C6H6O3 | Parent | 127.0390 | 4.05 |
| Methomyl | C5H10N2O2S | Metabolite | 163.0536 | 5.21 |
| Methoxy-[2-(methylamino)-2-oxoethyl]sulfanylphosphinic acid | C4H10NO4PS | Metabolite | 200.0141 | 0.75 |
| Methoxy-[2-(methylamino)-2-oxoethyl]sulfanylphosphinic acid | C4H10NO4PS | Metabolite | 200.0141 | 1.08 |
| Methyl 2-(difluoromethyl)-4-(2-methylpropyl)-5-(1-oxo-4,5-dihydro-1,3-thiazol-2-yl)-6-(trifluoromethyl)pyridine-3-carboxylate | C16H17F5N2O3S | Metabolite | 413.0953 | 8.22 |
| Molinate | C9H17NOS | Parent | 188.1104 | 8.33 |
| Molinate sulfoxide | C9H17NO2S | Metabolite | 204.1053 | 5.81 |
| Molinate sulfoxide | C9H17NO2S | Metabolite | 204.1053 | 5.85 |
| Molinate sulfoxide | C9H17NO2S | Metabolite | 204.1053 | 6.42 |
| Molinate sulfoxide | C9H17NO2S | Metabolite | 204.1053 | 6.85 |
| Molinate sulfoxide | C9H17NO2S | Metabolite | 204.1053 | 6.92 |
| Mono-2-ethyl-5-hydroxyhexyl phthalate | C16H22O5 | Metabolite | 295.1540 | 7.57 |
| Mono-8-hydroxyoctyl Phthalate | C16H22O5 | Metabolite | 295.1540 | 7.5 |
| mono-Butyl phthalate | C12H14O4 | Parent/Metabolite | 223.0965 | 7.67 |
| mono-Methyl phthalate | C9H8O4 | Parent | 181.0495 | 6.10 |
| Mono-n-octyl phthalate | C16H22O4 | Metabolite | 279.1591 | 8.59 |
| Mono-n-octyl phthalate | C16H22O4 | Metabolite | 279.1591 | 8.92 |
| Mono(2-ethyl-5-oxyhexyl)phthalate | C24H38O6 | Metabolite | 423.2741 | 5.98 |
| Mono(2E-pentenyl) Phthalate | C13H14O4 | Metabolite | 235.0965 | 8.75 |
| Monoisobutyl phthalate | C12H14O4 | Metabolite | 223.0965 | 7.65 |
| Monomethyldiuron | C8H8Cl2N2O | Metabolite | 219.0086 | 7.49 |
| Monopentyl Phthalate | C13H16O4 | Metabolite | 237.1121 | 7.97 |
| Monopentyl Phthalate | C13H16O4 | Metabolite | 237.1121 | 8.39 |
| N-(2,4-Dimethylphenyl)formamide | C9H11NO | Metabolite | 150.0913 | 6.86 |
| N-(3,4-dichloro-2-hydroxyphenyl)acetamide | C8H7Cl2NO2 | Metabolite | 220.9879 | 7.04 |
| N-(4-Hydroxy-2-methylphenyl)acetamide | C9H11NO2 | Metabolite | 166.0863 | 3.35 |
| N-(4-Hydroxyphenyl)-Na(2)-phenylguanidine | C13H13N3O | Metabolite | 228.1131 | 5.15 |
| N-(Methoxyacetyl)glycine | C5H9NO4 | Metabolite | 148.0604 | 0.68 |
| N-Ethylaniline | C8H11N | Parent | 122.0964 | 3.74 |
| N-Ethylcyclohexylamine | C8H17N | Metabolite | 128.1434 | 3.94 |
| N-Hydroxyurethane | C3H7NO3 | Metabolite | 106.0499 | 0.66 |
| N-Methylpyrrolidone | C5H9NO | Parent | 100.0757 | 3.29 |
| N-Nitrosodiethylamine | C4H10N2O | Parent | 103.0866 | 5.18 |
| n-Propyl 3,4,5-trihydroxybenzoate | C10H12O5 | Parent | 213.0758 | 6.37 |
| N,N-Dimethylaniline | C8H11N | Parent | 122.0964 | 3.34 |
| o-Anisidine | C7H9NO | Parent | 124.0757 | 2.87 |
| O-Ethyl S-propyl phosphorothioate | C5H13O3PS | Metabolite | 185.0396 | 4.92 |
| O-Ethyl S-propyl phosphorothioate | C8H19O3PS2 | Metabolite | 259.0586 | 7.12 |
| o-Toluidine | C7H9N | Parent | 108.0808 | 3.16 |
| Omethoate | C5H12NO4PS | Parent | 214.0297 | 3.95 |
| p-Toluidine | C7H9N | Parent | 108.0808 | 3.12 |
| Pentaerythritol | C5H12O4 | Parent | 137.0808 | 0.73 |
| phenanthro [1,2-b]oxirene-3,5-diol | C14H8O3 | Metabolite | 225.0546 | 6.82 |
| phenanthro [1,2-b]oxirene-3,5-diol | C14H8O3 | Metabolite | 225.0546 | 7.11 |
| phenanthro [1,2-b]oxirene-3,5-diol | C14H8O3 | Metabolite | 225.0546 | 7.35 |
| phenanthro [3,4-b]oxiren-4-ol | C14H8O2 | Metabolite | 209.0597 | 7.88 |
| Phenol, 4-((4-cyclopropyl-6-methyl-2-pyrimidinyl)amino)- | C14H15N3O | Metabolite | 242.1288 | 5.97 |
| Phenol, 4,4′-iminobis- | C12H11NO2 | Metabolite | 202.0863 | 5.79 |
| Phenylphosphate | C6H7O4P | Metabolite | 175.0155 | 10.44 |
| Phthaldialdehyde | C8H6O2 | Parent | 135.0441 | 5.68 |
| Phthalimide | C8H5NO2 | Metabolite | 148.0393 | 3.57 |
| Phthalimide | C8H5NO2 | Metabolite | 148.0393 | 4.86 |
| Propiconazole | C15H17Cl2N3O2 | Parent | 342.0771 | 8.46 |
| Propiconazole - Mono-hydroxylation/oxidation + Dehydrogenation1 | C15H15Cl2N3O3 | Metabolite | 356.0559 | 7.719 |
| Propiconazole_Oxidation_Di-hydroxylation | C15H17Cl2N3O4 | Metabolite | 374.0667 | 6.826 |
| Quinoline-6,8-diol | C9H7NO2 | Metabolite | 162.0550 | 3.34 |
| S-(2,3,3-trichloroallyl) (1-hydroxypropan-2-yl)(isopropyl)carbamothioate | C10H16Cl3NO2S | Metabolite | 320.0040 | 8.5 |
| S,S-diallyl O-ethyl phosphorodithioate | C8H15O2PS2 | Metabolite | 239.0324 | 7.21 |
| Sebacic Acid | C10H18O4 | Metabolite | 203.1278 | 6.69 |
| Semiamitraz | C10H14N2 | Metabolite | 163.1230 | 5.2 |
| Styrene oxide | C8H8O | Parent | 121.0648 | 7.36 |
| Tebuconazole | C16H22ClN3O | Parent | 308.1524 | 8.33 |
| Thiazopyr | C16H17F5N2O2S | Parent | 397.1004 | 8.61 |
| Thiazopyr_Oxidation_Dehydrogenation | C16H15F5N2O2S | Metabolite | 395.0843 | 8.603 |
| Thiazopyr_Oxidation_N/O-Dealkylation/demethylation | C15H15F5N2O2S | Metabolite | 383.0844 | 7.974 |
| Thioacetamide | C2H5NS | Parent | 76.0215 | 1.24 |
| Thioacetamide-S-oxide | C2H5NOS | Metabolite | 92.0165 | 1.14 |
| Thiodicarb | C10H18N4O4S3 | Parent | 355.0563 | 7.37 |
| Tri-allate | C10H16Cl3NOS | Parent | 304.0091 | 9.22 |
| Tributyl phosphate | C12H27O4P | Parent | 267.1720 | 8.66 |
| Tributylamine | C12H27N | Parent | 186.2216 | 6.29 |
| Tributyltin chloride | C12H27ClSn | Parent | 332.1390 | 7.72 |
| Triethylene glycol | C6H14O4 | Parent | 151.0965 | 2.35 |
| Triethylene glycol dimethyl ether | C8H18O4 | Parent | 179.1278 | 5.06 |
| Triethylene glycol dimethyl ether_Oxidation_N/O-Dealkylation/demethylation | C7H16O4 | Metabolite | 165.1120 | 4.104 |
| Triglycidyl Isocyanurate | C12H15N3O6 | Parent | 298.1034 | 5.49 |
| Vanillic Acid | C8H8O4 | Metabolite | 169.0495 | 5.22 |
| Vanillin | C8H8O3 | Parent | 153.0546 | 5.75 |
Disclaimer/Publisher’s Note: The statements, opinions and data contained in all publications are solely those of the individual author(s) and contributor(s) and not of MDPI and/or the editor(s). MDPI and/or the editor(s) disclaim responsibility for any injury to people or property resulting from any ideas, methods, instructions or products referred to in the content. |
© 2025 by the authors. Licensee MDPI, Basel, Switzerland. This article is an open access article distributed under the terms and conditions of the Creative Commons Attribution (CC BY) license (https://creativecommons.org/licenses/by/4.0/).
Share and Cite
Teitelbaum, T.; Zhao, H.; Koval, L.E.; Hsiao, Y.-C.; Liu, C.-W.; Rager, J.E.; Engel, S.M.; Lu, K. Development of LC-MS/MS Database Based on 250 Potentially Highly Neuroactive Compounds and Their Metabolites. Metabolites 2025, 15, 650. https://doi.org/10.3390/metabo15100650
Teitelbaum T, Zhao H, Koval LE, Hsiao Y-C, Liu C-W, Rager JE, Engel SM, Lu K. Development of LC-MS/MS Database Based on 250 Potentially Highly Neuroactive Compounds and Their Metabolites. Metabolites. 2025; 15(10):650. https://doi.org/10.3390/metabo15100650
Chicago/Turabian StyleTeitelbaum, Taylor, Haoduo Zhao, Lauren E. Koval, Yun-Chung Hsiao, Chih-Wei Liu, Julia E. Rager, Stephanie M. Engel, and Kun Lu. 2025. "Development of LC-MS/MS Database Based on 250 Potentially Highly Neuroactive Compounds and Their Metabolites" Metabolites 15, no. 10: 650. https://doi.org/10.3390/metabo15100650
APA StyleTeitelbaum, T., Zhao, H., Koval, L. E., Hsiao, Y.-C., Liu, C.-W., Rager, J. E., Engel, S. M., & Lu, K. (2025). Development of LC-MS/MS Database Based on 250 Potentially Highly Neuroactive Compounds and Their Metabolites. Metabolites, 15(10), 650. https://doi.org/10.3390/metabo15100650


