Article

Evaluation of the Metabolite Profile of Fish Oil Omega-3 Fatty Acids (n-3 FAs) in Micellar and Enteric-Coated Forms—A Randomized, Cross-Over Human Study

1
ISURA, Clinical Research, Burnaby, BC V3N 4S9, Canada
2
Factors Group R & D, Burnaby, BC V3N 4S9, Canada
3
Academy of Integrative and Holistic Medicine, San Diego, CA 92037, USA
*
Authors to whom correspondence should be addressed.
Metabolites 2024, 14(5), 265; https://doi.org/10.3390/metabo14050265
Submission received: 19 April 2024 / Revised: 2 May 2024 / Accepted: 3 May 2024 / Published: 7 May 2024
(This article belongs to the Section Nutrition and Metabolism)

Abstract

:
This study evaluated the differences in the metabolite profile of three n-3 FA fish oil formulations in 12 healthy participants: (1) standard softgels (STD) providing 600 mg n-3 FA; (2) enteric-coated softgels (ENT) providing 600 mg n-3 FA; (3) a new micellar formulation (LMF) providing 374 mg n-3 FA. The pharmacokinetics (PKs), such as the area under the plot of plasma concentration (AUC), and the peak blood concentration (Cmax) of the different FA metabolites including HDHAs, HETEs, HEPEs, RvD1, RvD5, RvE1, and RvE2, were determined over a total period of 24 h. Blood concentrations of EPA (26,920.0 ± 10,021.0 ng/mL·h) were significantly higher with respect to AUC0-24 following LMF treatment vs STD and ENT; when measured incrementally, blood concentrations of total n-3 FAs (EPA/DHA/DPA3) up to 11 times higher were observed for LMF vs STD (iAUC 0-24: 16,150.0 ± 5454.0 vs 1498.9 ± 443.0; p ≤ 0.0001). Significant differences in n-3 metabolites including oxylipins were found between STD and LMF with respect to 12-HEPE, 9-HEPE, 12-HETE, and RvD1; 9-HEPE levels were significantly higher following the STD vs. ENT treatment. Furthermore, within the scope of this study, changes in blood lipid levels (i.e., cholesterol, triglycerides, LDL, and HDL) were monitored in participants for up to 120 h post-treatment; a significant decrease in serum triglycerides was detected in participants (~20%) following the LMF treatment; no significant deviations from the baseline were detected for all the other lipid biomarkers in any of the treatment groups. Despite a lower administered dose, LMF provided higher blood concentrations of n-3 FAs and certain anti-inflammatory n-3 metabolites in human participants—potentially leading to better health outcomes.

1. Introduction

Omega-3 fatty acids (n-3 FA) represent essential polyunsaturated fatty acids (PUFAs) that have anti-inflammatory properties, with many reported health benefits for humans [1,2]. The highest dietary sources of n-3 FAs—specifically eicosapentaenoic acid (EPA) and docosahexaenoic acid (DHA), which are associated with numerous health benefits e.g., cardiovascular and cognitive improvements—are typically found in marine sources like fatty fish, algal oil, or krill oil [3,4,5,6]. Alpha-linolenic acid (ALA) is more commonly found in plant-based sources like chia seeds, flaxseeds, and walnuts, and needs to be converted by the body into a usable form (i.e., EPA and DHA), with a rather poor conversion rate of 5–15% [7,8]. Docosapentaenoic acid (DPA3 or n-3 DPA) is found in fish oil, but at much lower concentrations compared to EPA and DHA. Though DPA3 has been less extensively studied, emerging research suggests that it provides similar health benefits to EPA and DHA [9].
Recent studies have also drawn focus to the clinical effects of n-3 FA metabolites including oxylipins, a diverse group of bioactive lipid mediators derived from the oxidation of polyunsaturated fatty acids (PUFAs). Some metabolites of DHA include hydroxy-docosahexaenoic acids (HDHAs), Resolvin D1 (RvD1) and Resolvin D5 (RvD5), all of which have shown anti-inflammatory effects in in vitro studies [10]. Resolvins such as RvD1 and RvD5 play a role in pain management by reducing hypersensitivity and modulating pain signals [11,12], and having cardiovascular protective effects as well as neuroprotective properties—which may be particularly important in connection to the development of autoimmune diseases [13,14]. Similarly, Resolvin E1 (RvE1) and Resolvin E2 (RvE2) derived from hydroxyeicosapentaenoic acids (HEPEs)—metabolites of EPA—are known for their anti-inflammatory and immune modulating properties [15,16]. Other oxylipins including HETEs (hydroxyeicosatetraenoic acids), classified as hydroxyeicosanoids, are part of the larger family of eicosanoids, synthesized from arachidonic acid (AA). HETEs play a role in the pro-inflammatory signaling pathways contributing to the initiation and propagation of the inflammatory response. In vitro studies have reported that HETEs serve as a chemoattractant, attracting immune cells to the site of inflammation, and have been implicated in processes related to cell proliferation and differentiation, as well as platelet activation [17]. This can lead to pathological conditions such as thrombosis, as well as diseases associated with oxidative stress such as Parkinson’s disease and Alzheimer’s disease [18,19]. Furthermore, HETEs have been associated with inducing obesity, coronary artery disease, and breast cancer [20,21,22].
Modern Western diets are usually low in n-3 FAs, especially EPA and DHA, and high in saturated fats, trans fats and Omega-6 polyunsaturated fats [23]. A deficiency in essential n-3 FAs can lead to an array of health problems related to cardiovascular health, cognitive development, inflammatory conditions, autoimmune diseases and cancer [24,25]. Further compounding this deficiency are those with certain pre-existing health conditions or those who live solely on a plant-based diet, making supplementation desirable [26].
The most commonly studied n-3 FA forms are naturally occurring and reconstituted triglycerides (TG), ethyl esters (EE), and free fatty acids (FFA). Pharmacokinetic studies reported that the most bioavailable form of n-3 FA is when it is provided in the order of FFA > TG > EE [27,28,29].
The absorption of n-3 FAs in supplement form can be influenced by several factors. Put simplistically, following the oral administration of n-3 FAs in humans, bile acids aid emulsification and pancreatic enzymes break down the larger triacylglycerol fat molecules into smaller free fatty acids that can be more easily absorbed through the small intestinal epithelium. The efficiency of this process can vary between individuals due to physiological and genetic differences [30,31]. Another consideration is the formulation used for oral supplementation. For example, n-3 FAs, especially in the free fatty acid form, have been shown to be more prone to peroxidation, which can lead to stability issues, undesirable byproducts, as well as reduced bioavailability [32,33]. N-3 supplements formulated in delayed release forms may help to create a gastro-resistant barrier and reduce fishy aftertaste or smell [34]. Enteric-coated (ENT) n-3 FAs are resistant to stomach acid and appear to offer increased absorption [35,36]. The enteric coating of softgel capsules involves covering the capsules in a coating of synthetic polymers or natural ingredients, which prevent premature rupture and the subsequent degradation of active compounds in the acidic environment of the stomach to allow for its release in the more neutral or alkaline environment of the small intestine [37]. Some studies have shown that the otherwise common use of enteric-coated softgel capsules for fish oils appears to have little to no impact on bioavailability. For instance, Schneider et al., using enteric-coated capsules of EPA- and DHA-rich fish oils, did not find significant differences in bioavailability in comparison to standard capsules [38]. More recently, however, there has been evidence that emulsified delivery matrices containing micelles of either TGs and EEs are able to provide superior oral bioavailability over regular fish oils alone [39,40].
The aim of this study is to determine the pharmacokinetic (PK) differences in n-3 FAs and metabolites of three different fish oil formulations: Omega-3 triglycerides in standard soft-gelatin capsules (i.e., the most common market form); Omega-3 triglycerides in enteric-coated soft-gelatin capsules (i.e., an improved formulation to the standard form to reduce aftertaste and smell); and Omega-3 triglycerides in a novel micellar matrix soft-gelatin capsule (namely LipoMicel®). The primary outcome measures include the PKs such as AUC0-24 and Cmax of the n-3 FAs including EPA, DHA, as well as their metabolites such as HDHAs, HEPEs, RvD1, RvD5, RvE1, and RvE2, determined in human participants. Additionally, changes in blood lipid parameters (e.g., cholesterol and related lipids) were monitored up to 120 h (5 days) post-dose.

2. Materials and Methods

2.1. Omega-3 (n-3) Formulations

Three commercially available fish oil supplements containing Omega-3 triglycerides were examined for this study. Omega-3 Complete softgel capsules (non-enteric, standard (STD)) were purchased from Jamieson Wellness Inc. (Toronto, ON, Canada); Extra Strength RxOmega-3 softgel capsules (enteric-coated (ENT)) were purchased from Natural Factors (Burnaby, BC, Canada); Omega-3 micellar (LipoMicel® (LMF)) softgel capsules were newly formulated and provided by Natural Factors (Burnaby, BC, Canada).
  • Standard (STD) softgel capsules are composed of 1000 mg fish oil (molecularly distilled; anchovy, tuna), containing 600 mg Omega-3 fatty acids which provide: 400 mg of EPA and 200 mg of DHA; other ingredients are gelatin (bovine) and glycerin.
  • Enteric-coated (ENT) softgel capsules are composed of 1170 mg fish oil (molecularly distilled, ultra-purified; anchovy, sardine, and/or mackerel), containing 600 mg Omega-3 fatty acids which provide: 400 mg EPA and 200 mg DHA; other ingredients are gelatin, glycerin, purified water, pectin, and natural vitamin E (patented Enteripure® softgels).
  • Micellar (LMF) softgel capsules are composed of 585 mg fish oil (molecularly distilled), containing 374 mg of Omega-3 fatty acids which provide: 200 mg EPA, 133 mg DHA and 41 mg DPA3; other ingredients are glycerin, water, gelatin bovine bone, cocoa powder, xylitol, medium chain triglycerides, and methylsulfonylmethane (patent pending LipoMicel®).
The single dose used in the study was one capsule of n-3 fish oil/day (max. 600 mg). The administered amount of n-3 FAs varied among treatments—with LMF containing a total lower amount of n-3 FA with a ratio of EPA:DHA 2:1.5 compared to the 2:1 in other treatments.

2.2. Study Design

This study is a randomized, double blind, crossover study (Figure 1). Table 1 provides the inclusion and exclusion criteria for this study. All participants provided a written consent form and completed an online health questionnaire on their medical history prior to participation. The study was approved by the Canadian SHIELD Ethics Review Board (OHRP Registration IORG0003491; FDA Registration IRB00004157; Approval letter ID 2021-10-002, date of approval: 28 February 2022). The study has been registered on ClinicalTrials.gov with Identifier NCT05394701 and conducted in accordance with the ethical standards as set forth in the Helsinki Declaration of 1975.
In Phase I of the study, the pharmacokinetics of different n-3 FA supplements were evaluated by collecting capillary whole blood samples over a period of 24 h: at baseline (t = 0 h), 0.5, 1, 2, 3, 4, 6, 8, 12 and 24 h post-dose (Figure 2). In Phase II, participants continued taking the treatments daily for 5 consecutive days or up to 120 h to monitor changes in blood lipids. Capillary blood samples were collected at baseline (t = 0 h), 3, 6, 12, 24, 48, 72, 96, and 120 h post-dose (Figure 2). A two-week washout period was employed before each subsequent n-3 treatment.
A single dose of each n-3 supplement was administered to each participant with at least 9 h of overnight fasting. Participants were blinded and did not know the size and shape of each individual treatment beforehand, so that they were incapable of identifying the treatments. Treatments were consumed in the morning with a glass of water, and within 30 min were followed by a standardized breakfast, consisting of a bagel with cream cheese and jam. Standardized lunch was provided for the first 24 h of the treatments; standardized breakfast and dinner were provided throughout the entire study period as summarized in Table 2.

2.3. Determination of Omega-3 Fatty Acids and Metabolites in Blood

The samples were prepared and analyzed according to previously published methods [22,41,42]. Whole blood samples (50 µL) were hydrolyzed with 300 µL 10 M sodium hydroxide (Sigma, Oakville, ON, Canada) at 60 °C for 30 min. Then, samples were neutralized with 300 µL 60% acetic acid (Sigma, Canada), and 50 µL of diluted internal standard solution was added prior to hydrophilic–lipophilic balance (HLB)-type Solid Phase Extraction (SPE, Phenomenex, Torrance, CA, USA). Samples applied to SPE were washed with water, 15% methanol, and hexane prior to elution with ethyl formate. The eluted fatty acid-rich extract was then evaporated under nitrogen and reconstituted with 50 µL of ethanol.
The reconstituted samples were then injected at 20.0 µL volumes into a Thermo Vanquish Ultra High-Performance Liquid Chromatography system (UHPLC, Thermo Scientific, Montreal, QC, Canada) from microplates kept at 10.0 °C and separated on 100 × 2.1 mm Acme Xceed C18, 1.9 µm particle columns (Phase Analytical Technology, State College, PA, USA) that are temperature controlled in a 40.0 °C column oven. A binary mobile phase, consisting of 0.5% formic acid in water (Mobile Phase A) and acetonitrile (Mobile Phase B), was used with a linear gradient from 50–70% Mobile Phase B over the first 4.00 min, and then 70–80% from 4.00 to 5.00 min, 80–95% from 5.00 to 8.00 min, and with an isocratic gradient of 95% B from 8.00 to 10.00 min. All reagents used were LCMS (Liquid Chromatography Mass Spectrometry) grade and obtained from Fisher Scientific, Canada. N-3 Fatty acids, metabolite chemical standards and deuterated internal standards were purchased from Cayman Chemical (Ann Arbor, MI, USA). See Table 3 for the list of chemical standards used.
The UHPLC was connected to a Thermo Q exactive Orbitrap mass spectrometer set at 35,000 mass resolution in Parallel Reaction Monitoring (PRM) mode using an isolation window of 0.4 m/z and a normalized collision energy of 27 eV. Detailed scan parameters are described in Table 3. A heated electrospray ion source (HESI) was operated in negative mode, and calibration was carried out with Thermo Scientific™ Pierce™ LTQ Velos ESI Negative Ion Calibration Solution (Thermo Scientific, Canada) weekly with a typical mass error less than 1 ppm. Table S1 contains the mass extraction parameters for the complete list of n-3 FA and their metabolites. Sample chromatograms for these compounds can be found in Figure S1.

2.4. Determination of Blood Lipids

Blood lipids were determined using a Cholestech LDX Analyzer with Cholestech LDX Lipid Profile Cassettes (Abbott, Princeton, NJ, USA). Briefly, 40 µL of capillary blood was drawn into a heparinized glass capillary (Alere, Waltham, MA, USA), and injected into single-use analysis cassettes. The cassette was placed into the analyzer which then provided results within about 5 min. The analyzer was calibrated according to the manufacturer’s instructions prior to use each day.

2.5. Data Analysis

The main pharmacokinetic parameter examined was the area under the plot of plasma concentration of the formulation versus 24 h after dosage (AUC0-24). The mean value for AUC0-24 of each individual Omega-3 active and metabolite was calculated and expressed as graphs. Blood concentration AUCs of n-3 FAs and metabolites were evaluated for normality using the Kolmogorov–Smirnov test with an alpha of 0.05. Non-normal AUCs were log transformed prior to statistical analysis with a repeated measure two-way ANOVA followed by a post hoc Tukey’s multiple comparison test. Changes in blood lipids compared to baseline values were analyzed with a repeated measure two-way ANOVA followed by a post hoc Dunnett’s multiple comparison correction.

2.6. Randomization and Blinding

Randomization was performed using Research Randomizer from https://www.randomizer.org/. Sixteen sets of numbers were generated, and each set contained a series of 3 non-repeating numbers from 1 to 3. Each number represented three different treatments: Standard (STD) soft gel capsules, enteric-coated (ENT) soft gel capsules, and micellar (LMF) soft gel capsules. Treatments were dispensed to the participants according to the sequence of the number series in each treatment week.

3. Results

3.1. Baseline Characteristics

16 participants were initially recruited and randomized to treatment (9 men; 7 women; average age 36 years with mean BMI of 22.1 ± 0.5 kg/m2 and mean weight of 61.8 ± 2.4 kg; Table 4); 12 participants completed the phase I trial and were included in the pharmacokinetic analysis. Due to the much longer time commitment required, in phase II, only a small number of participants (n = 8) completed the blood lipid analysis as demonstrated in Figure 2.

3.2. Pharmacokinetics of n-3 FAs

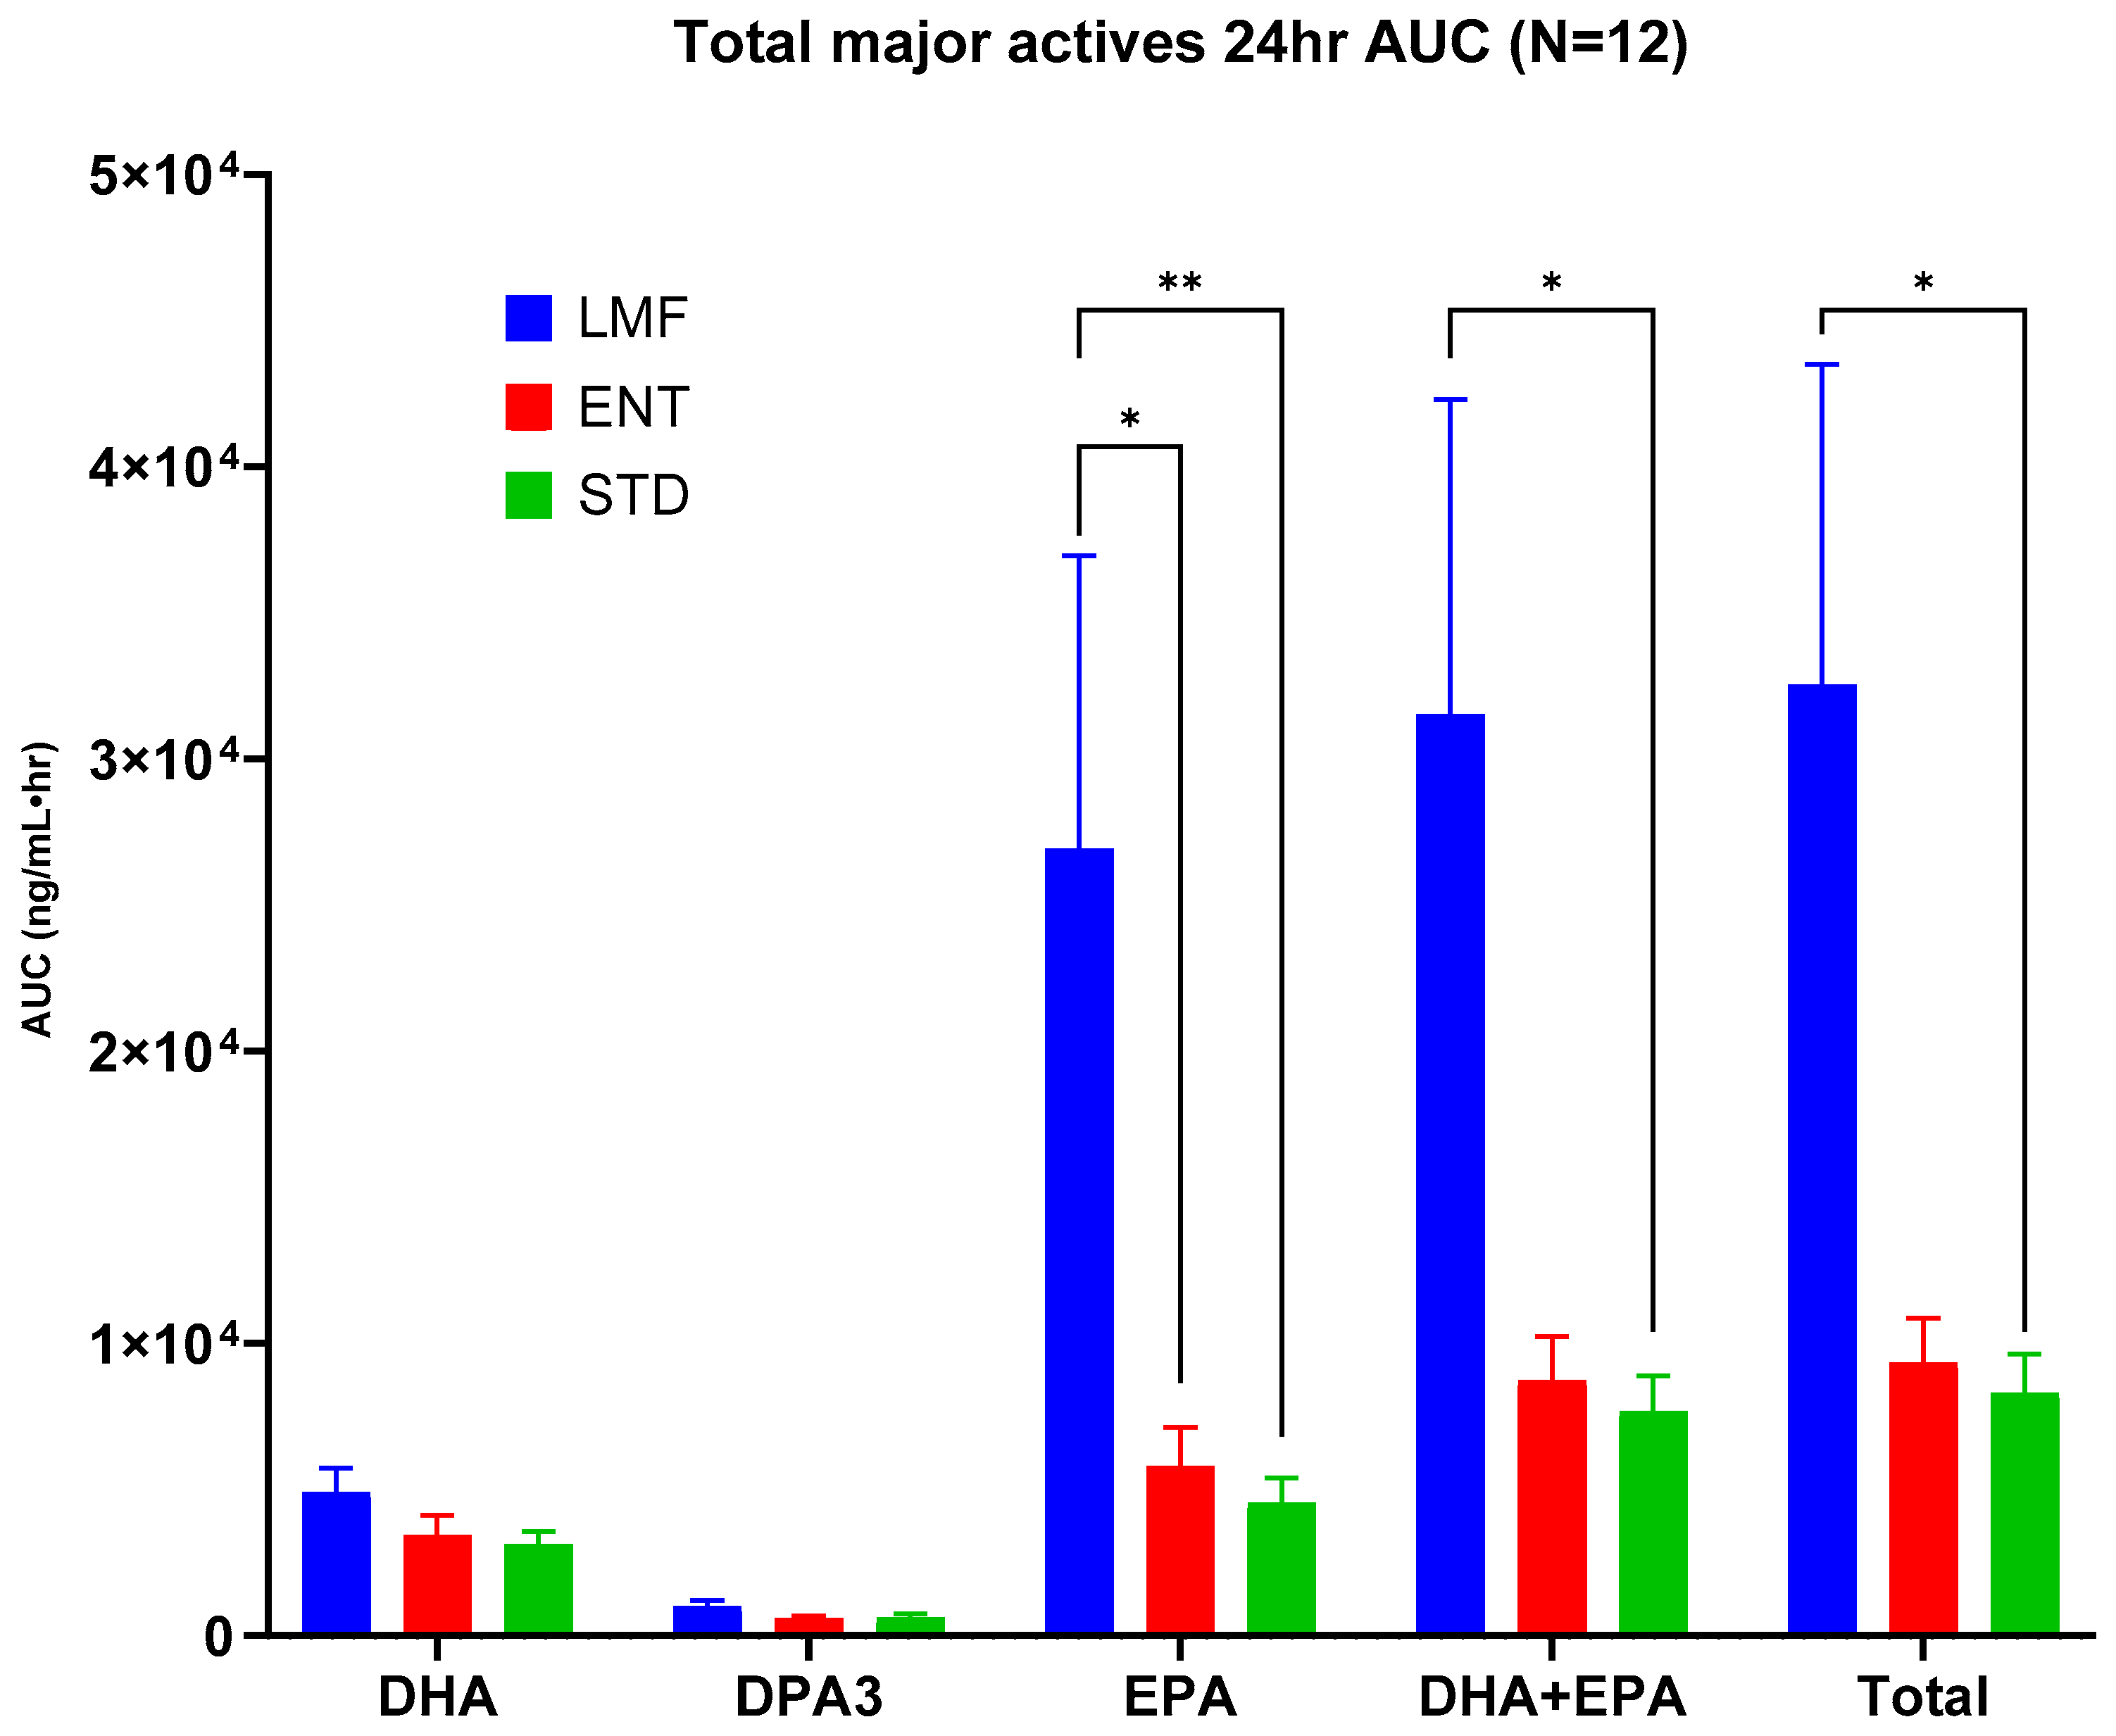
The average blood concentrations over time for the n-3 FAs such as DHA, EPA, and DPA3 following the oral administration of each treatment were analyzed and expressed as bar graphs (Figure 3). Of notable interest was the AUC0-24 for LMF, which had the highest total blood concentration of total actives and was up to 4-fold higher compared to the other treatments (Table 5). While the DHA and DPA3 concentrations do not differ significantly among the treatment groups, the EPA blood concentrations are up to ~ 5 times higher in the LMF group compared with those of the ENT group and ~ 6 times higher than those of the STD group (Figure 3 and Table 5).
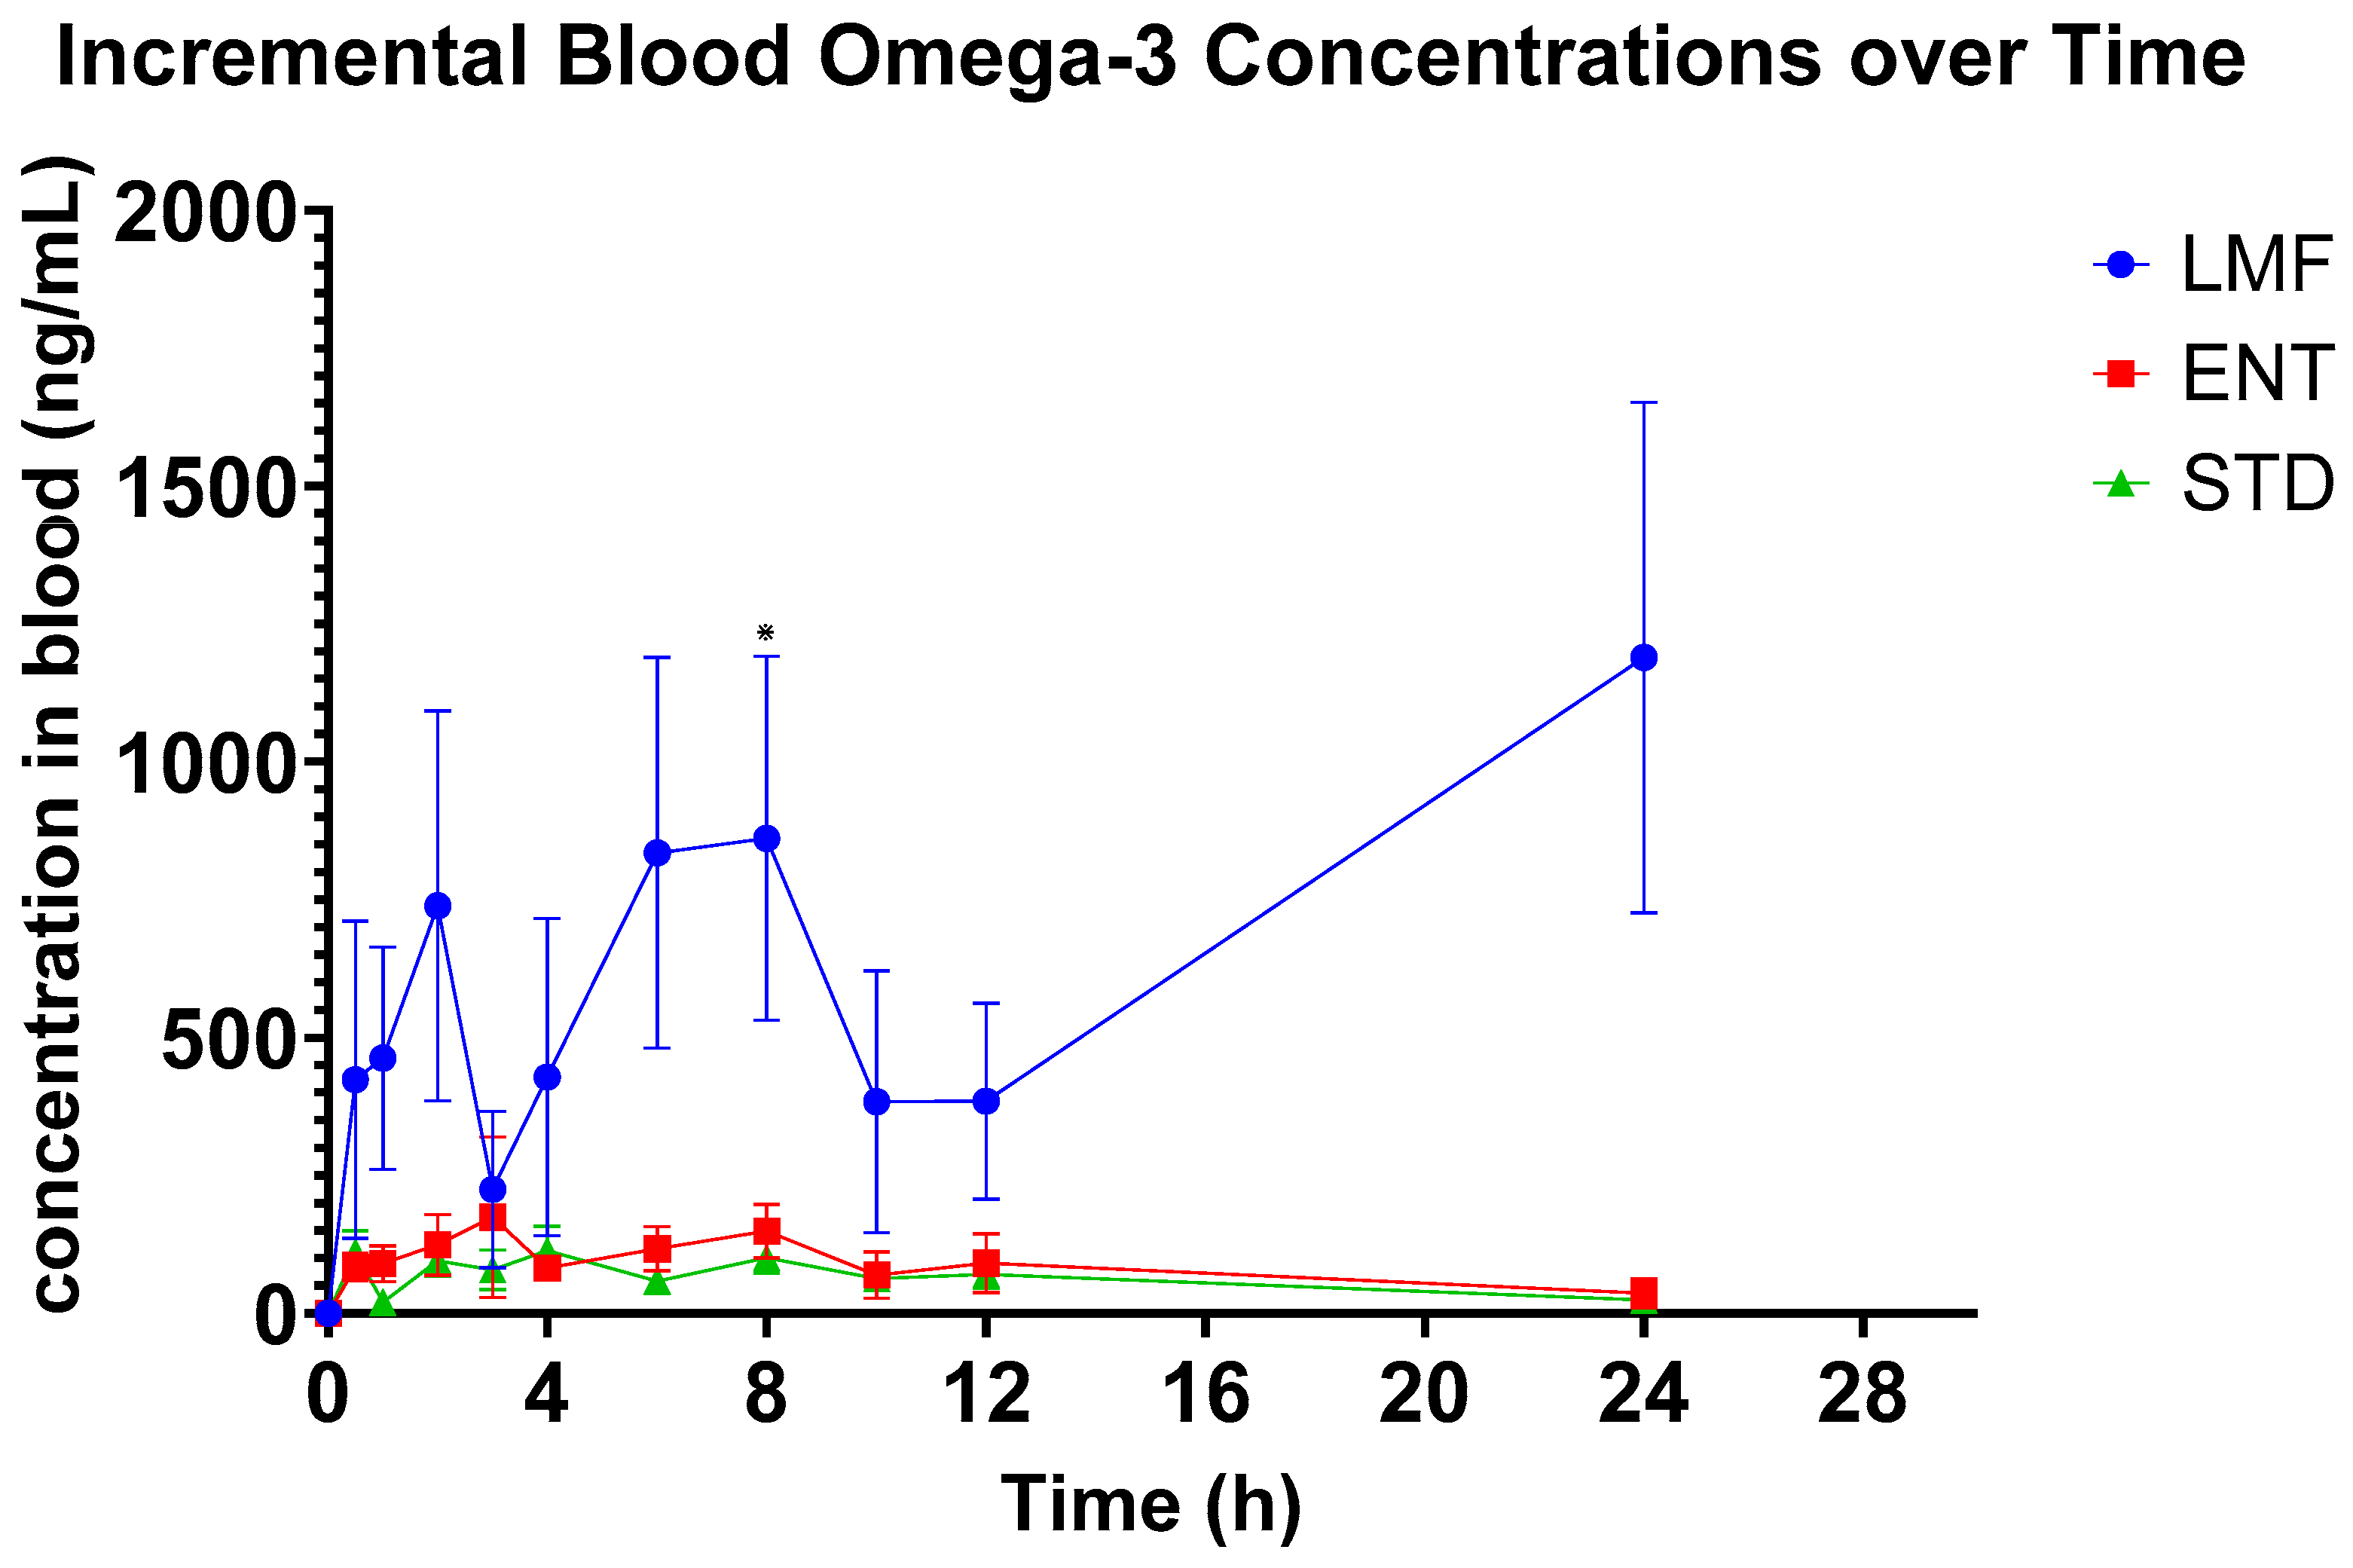
When measured incrementally, with baseline subtracted, LMF achieved up to 8- and 11-fold higher blood concentrations of total n-3 FAs, i.e., iAUC of EPA/DHA/DPA3, compared to ENT and STD, respectively (Figure 4 and Table 6). Notably, as opposed to the other treatments, LMF achieved peak concentrations at 10 h (Tmax; Table 6). Both STD and ENT treatments displayed more gradual and stable blood concentrations (Figure 4) with peak levels at ~4 h and 5 h, respectively (Tmax; Table 6). In comparison, LMF illustrated an early peak after 2 h, suggesting a more rapid absorption, as well as later peaks at 6 and 8 h (Figure 4), likely resulting from the lunch at 4 h, which may suggest a release from intestinal epithelial cells where n-3 FAs may have been stored [30].
Furthermore, LMF still showed higher blood concentrations at 24 h compared to the non-micellar formulation, STD and ENT (Figure 4).

3.3. Blood Concentrations of Metabolites

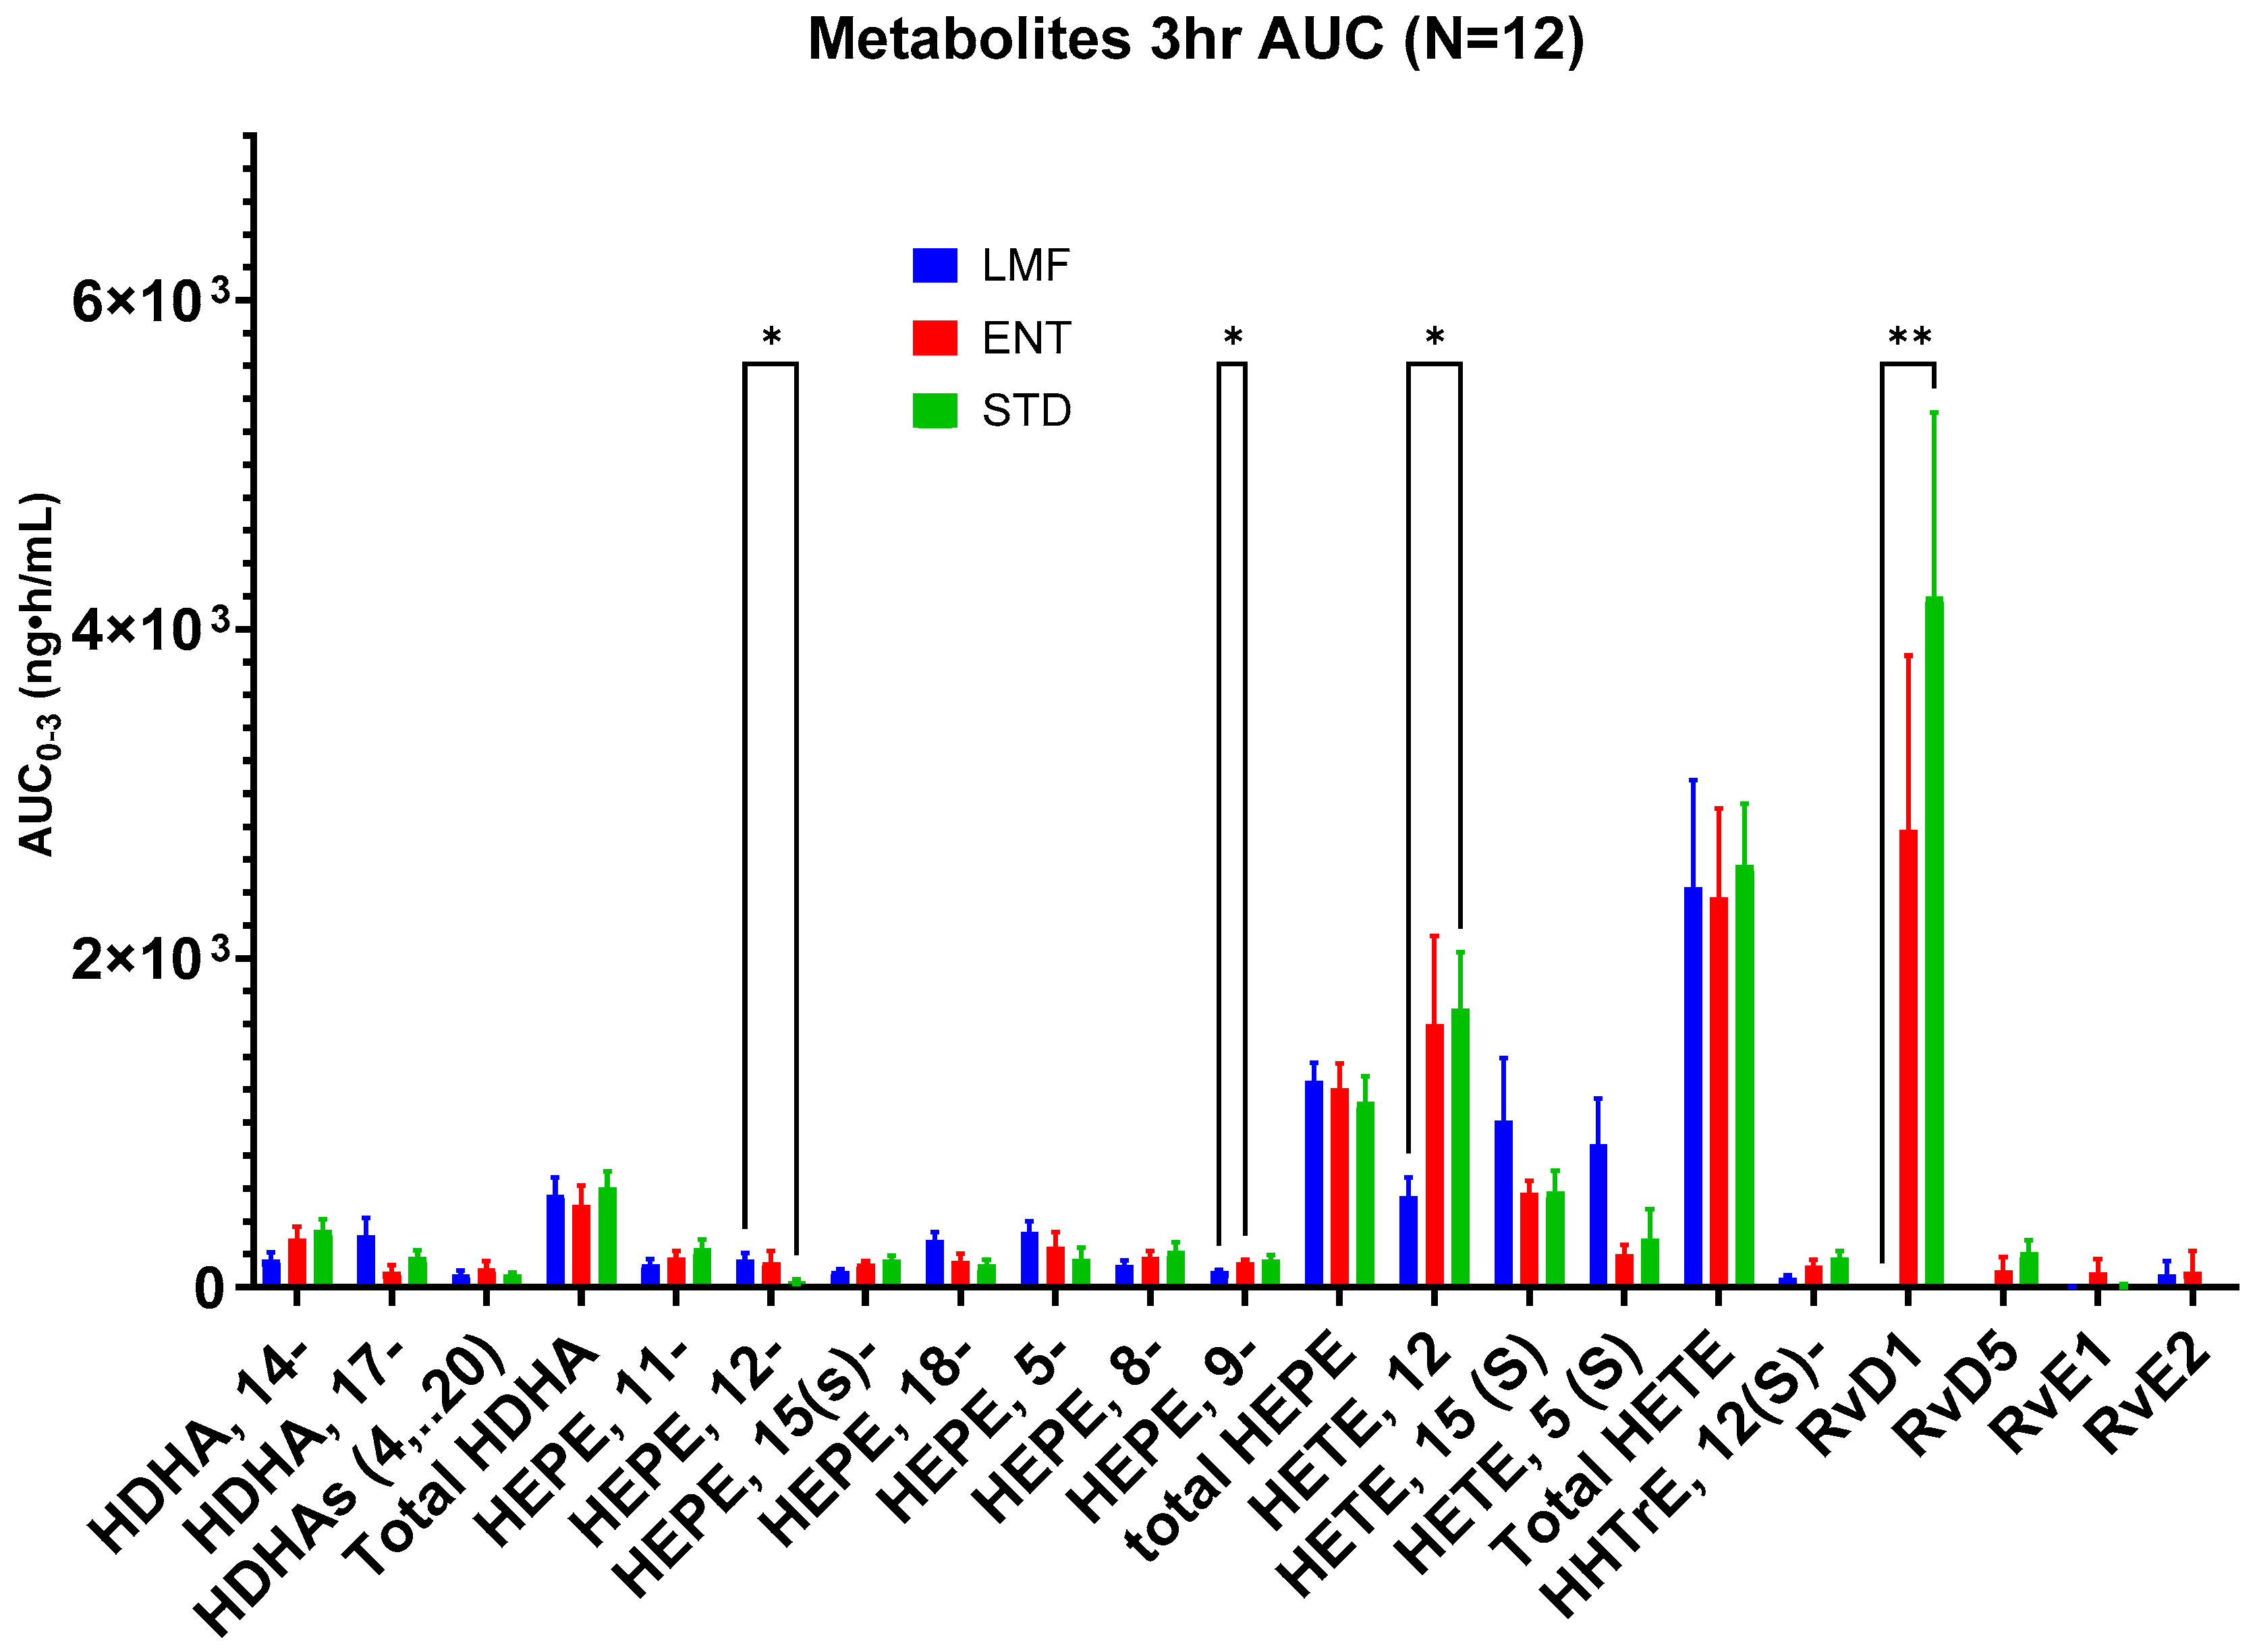
Blood concentrations of 17 individual metabolites were analyzed over the first 3 h and 24 h (Figure 5 and Figure 6). Significant differences were found between STD and LMF over the first 3 h with respect to 12-HEPE, 12-HETE, and RvD1; 9-HEPE levels were significantly higher following the STD vs. ENT treatment (Table 7).
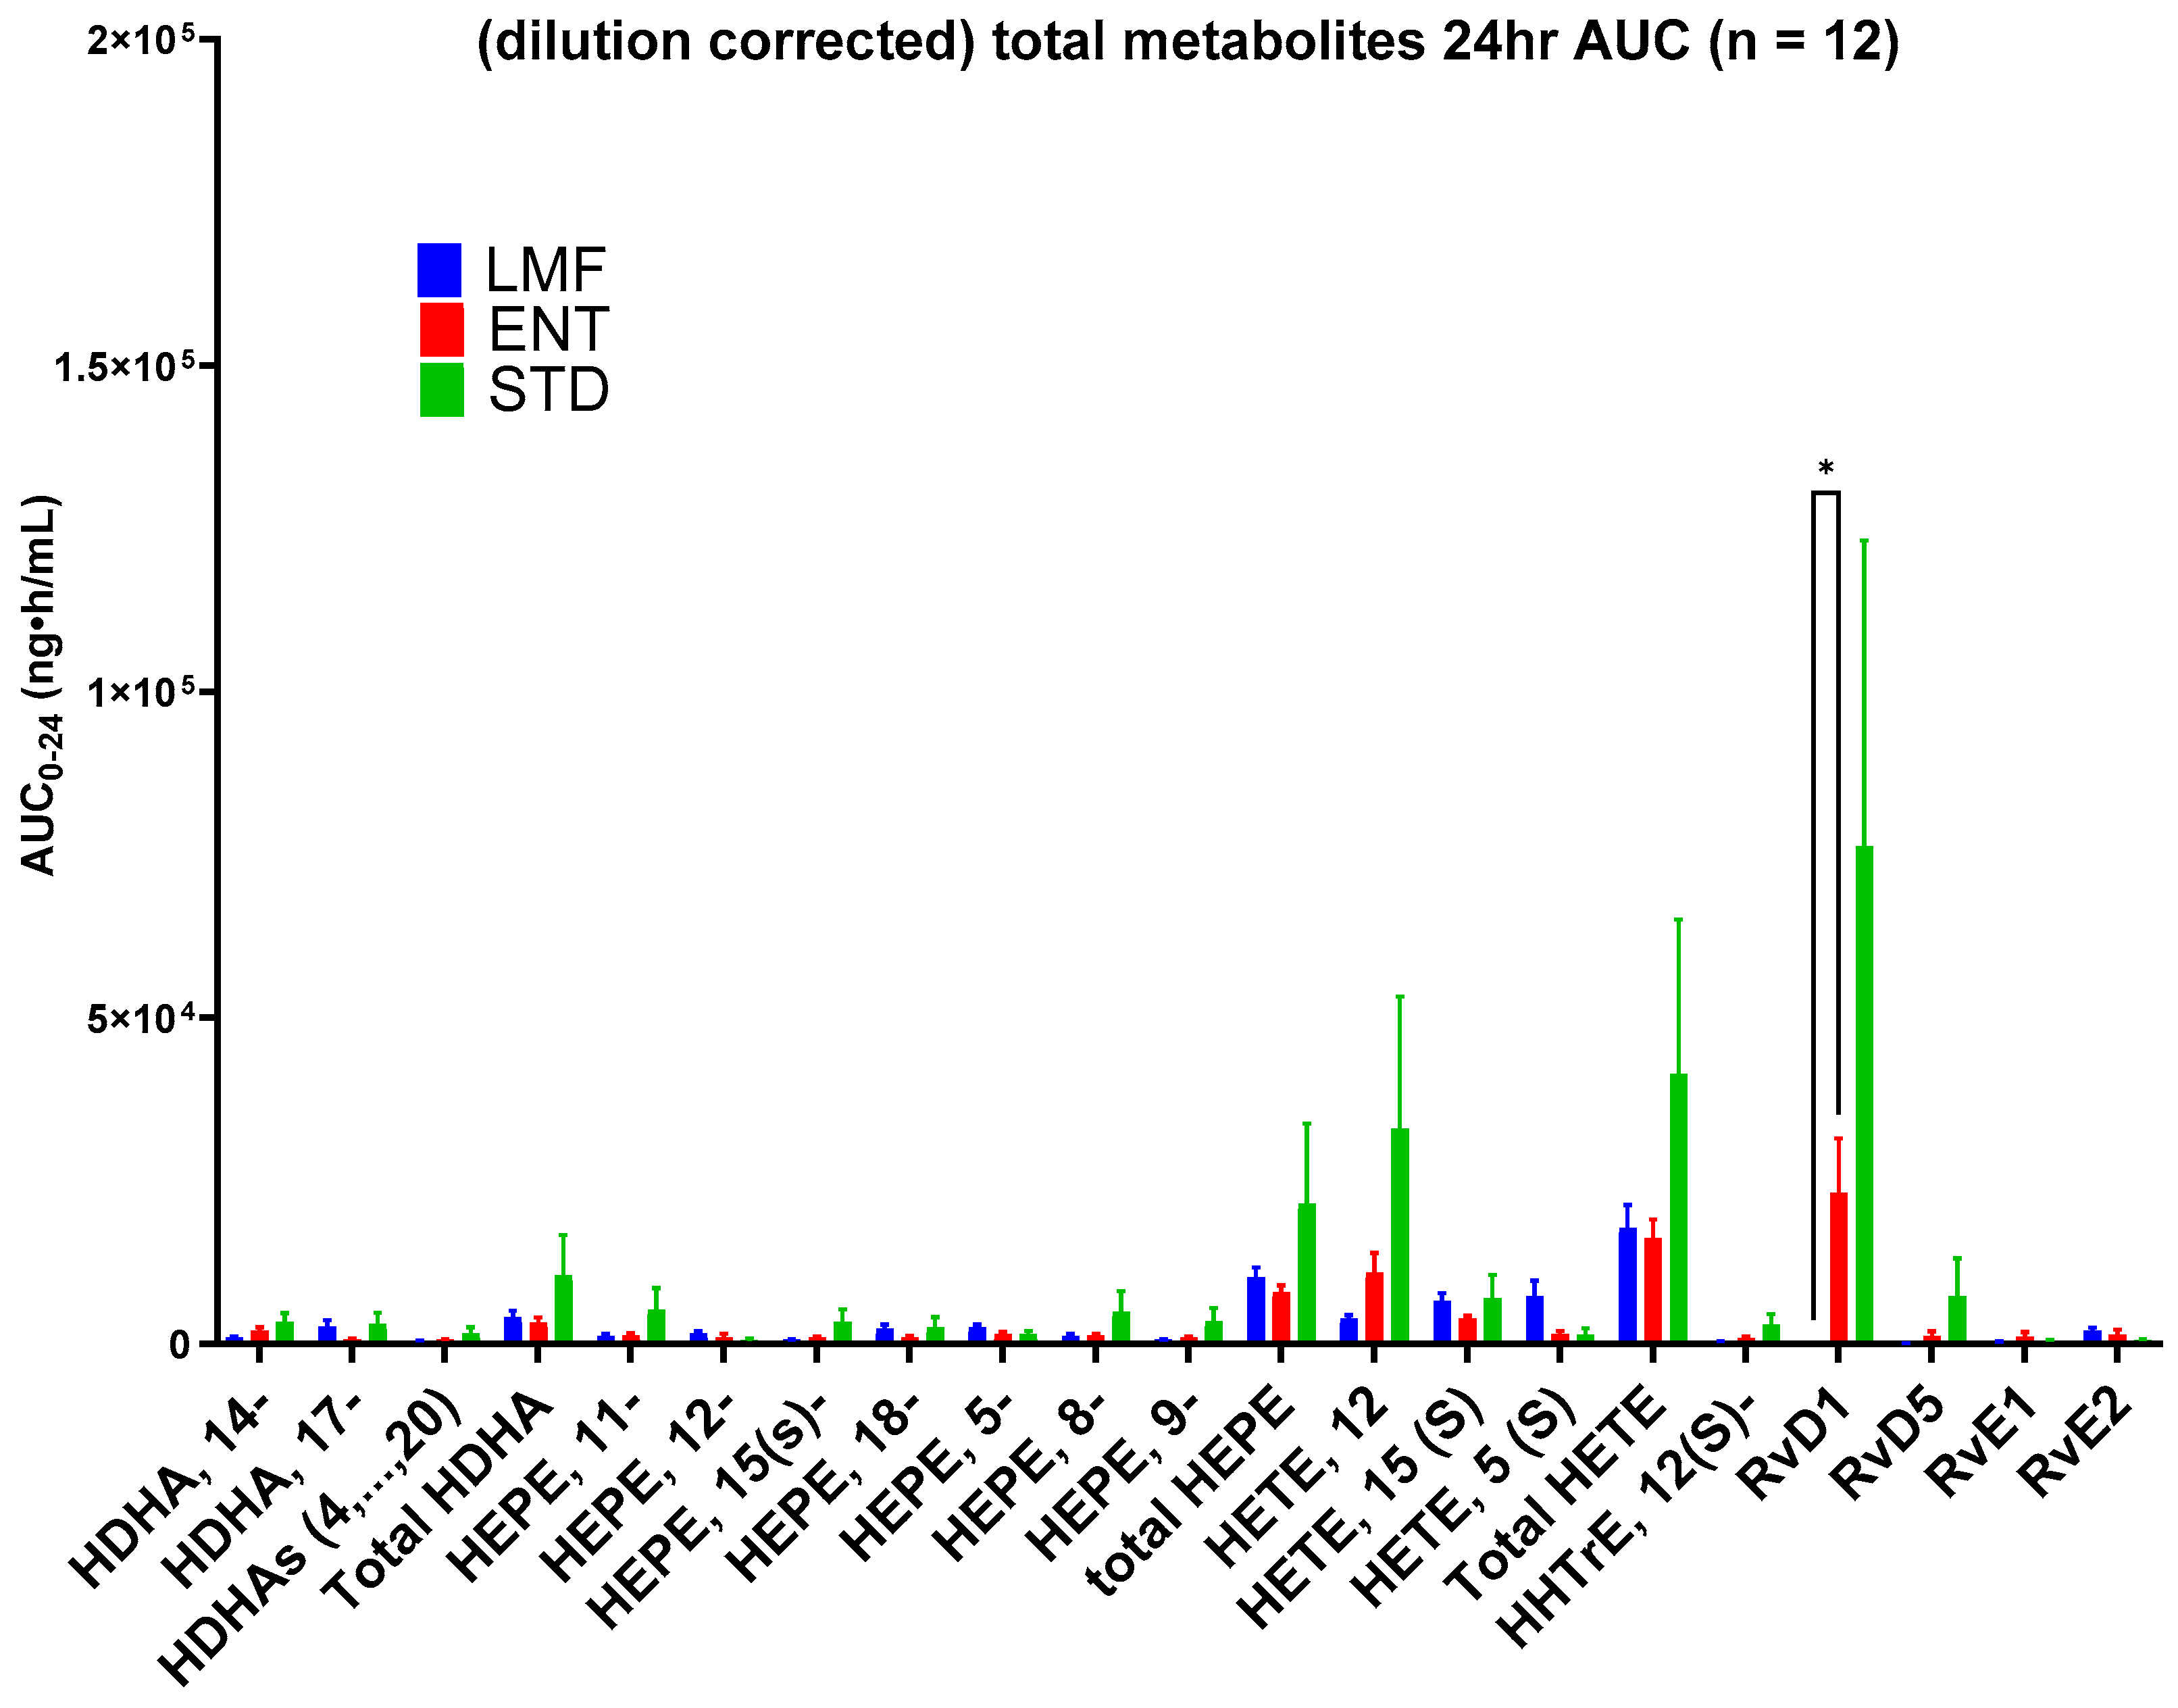
While the blood concentrations of most of the metabolites were consistently found to be relatively low after 24 h, significant differences were only found with the mean AUC0-24 of RvD1, with the highest concentrations of this metabolite being observed after STD treatment (Table 8). The most considerable difference was found between LMF and the other treatments where there were significantly lower concentrations of RvD1.
Although not significant, STD demonstrated the highest average AUC0-24 in terms of the total metabolites: HDHA, HETE, and HEPE, as well as HHTrHe.

3.4. Blood Lipids

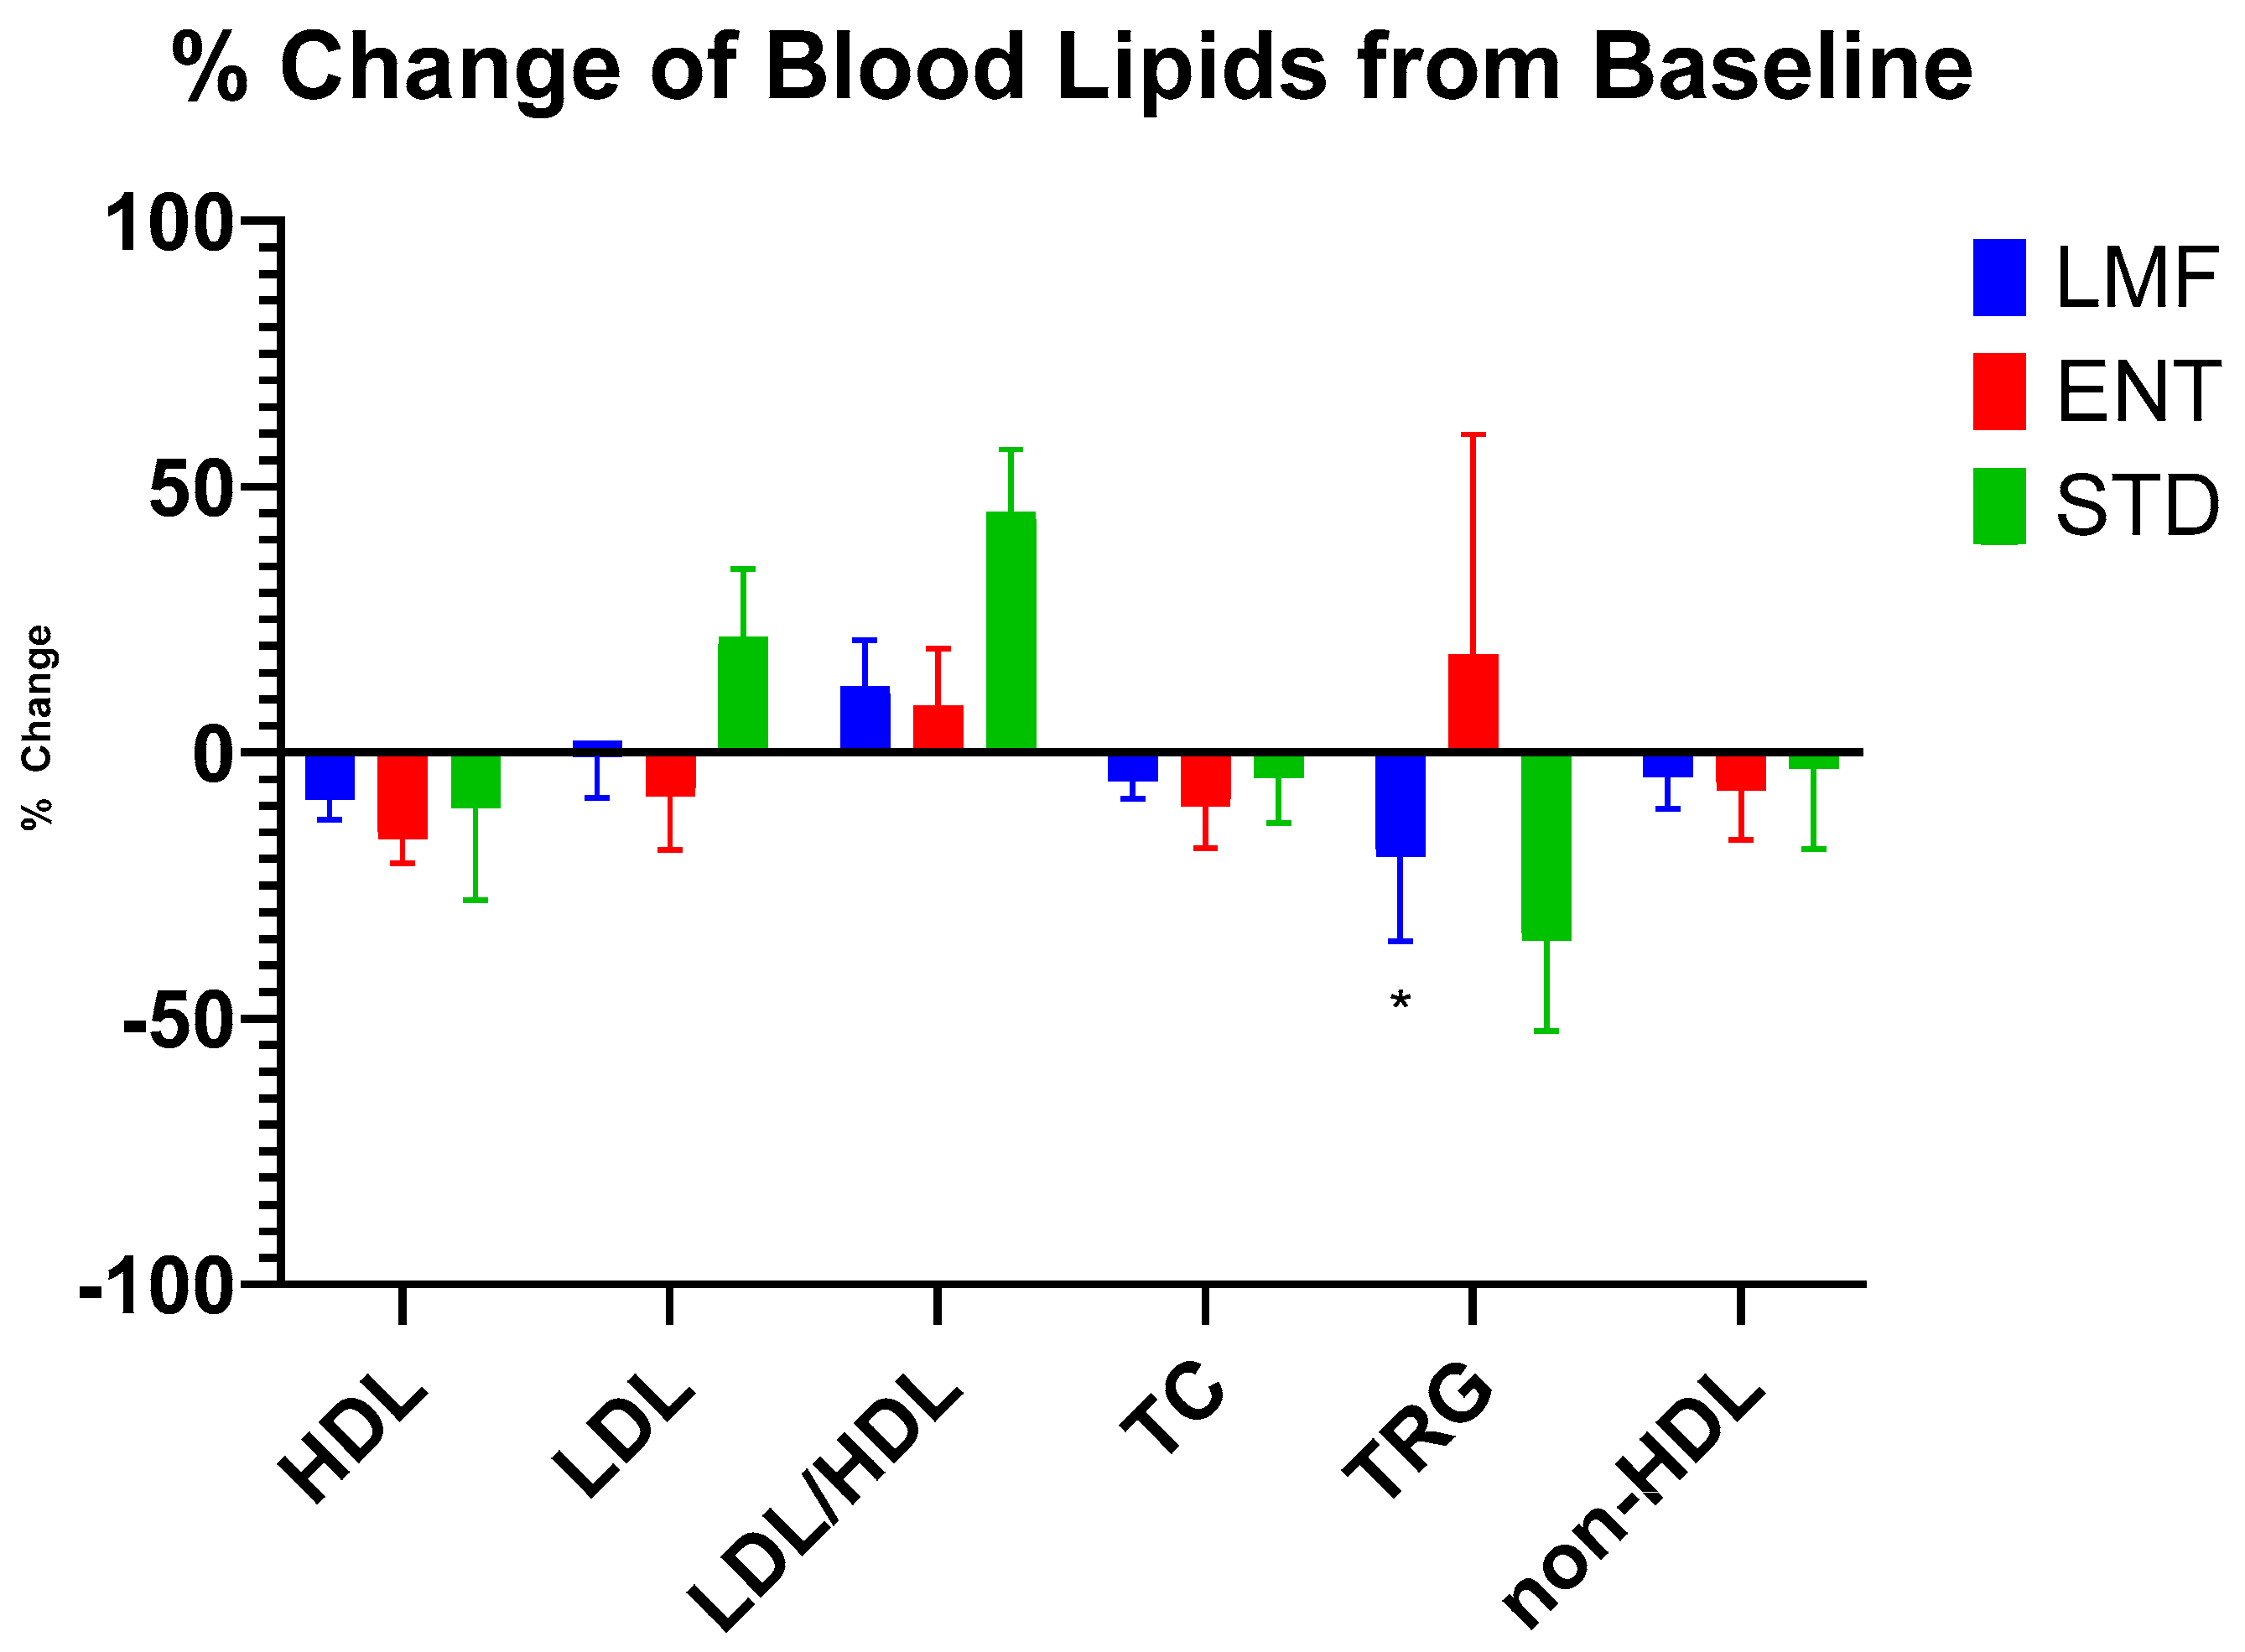
The blood lipids were analyzed with respect to HDL cholesterol, LDL cholesterol, LDL/HDL ratio, total cholesterol (TC), triglycerides (TRG), and non-HDL cholesterol. Figure 7 compares the aggregate participant results for each treatment after five days. After five consecutive days (120 h) of LMF treatment, participants showed a significant reduction in serum triglycerides (−19.5%; p ≤ 0.01) when compared against their individual Time 0 values. The other blood lipid parameters did not show any significant changes (Figure 7). STD and ENT did not produce any significant changes in the blood parameters of participants after 5 days.
Tables S2–S8 present the detailed serum lipid parameters results on a day-by-day basis. Significant changes from baseline values were observed mostly in TRG values where LMF treatment at 48, 72, 96, and 120 h showed consistent significant decreases. The changes for the other two treatments were more transient, with STD treatment showing a one-time significant decrease at 48 h, and ENT treatment at 12 h.
HDL, LDL, LDL/HDL ratio, TC, and non-HDL cholesterol did not show any significant changes from the baseline when the data were analyzed based on each treatment (Tables S3–S7). However, when the data from all three treatments were aggregated together, HDL showed significant decreases at 6, 12, 24, and 120 h. LDL showed a significant decrease at 12 h. The LDL/HDL ratio showed a significant increase at 120 h, TC showed a significant decrease at 96 h, and TRG showed a significant increase at 12 h.

3.5. Side Effects

A safety survey was performed to assess any adverse events which occurred during the study. No side effects were reported during the study.

4. Discussion

The primary goal of this study was to establish pharmacokinetic parameters and analyze the metabolite profiles of different Omega-3 formulations in human participants over a 24 hr study period. Results showed that a micellar formulation (LipoMicel, LMF) of microencapsulated n-3 FAs achieved the highest total concentrations of DHA, DPA3 and EPA following the oral administration of fish oil softgel capsules. Compared to standard (STD) and enteric-coated (ENT) formulations administered at a higher dose of n-3 FAs (i.e., 600 mg vs 374 mg), LMF achieved significantly higher AUC0-24 of EPA (approx. five to seven times higher than the other treatments), and when measured incrementally, up to 11 times higher blood concentrations of total n-3 FAs (EPA/DHA/DPA3).
These results are similar to the approximately three-fold improvement in absorption found in another randomized trial on DHA and EPA formulated in a self-emulsifying delivery system called PhytoMarineCelle (PM). At a dosage of 500 mg, the AUC0-24 for PM was 106.62 ± 1.92 µg·h /mL for EPA, 79.53 ± 2.32 µg·h /mL for DHA and 186 ± 1.67 µg·h /mL for EPA+DHA [43]. Another study investigating the effects of administering 4.5 g microencapsulated EPA-rich fish oils over 24 h reported an approximated 10 times increase in AUC0-24 compared to standard fish oil capsules, from 2 ± 1.4 mg·h /100 mL to 19.7 ± 4.3 mg·h /100 mL, proposing that the finely dispersed oil droplets of the microencapsulated fish oil are easier to break down by lipase [44]. Given that the dispersion of fat globules is a prerequisite for the digestion of lipids, the ingestion of a lipid microemulsion such as that created by LMF serves to simplify this physiological process, allowing for better digestion and absorption of n-3 FAs [32]. The significantly larger difference in the AUC0-24 for EPA in LMF as compared to the other formulations may be enough to consider it a major rich source of supplementary EPA—with potentially greater health benefits for humans. Studies have revealed that 26 weeks of continued supplementation with EPA-rich oil can lead to improved overall cognitive function in terms of speed and accuracy, especially in the case of healthy young adults [45].
While the AUC0-24 of DHA was almost 1.5 times higher in LMF than the other formulations, although not significant, its overall concentration across all three formulations was significantly lower than its counterpart, EPA. Studies have shown that DHA is more susceptible to oxidation than EPA, and this may in effect contribute to its reduced absorption in the gastrointestinal tract. However, those same studies also highlighted that the ratio of EPA to DHA may also play a factor in the stability of the FA mixture. A 1:1 ratio of EPA:DHA is more stable in the stomach because it results in less conjugated dienes. Consequently, a more balanced ratio of the two n-3 FAs may lead to a higher resistance to oxidation [46]. Hence, the 2:1.5 ratio of EPA:DHA in LMF compared to the 2:1 ratio in the other two formulations may be a contributing factor to its better performance.
LMF, which provides a microemulsion of n-3 FAs, was demonstrated to have the highest bioavailability among the formulations tested in this study. One possible explanation may be that microemulsions, characterized as colloidal systems comprising oil and water phases stabilized by surfactants, enhance the solubility and dispersibility of lipophilic substances such as Omega-3 fatty acids in the gastrointestinal tract [47]. Furthermore, the smaller droplet size and uniform dispersion of Omega-3 fatty acids within the oil phase of microemulsions may amplify the available surface area for interactions with digestive enzymes, thereby promoting both the rate and extent of absorption [48]. Enteric coatings of formulations like ENT, on the other hand, are designed to delay the release of contents until they reach the small intestine, but the dispersion of the oil within the capsule may not be as uniform, potentially affecting absorption.
EPA and DHA are considered generally safe for long-term consumption at combined doses of up to about 5 g/day [49,50]. With LMF providing a lower dose of EPA and DHA per capsule but showing higher bioavailability, a corresponding lower therapeutic dose or different dosing regimen may be used compared to standard treatment.
Interestingly, as observed in this study, even after 24 h post-dose, LMF still showed significantly greater blood concentrations of n-3 FAs (Figure 4). The prolonged presence of n-3 FAs in the bloodstream 24 h after administration with a microemulsion formulation suggests a preferential release of n-3 FAs such as EPA from the liver back into the bloodstream. This is a common phenomenon that has been observed in other studies as well as mentioned by Aarak et al. [51]. Due to the lipophilic nature of n-3 fatty acids, they may integrate into lipid-rich compartments within cells or tissues. Therefore, one of the limitations of this study is that a more extended observation period would have been essential to attain a more comprehensive understanding of the metabolic trajectory of n-3 fatty acids as formulated in LMF.
In terms of the metabolite profiles, although LMF had the highest bioavailability based on significantly higher AUCs of total n-3 FAs, i.e., EPA, DHA and DPA3, it did not show significant blood concentrations of the total EPA and DHA-derived metabolites after 24 h. This was likely due to a delayed metabolism of LMF (microencapsulated fish oil n-3 FA) as illustrated in Figure 4. Accordingly, a longer study period (>24 h) should be applied in follow-up studies. Chuang et al. observed a similar seemingly delayed fatty acid metabolism in their 24 h study on a lipid-based delivery system [43]. Therefore, in this study, only a few significant differences in the metabolite concentrations were observed between LMF and the other treatments—most of these were observed within the first 3 h. For instance, LMF showed significantly lower concentrations of 12-HETE compared to STD. Lower concentrations of 12-HETE, a specific oxylipin derived from the oxidation of arachidonic acid, can be seen as a positive effect, as studies have linked higher concentrations of 12-HETE to cancer cell proliferation and the metastasis of tumor cells [52,53,54].
The only significant increase following LMF treatment compared to STD was noticed in 12-HEPE (approx. five times greater AUC0-3). 12-HEPE may be a key n-3 metabolite in glucose metabolism, as certain studies have shown that production of this metabolite is repressed in obese subjects [55]. Shaikh et al. highlighted studies which demonstrated that increase in 12-HEPE can improve the uptake of glucose into skeletal muscle and brown adipose tissue, consequently leading to improved glucose tolerance, an important benefit for diabetics [56]. However, future studies are yet needed to further understand the overall role 12-HEPE plays in glucose regulation and its potential benefits to those with glucose intolerance.
Additionally, in this study, changes in blood lipids (e.g., cholesterol, LDL and HDL) were monitored in participants up to 120 h (or five days) post-treatment. No significant changes were observed from the baseline, except for those observed in the serum triglycerides (~20% reduction), following the LMF treatment. A previous study by Balk et al. examining the effects of fish oil consumption in 21 different trials ranging from 7 to 104 weeks found that consistent intake of n-3 FAs produced an average reduction in serum triglycerides by about 27 mg/dL. Furthermore, they observed that this decrease in triglycerides was concurrently linked to a modest increase in LDL (6 mg/dL) and HDL (1.6 mg/dL) cholesterol; however, the increase in HDL and LDL levels are moderate enough that they do not pose a sufficient independent risk to cardiovascular health. The study also showed that n-3 FAs had no significant effect on total cholesterol [57]. In our study we observed a similar significant decrease in serum triglycerides (0.32 mmol/L). However, given that this was only a pilot investigation into the effects of n-3 FAs on blood lipids with a very small or limited sample size, a future investigation would benefit from having an increased sample size and a longer observation period.
This research concludes that, of the three formulations analyzed in this study, LMF demonstrated the highest absorption of total n-3 FAs i.e., DHA, DPA3 and EPA. Its formulation as a lipid microemulsion delivery system may well be the key factor contributing to its high absorption. Studies into the absorption of n-3 FAs in an emulsified state found that delivering n-3 FAs in this form increased the surface area of the oil, allowing for increased access for digestion lipases, thus leading to improved absorption. Those same studies showed that the AUC0-24 of total EPA and DHA was 6.1 times higher in the lipid emulsion formulation than in the regular unformulated oil [58].
A strength of the current study is the comprehensive investigation into both the PKs of n-3 FAs as well as their metabolites. However, as previously mentioned, one limitation of this study is that a longer observation period should have been applied due to the higher bioavailability of LMF, which still showed significantly higher n-3 FA blood concentrations at 24 h compared to the other, non-micellar, treatments. Considering the delayed metabolism of LMF, future studies may incorporate this factor by extending the observation period or adjusting the dosing regimen accordingly.

Supplementary Materials

The following supporting information can be downloaded at: https://www.mdpi.com/article/10.3390/metabo14050265/s1, Table S1: HRMS data extraction parameters for n-3 FA and their metabolites; Figure S1: LC-HRMS chromatograms of n-3 FA and their metabolites; Figure S2: LC-HRMS chromatograms of n-3 FA and their metabolites in participants’ blood samples; Table S2: Serum triglycerides at various time points during treatment; Table S3: Blood HDL at various time points during treatment; Table S4: Blood LDL at various time points during treatment; Table S5: Blood LDL/HDL Ratio at various time points during treatment; Table S6: Blood TC at various time points during treatment; Table S7: Blood non-HDL cholesterol at various time points during treatment; Table S8: Serum lipid parameters combining all treatments.

Author Contributions

Conceptualization, C.C. and J.S.; methodology, C.C., J.S., Y.C.K., Y.Z. and Y.S.R.; formal analysis, Y.C.K., Y.Z. and Y.S.R.; investigation, Y.C.K., Y.Z. and Y.S.R.; resources, C.C. and R.G.; data curation, A.I., Y.C.K., Y.Z. and Y.S.R.; writing—original draft preparation, A.I.; writing—review and editing, A.I., Y.C.K., Y.Z., Y.S.R., M.D., M.H., J.S. and C.C.; visualization, A.I., Y.C.K., Y.Z. and Y.S.R.; supervision, C.C. and J.S.; project administration, A.I., J.S. and C.C.; funding acquisition, C.C. All authors have read and agreed to the published version of the manuscript.

Funding

No external funding was provided for this study. Open access funding was provided by ISURA’s research fund as part of its non-profit mandate. The Factors Group of Nutritional Companies supplied the LipoMicel™ and enteric softgel samples for research and testing.

Institutional Review Board Statement

The study was conducted in accordance with the Declaration of Helsinki and approved by the Institutional Review Board (or Ethics Committee) of Canadian SHIELD Ethics Review Board (OHRP Registration IORG0003491; FDA Registration IRB00004157; Approval letter ID 2021-10-002, date of approval: 28 February 2022).

Informed Consent Statement

Written informed consent was obtained from all subjects involved in the study. Written informed consent has been obtained from the patients to publish this paper.

Data Availability Statement

The original contributions presented in the study are included in the article, further inquiries can be directed to the corresponding authors.

Acknowledgments

LipoMicel® is the registered trademark of Natural Factors Group.

Conflicts of Interest

The authors A.I., C.C., Y.Z., Y.C.K., M.D., Y.S.R., and J.S. are employees of Isura. Isura is a not-for-profit organization. RG is the owner of the Factors Group of Companies. MH is on the ISURA Scientific Advisory Committee. The authors declare no other conflicts of interest. Patent Pending for LipoMicel Matrix—Eutetic Matrix for Nutraceutical Compositions lists inventors as: R.G., Y.C.K., and C.C. No inventor benefits from this, and the ownership belongs to InovoBiologic Inc.

References

  1. Djuricic, I.; Calder, P.C. Beneficial Outcomes of Omega-6 and Omega-3 Polyunsaturated Fatty Acids on Human Health: An Update for 2021. Nutrients 2021, 13, 2421. [Google Scholar] [CrossRef] [PubMed]
  2. Dietary Supplement Use among Adults: United States, 2017–2018. Available online: https://www.cdc.gov/nchs/products/databriefs/db399.htm (accessed on 29 November 2023).
  3. Khan, S.U.; Lone, A.N.; Khan, M.S.; Virani, S.S.; Blumenthal, R.S.; Nasir, K.; Miller, M.; Michos, E.D.; Ballantyne, C.M.; Boden, W.E.; et al. Effect of Omega-3 Fatty Acids on Cardiovascular Outcomes: A Systematic Review and Meta-Analysis. eClinicalMedicine 2021, 38, 100997. [Google Scholar] [CrossRef] [PubMed]
  4. Welty, F.K. Omega-3 Fatty Acids and Cognitive Function. Curr. Opin. Lipidol. 2023, 34, 12–21. [Google Scholar] [CrossRef] [PubMed]
  5. Weiser, M.J.; Butt, C.M.; Mohajeri, M.H. Docosahexaenoic Acid and Cognition throughout the Lifespan. Nutrients 2016, 8, 99. [Google Scholar] [CrossRef] [PubMed]
  6. Yurko-Mauro, K.; Kralovec, J.; Bailey-Hall, E.; Smeberg, V.; Stark, J.G.; Salem, N. Similar Eicosapentaenoic Acid and Docosahexaenoic Acid Plasma Levels Achieved with Fish Oil or Krill Oil in a Randomized Double-Blind Four-Week Bioavailability Study. Lipids Health Dis. 2015, 14, 99. [Google Scholar] [CrossRef] [PubMed]
  7. Wang, C.; Harris, W.S.; Chung, M.; Lichtenstein, A.H.; Balk, E.M.; Kupelnick, B.; Jordan, H.S.; Lau, J. N−3 Fatty Acids from Fish or Fish-Oil Supplements, but Not α-Linolenic Acid, Benefit Cardiovascular Disease Outcomes in Primary- and Secondary-Prevention Studies: A Systematic Review2. Am. J. Clin. Nutr. 2006, 84, 5–17. [Google Scholar] [CrossRef]
  8. Gerster, H. Can Adults Adequately Convert Alpha-Linolenic Acid (18:3n-3) to Eicosapentaenoic Acid (20:5n-3) and Docosahexaenoic Acid (22:6n-3)? Int. J. Vitam. Nutr. Res. 1998, 68, 159–173. [Google Scholar] [PubMed]
  9. Byelashov, O.A.; Sinclair, A.J.; Kaur, G. Dietary Sources, Current Intakes, and Nutritional Role of Omega-3 Docosapentaenoic Acid. Lipid Technol. 2015, 27, 79–82. [Google Scholar] [CrossRef]
  10. Ferreira, I.; Falcato, F.; Bandarra, N.; Rauter, A.P. Resolvins, Protectins, and Maresins: DHA-Derived Specialized Pro-Resolving Mediators, Biosynthetic Pathways, Synthetic Approaches, and Their Role in Inflammation. Molecules 2022, 27, 1677. [Google Scholar] [CrossRef]
  11. Roh, J.; Go, E.J.; Park, J.-W.; Kim, Y.H.; Park, C.-K. Resolvins: Potent Pain Inhibiting Lipid Mediators via Transient Receptor Potential Regulation. Front. Cell Dev. Biol. 2020, 8, 584206. [Google Scholar] [CrossRef]
  12. Park, J.; Roh, J.; Pan, J.; Kim, Y.H.; Park, C.-K.; Jo, Y.Y. Role of Resolvins in Inflammatory and Neuropathic Pain. Pharmaceuticals 2023, 16, 1366. [Google Scholar] [CrossRef] [PubMed]
  13. Elajami, T.K.; Colas, R.A.; Dalli, J.; Chiang, N.; Serhan, C.N.; Welty, F.K. Specialized Proresolving Lipid Mediators in Patients with Coronary Artery Disease and Their Potential for Clot Remodeling. FASEB J. 2016, 30, 2792–2801. [Google Scholar] [CrossRef] [PubMed]
  14. Bouhadoun, A.; Manikpurage, H.D.; Deschildre, C.; Zalghout, S.; Dubourdeau, M.; Urbach, V.; Ho-Tin-Noe, B.; Deschamps, L.; Michel, J.-B.; Longrois, D.; et al. DHA, RvD1, RvD5, and MaR1 Reduce Human Coronary Arteries Contractions Induced by PGE2. Prostaglandins Other Lipid Mediat. 2023, 165, 106700. [Google Scholar] [CrossRef] [PubMed]
  15. Uno, H.; Furukawa, K.; Suzuki, D.; Shimizu, H.; Ohtsuka, M.; Kato, A.; Yoshitomi, H.; Miyazaki, M. Immunonutrition Suppresses Acute Inflammatory Responses through Modulation of Resolvin E1 in Patients Undergoing Major Hepatobiliary Resection. Surgery 2016, 160, 228–236. [Google Scholar] [CrossRef] [PubMed]
  16. Serhan, C.N.; Levy, B.D. Resolvins in Inflammation: Emergence of the pro-Resolving Superfamily of Mediators. J. Clin. Investig. 2018, 128, 2657–2669. [Google Scholar] [CrossRef] [PubMed]
  17. Yamaguchi, A.; Botta, E.; Holinstat, M. Eicosanoids in Inflammation in the Blood and the Vessel. Front. Pharmacol. 2022, 13, 997403. [Google Scholar] [CrossRef]
  18. Lee, C.-Y.J.; Seet, R.C.S.; Huang, S.H.; Long, L.H.; Halliwell, B. Different Patterns of Oxidized Lipid Products in Plasma and Urine of Dengue Fever, Stroke, and Parkinson’s Disease Patients: Cautions in the Use of Biomarkers of Oxidative Stress. Antioxid. Redox Signal. 2009, 11, 407–420. [Google Scholar] [CrossRef] [PubMed]
  19. Praticò, D.; Zhukareva, V.; Yao, Y.; Uryu, K.; Funk, C.D.; Lawson, J.A.; Trojanowski, J.Q.; Lee, V.M.-Y. 12/15-Lipoxygenase Is Increased in Alzheimer’s Disease. Am. J. Pathol. 2004, 164, 1655–1662. [Google Scholar] [CrossRef] [PubMed]
  20. Deol, P.; Fahrmann, J.; Yang, J.; Evans, J.R.; Rizo, A.; Grapov, D.; Salemi, M.; Wanichthanarak, K.; Fiehn, O.; Phinney, B.; et al. Omega-6 and Omega-3 Oxylipins Are Implicated in Soybean Oil-Induced Obesity in Mice. Sci. Rep. 2017, 7, 12488. [Google Scholar] [CrossRef]
  21. Chiang, K.-M.; Chen, J.-F.; Yang, C.-A.; Xiu, L.; Yang, H.-C.; Shyur, L.-F.; Pan, W.-H. Identification of Serum Oxylipins Associated with the Development of Coronary Artery Disease: A Nested Case-Control Study. Metabolites 2022, 12, 495. [Google Scholar] [CrossRef]
  22. Chocholoušková, M.; Jirásko, R.; Vrána, D.; Gatěk, J.; Melichar, B.; Holčapek, M. Reversed Phase UHPLC/ESI-MS Determination of Oxylipins in Human Plasma: A Case Study of Female Breast Cancer. Anal. Bioanal. Chem. 2019, 411, 1239–1251. [Google Scholar] [CrossRef] [PubMed]
  23. Simopoulos, A.P. An Increase in the Omega-6/Omega-3 Fatty Acid Ratio Increases the Risk for Obesity. Nutrients 2016, 8, 128. [Google Scholar] [CrossRef] [PubMed]
  24. Simopoulos, A.P. The Importance of the Ratio of Omega-6/Omega-3 Essential Fatty Acids. Biomed. Pharmacother. 2002, 56, 365–379. [Google Scholar] [CrossRef] [PubMed]
  25. DiNicolantonio, J.J.; O’Keefe, J.H. The Importance of Marine Omega-3s for Brain Development and the Prevention and Treatment of Behavior, Mood, and Other Brain Disorders. Nutrients 2020, 12, 2333. [Google Scholar] [CrossRef] [PubMed]
  26. Saunders, A.V.; Davis, B.C.; Garg, M.L. Omega-3 Polyunsaturated Fatty Acids and Vegetarian Diets. Med. J. Aust. 2013, 199, S22–S26. [Google Scholar] [CrossRef] [PubMed]
  27. Ghasemifard, S.; Turchini, G.M.; Sinclair, A.J. Omega-3 Long Chain Fatty Acid “Bioavailability”: A Review of Evidence and Methodological Considerations. Prog. Lipid Res. 2014, 56, 92–108. [Google Scholar] [CrossRef] [PubMed]
  28. Beckermann, B.; Beneke, M.; Seitz, I. Comparative bioavailability of eicosapentaenoic acid and docasahexaenoic acid from triglycerides, free fatty acids and ethyl esters in volunteers. Arzneimittelforschung 1990, 40, 700–704. [Google Scholar]
  29. Neubronner, J.; Schuchardt, J.P.; Kressel, G.; Merkel, M.; von Schacky, C.; Hahn, A. Enhanced Increase of Omega-3 Index in Response to Long-Term n-3 Fatty Acid Supplementation from Triacylglycerides versus Ethyl Esters. Eur. J. Clin. Nutr. 2011, 65, 247–254. [Google Scholar] [CrossRef]
  30. Wang, T.Y.; Liu, M.; Portincasa, P.; Wang, D.Q.-H. New Insights into the Molecular Mechanism of Intestinal Fatty Acid Absorption. Eur. J. Clin. Investig. 2013, 43, 1203–1223. [Google Scholar] [CrossRef]
  31. Goodman, B.E. Insights into Digestion and Absorption of Major Nutrients in Humans. Adv. Physiol. Educ. 2010, 34, 44–53. [Google Scholar] [CrossRef]
  32. Schuchardt, J.P.; Hahn, A. Bioavailability of Long-Chain Omega-3 Fatty Acids. Prostaglandins Leukot. Essent. Fat. Acids 2013, 89, 1–8. [Google Scholar] [CrossRef] [PubMed]
  33. Albert, B.B.; Cameron-Smith, D.; Hofman, P.L.; Cutfield, W.S. Oxidation of Marine Omega-3 Supplements and Human Health. Biomed. Res. Int. 2013, 2013, 464921. [Google Scholar] [CrossRef] [PubMed]
  34. Shi, J. Chapter 12: Miccroencapsulation and Delivery of Omega-3 Fatty Acids. In Functional Food Ingredients and Nutraceuticals: Processing Technologies; Functional Foods and Nutraceuticals; CRC Press: Boca Raton, FL, USA, 2007; pp. 301–302. ISBN 978-0-8493-2441-3. [Google Scholar]
  35. Park, E.D.; Park, Y.; Park, S.-S.; Suh, H.-J. Absorption Evaluation of Enteric Coated Capsules Containing Omega 3 Fatty Acids. Korean J. Food Nutr. 2012, 25, 1027–1032. [Google Scholar] [CrossRef]
  36. Belluzzi, A. N-3 Fatty Acids for the Treatment of Inflammatory Bowel Diseases. Proc. Nutr. Soc. 2002, 61, 391–395. [Google Scholar] [CrossRef] [PubMed]
  37. Maderuelo, C.; Lanao, J.M.; Zarzuelo, A. Enteric Coating of Oral Solid Dosage Forms as a Tool to Improve Drug Bioavailability. Eur. J. Pharm. Sci. 2019, 138, 105019. [Google Scholar] [CrossRef] [PubMed]
  38. Schneider, I.; Schuchardt, J.P.; Meyer, H.; Hahn, A. Effect of Gastric Acid Resistant Coating of Fish Oil Capsules on Intestinal Uptake of Eicosapentaenoic Acid and Docosahexaenoic Acid. J. Funct. Foods 2011, 3, 129–133. [Google Scholar] [CrossRef]
  39. Garaiova, I.; Guschina, I.A.; Plummer, S.F.; Tang, J.; Wang, D.; Plummer, N.T. A Randomised Cross-over Trial in Healthy Adults Indicating Improved Absorption of Omega-3 Fatty Acids by Pre-Emulsification. Nutr. J. 2007, 6, 4. [Google Scholar] [CrossRef] [PubMed]
  40. Qin, Y.; Nyheim, H.; Haram, E.M.; Moritz, J.M.; Hustvedt, S.O. A Novel Self-Micro-Emulsifying Delivery System (SMEDS) Formulation Significantly Improves the Fasting Absorption of EPA and DHA from a Single Dose of an Omega-3 Ethyl Ester Concentrate. Lipids Health Dis. 2017, 16, 204. [Google Scholar] [CrossRef] [PubMed]
  41. Serafim, V.; Tiugan, D.-A.; Andreescu, N.; Mihailescu, A.; Paul, C.; Velea, I.; Puiu, M.; Niculescu, M.D. Development and Validation of a LC–MS/MS-Based Assay for Quantification of Free and Total Omega 3 and 6 Fatty Acids from Human Plasma. Molecules 2019, 24, 360. [Google Scholar] [CrossRef]
  42. Kutzner, L.; Rund, K.M.; Ostermann, A.I.; Hartung, N.M.; Galano, J.-M.; Balas, L.; Durand, T.; Balzer, M.S.; David, S.; Schebb, N.H. Development of an Optimized LC-MS Method for the Detection of Specialized Pro-Resolving Mediators in Biological Samples. Front. Pharmacol. 2019, 10, 169. [Google Scholar] [CrossRef]
  43. Chuang, J.; Briskey, D.; Dang, J.; Rajgopal, A.; Rao, A. A Randomized Double-Blind Trial to Measure the Absorption Characteristics of Eicosapentaenoic Acid and Docosahexaenoic Acid Rich Oil Blend with Natural Lipid-Based Delivery System. Food Sci. Biotechnol. 2023. [Google Scholar] [CrossRef]
  44. Wakil, A.; Mir, M.; Mellor, D.D.; Mellor, S.F.; Atkin, S.L. The Bioavailability of Eicosapentaenoic Acid from Reconstituted Triglyceride Fish Oil Is Higher than That Obtained from the Triglyceride and Monoglyceride Forms. Asia Pac. J. Clin. Nutr. 2010, 19, 499–505. [Google Scholar] [PubMed]
  45. Patan, M.J.; Kennedy, D.O.; Husberg, C.; Hustvedt, S.O.; Calder, P.C.; Khan, J.; Forster, J.; Jackson, P.A. Supplementation with Oil Rich in Eicosapentaenoic Acid, but Not in Docosahexaenoic Acid, Improves Global Cognitive Function in Healthy, Young Adults: Results from Randomized Controlled Trials. Am. J. Clin. Nutr. 2021, 114, 914–924. [Google Scholar] [CrossRef]
  46. Dasilva, G.; Boller, M.; Medina, I.; Storch, J. Relative Levels of Dietary EPA and DHA Impact Gastric Oxidation and Essential Fatty Acid Uptake. J. Nutr. Biochem. 2018, 55, 68–75. [Google Scholar] [CrossRef] [PubMed]
  47. Cannon, J.B.; Long, M.A. Emulsions, Microemulsions, and Lipid-Based Drug Delivery Systems for Drug Solubilization and Delivery—Part II: Oral Applications. In Water-Insoluble Drug Formulation; CRC Press: Boca Raton, FL, USA, 2017; ISBN 978-1-315-12049-2. [Google Scholar]
  48. Talegaonkar, S.; Azeem, A.; Ahmad, F.J.; Khar, R.K.; Pathan, S.A.; Khan, Z.I. Microemulsions: A Novel Approach to Enhanced Drug Delivery. Recent Pat. Drug Deliv. Formul. 2008, 2, 238–257. [Google Scholar] [CrossRef] [PubMed]
  49. EFSA Panel on Dietetic Products, Nutrition and Allergies (NDA) Scientific Opinion on the Tolerable Upper Intake Level of Eicosapentaenoic Acid (EPA), Docosahexaenoic Acid (DHA) and Docosapentaenoic Acid (DPA). EFSA J. 2012, 10, 2815. [CrossRef]
  50. Office of Dietary Supplements—Omega-3 Fatty Acids. Available online: https://ods.od.nih.gov/factsheets/Omega3FattyAcids-Consumer/ (accessed on 30 April 2024).
  51. Aarak, K.E.; Kirkhus, B.; Holm, H.; Vogt, G.; Jacobsen, M.; Vegarud, G.E. Release of EPA and DHA from Salmon Oil—A Comparison of in Vitro Digestion with Human and Porcine Gastrointestinal Enzymes. Br. J. Nutr. 2013, 110, 1402–1410. [Google Scholar] [CrossRef]
  52. Vonach, C.; Viola, K.; Giessrigl, B.; Huttary, N.; Raab, I.; Kalt, R.; Krieger, S.; Vo, T.P.N.; Madlener, S.; Bauer, S.; et al. NF-κB Mediates the 12(S)-HETE-Induced Endothelial to Mesenchymal Transition of Lymphendothelial Cells during the Intravasation of Breast Carcinoma Cells. Br. J. Cancer 2011, 105, 263–271. [Google Scholar] [CrossRef]
  53. Kerjaschki, D.; Bago-Horvath, Z.; Rudas, M.; Sexl, V.; Schneckenleithner, C.; Wolbank, S.; Bartel, G.; Krieger, S.; Kalt, R.; Hantusch, B.; et al. Lipoxygenase Mediates Invasion of Intrametastatic Lymphatic Vessels and Propagates Lymph Node Metastasis of Human Mammary Carcinoma Xenografts in Mouse. J. Clin. Investig. 2011, 121, 2000–2012. [Google Scholar] [CrossRef]
  54. Chen, Y.Q.; Duniec, Z.M.; Liu, B.; Hagmann, W.; Gao, X.; Shimoji, K.; Marnett, L.J.; Johnson, C.R.; Honn, K.V. Endogenous 12(S)-HETE Production by Tumor Cells and Its Role in Metastasis. Cancer Res. 1994, 54, 1574–1579. [Google Scholar]
  55. Leiria, L.O.; Wang, C.-H.; Lynes, M.D.; Yang, K.; Shamsi, F.; Sato, M.; Sugimoto, S.; Chen, E.Y.; Bussberg, V.; Narain, N.R.; et al. 12-Lipoxygenase Regulates Cold Adaptation and Glucose Metabolism by Producing the Omega-3 Lipid 12-HEPE from Brown Fat. Cell Metab. 2019, 30, 768–783.e7. [Google Scholar] [CrossRef] [PubMed]
  56. Shaikh, S.R.; Virk, R.; Van Dyke, T.E. Potential Mechanisms by Which Hydroxyeicosapentaenoic Acids Regulate Glucose Homeostasis in Obesity. Adv. Nutr. 2022, 13, 2316–2328. [Google Scholar] [CrossRef] [PubMed]
  57. Balk, E.M.; Lichtenstein, A.H.; Chung, M.; Kupelnick, B.; Chew, P.; Lau, J. Effects of Omega-3 Fatty Acids on Serum Markers of Cardiovascular Disease Risk: A Systematic Review. Atherosclerosis 2006, 189, 19–30. [Google Scholar] [CrossRef]
  58. Bremmell, K.E.; Briskey, D.; Meola, T.R.; Mallard, A.; Prestidge, C.A.; Rao, A. A Self-Emulsifying Omega-3 Ethyl Ester Formulation (AquaCelle) Significantly Improves Eicosapentaenoic and Docosahexaenoic Acid Bioavailability in Healthy Adults. Eur. J. Nutr. 2020, 59, 2729–2737. [Google Scholar] [CrossRef]
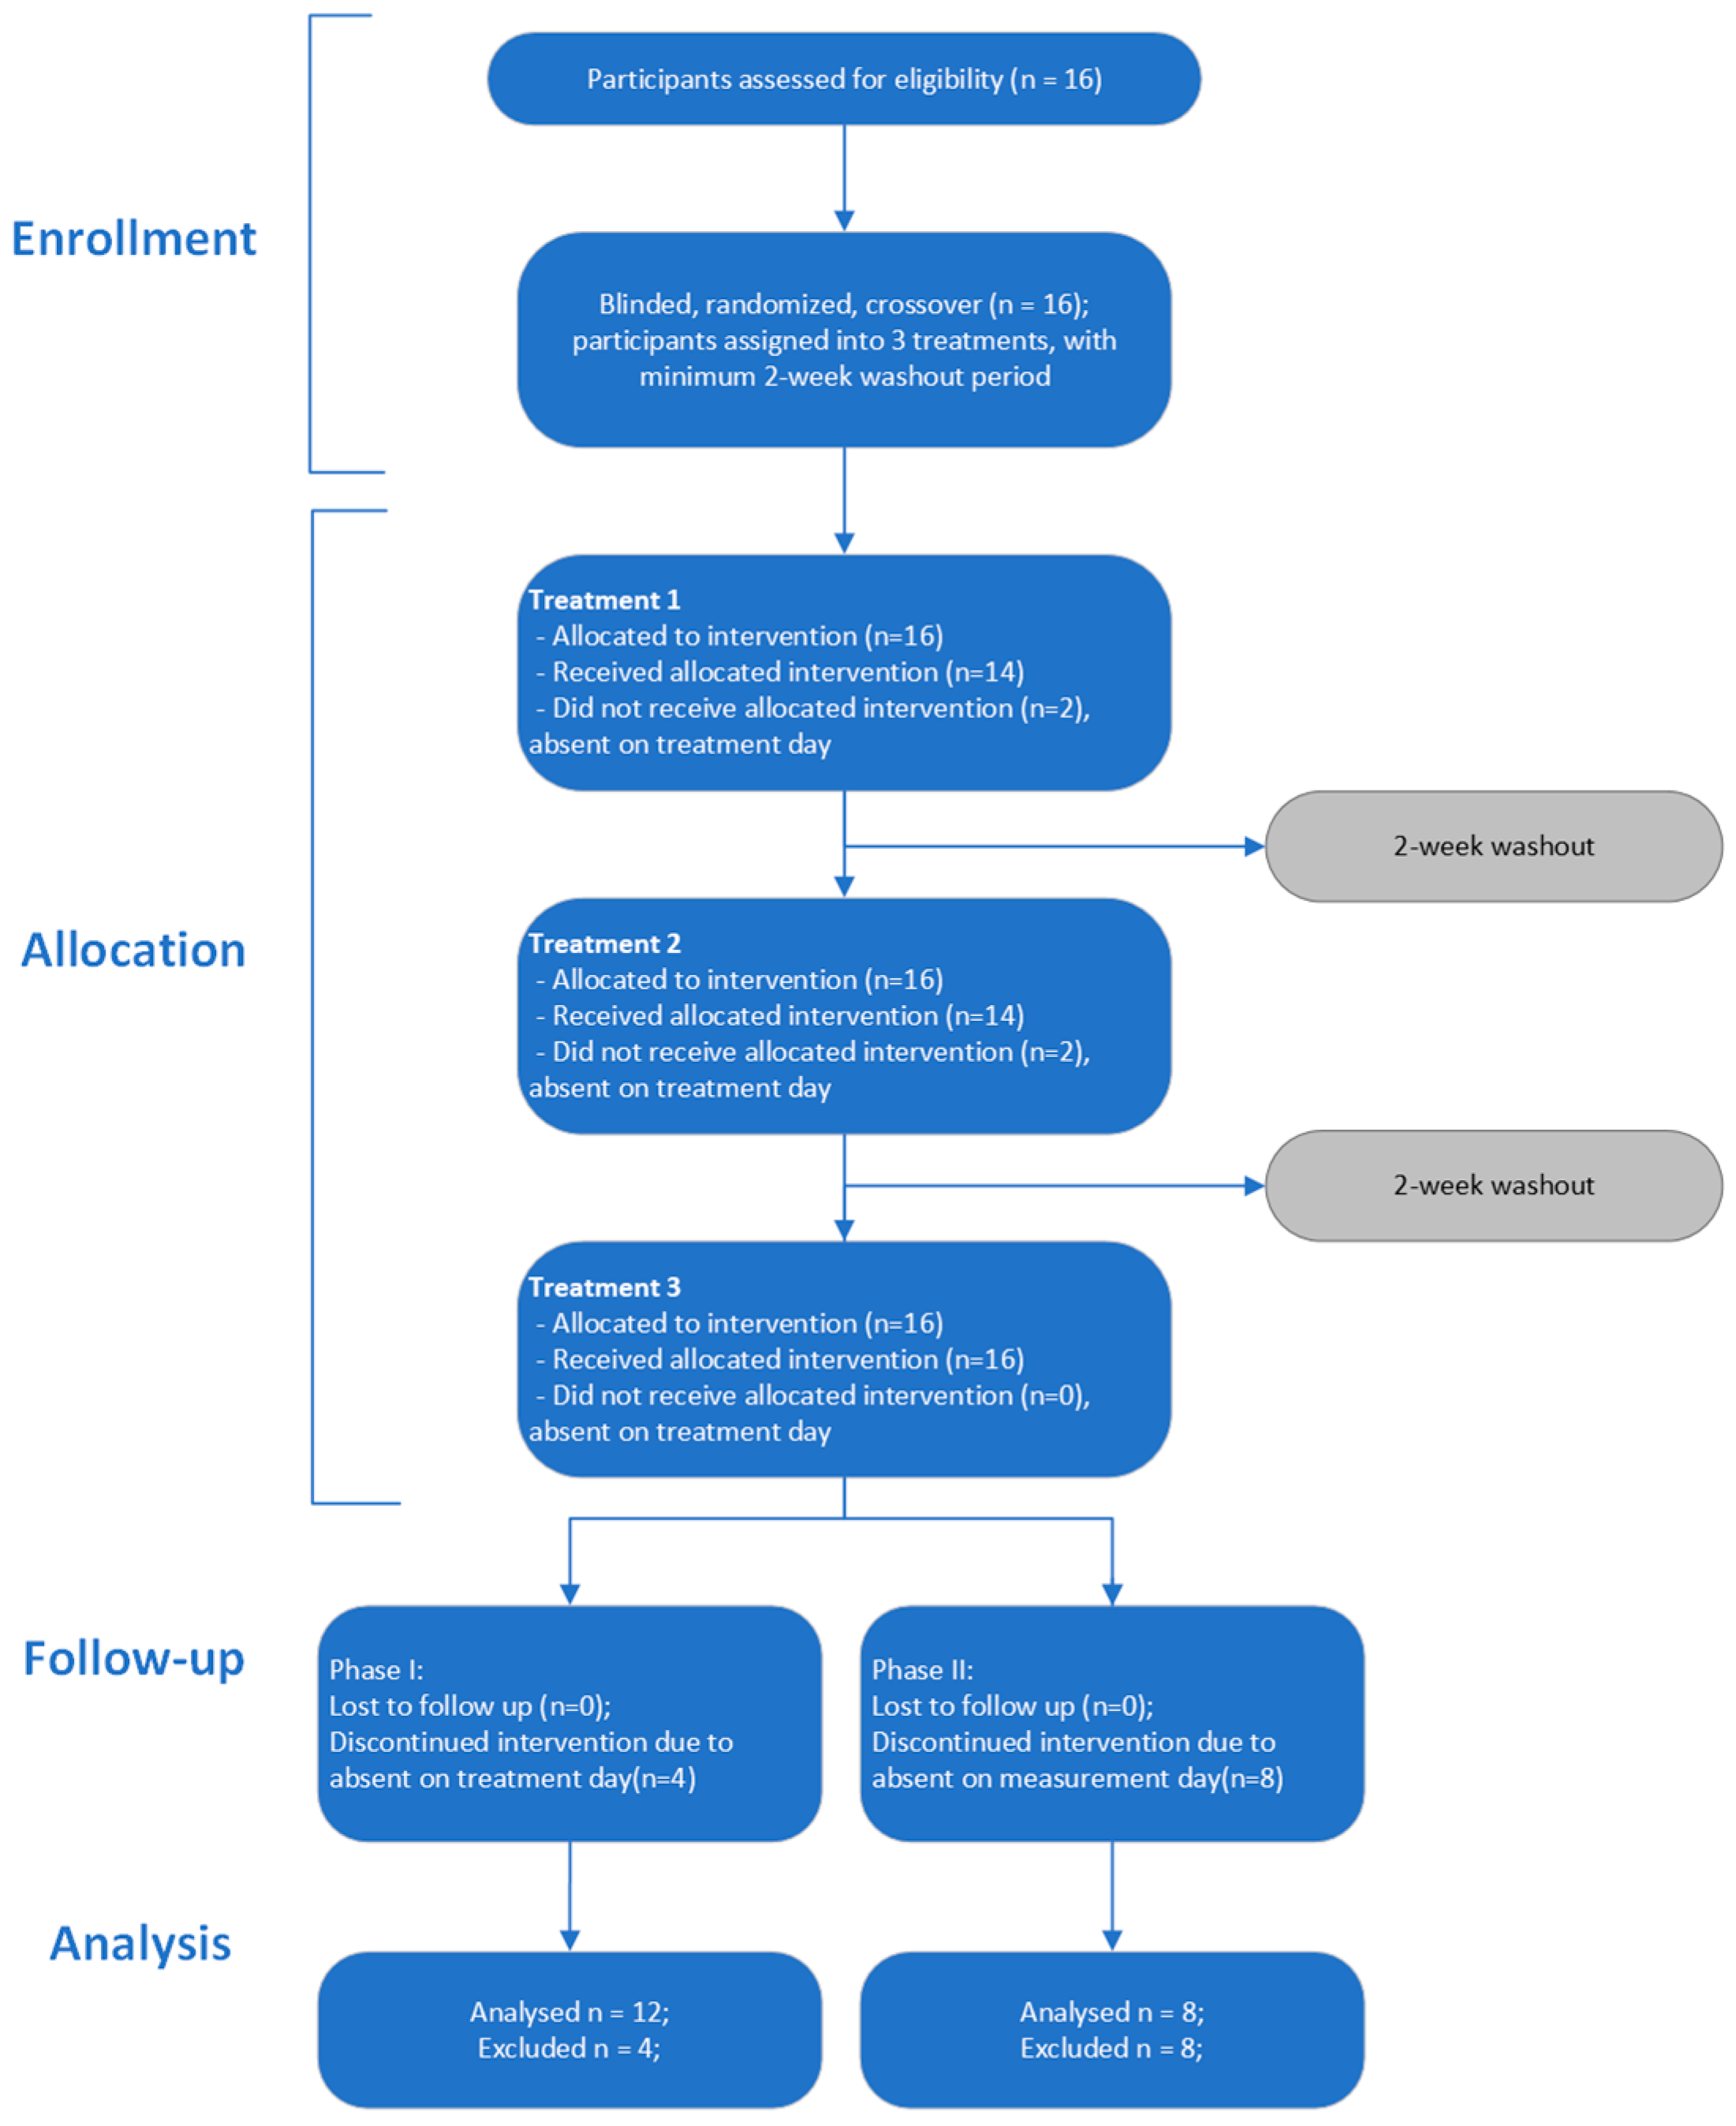
Figure 1. Study process flowchart.
Metabolites 14 00265 g001
Figure 2. Treatment timeline. For bioavailability, blood samples were collected at 0, 0.5, 1, 2, 3, 4, 6, 8, 12, and 24 h (bright red). Breakfast was provided after the participants consumed the capsules, lunch after the 4 h blood sample, and dinner after the 8 h blood sample. For blood lipids, samples were collected at 0, 3, 6, 12, 24, 48, 72, 96, and 120 h (dark red) after the initial dose. Participants carried out an overnight fast prior to the 0, 24, 48, 72, 96, and 120 h collection, and, except for 120 h, were given the intervention immediately after blood sample collection.
Metabolites 14 00265 g002
Figure 3. Mean blood concentration (AUC0-24) of EPA, DPA3, and DHA after treatment with each Omega-3 formulation; * p ≤ 0.05, ** p ≤ 0.01, repeated measure two-way ANOVA and Tukey’s multiple comparison test; n = 12.
Metabolites 14 00265 g003
Figure 4. Average incremental concentrations (iAUC24) of total Omega-3 fatty acids in participants’ blood after oral ingestion of assigned intervention; n = 12; * denotes p ≤ 0.05, repeated measure two-way ANOVA followed by Tukey’s multiple comparison test.
Metabolites 14 00265 g004
Figure 5. Mean total blood concentrations of metabolites 3 h after administration of each Omega-3 formulation; * denotes p ≤ 0.05, ** p ≤ 0.01, repeated measure two-way ANOVA with Tukey’s multiple comparison test.
Metabolites 14 00265 g005
Figure 6. Mean total blood concentrations of metabolites 24 h after administration of each Omega-3 formulation; * denotes p ≤ 0.05, repeated measure two-way ANOVA with Tukey’s multiple comparison test.
Metabolites 14 00265 g006
Figure 7. Changes in blood lipids over 120 h following the daily administration of individual n-3 fish oil treatments; * denotes p ≤ 0.01 with repeated measure two-way ANOVA performed on individual data using Time 0 as Control with Dunnett’s multiple comparison correction; n = 8.
Metabolites 14 00265 g007
Table 1. Participant eligibility criteria.
Inclusion CriteriaExclusion Criteria
≥18 years oldLess than 18 years old
Good physical conditionSmokers
Provide signed informed consentTaking prescribed medication
Liver disease
Kidney disease
Gastrointestinal disease
Allergy to berberine
Intend to become pregnant, pregnant, or breast-feeding
Table 2. Standardized meal plan.
DayBreakfastDinner
Monday Bagel with cream cheese and jamLasagna and salad
TuesdayBagel with cream cheese and jamPork chops, sweet potatoes, beans, salad
WednesdayBagel with cream cheese and jamChicken skewers, pita bread, tzatziki, cucumbers, tomatoes
ThursdayBagel with cream cheese and jamLamb chops, cauliflower, green beans
FridayBagel with cream cheese and jamBeef fajita, onions, peppers, wheat tortilla wrap
Table 3. Chemical standards and scan parameters for Q exactive Orbitrap mass spectrometer.
CompoundsChemical Formula [M]Scanned Mass [m/z]Start [min]End [min]
18-HEPEC20H30O3317.212224.004.60
15-HETE-d8C20H24D8O3327.278084.505.10
17-HDHA/14-HDHAC22H32O3343.227877.008.30
DPA3C22H34O2329.24869.109.90
EPAC20H30O2301.21738.609.20
DHAC22H32O2327.232959.009.60
(18S-) Resolvin E1 C20H30O5349.202053.004.70
(18S-) Resolvin E2 C20H30O4333.207134.306.50
(AT-)Resolvin D2,3,4 C22H32O5375.21774.707.70
Resolvin D5, 6, Protectin D1, MaresinC22H32O4359.222786.008.20
EPA-d5C20H25D5O2306.248696.807.25
15(S), 12(S), 5(S)-HETEC20H32O3319.227877.108.10
12(S)-HHTrEC17H28O3279.196576.306.90
Prostaglandin D2, E2C20H32O5351.21773.805.20
Protaglandin F2aC20H34O5353.233354.705.30
Thromboxane B2, 6-keto protaglandin F1aC20H34O6369.228263.505.50
DHA-d5C22H27D5O2332.264349.009.60
EPA OxylipinsC20H30O3317.212226.707.70
Table 4. Study participants’ baseline characteristics, presented in average ± SEM.
Parameter
N16
Males | Females 9 | 7
Age (years) 36.1 ± 2.4
Weight (kg) 61.8 ± 2.4
BMI (kg/m2) 22.1 ± 0.5
DHA (ng/mL)1007.1 ± 131.1
EPA (ng/mL)3085.2 ± 833.4
DPA (ng/mL)215.0 ± 30.5
Table 5. Blood concentrations over 24 h.
AUC0-24
ng/mL·h
STDENTLMF
DHA3136.6 ± 433.33436.8 ± 688.04910 ± 827.5
DPA3626.4 ± 120.3590.6 ± 93.41016.8 ± 181.8
EPA4545.4 ** ± 8395798 * ± 131726,920 ** ± 10,021
DHA + EPA7682 * ± 12258734 ± 150331,529 * ± 10,783
Total8309 * ± 13309325 ± 155532,546 * ± 10,950
Means ± SEM reported; * p ≤ 0.05, ** p ≤ 0.01, repeated measure two-way ANOVA and Tukey’s multiple comparison test; n = 12.
Table 6. Incremental blood concentration over 24 h of total n-3 FAs.
STDENTLMF
iAUC (ng/mL·h)1498.9 **** ± 443.02057.2 **** ± 813.716,150 **** ± 5454
Cmax (ng/mL)186.0 ± 44.8389 ± 1411732.8 ± 478.3
Tmax (hr)3.9 ± 1.14.7 ± 1.210.0 ± 2.1
Means ± SEM reported; **** p ≤ 0.0001, repeated measure ANOVA with Tukey’s multiple comparison test; n = 12.
Table 7. Blood concentrations (dilution corrected) of metabolites over 3 h.
AUC0-3 h
ng·h/mL
STDENTLMF
HDHA, 14-347.2 ± 68.5292.0 ± 75.6167.1 ± 47.7
HDHA, 17-182.9 ± 43.693.3 ± 41.0316.0 ± 106.2
HDHAs (4…20)73.3 ± 15.9113.7 ± 43.876.2 ± 26.2
Total HDHA603.5 ± 101.5498.9 ± 120.0559.3 ± 109.4
HEPE, 11-234.9 ± 54.7180.2 ± 39.3140.3 ± 30.0
HEPE, 12-33.6 * ± 14.1150.6 ± 73.0166.3 * ± 40.7
HEPE, 15-165.3 ± 27.4141.2 ± 16.295.3 ± 14.3
HEPE, 18-135.4 ± 31.3157.6 ± 49.0285.6 ± 51.2
HEPE, 5-169.3 ± 70.8246.5 ± 86.9335.9 ± 66.1
HEPE, 8-220.7 ± 53.2182.8 ± 37.0134.6 ± 27.9
HEPE, 9-165.7 * ± 30.0149.8 * ± 17.395.8 ± 11.2
total HEPE1124.9 ± 158.21208.8 ± 152.81253.9 ± 109.2
HETE, 12-1692.9 * ± 342.51597.2 ± 539.4551.1 * ± 118.5
HETE, 15-579.2 ± 129.3572.7 ± 75.11011.7 ± 381.0
HETE, 5-293.0 ± 181.5201.5 ± 55.6871.6 ± 274.5
Total HETE2565.1 ± 373.72371.4 ± 538.32434.3 ± 650.3
HHTrE, 12-179.4 ± 43.3131.2 ± 35.453.9 ± 19.2
RvD14197 ** ± 1122782 ± 10580.2 ** ± 0.2
RvD5212.3 ± 74.9100.6 ± 83.7−23.1 ± 23.1
RvE1−2.7 ± 22.289.3 ± 80.5−16.5 ± 19.9
RvE2−91.8 ± 65.794.8 ± 125.877.8 ± 80.5
Means ± SEM reported; * denotes p ≤ 0.05, ** p ≤ 0.01, repeated measure two-way ANOVA with Tukey’s multiple comparison test; n = 12.
Table 8. Blood concentrations (dilution corrected) of metabolites over 24 h.
AUC0-24 h
ng·h/mL
STDENTLMF
HDHA, 14-3410 ± 12962041.0 ± 493.8998.7 ± 172.2
HDHA, 17-3033 ± 1759621.7 ± 228.12637.3 ± 1031.2
HDHAs (4…20)1618.5 ± 951.7630.8 ± 122.9439.6 ± 112.4
Total HDHA10,450.5 ± 6273.93293.4 ± 752.54075.5 ± 1026.2
HEPE, 11-5224.1 ± 3330.81292.5 ± 329.01192.1 ± 318.6
HEPE, 12-562.9 ± 293.01016.5 ± 552.01641.6 ± 371.8
HEPE, 15-3345.0 ± 1960.2970.1 ± 144.1636.9 ± 77.6
HEPE, 18-2527.3 ± 1561.8947.8 ± 283.62317.7 ± 631.3
HEPE, 5-1465.6 ± 533.41447.9 ± 448.42533.6 ± 436.7
HEPE, 8-4931.9 ± 3164.21288.3 ± 310.11226.0 ± 298.5
HEPE, 9-3438.7 ± 2086.5960.1 ± 161.0629.9 ± 64.2
total HEPE21,495.5 ± 12,252.57923.2 ± 1028.310,177.8 ± 1522.0
HETE, 12-32,927.3 ± 20,323.310,891.8 ± 3080.13905.1 ± 534.2
HETE, 15-6983.2 ± 3602.33846.1 ± 453.56596.8 ± 1193.3
HETE, 5-1446.9 ± 966.51510.8 ± 488.47313.2 ± 2351.5
Total HETE41,357.5 ± 23,732.816,248.7 ± 2824.717,815.2 ± 3486.3
HHTrE, 12-2899.3 ± 1669.9867.6 ± 244.8361.7 ± 58.3
RvD191,591 * ± 55,33630,786 ± 99880.19 * ± 0.17
RvD57336 ± 57882050 ± 124539.9 ± 107.7
RvE1662 ± 3131628 ± 1130211.6 ± 201.2
RvE2785.8 ± 341.52097 ± 11351854 ± 827
Means ± SEM reported; * denotes p ≤ 0.05, repeated measure two-way ANOVA with Tukey’s multiple comparison test; n = 12.
Disclaimer/Publisher’s Note: The statements, opinions and data contained in all publications are solely those of the individual author(s) and contributor(s) and not of MDPI and/or the editor(s). MDPI and/or the editor(s) disclaim responsibility for any injury to people or property resulting from any ideas, methods, instructions or products referred to in the content.