Abstract
In this study, a Gas chromatography–mass spectrometry (GC–MS) investigation of embryogenic callus and somatic embryo regenerated shoots of Carthamus tinctorius revealed the presence of a variety of sugars, sugar acids, sugar alcohols, fatty acids, organic acids, and amino acids of broad therapeutic value. The in vitro developed inflorescence contained a wide range of active compounds. In embryogenic calluses, important flavonoids like naringenin, myricetin, kaempferol, epicatechin gallate, rutin, pelargonidin, peonidin, and delphinidin were identified. To augment the synthesis of active compounds, the effect of cadmium chloride (CdCl2) elicitation was tested for various treatments (T1–T4) along with a control (T0). Varying concentrations of CdCl2 [0.05 mM (T1), 0.10 mM (T2), 0.15 mM (T3), and 0.20 mM (T4)] were added to the MS medium, and flavonoid accumulation was quantified through ultra-high-pressure liquid chromatography–tandem mass spectroscopy (UHPLC–MS/MS). The flavonoids naringenin, kaempferol, epicatechin gallate, pelargonidin, cyanidin, and delphinidin increased by 6.7-, 1.9-, 3.3-, 2.1-, 1.9-, and 4.4-fold, respectively, at T3, whereas quercetin, myricetin, rutin, and peonidin showed a linear increase with the increase in CdCl2 levels. The impacts of stress markers, i.e., ascorbate peroxidase (APX), catalase (CAT), and superoxide dismutase (SOD), on defense responses in triggering synthesis were also evaluated. The maximum APX and SOD activity was observed at T3, while CAT activity was at its maximum at T2. The impact of elicitor on biochemical attributes like protein, proline, sugar, and malondialdehyde (MDA) content was investigated. The maximum protein, proline, and sugar accumulation was noted at high elicitor dose T4, while the maximum MDA content was noted at T3. These elevated levels of biochemical parameters indicated stress in culture, and the amendment of CdCl2 in media thus could be a realistic approach for enhancing secondary metabolite synthesis in safflower.
1. Introduction
Medicinal plants play an important role in the production of a wide range of medicines, and hence, botanical products are becoming attractive to the nutraceutical and pharmaceutical industries over synthetic medicines. The increased demand for crude drugs encourages the cultivation of many medicinal plants, such as safflower (Carthamus tinctorius L.) [1]. Plant secondary metabolites comprise a diversity of low-molecular-weight compounds. These are engaged in plant defense against biotic and abiotic stressors, helping plants to cope with altered environmental conditions. In response to adverse situations, various complex signaling systems of plants are activated, resulting in the successful development of plant defense mechanisms.
Safflower is an annual herbaceous oilseed belonging to the Asteraceae family. It is a hyperaccumulator and can grow under a variety of heavy metal (Cd, Ni, Pb, Zn) stresses. It can accumulate and translocate metals to aerial parts, accentuating its phytoextraction potential [2]. In addition, safflower plant parts synthesize alkaloids, flavonoids, polyacetylene, aromatic glucosides, organic acids, and many bioactive compounds that demonstrate anti-inflammatory, antidiabetic, antitumor, neuroprotective, anti-oxidant, and immunostimulant activities [3]. Safflower research emphasizes the identification of important bioactive compounds present in various plant parts involved in plant growth and development and defense mechanisms.
Gas chromatography–mass spectrometry (GC–MS) is a frequently used technique in detecting phytocompounds present in in vitro-grown plant tissue [4,5]. This methodology is extensively utilized in chemistry, plant science, pharmacology, biotechnology, and biochemistry [6]. It first separates components from a mixture, identifies unknown compounds, and determines the chemical structure, molecular weight, and other properties [7]. GC–MS quantifies volatile organic compounds, plant growth regulators, secondary metabolites, and other metabolic compounds in several medicinal important plants like Madagascar Periwinkle (Catharanthus roseus L.) [8], rasna (Pluchea lanceolata (DC.) C.B. Clarke) [9], thyme (Thymus vulgaris L.), and basil (Ocimum basilicum L.) [10].
In recent years, several biotechnological strategies like media optimization with plant growth regulators, the use of high-yielding cells, the addition of precursors, the over-expression of key enzymes, and the incorporation of various elicitors have been used to enhance the accumulation of bioactive compounds [11,12]. The regulatory influence of diverse biotic and abiotic compounds as elicitors on secondary metabolite enrichment has also been studied [13,14]. Among abiotic compounds, heavy metals have been extensively employed in several plant species to enhance plant growth and development and in the accumulation of phytochemicals [15,16].
The identification of new compounds, i.e., the study of metabolomics, is valuable in molecular networking and fills the gaps between genotypes and phenotypes. It has a multidisciplinary role in gene discovery and taxonomic fingerprinting and in studying biochemical enzymatic reactions. It may also be used for the comparative analysis of agricultural cultivars, food products, and traditional medicine [17]. Owing to high metabolome coverage and versatility, liquid chromatography–mass spectrometry (LC–MS) and MS have been utilized and are considered to be valuable platforms for metabolomics research. Ultra-high-pressure liquid chromatography (UHPLC) has seen extensive applications in plant metabolomics in the last decade as it shows high peak capacity and separation efficiency [18]. LC–MS/MS has recently been utilized for the identification of bioactive compounds in in vivo and in vitro plant extracts in different medicinal plant genera like Eugenia [19] and Saraca [20].
It is known that in elicitor treatment, tissues show elevated levels of reactive oxygen species (ROS), which are signaling molecules with a role in modulating significant protein activities, gene expression, and metabolic fluxes [21]. The chloroplasts, mitochondria, peroxisomes, and apoplasts are the major ROS-producing sites during abiotic stress [22]. However, accumulated ROS, if left unchecked, may result in oxidative stress, causing damage to the DNA, RNA, and protein macromolecules and lipid membrane peroxidation. This oxidative burst is mitigated by many ROS-detoxifying proteins, which consist of enzymatic anti-oxidants, such as catalase (CAT), superoxide dismutase (SOD), and ascorbate peroxidase (APX), present in cellular sub-compartments, as well as non-enzymatic compounds like anthocyanins, flavonoids, and phenolics [23].
The aim of the present study was to identify bioactive compounds present in methanolic extracts of embryogenic callus, shoot, and inflorescence of tissue-culture-derived plantlets through GC–MS. In this study, CdCl2 (cadmium chloride) was used as an abiotic elicitor, and the yield of phytocompounds, especially different flavonoids, was measured in regenerated tissues through UHPLC–MS/MS quantitative analysis. The study identified diverse flavonoids like anthocyanidin, flavonols, flavanone, flavanol glycoside, and flavan-3-ols, which can serve as potential anti-oxidants in C. tinctorius. The changes in biochemical attributes like the content of sugar, protein, and proline and the activity of anti-oxidant enzymes in response to CdCl2 treatment were also monitored.
2. Materials and Methods
2.1. Establishment of In Vitro Culture
The basic protocol of in vitro seed germination of Carthamus tinctorius L. was established by following the method laid out by the authors in [24]. The seeds of the ISF-764 variety of safflower were provided by the Indian Council of Agricultural Research—Indian Institute of Oilseeds Research (ICAR—IIOR) during the harvesting season March–April (2021). Overnight pre-soaked safflower seeds were surface-sterilized by washing them under running water with detergent (cetrimide). This was followed by a series of seed-surface sterilizations under a laminar flow cabinet to ensure the inoculation of uncontaminated seeds. For this, safflower seeds were transferred in a glass beaker and soaked twice in 70% ethanol for 90 s and rinsed with autoclaved double-distilled water (DDW) thrice after each treatment. These ethanol-treated seeds were further stirred twice in 0.1% HgCl2 (w/v) by manually shaking the beaker for 90 s, followed by soaking (20 s) and rinsing with DDW thrice after each treatment to remove any traces of disinfectant. The treatment time was monitored using a stopwatch and has been optimized for safflower seeds used in this experiment.
The surface-sterilized seeds were inoculated on half-strength MS [25] supplemented with 1.4 μM GA3, 1.5 g/100 mL sucrose, and 0.7% agar. The pH of the germination medium was set at 5.7 and sterilized in an autoclave at 121 °C for 15 min. The culture tubes with inoculated seeds were incubated in dim light for 3–4 days until the appearance of hypocotyls. Later, the cultures were subject to a 16/8 h photoperiod regime under 100 μmol m−2 s−1 photon flux density (PPFD) provided by cool white fluorescent tube lights at 25 °C.
For the CdCl2 elicitation of flavonoids, the somatic embryo regenerated plantlets of C. tinctorius were cultured in MS basal medium with different treatments of CdCl2 (0.05, 0.10, 0.15, and 0.20 mM), represented as T1, T2, T3, and T4, respectively, and untreated versions (T0) were used as the control for comparative analysis. After one week of incubation, all the samples (T0, T1, T2, T3, and T4) were harvested and processed for metabolomic analysis.
2.2. Embryogenic Callus Induction and Shoot Regeneration
For callus formation, the in vitro-germinated 2-week-old seedlings were inoculated on MS supplemented with 2.2 µM BAP + 5.4 µM NAA + 2.27–4.54 µM TDZ. The embryogenic callus was obtained from a hypocotyl-derived non-embryogenic callus after eight weeks of subculturing in an MS medium. For germination, the somatic embryos were cultured in a varying-strength MS medium (F-MS and ½ MS) supplemented with GA3 (0.29–1.4 µM). Shoot buds obtained from somatic embryos were cultured on MS supplemented with 2.2 µM BAP and 4.54–9.08 µM TDZ along with 0.54 µM NAA for multiplication and elongation. The frequency (%) of embryogenesis, the mean number of somatic embryos per callus clump (100 mg), the germination frequency (%) of embryos, and the mean number of in vitro-regenerated shoots and flower buds per plantlet were recorded.
2.3. Metabolomic Profiling of Somatic Embryogenic Callus and Regenerated Shoot of Safflower: Extract Preparation and Derivatization for Gas Chromatography–Mass Spectrometry (GC–MS)
For untargeted GC–MS analysis, the standard Kundu et al. method was followed [26]. An extract of 480 µL of pure methanol along with 20 µL of 0.2 mg mL−1 ribitol (adonitol) as internal standard was added to 20 mg of dried callus and shoot sample. The mixture was vigorously shaken for 2 min and then heated at 70 °C for 15 min (ThermoStatC, Eppendorf, Hamburg, Germany). To this, an equal volume of water was added and vortexed (Spinix vortex shaker, Tarsons, Mumbai, India), followed by the addition of 250 µL of chloroform and thoroughly mixed. This mixture was centrifuged (Eppendorf R centrifuge 5430 R) at 2200× g for 10 min at room temperature (~22–25 °C). The upper aqueous phase was pipetted out and dried in a speed vacuum rotator (Concentrator plus, Eppendorf) at 45 °C for 2.5 h. The dried fraction was redissolved in 40 µL of 20 mg mL−1 methoxamine hydrochloride prepared in pyridine and then incubated for 90 min at 30 °C (ThermoStatC, Eppendorf). A total of 60 µL of MSTFA (N-methylN-(trimethylsilyl) trifluroacetamide) was added to the above solution and incubated for 30 min at 37 °C. A total of 100 µL of this derivatized sample was transferred in an insert containing a GC–MS glass vial and stored at 4 °C until it was analyzed in GC–MS/MS (TQ8050 NX, Shimadzu, Kyoto, Japan).
2.4. GC–MS Analysis and Data Processing
Following derivatization, the injection was set at Split Mode, with a split ratio of 5 and 0.2 μL injection volumes. The GC–MS analysis for untargeted metabolites consisted of a Shimadzu Gas chromatogram (GC-2010 plus) coupled with a mass spectrometer (TQ 8050), and an auto-sampler (AOC-20s) and auto-injector (AOC-20i) was used. For analysis, helium carrier gas (flow rate 1 mL min−1) and SH-Rxi-5Sil MS capillary column (30 m × 0.25 μm, 0.25 mm) (Restek Corporation, Bellefonte, PA, USA) were used. The system was set at 80 °C isothermal heating (2 min), followed by a ramp rate of 5 °C min−1 to 250 °C, 2 min withhold, and a 10 °C min−1 final ramp with 24 min withhold time. The total run time for GC–MS was 68 min with 4.5 min of solvent delay [27]. The GC–MS solution software Version 4.45 SP 1 was applied for chromatogram integration and analysis of mass spectra. The derivatized metabolites were identified using NIST14s and the WILEY8 spectral library.
2.5. Preparation of Inflorescence Methanolic Extract for GC–MS Analysis and Identification of Phytochemicals
The in vitro-derived capitulum was harvested and dried under sterilized conditions and finely ground using a mortar and pestle. This pulverized tissue was soaked in 100% methanol (1.0 gm in 5.0 mL) and stirred on a rotary shaker for 15 h. The extracts were filtered using a 0.22 m pore-size syringe filter for 10 min. The extracts were centrifuged at 8000 rpm and 4 °C. The resulting supernatant was then pipetted out (leaving the debris) into fresh GC–MS vials, and 1.0 µL of each sample was utilized for GC–MS analysis. The sample extract was delivered to the University Science Instrumentation Centre, AIRF, Jawaharlal Nehru University in Delhi for GC–MS analysis using a GC–MS QP2010 Plus system (Shimadzu, Kyoto, Japan). The system comprised an auto-injector (AOC-20i), a headspace sampler (AOC-20s), a mass selective detector with an ion source set at 220 °C, and a 270 °C interface. The mass range of 40 m/z to 650 m/z was used for analysis, with a threshold of 1000 EV established. Furthermore, the injector was set up for split injection mode with a 10:1 ratio at 260 °C. The temperature was first set to 100 °C for 2 min before being gradually increased to 300 °C at a rate of 10 °C/min. The carrier gas was helium, which had a linear velocity of 40.9 cm/s at a pressure of 90.5 kPa. The system operated at an aggregate flow rate of 16.3 mL/min and a columnar flow rate of 1.21 mL/min. The structure, molecular mass, and spectral fragments were taken into consideration to determine the identity of the molecules, and compounds were matched with the established components from the National Institute of Standards and Technology’s (NIST14s.lib, accessed on 16 March 2023) library database, which contains over 62,000 patterns.
2.6. Sample Preparation for Flavonoid Quantification in CdCl2 Treated C. tinctorius Tissues by Ultra-High Pressure Liquid Chromatography–Tandem Mass Spectrometry (UHPLC–MS/MS)
Tissues/plant materials of 30–35 mg were weighed. To this, 500 µL of 80% methanol: water (LC–MS grade) was added, and the mixture was ultrasonicated (Aczet Pvt. Ltd., Mumbai, India) at room temperature for 20 min, followed by centrifugation (Eppendorf R centrifuge 5430 R) at 8000 rpm for 10 min. The supernatant was filtered through a 0.22 µm syringe filter (RanDisc Nylon SF, RANKEMTM, Chennai, India) into LC–MS glass vials for vacuum drying in SpeedVac at 65 °C. The dried extract was resuspended in 80% methanol for flavonoid quantification in a UPLC system (Exion LC, Sciex, Gurgaun, India) coupled to a triple quadrupole system (QTRAP6500 + ABSciex, Gurgaun, India) using an electrospray ionization [28]. The voltage was set at 5500 V for positive ionization. For quantitative and qualitative analysis, a mass spectrometer was used in multiple reaction monitoring (MRM) modes using analytical standards of anthocyanidin, flavonols, flavanone, flavanol glycoside, and flavan-3-ols (Merck, Rahway, NJ, USA). The system was used at 70 psi for gas 1 and gas 2, 40 psi for curtain gas, and a 650 °C source temperature in a collision-assisted dissociation medium. Analyst software (version 1.5.2) was used for flavonoid identification and quantification. Details of the flavonoid calibration curve, retention time (min), and MS/MS profile of flavonoids are presented in the Supplementary Files (Figures S1 and S2).
2.7. Biochemical Analysis of CdCl2-Treated Plants
2.7.1. Protein Estimation
Following Bradford’s method [29], the total protein content for all the treated samples was estimated. About 500 mg of fresh leaf sample was homogenized with 1.5 mL (0.1 M phosphate buffer, pH 7) in a pre-chilled mortar and pestle. The extract was centrifuged at 5000 rpm for 10 min. To 1.0 mL of supernatant, 0.5 mL trichloroacetic acid (TCA) was added and again centrifuged at 5000 rpm for 10 min. After discarding the supernatant, the suspended pellet was washed with chilled acetone and dissolved in 1.0 mL of 0.1 N NaOH. A total of 1.0 mL of Bradford reagent was added to 1.0 mL of aliquot, and its optical density was measured using bovine serum albumin (BSA) as standard at 595 nm.
2.7.2. Proline Estimation
Following the method established by Bates et al. [30], free proline was estimated in all the treated samples. About 200 mg of fresh leaves were homogenized in 4.0 mL of 3% aqueous sulfosalicylic acid and centrifuged at 5000 rpm for 10 min to separate the debris. To 1 mL of the above extract, 1.0 mL of glacial acetic acid and 1 mL of acid ninhydrin were added in sequence, and the reaction mixture was incubated in a bath of boiling water for an hour. The reaction was ceased by placing the mixture in an ice bath. A total of 2 mL of toluene was added to the reaction mixture and stirred well for 20–30 s. The separated red-colored upper toluene layer at room temperature was taken, and its absorbance was measured at 520 nm using L-Proline as standard.
2.7.3. Sugar Estimation
Following the method established by Dey [31], the total sugar content was estimated. A total of 0.5 g of fresh leaves were chopped and placed in a test tube with 10 mL of 70% ethanol. The test tubes were then incubated in an oven for 1 h at 60 °C twice. The final volume increased to 25 mL by adding double-distilled water. A total of 1.0 mL of 5% phenol and 5.0 mL of sulfuric acid (conc.) were added to 1.0 mL of the above aliquot in an ice box and allowed to cool before measuring the optical density. D-glucose (Sigma–Aldrich, St. Louis, MO, USA) was used as a reference standard, and absorbance was measured at 485 nm.
2.7.4. Malondialdehyde (MDA) Estimation
To measure the degree to which lipid peroxidation occurs under heavy metal stress, MDA content was estimated following the method established by Zhou and Leul. A total of 0.5 g in vitro-regenerated leaves of C. tinctorius was homogenized in 5.0 mL of 1% TCA and later centrifuged at 8000 rpm for 10 min. To each 0.5 mL of the aliquot of supernatant, TCA (20% with 0.5% TBA) was added and heated at 95 °C for 30 min, followed by immediate cooling in an ice bath. The product was re-centrifuged at 8000 rpm for 15 min, and absorbance was monitored at 450, 532, and 600 nm.
2.7.5. Assessment of Anti-Oxidant Enzyme Activities
A total of 0.1 g leaves of regenerated plantlets were homogenized with the aid of a mortar and pestle using 2.0 mL of 0.1 M extraction buffer (0.5 mM EDTA, 1.0 mM ascorbic acid, and 0.1 M phosphate at 7.5 pH). This plant enzyme extract was centrifuged at 10,000 rpm for 15 min; supernatant was used for further enzyme analysis. The catalase (CAT) activity was estimated by following Aebi’s [32] method by measuring the diminution in absorbance of the reaction mixture (1.0 mL of 0.5 M reaction buffer, Na-phosphate at pH 7.5, 0.1 mL 3.0 mM EDTA, 0.2 mL enzyme extract, and 0.1 mL H2O2) at 240 nm. The reaction was incubated for 3 min. One unit of CAT activity (U mg−1 protein min−1) is the enzyme amount required to decompose 1.0 μM of H2O2 min−1. The CAT activity was measured using a coefficient of absorbance of 0.036 mM−1 cm−1. Ascorbate peroxidase (APX) activity was estimated following Nakano and Asada’s [33] method. A reaction mixture of 0.1 ml shoot tissue extract, 1.0 mL 0.1 M sodium buffer at pH 7.2, and 0.1 mL EDTA was made. A total of 1.0 mL of 0.5 mM ascorbate was added to this reaction mixture and allowed to run for 3 min at 25 °C. One unit of APX activity (U mg−1 protein min−1) corresponds to the enzyme amount required to oxidize 1.0 μmol of ascorbate. The decrease in absorbance at 290 nm due to ascorbate degradation by APX was assessed spectrophotometrically and estimated using a molar extinction coefficient of 2.8 mM−1 cm−1. Superoxide dismutase (SOD) activity was evaluated by applying Dhindsa’s method [34]. A total of 0.1 g of shoot tissue was homogenized in a 2.0 mL extraction mixture (3 mM EDTA, 1% (w/v) polyvinylpyrrolidone (PVP), 0.5 M phosphate buffer (pH 7.3), 1.0% (v/v) Triton X100) and centrifuged at 104 rpm at 4 °C for 15 min. The SOD activity of the supernatant was assayed by adding 1.5 mL reaction buffer, 0.2 mL methionine, 3.0 mM EDTA, riboflavin, and 0.1 mL each of 1 M NaCO3, 2.25 mM Nitro Blue Tetrazolium (NBT), and enzyme extract. To this, 1.0 mL of double-distilled water was added, and the whole reaction assay was incubated in a test tube for 10 min at 20 °C under two 15 W fluorescent lamps. One enzyme unit expressed as EU mg−1 protein is the volume of enzyme extract corresponding to 50% suppression of the photochemical reaction.
2.8. Statistical Analysis
Statistical analysis was applied to determine the degree of authenticity of the collected data for various investigated parameters. Each experiment was conducted twice with three replications per set of experiments unless specified otherwise. All the data on in vitro regeneration in the presence of PGRs and varying biochemical and anti-oxidant enzyme activity in response to CdCl2 (T0, T1, T2, T3, and T4) are expressed as mean ± standard error. One-way analysis of variance (ANOVA) was carried out. Duncan’s test [35] was used as the post hoc test for the separation of means (p < 0.05) using the statistical software IBM SPSS 26.0 (SPSS Inc., Chicago, IL, USA).
3. Results
3.1. Embryogenic Callus Induction and Shoot Regeneration
Callus was induced from in vitro-germinated seedlings/hypocotyls in a Murashige and Skoog medium (MS) supplemented with 2.2 µM 6-Benzylaminopurine (BAP) + 5.4 µM α-Naphthaleneacetic acid (NAA) + 2.27–4.54 µM thidiazuron (TDZ). The non-embryogenic callus transformed into an embryogenic one after about eight weeks of subculturing. The best treatment for somatic embryo formation was 2.2 µM BAP + 5.4µM NAA + 4.54 µM TDZ, in which 75.6 ± 2.60 embryogenesis frequency (%) with about 20 ± 1.15 somatic embryos per 100 mg callus clump was noted (Table 1). In half-strength MS medium supplemented with 1.40 µM GA3 + 2.2 µM BAP + 5.4 µM NAA, the highest percentage of somatic embryo germination (34 ± 2.31%) was observed. The germinated embryos showed an average of 11 ± 0.57 shootlets with 3 ± 0.57 floral buds in a medium containing 0.54 μM NAA + 9.08 μM TDZ. The plant-regeneration process of C. tinctorius is presented in Figure 1a–e.

Table 1.
Somatic embryo formation, germination, and plantlet regeneration in different plant growth regulators (PGRs) added to full-strength MS medium (F-MS).
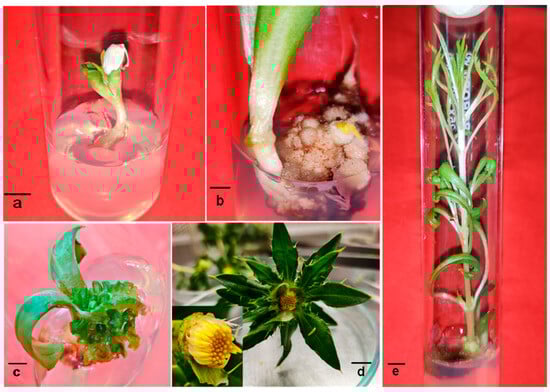
Figure 1.
In vitro regeneration of Carthamus tinctorius plantlet: in vitro seed germination (a); hypocotyl-derived embryogenic callus (b); embryo germinated plants (c); floral buds on in vitro-regenerated shoot (d); elongated in vitro-regenerated shoot (e) (Bars (a–c): 0.5 cm, (d,e): 1 cm).
3.2. GC–MS Profiling of Embryogenic Callus and Regenerated Shoot
Once the embryogenic callus and the regenerated plants developed, we detected the phytocompounds found in these sources. The GC–MS profile of the embryogenic callus (Figure 2a) and the regenerated shoot extract (Figure 2b) indicated the presence of various sugars, sugar acids, sugar alcohols, fatty acids, and organic acids of broad therapeutic value. In callus mass, various organic acids such as α-hydroxyisobutyric acid, 2-furoic acid, 3-hydroxybutyric acid, 3-hydroxyvaleric acid, 4-hydroxybutanoic acid, 3-phenyllactic acid, 4-hydroxybenzoic acid, and 4-hydroxybenzene acetic acid were present exclusively (Table 2). The regenerated shoots had a greater percentage of oxalic acid, methyl succinic acid, malic acid, D-(−)-citramalic acid, 4-aminobutanoic acid, citric acid, and quininic acid compared to the callus mass.
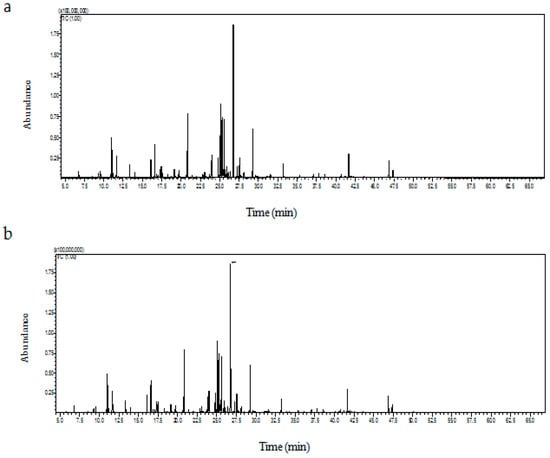
Figure 2.
GC–MS profile of total ion chromatogram (TIC) of embryogenic callus (a) and in vitro-regenerated shoot (b) of Carthamus tinctorius L.
Table 2.
Organic acid trimethylsilyl (TMS) derivatives present in embryogenic callus and in vitro-regenerated shoot of Carthamus tinctorius as identified by GC–MS.
The presence and the amount of carbohydrates (sugar, sugar acid, and sugar alcohol) were different in the callus and the shoot tissue. Sugar alcohols D-fucitol and D-mannitol were present only in the callus, whereas 3-deoxyhexitol and D-glucitol were exclusively present in the regenerated shoot (Table 3). L-threitol, 1-deoxypentitol, and xylitol were more in callus tissue compared to shoots. The fatty acid profiles of both the embryogenic callus and the regenerated shoot revealed the presence of long-chain saturated fatty acids (palmitic acid, C16:0, stearic acid, C18:0), monounsaturated fatty acid (oleic acid, C18:1 and 13-eicosenoic acid, C20:1), polyunsaturated fatty acids (linoleic acid, C18:2n6c) and triglyceride (1-monopalmitin). Behenic acid, C22:0, and 1-monomyristin, C14 (monoglyceride), were present only in embryogenic callus, whereas Myristic acid, C14:0, and α-linolenic acid C18:3n3 were present only in inflorescence along with above mentioned fatty acids. A maximum percentage of fatty acids were present in inflorescence or capitulum (42.94%), followed by callus (11.75%) and shoot (5.98%). Both callus and shoot followed the same pattern of abundance for fatty acids: 1-monopalmitin > linoleic acid > oleic acid > palmitic acid > stearic acid (Table 4). Among sugars, L-sorbopyranose and ribose were present only in callus while α-D-arabinopyranose, α-D-(+)-talopyaranose, α-D-galactopyranose, β-D-allopyranose and sedoheptulose were present exclusively in the regenerated shoot (Table 5). Among the sugar acids, β-D-glucopyranuronic acid and tartaric acid were present only in the callus, while D-galacturonic acid was present only in regenerated shoots. Gluconic acid was the most abundant sugar acid in callus and shoot tissue (Table 6). The GC–MS of the derivatized sample showed the presence of 17 and 10 amino acids in regenerated shoot and callus tissue, respectively. L-alanine, L-citrulline, L-asparagine, L-ornithine, L-glutamic acid, L-glutamine, and L-tyrosine were found only in the regenerated shoot (Table 7).
Table 3.
Sugar alcohol trimethylsilyl (TMS) derivatives present in embryogenic callus and in vitro-regenerated shoot of Carthamus tinctorius as identified by GC–MS.
Table 4.
Fatty acid trimethylsilyl (TMS) derivatives present in embryogenic callus and in vitro-regenerated shoot of Carthamus tinctorius as identified by GC–MS.
Table 5.
Sugar trimethylsilyl (TMS) derivatives present in embryogenic callus and in vitro-regenerated shoot of Carthamus tinctorius as identified by GC–MS.
Table 6.
Sugar acid trimethylsilyl (TMS) derivatives present in embryogenic callus and in vitro-regenerated shoot of Carthamus tinctorius as identified by GC–MS.
Table 7.
Amino acid trimethylsilyl (TMS) derivatives present in embryogenic callus and in vitro-regenerated shoot of Carthamus tinctorius as identified by GC–MS.
The phytocompounds, confirmed by the GC–MS spectrum profile of in vitro-regenerated safflower inflorescence (Figure 3), are presented in Table 8. The important unique fatty acids present in the methanolic extract of safflower capitulum were palmitic acid (6.65%), linoleic acid (2.11%), and stearic acid (0.28%). Fatty acid methyl esters (FAME), namely hexadecenoic acid, methyl ester (2.76%), 9,12-octadecadienoic acid (Z,Z) methyl ester (3.51%), 9-octadecenoic acid (Z) methyl ester (2.87%), 11-octadecenoic acid methyl ester (0.18%), N-octadecanoic acid methyl ester (1.40%), and decanoic acid methyl ester (0.27%) were identified.
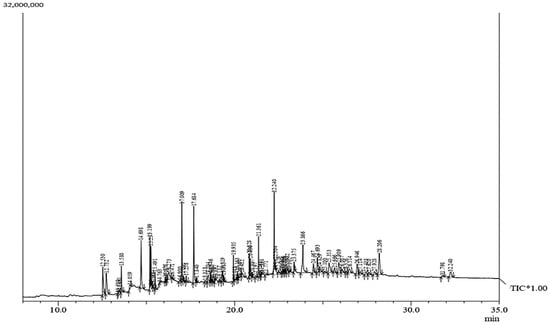
Figure 3.
GC–MS-based TIC for metabolomic profiling of phytocompounds present in the regenerated safflower inflorescence; TIC: Total Ion Chromatography, Y-axis: Absorbance and X-axis: Retention time (min).
Table 8.
GC–MS metabolomic profiling of phytocompounds present in in vitro-regenerated inflorescence of Carthamus tinctorius.
3.3. Quantification of Flavonoids in Embryogenic Callus
As the UHPLC–MS/MS technique provides a full and good view of phytochemicals in plant parts, this technique was used in untreated callus, which showed the presence of flavonoids (<1 ng mg−1), naringenin (0.01 ng mg−1), myricetin (0.021 ng mg−1), kaempferol (0.002 ng mg−1), epicatechin gallate (0.048 ng mg−1), rutin (0.011 ng mg−1), pelargonidin (0.316 ng mg−1), peonidin (0.024 ng mg−1) and delphinidin (0.078 ng mg−1). Though their levels were low (<0.001 ng mg−1), the presence of quercetin and cyanidin was also detected (Table 9).
Table 9.
UHPLC–MS/MS quantification of flavonoids present in eight-week-old embryogenic callus of Carthamus tinctorius.
3.4. Influence of CdCl2 on Flavonoid Accumulation in Regenerated Shoots
Elicitation is an important biotechnological strategy for improving active compounds in plant tissues. These signaling elements of biotic and abiotic nature regulate the cascade of genes in promoting the synthesis of phytocompounds. Here, abiotic elicitor CdCl2 was amended in media, and the content of various flavonoids was quantified in in vitro-grown tissues. The flavonoid identification in C. tinctorius extracts was made by comparison of retention times, the observation of characteristic MRM transitions, and by matching the MS2 spectra of reference compounds. UHPLC–MS/MS quantification of important flavonoids present in regenerated shoots was made (Figure 4); these were flavan-3-ols (epicatechin gallate), anthocyanidins (cyanidin, pelargonidin, delphinidin, peonidin), flavanones (naringenin), flavonols (quercetin, kaempferol, myricetin), and flavonol glycoside (rutin) (Table 10), of which 6 flavonoids (naringenin, kaempferol, epicatechin gallate, pelargonidin, cyanidin and delphinidin) showed a linear increase with increase in CdCl2 dosage, the optimum being at T3 (0.15 mM). A linear yield increase of quercetin (7.07 ng mg−1), myricetin (0.46 ng mg−1), rutin (1.81 ng mg−1) (Figure 5), and peonidin (7.44 ng mg−1) was observed with an increase in CdCl2 level (0.05 to 0.20 mM CdCl2). T4 showed the maximum accumulation of quercetin (Figure 6), myricetin, rutin, and peonidin with about 3.8-, 2.9-, 25.9-, and 8-fold increase in concentration, respectively, as compared to the control mother plant (T0). Flavonoid naringenin (8.68 ng mg−1), kaempferol (1.05 ng mg−1), epicatechin gallate (0.20 ng mg−1), pelargonidin (1.65 ng mg−1), cyanidin (1.03 ng mg−1) and delphinidin (7.77 ng mg−1) (Figure 7 and Figure 8) increased by 6.67-, 1.94-, 3.33-, 2.06-, 1.87-, and 4.415-fold, respectively, at T3. In safflower (T0), the following order of flavonoid abundance was observed: anthocyanidin > flavonols > flavanone > flavanol glycoside > flavan-3-ols.
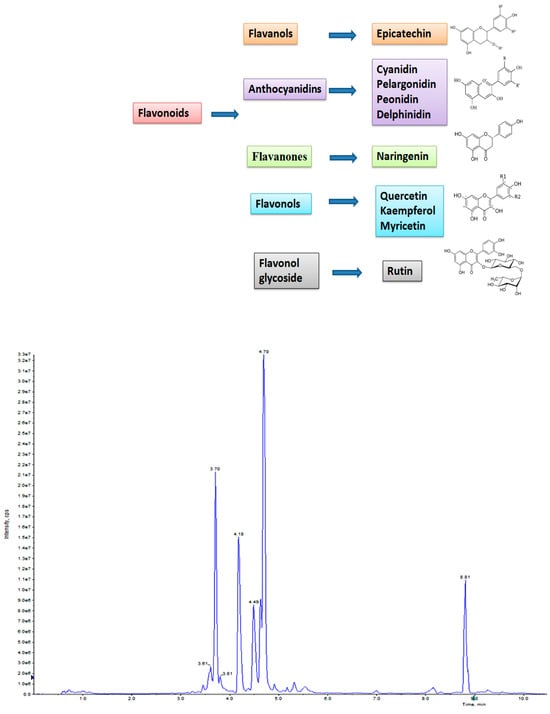
Figure 4.
UHPLC–MS/MS total ion chromatogram (TIC) of T0 (control) sample of in vitro-regenerated shoot of safflower showing the presence of various flavonoids.
Table 10.
UHPLC–MS/MS quantification of flavonoids in safflower leaves under various levels of CdCl2 treatment after one week of exposure.
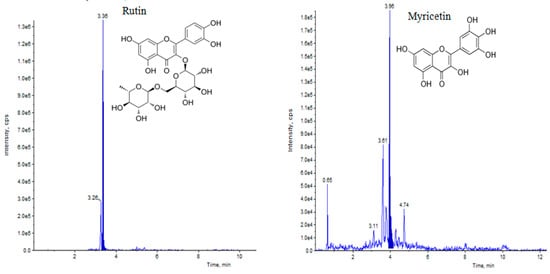
Figure 5.
UHPLC–MS/MS (QTRAP 6500) chromatogram of rutin and myricetin flavonoid at retention time 3.36 min and 3.96 min, respectively.
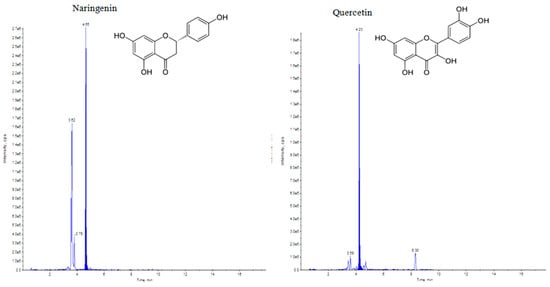
Figure 6.
UHPLC–MS/MS (QTRAP 6500) chromatogram of naringenin and quercetin flavonoids at retention time 4.65 min and 4.23 min, respectively.
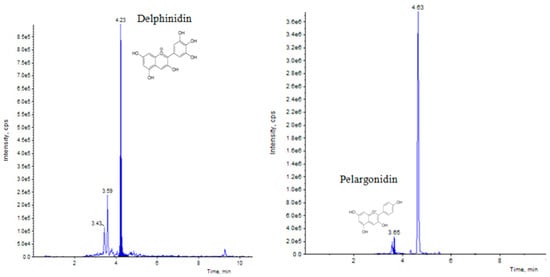
Figure 7.
UHPLC–MS/MS (QTRAP 6500) chromatogram of delphinidin and pelargonidin flavonoid at retention time 4.23 min and 3.65 min, respectively.
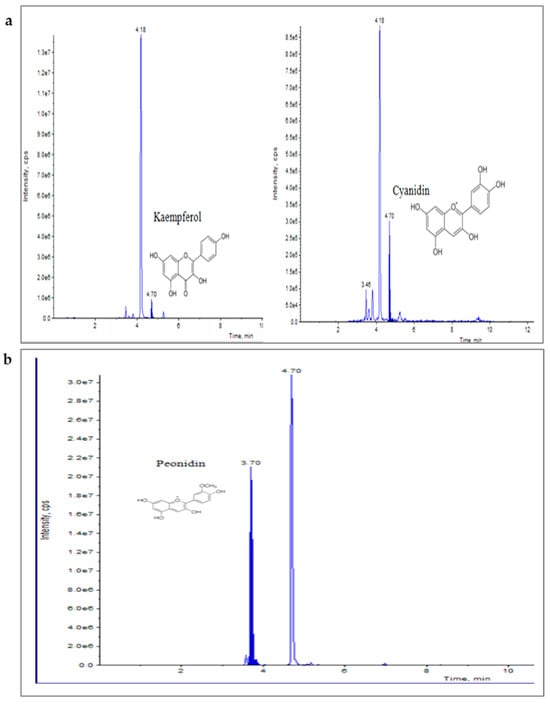
Figure 8.
UHPLC–MS/MS (QTRAP 6500) chromatogram of flavonoids, kaempferol and cyanidin (a), and Peonidin (b) at retention time 4.70 min and 3.70 min, respectively.
3.5. Amendment of CdCl2 and Protein, Proline, Sugar, and Malondialdehyde (MDA) Accumulation
The biochemical attributes of in vitro-regenerated plantlets and calluses were measured post-CdCl2 elicitation. After one week of treatment with different dosages of CdCl2, the total sugar, protein, and proline content were measured (Table 11). In regenerated plantlets, a linear increase of total protein, proline, and sugar with an increase in elicitor dosage was observed. At T4 (0.20 mM CdCl2), the shoots showed maximum content of protein, proline, and sugar (13.26 mg g−1 FW; 16.26 µg g−1 FW and 17.16 mg g−1 FW, respectively). It was noted that the CdCl2 stress caused a significant increase in MDA with an increase in CdCl2 concentration. Maximum content of MDA (10.26 ± 0.290 nmol g−1 FW) was noted at T3 (0.20 mM).
Table 11.
Protein, proline, and sugar levels in leaves of in vitro-regenerated shoot in different CdCl2 added medium.
3.6. Effect of CdCl2 on Anti-Oxidant Enzymatic Activity
The introduction of abiotic elicitor CdCl2 in media induced heavy metal stress in tissue culture, thus triggering reactive oxygen species (ROS) accumulation, boosting the production of secondary metabolites such as phenolics, flavonoids, and anthocyanins, which, along with enzymatic anti-oxidant activity, may enhance the production of ROS. In the present study, the activities of various anti-oxidant enzymes like ascorbate peroxidase (APX), superoxide dismutase (SOD), and catalase (CAT), the enzymatic scavengers of ROS were measured at different dosages of CdCl2 (Figure 9). At T3 (0.15 mM), the maximum APX (6.4 ± 0.115 EU min−1 mg−1 protein) and SOD (37.16 ± 0.881 EU min−1 mg−1 protein) were observed, whereas a maximum CAT content (7.53 ±0.405 EU min−1 mg−1 protein) was detected at T2 (0.10 mM).
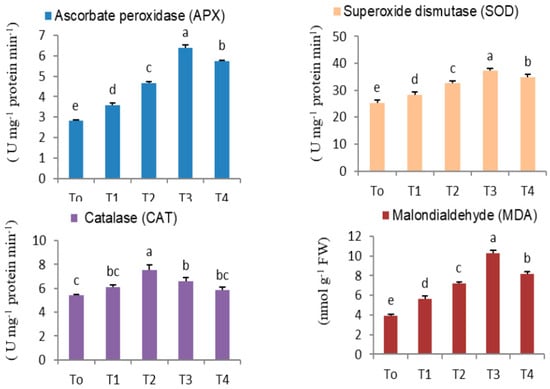
Figure 9.
APX, SOD, CAT anti-oxidant enzyme activities and MDA content in in vitro-regenerated safflower shoots after different levels of CdCl2 treatment (T0: Control; T1: 0.05; T2: 0.10; T3: 0.15; T4: 0.20 mM). Values are expressed as means ± standard errors of three replicates of two experiments. Means followed by the same letters are significantly different at p ≤ 0.05 according to Duncan’s multiple range test (DMRT).
4. Discussion
Plants are sessile organisms growing in the open and are vulnerable to different environmental stressors. To survive the unfavorable environment, plants regulate growth and development by triggering the synthesis and storage of secondary plant metabolites, which have a crucial role in the plant defense system [36]. In the present study, the plants were regenerated through somatic embryos, and the in vitro-grown tissues and organs like shoot, inflorescence, and callus were analyzed through GC–MS for secondary metabolite synthesis. The best somatic embryogenesis was noted in a 2.2 μM BAP + 5.4 μM NAA + 4.54 μM TDZ-added MS medium in which embryogenesis frequency (75.6 ± 2.6%) and somatic embryo numbers (20 ± 1.15) were high. The use of exogenous auxins alone or in conjunction with cytokinin has previously been considered to be an important criterion in developing embryogenic calluses and embryos in culture by accelerating cell division [36]. In a medium supplemented with GA3 + BAP + NAA, the embryos germinated, and floral buds developed on plantlets. The methanolic extracts of in vitro-raised plant tissues—embryogenic callus, shoot, and inflorescence—were separately evaluated via GC–MS technology by isolation of phytocompounds present in different tissues, similar to other studies [37]. The GC–MS study revealed that the embryogenic callus had 24 organic acids, 8 sugar alcohols, 7 fatty acids, and 10 amino acids; in regenerated shoots, there were 16 organic acids, 6 sugar alcohols, 5 fatty acids, 5 sugar acids, and 17 amino acids; moreover, 38 different phytocompounds were present in inflorescence. These phytocompounds of different origins show diverse medicinal properties. One such group of protective secondary plant metabolites is a flavonoid, synthesized through the phenylpropanoid pathway [38]. These flavonoids are non-enzymatic ROS scavengers that donate hydrogen atoms directly, inactivating ROS while converting themselves to phenoxy radicals and scavenging other highly reactive molecules [39]. Bioactive metabolites, such as anthocyanins, operate as potent anti-oxidants and metal ion chelators. Thus, exposure of tissues to heavy metals such as Cd acts as stimuli for anthocyanin production [40]. A similar increase in total flavonoid content under various biotic and abiotic stress was reported in several plants [41]. The present results suggest the presence of flavonoids (anthocyanidin, flavonols, flavanone, flavanol glycoside, and flavan-3-ols) with diverse pharmacological properties in C. tinctorius under CdCl2 stress. The T3 (0.15 mM) level of CdCl2 was identified to have a significant stimulatory effect on flavonoid accumulation. Previous studies also suggested that in vitro-applied CdCl2 induced the synthesis of pharmacologically significant secondary metabolites like reserpine and ajmalicine in devil pepper (Rauvolfia serpentina (L.) Benth. ex Kurz.) [42], alliin in garlic (Allium sativum L.) [43], and stevioside and rebaudioside in candyleaf (Stevia rebaudiana Bertoni) [44]. UHPLC–MS/MS analysis of embryogenic calluses revealed the presence of pharmacologically important flavonoids; hence, callus culture may be considered to be a promising system for flavonoid production and enrichment. The roles of flavonoids, identified in in vitro-regenerated safflower shoots and embryogenic callus, are summarized in Table 12.
Table 12.
Pharmacological roles of flavonoids identified in in vitro-regenerated safflower leaves and embryogenic callus.
The phytocompounds identified in the spectrum profile of the methanol extract of callus, shoots, and inflorescence of C. tinctorius confirmed that these compounds are promising candidates for therapeutic use. Among the important bioactive compounds detected, vitamin E can cure leukemia, tumors, cancer, dermatitis, ulcers, and inflammation. It has anti-aging, analgesic, antidiabetic, vasodilator, antispasmodic, antibronchitic, antiplasmodial, antimicrobial, and anti-inflammatory properties [55]. The 9, 12-octadecadienoic acid is beneficial in the treatment of inflammation, microbial illness, and arthritis [56]. Linoleic acid and oleic acid have antibacterial properties. Long-chain fatty alcohol n-nonadecanol-1 also showed antimicrobial properties. The straight-chain primary alcohol 1-heptacosanol acts as a flavoring and fragrance compound, which may reduce cholesterol levels, and it has antimicrobial, cytotoxic, and antithrombotic properties. Free fatty acids like long-chain unsaturated fatty acids have been reported to have antimicrobial, anti-inflammatory, and antifungal properties. The anticarcinogenic and anti-oxidant properties of 9-octadecenoic acid (Z)-, methyl ester, and heptacosane have also been described. Various hexadecenoic acid methyl ester activities like hypocholesterolemic, antifungal, anti-oxidant, antibacterial, nematicide, pesticide, anti-androgenic, flavor, hemolytic, and 5-alpha reductase’s inhibitory properties have previously been reported. Fatty acid methyl esters (FAME) with methanol identified in the GC–MS chromatogram of safflower extract are used in the production of biodiesel and detergents. The different biomolecules in safflower callus and in vitro-regenerated shoots and inflorescence with significant biological capabilities were established in this investigation, validating the medicinal and therapeutic uses of C. tinctorius.
Plants possess a natural defense system, including osmoprotectants (sugar, protein, proline, etc.) and enzymatic anti-oxidants (APX, SOD, and CAT) for protection against oxidative damage triggered by multitudinous environmental stresses. Plants can avoid dehydration by lowering osmotic potential, including enhancing the synthesis, accumulation, compartmentalization, and transport of organic osmolytes. Osmolytes, like soluble sugar, protein, and proline, play important roles in osmotic adjustments under heavy metal stress. The present research investigated the impact of CdCl2 stress on biochemical attributes in safflower. In response to induced abiotic stress, increased cytosolic proline, protein, sugar, and MDA content was observed at a high elicitor dose (T4). Increased proline level was seen as a physiological adaptation of plants to heavy metal stress to protect the cellular architecture [57]. Proline acts as a metal-chelating osmolyte, resulting in decreased phytotoxicity, and it is an anti-oxidant defense and messenger molecule. In addition, it may play a role in improving the stability and integrity of the biological membrane protein. Accumulated proline, acid amine, and osmotic substances neutralize the effect of heavy metal stress in plants. They also aid enzyme activity by increasing plant water uptake potential and can suppress programmed cell death. Elevated levels of proline in response to Cd stress have also been documented in many plants like chickpea (Cicer arietinum L.), devil pepper (Rauvolfia serpentina), garlic (Allium sativum), maize (Zea mays L.), and summer savory (Satureja Hortensis L.) [50,58]. Proteins make plants competent against heavy metal stress through various mechanisms involving ROS degeneration, metal sequestration in storage organelles, regulation of metallo-enzymes, and activation of genes involved in transcription [59]. Metallothioneins (MTs) are low-molecular-weight cysteine-rich proteins whose thiol group binds metals via mercaptide bonds and regulates metal metabolism in alleviating metal toxicity. Heavy metals such as Cd, Cu, Zn, Hg, Ni, and Co can trigger the transcriptional regulation of MT biosynthesis. Since sugar functions as an osmoprotectant and shields cellular membranes, high sugar levels were detected at elevated CdCl2 doses. This variation in soluble sugar concentration makes plants more tolerant to abiotic stress by altering signaling pathways, triggering the production of repair enzymes and effective ROS scavengers [60]. Following exposure to heavy metal stress, malondialdehyde (a cytotoxic byproduct of lipid peroxidation; MDA) increased because of membrane destabilization and enhanced free radical production, as reported in many plants [61,62,63,64]. In this safflower study, MDA content increased linearly till T3, and then it declined, as was observed in other plants under Cd stress.
Reactive oxygen species target biomolecules (proteins, lipids, and DNA) at various locations, triggering oxidation and altering their functional and structural properties [65,66]. Modifications of proteins may increase in plants subject to a variety of stress factors. Plants have evolved a complex anti-oxidant defense system that includes low-molecular-mass anti-oxidants like ascorbate, reduced glutathione, tocopherol, carotenoids, and flavonoids, along with anti-oxidant enzymes like superoxide dismutase (SOD), ascorbate peroxidase (APX), and catalase (CAT) to mitigate the adverse effects of oxidative stress. Several studies indicated that anti-oxidants have a defensive role against Cd stress in plants [67]. Cadmium indirectly boosts ROS production by interfering with electron transport, a pivotal event in photosystem II. In the present study, SOD activity in CdCl2-treated tissues increased linearly up to 0.15 mM (T3 treatment), beyond which (0.20 mM) a marginal decline was noted. A decline in SOD at high dose (T4) may be attributed to H2O2-mediated SOD inactivation, produced through enzymatic and non-enzymatic pathways in various cell compartments [68]. A similar response was noted in safflower and sunflower calluses in response to Cd (10–100 µM). Since SOD converts superoxide radical (O2−) to H2O2 and O2, its presence is proven to boost the defense mechanism in CdCl2-stressed cells, and thus SOD is more effective in quenching ROS. A similar increase in SOD activity was recorded in soybean (Glycine max (L.) Merr.), garlic (Allium sativum), in fenugreek (Trigonella foenumgraecum L.). APX and CAT are representative heme enzymes counteracting oxidative stress; CAT, in particular, is the main enzyme responsible for the catalytic scavenging of H2O2 into oxygen along with water in plant peroxisomes. Under CdCl2 stress, CAT activity elevated concurrently until T2, while APX activity increased until T3. Increased CAT and APX activity under abiotic stresses has been reported in several plants that have been studied, such as cucumber (Cucumis sativus L.) and garlic (Allium sativum) [69,70]. The decrease in CAT after T2 treatment could be attributed to the inhibitory action of nitric oxide (NO), which accumulates in peroxisomes in the presence of heavy metals and other abiotic stressors, as previously reported in arabidopsis (Arabidopsis thaliana (L.) Heynh.). On exposure to the elicitor (CdCl2), anti-oxidant enzyme activity increased, indicating induced oxidative stress. This suggests that CdCl2 elicitation is a promising strategy for inducing stress and may be utilized to produce secondary metabolites in plant cultures.
5. Conclusions
It is evident from the present GC–MS study that a diverse range of phytocompounds is present in embryogenic callus, regenerated shoots, and the inflorescence of in vitro-regenerated plants. This safflower plant may be used for large-scale production of pharmacologically active flavan-3-ols (epicatechin gallate), anthocyanidins (cyanidin, pelargonidin, delphinidin, peonidin), flavanones (naringenin), flavonols (quercetin, kaempferol, myricetin) and flavonol glycoside (rutin). The UHPLC–MS/MS analysis revealed that the addition of low CdCl2 doses (0.15–0.20 mM) efficiently enhanced several compounds, including a wide array of flavonoids. The amendment of CdCl2 induced cellular stress in culture. Biochemical attributes like protein, proline, sugar, malondialdehyde, and anti-oxidant enzyme activities (APX, CAT, and SOD) were elevated in ameliorating stress. The amendment of CdCl2 thus could be a practical approach for enhancing secondary metabolite synthesis in safflower. A thorough investigation of GC–MS and UHPLC–MS/MS identified phytochemicals, and an assessment of biological importance and toxicity will yield novel drugs with beneficial activity.
Supplementary Materials
The following supporting information can be downloaded at: https://www.mdpi.com/article/10.3390/metabo14020127/s1, Figure S1: Flavonoid calibration curve for quantification of analyte by UHPLC-MS/MS; Figure S2: MS/MS chromatograms of target flavonoids.
Author Contributions
Conceptualization, B.E. and A.M.; methodology, B.E.; validation, B.E., A.M. and Y.H.D.; formal analysis, B.E. and R.S.; investigation, B.E.; resources, B.E., K.B. and J.M.; data curation, B.E.; writing—original draft preparation, B.E.; writing—review and editing, A.M., Y.H.D. and K.M.-T.; visualization, B.E. and M.Q.M.; supervision, A.M.; project administration, A.M.; funding acquisition, B.E., Y.H.D. and K.M.-T. All authors have read and agreed to the published version of the manuscript.
Funding
This research was funded by the University Grant Commission (UGC) and the Department of Botany, Jamia Hamdard, for receiving financial assistance and other research facilities and Researchers Supporting Project number (RSP-2024R375), King Saud University, Riyadh, Saudi Arabia.
Institutional Review Board Statement
Not applicable.
Informed Consent Statement
Not applicable.
Data Availability Statement
The data used to support the findings of this study are not publicly available due to privacy or ethical restrictions, may be obtained from the corresponding author upon request.
Acknowledgments
Bushra Ejaz gratefully acknowledges the University Grant Commission (UGC), New Delhi, for providing a grant as UGC-SRF. The authors acknowledge the JNU advanced instrumentation facility (AIRF) for GC–MS, NIPGR Metabolome facility for UHPLC–MS/MS, and the authors acknowledge Researchers Supporting Project number (RSP-2024R375), King Saud University, Riyadh, Saudi Arabia.
Conflicts of Interest
The authors declare no conflict of interest.
References
- Mitra, S.; Lami, M.S.; Uddin, T.M.; Das, R.; Islam, F.; Anjum, J.; Hossain, M.J.; Emran, T.B. Prospective Multifunctional Roles and Pharmacological Potential of Dietary Flavonoid Narirutin. Biomed. Pharmacother. 2022, 150, 112932. [Google Scholar] [CrossRef]
- Ciaramella, B.R.; Corinzia, S.A.; Cosentino, S.L.; Testa, G. Phytoremediation of Heavy Metal Contaminated Soils Using Safflower. Agronomy 2022, 12, 2302. [Google Scholar] [CrossRef]
- Tu, Y.; Xue, Y.; Guo, D.; Sun, L.; Guo, M. Carthami Flos: A Review of Its Ethnopharmacology, Pharmacology and Clinical Applications. Rev. Bras. Farmacognosia 2015, 25, 553–566. [Google Scholar] [CrossRef]
- Sivasubramanian, R.; Brindha, P. In vitro cytotoxic, antioxidant and GC-MS studies on Centratherum punctatum Cass. Int. J. Pharm. Pharm. Sci. 2013, 5, 364–367. [Google Scholar]
- Mamgain, J.; Mujib, A.; Bansal, Y.; Gulzar, B.; Zafar, N.; Syeed, R.; Alsughayyir, A.; Dewir, Y.H. Elicitation Induced α-Amyrin Synthesis in Tylophora indica In Vitro Cultures and Comparative Phytochemical Analyses of In Vivo and Micropropagated Plants. Plants 2024, 13, 122. [Google Scholar] [CrossRef]
- Faisal, M.; Qahtan, A.A.; Alatar, A.A. Thidiazuron Induced In Vitro Plant Regeneration, Phenolic Contents, Antioxidant Potential, GC-MS Profiles and Nuclear Genome Stabil-ity of Plectranthus amboinicus (Lour.) Spreng. Horticulturae 2023, 9, 277. [Google Scholar] [CrossRef]
- Hübschmann, H.J. Handbook of GC-MS: Fundamentals and Applications; John Wiley & Sons: Hoboken, NJ, USA, 2015. [Google Scholar]
- Bansal, Y.; Mujib, A.; Mamgain, J.; Dewir, Y.H.; Rihan, H.Z. Phytochemical Composition and Detection of Novel Bioactives in Anther Callus of Catharanthus roseus L. Plants 2023, 12, 2186. [Google Scholar] [CrossRef] [PubMed]
- Mamgain, J.; Mujib, A.; Syeed, R.; Ejaz, B.; Malik, M.Q.; Bansal, Y. Genome Size and Gas Chromatography-Mass Spectrometry (GC–MS) Analysis of Field-Grown and In Vitro Regenerated Pluchea lanceolata Plants. J. Appl. Genet. 2023, 64, 1–21. [Google Scholar] [CrossRef] [PubMed]
- Arafa, N.M.; Girgis, N.; Ibrahem, M.; Mohamed, S.; El-Bahr, M.K. Phytochemical Profiling by GC-MS Analysis and Antimicrobial Activity Potential of In Vitro Derived Shoot Cultures of Some Egyptian Herbal Medicinal Plants. Egypt. J. Chem. 2022, 65, 155–169. [Google Scholar] [CrossRef]
- Satheesan, J.; Sabu, K.K. Endophytic Fungi for a Sustainable Production of Major Plant Bioactive Compounds. In Plant-Derived Bioactives; Swamy, M., Ed.; Springer: Berlin, Germany, 2020. [Google Scholar] [CrossRef]
- Mujib, A.; Tonk, D.; Gulzar, B.; Maqsood, M.; Ali, M. Quantification of Taxol by High-Performance Thin Layer Chromatography in Taxus Wallichiana Callus Cultivated In Vitro. Biotechnologia 2020, 101, 337–347. [Google Scholar] [CrossRef]
- Naik, P.M.; Al-Khayri, J.M. Impact of abiotic elicitors on in vitro production of plant secondary metabolites: A review. J. Adv. Res. Biotechnol. 2016. [Google Scholar] [CrossRef]
- Alcalde, M.A.; Perez-Matas, E.; Escrich, A.; Cusido, R.M.; Palazon, J.; Bonfill, M. Biotic Elicitors in Adventitious and Hairy Root Cultures: A Review from 2010 to 2022. Molecules 2022, 27, 5253. [Google Scholar] [CrossRef] [PubMed]
- Umnajkitikorn, K.; Faiyue, B.; Saengnil, K. Enhancing Antioxidant Properties of Germinated Thai Rice (Oryza sativa L.) cv. Kum Doi Saket with Salinity. J. Rice Res. 2013, 1, 10.4172. [Google Scholar] [CrossRef]
- Siddiqui, A.; Dixit, P.; Moid, H.; Afaq, U. Various Metabolites and Bioactive Compounds from Fruits, and Their Use in Nanoparticles Synthesis and Applications. In Nanomaterials from Agricultural and Horticultural Products. Smart Nanomaterials Technology; Husen, A., Ed.; Springer: Berlin, Germany, 2023; pp. 211–221. [Google Scholar] [CrossRef]
- Zhu, W.; Han, H.; Liu, A.; Guan, Q.; Kang, J.; David, L.; Dufresne, C.; Chen, S.; Tian, J. Combined Ultraviolet and Darkness Regulation of Medicinal Metabolites in Mahonia bealei Revealed by Proteomics and Metabolomics. J. Proteom. 2021, 233, 104081. [Google Scholar] [CrossRef] [PubMed]
- Perez de Souza, L.; Alseekh, S.; Scossa, F.; Fernie, A.R. Ultra-high-Performance Liquid Chromatography High-Resolution Mass Spectrometry Variants for Metabolomics Research. Nat. Methods 2021, 18, 733–746. [Google Scholar] [CrossRef]
- Araujo, N.M.P.; Arruda, H.S.; Dos Santos, F.N.; de Morais, D.R.; Pereira, G.A.; Pastore, G.M. LC-MS/MS Screening and Identification of Bioactive Compounds in Leaves, Pulp and Seed from Eugenia calycina Cambess. Food Res. Int. 2020, 137, 109556. [Google Scholar] [CrossRef] [PubMed]
- Vignesh, A.; Selvakumar, S.; Vasanth, K. Comparative LC-MS Analysis of Bioactive Compounds, Antioxidants and Antibacterial Activity from Leaf and Callus Extracts of Saraca asoca. Phytomed. Plus 2022, 2, 100167. [Google Scholar] [CrossRef]
- Śliwińska, A.; Naliwajski, M.R.; Pietrosiuk, A.; Sykłowska-Baranek, K. In Vitro Response of Polyscias filicifolia (Araliaceae) Shoots to Elicitation with Alarmone–Diadenosine Triphosphate, Methyl Jasmonate, and Salicylic Acid. Cells 2021, 10, 419. [Google Scholar] [CrossRef]
- Choudhury, F.K.; Rivero, R.M.; Blumwald, E.; Mittler, R. Reactive Oxygen Species, Abiotic Stress and Stress Combination. Plant J. 2017, 90, 856–867. [Google Scholar] [CrossRef]
- Dong, J.; Wan, G.; Liang, Z. Accumulation of Salicylic Acid-Induced Phenolic Compounds and Raised Activities of Secondary Metabolic and Antioxidative Enzymes in Salvia miltiorrhiza Cell Culture. J. Biotechnol. 2010, 148, 99–104. [Google Scholar] [CrossRef]
- Ejaz, B.; Mujib, A.; Mamgain, J.; Malik, M.Q.; Syeed, R.; Gulzar, B.; Bansal, Y. Comprehensive In Vitro Regeneration Study with SCoT Marker Assisted Clonal Stability Assessment and Flow Cytometric Genome Size Analysis of Carthamus tinctorius L.: An Important Medicinal Plant. Plant Cell Tiss. Organ Cult. 2022, 148, 403–418. [Google Scholar] [CrossRef]
- Murashige, T.; Skoog, F. A Revised Medium for Rapid Growth and Bio Assays with Tobacco Tissue Cultures. Physiol. Plant. 1962, 15, 473–497. [Google Scholar] [CrossRef]
- Kundu, A.; Mishra, S.; Vadassery, J. Spodoptera Litura-Mediated Chemical Defense Is Differentially Modulated in Older and Younger Systemic Leaves of Solanum lycopersicum. Planta 2018, 248, 981–997. [Google Scholar] [CrossRef]
- Talan, A.; Mujib, A.; Ejaz, B.; Bansal, Y.; Dewir, Y.H.; Magyar-Tábori, K. In Vitro Propagation and Phytochemical Composition of Centratherum punctatum Cass—A Medicinal Plant. Horticulturae 2023, 9, 1189. [Google Scholar] [CrossRef]
- Naik, J.; Rajput, R.; Pucker, B.; Stracke, R.; Pandey, A. The R2R3-MYB Transcription Factor MtMYB134 Orchestrates Flavonol Biosynthesis in Medicago truncatula. Plant Mol. Biol. 2021, 106, 157–172. [Google Scholar] [CrossRef] [PubMed]
- Bradford, M.M. A Rapid and Sensitive Method for the Quantitation of Microgram Quantities of Protein Utilizing the Principle of Protein-Dye Binding. Anal. Biochem. 1976, 72, 248–254. [Google Scholar] [CrossRef] [PubMed]
- Bates, L.S.; Waldren, R.P.; Teare, I.D. Rapid Determination of FreeProline of Water StressStudies. Plant Soil 1973, 39, 205–207. [Google Scholar] [CrossRef]
- Dey, P.M. Oligosaccharides. In Methods in Plant Biochemistry; Academic Press: Cambridge, MA, USA, 1990; pp. 189–218. [Google Scholar] [CrossRef]
- Aebi, H. Catalase In Vitro. Methods Enzymol. 1984, 105, 121–126. [Google Scholar] [CrossRef] [PubMed]
- Nakano, Y.; Asada, K. Hydrogen Peroxide Is Scavenged by Ascorbate-Specific Peroxidase in Spinach Chloroplasts. Plant Cell Physiol. 1981, 22, 867–880. [Google Scholar] [CrossRef]
- Dhindsa, R.S.; Plumb-Dhindsa, P.A.; Thorpe, T.A. Leaf Senescence: Correlated with Increased Levels of Membrane Permeability and Lipid Peroxidation, and Decreased Levels of Superoxide Dismutase and Catalase. J. Exp. Bot. 1981, 32, 93–101. [Google Scholar] [CrossRef]
- Duncan, D.B. Multiple Range and Multiple F Tests. Biometrics 1955, 11, 1–42. [Google Scholar] [CrossRef]
- Padma, M.; Ganesan, S.; Jayaseelan, T.; Azhagumadhavan, S.; Sasikala, P.; Senthilkumar, S.; Mani, P. Phytochemical screening and GC–MS analysis of bioactive compounds present in ethanolic leaves extract of Silybum marianum (L). J. Drug Deliv. Therap. 2019, 9, 85–89. [Google Scholar] [CrossRef]
- Jahan, I.; Tona, M.R.; Sharmin, S.; Sayeed, M.A.; Tania, F.Z.; Paul, A.; Chy, M.N.; Rakib, A.; Emran, T.B.; Simal-Gandara, J. GC-MS phytochemical profiling, pharmacological properties, and in silico studies of Chukrasia velutina leaves: A novel source for bioactive agents. Molecules 2020, 15, 3536. [Google Scholar] [CrossRef] [PubMed]
- Treml, J.; Šmejkal, K. Flavonoids as Potent Scavengers of Hydroxyl Radicals. Compr. Rev. Food Sci. Food Saf. 2016, 15, 720–738. [Google Scholar] [CrossRef]
- Kapoor, D.; Singh, M.P.; Kaur, S.; Bhardwaj, R.; Zheng, B.; Sharma, A. Modulation of the Functional Components of Growth, Photosynthesis, and Anti-oxidant Stress Markers in Cadmium Exposed Brassica juncea L. Plants 2019, 8, 260. [Google Scholar] [CrossRef]
- Ibrahim, M.H.; Chee Kong, Y.; Mohd Zain, N.A. Effect of Cadmium and Copper Exposure on Growth, Secondary Metabolites and Antioxidant Activity in the Medicinal Plant Sambung Nyawa (Gynura procumbens (Lour.) Merr). Molecules 2017, 22, 1623. [Google Scholar] [CrossRef]
- Rao, K.; Chodisetti, B.; Gandi, S.; Giri, A.; Kavi Kishor, P.B. Cadmium Chloride Elicitation of Abutilon indicum Cell Suspension Cultures for Enhanced Stigmasterol Production. Plant Biosyst. 2022, 156, 613–618. [Google Scholar] [CrossRef]
- Zafar, N.; Mujib, A.; Ali, M.; Tonk, D.; Gulzar, B.; Malik, M.Q.; Mamgain, J.; Sayeed, R. Cadmium Chloride (CdCl2) Elicitation Improves Reserpine and Ajmalicine Yield in Rauvolfia Serpentina as Revealed by High-Performance Thin-Layer Chromatography (HPTLC). 3Biotech 2020, 10, 344. [Google Scholar] [CrossRef]
- Malik, M.Q.; Mujib, A.; Gulzar, B.; Zafar, N.; Syeed, R.; Mamgain, J.; Ejaz, B.; Kanchan. Enrichment of Alliin in Different In Vitro Grown Tissues of Allium sativum through CdCl2 Elicitation as Revealed by High Performance Thin Layer Chromatography (HPTLC). Ind. Crops Prod. 2020, 158, 113007. [Google Scholar] [CrossRef]
- Tahmasi, S.; Garoosi, G.A.; Ahmadi, J. Cadmium Chloride and Silver Nitrate Affect the Gene Expression, Stevioside, and Rebaudioside: A Production in Stevia rebaudiana (Bert.). Indian J. Pharm. Sci. 2021, 83, 663–670. [Google Scholar] [CrossRef]
- Zaidun, N.H.; Thent, Z.C.; Latiff, A.A. Combating Oxidative Stress Disorders with Citrus Flavonoid: Naringenin. Life Sci. 2018, 208, 111–122. [Google Scholar] [CrossRef]
- Azeem, M.; Hanif, M.; Mahmood, K.; Ameer, N.; Chughtai, F.R.S.; Abid, U. An Insight into Anticancer, Antioxidant, Antimicrobial, Antidiabetic and Anti-Inflammatory Effects of Quercetin: A Review. Polym. Bull. 2023, 80, 241–262. [Google Scholar] [CrossRef]
- Song, X.; Tan, L.; Wang, M.; Ren, C.; Guo, C.; Yang, B.; Ren, Y.; Cao, Z.; Li, Y.; Pei, J. Myricetin: A Review of the Most Recent Research. Biomed. Pharmacother. 2021, 134, 111017. [Google Scholar] [CrossRef]
- Ren, J.; Lu, Y.; Qian, Y.; Chen, B.; Wu, T.; Ji, G. Recent Progress Regarding Kaempferol for the Treatment of Various Diseases. Review. Exp. Ther. Med. 2019, 18, 2759–2776. [Google Scholar] [CrossRef] [PubMed]
- Pan, M.H.; Chiou, Y.S.; Wang, Y.J.; Ho, C.T.; Lin, J.K. Multistage Carcinogenesis Process as Molecular Targets in Cancer Chemoprevention by Epicatechin-3-Gallate. Food Funct. 2011, 2, 101–110. [Google Scholar] [CrossRef]
- Semwal, R.; Joshi, S.K.; Semwal, R.B.; Semwal, D.K. Health Benefits and Limitations of Rutin-A Natural Flavonoid with High Nutraceutical Value. Phytochem. Lett. 2021, 46, 119–128. [Google Scholar] [CrossRef]
- Vaiyapuri, M.; Thimmarayan, S.; Dhupal, M.; Rallabandi, H.R.; Mekapogu, M.; Vasamsetti, B.M.K.; Natesan, K. Pelargonidin, a Dietary Anthocyanidin in the Prevention of Colorectal Cancer and Its Chemoprotective Mechanisms. In Plant-Derived Bioactives: Chemistry and Mode of Action; Springer Nature: Singapore, 2020; pp. 119–135. [Google Scholar]
- Suantawee, T.; Thilavech, T.; Cheng, H.; Adisakwattana, S. Cyanidin Attenuates Methylglyoxal-Induced Oxidative Stress and Apoptosis in INS-1 Pancreatic β-Cells by Increasing glyoxalase-1 Activity. Nutrients 2020, 12, 1319. [Google Scholar] [CrossRef] [PubMed]
- Chen, Z.; Zhang, R.; Shi, W.; Li, L.; Liu, H.; Liu, Z.; Wu, L. The Multifunctional Benefits of Naturally Occurring Delphinidin and Its Glycosides. J. Agric. Food Chem. 2019, 67, 11288–11306. [Google Scholar] [CrossRef] [PubMed]
- Sharma, A.; Choi, H.K.; Kim, Y.K.; Lee, H.J. Delphinidin and Its Glycosides War on Cancer: Preclinical Perspectives. Int. J. Mol. Sci. 2021, 22, 11500. [Google Scholar] [CrossRef] [PubMed]
- Ogukwe, C.E.; Chris, O.A.; Brendan, O.E.; Henry, E.O. Evaluation of the Antitumour Agents in Annona muricata (Linn.) Leaves Using Column Chromatography and Gas Chromatography-Mass Spectrometry. World J. Pharm. Res. 2016, 5, 5–17. [Google Scholar]
- El-Beltagi, H.S.; Mohamed, H.I.; Sofy, M.R. Role of Ascorbic Acid, Glutathione and Proline Applied as Singly or in Sequence Combination in Improving Chickpea Plant through Physiological Change and Antioxidant Defense Under Different Levels of Irrigation Intervals. Molecules 2020, 25, 1702. [Google Scholar] [CrossRef]
- Dar, M.I.; Naikoo, M.I.; Rehman, F.; Naushin, F.; Khan, F.A. Proline Accumulation in Plants: Roles in Stress Tolerance and Plant Development. Osmolytes Plants Acclim. Changing Environ. 2016, 155–166. [Google Scholar]
- Azizi, I.; Esmaielpour, B.; Fatemi, H. Exogenous Nitric Oxide on Morphological, Biochemical and Antioxidant Enzyme Activity on Savory (Satureja hortensis L.) Plants Under Cadmium Stress. J. Saudi Soc. Agric. Sci. 2021, 20, 417–423. [Google Scholar] [CrossRef]
- Hosseinifard, M.; Stefaniak, S.; Ghorbani Javid, M.; Soltani, E.; Wojtyla, Ł.; Garnczarska, M. Contribution of Exogenous Proline to Abiotic Stresses Tolerance in Plants: A Review. Int. J. Mol. Sci. 2022, 23, 5186. [Google Scholar] [CrossRef] [PubMed]
- Gugale, G.S.; Bhusare, B.P.; Ambawade, M.S.; Kshatriya, A.S.; Barwant, M.M.; Mhaske, A.K. Effect of Cadmium Chloride on Seed Germination, Seedling Growth Parameters, and Proline Content in Maize (Zea mays). Int. All J. Res. Educ. Sci. Meth. 2021, 9, 1818–1822. [Google Scholar]
- Georgiadou, E.C.; Kowalska, E.; Patla, K.; Kulbat, K.; Smolińska, B.; Leszczyńska, J.; Fotopoulos, V. Influence of Heavy Metals (Ni, Cu, and Zn) on Nitro-Oxidative Stress Responses, Proteome Regulation and Allergen Production in Basil (Ocimum basilicum L.). Plants. Front. Plant Sci. 2018, 9, 862. [Google Scholar] [CrossRef] [PubMed]
- Hossain, M.A.; Kumar, V.; Burritt, D.J.; Fujita, M.; Mäkelä, P. Proline Metabolism and Its Functions in Development and Stress Tolerance. In Osmoprotectant-Mediated Abiotic Stress Tolerance in Plantsa; Springer: Berlin, Germany, 2019; pp. 41–72. [Google Scholar]
- Anjitha, K.S.; Sameena, P.P.; Puthur, J.T. Functional Aspects of Plant Secondary Metabolites in Metal Stress Tolerance and Their Importance in Pharmacology. Plant Stress 2021, 2, 100038. [Google Scholar] [CrossRef]
- Corpas, F.J.; Barroso, J.B. Lead-Induced Stress, Which Triggers the Production of Nitric Oxide (NO) and Superoxide Anion (O2·−) in Arabidopsis Peroxisomes, Affects Catalase Activity. Nitric Oxide 2017, 68, 103–110. [Google Scholar] [CrossRef]
- Sachdev, S.; Ansari, S.A.; Ansari, M.I.; Fujita, M.; Hasanuzzaman, M. Abiotic Stress and Reactive Oxygen Species: Generation, Signaling, and Defense Mechanisms. Antioxidants 2021, 10, 277. [Google Scholar] [CrossRef]
- de Morais Cardoso, L.; Pinheiro, S.S.; Martino, H.S.D.; Pinheiro-Sant’Ana, H.M. Sorghum (Sorghum bicolor L.): Nutrients, Bioactive Compounds, and Potential Impact on Human Health. Crit. Rev. Food Sci. Nutr. 2017, 57, 372–390. [Google Scholar] [CrossRef]
- Jawad Hassan, M.; Ali Raza, M.; Ur Rehman, S.; Ansar, M.; Gitari, H.; Khan, I.; Wajid, M.; Ahmed, M.; Abbas Shah, G.; Peng, Y.; et al. Effect of Cadmium Toxicity on Growth, Oxidative Damage, Antioxidant Defense System and Cadmium Accumulation in Two Sorghum Cultivars. Plants 2020, 9, 1575. [Google Scholar] [CrossRef] [PubMed]
- Alyemeni, M.N.; Ahanger, M.A.; Wijaya, L.; Alam, P.; Ahmad, P. Contrasting Tolerance Among Soybean Genotypes Subjected to Different Levels of Cadmium Stress. Pak. J. Bot. 2017, 49, 903–911. [Google Scholar]
- Kamalvand, A.A.; Hosseini Sarghein, S.; Karamian, R. Impact of Cadmium Stress on Growth and Physiological Responses of Fenugreek (Trigonella foenum-Graecum L.). J. Plant Physiol. Breed 2022, 12, 51–65. [Google Scholar]
- Zhu, L.-J.; Deng, X.-G.; Zou, L.-J.; Zhang, D.-W.; Lin, H.-H. Enhancement of Stress Tolerance in Cucumber Seedlings by Proanthocyanidins. Biol. Plant. 2017, 61, 323–332. [Google Scholar] [CrossRef]
Disclaimer/Publisher’s Note: The statements, opinions and data contained in all publications are solely those of the individual author(s) and contributor(s) and not of MDPI and/or the editor(s). MDPI and/or the editor(s) disclaim responsibility for any injury to people or property resulting from any ideas, methods, instructions or products referred to in the content. |
© 2024 by the authors. Licensee MDPI, Basel, Switzerland. This article is an open access article distributed under the terms and conditions of the Creative Commons Attribution (CC BY) license (https://creativecommons.org/licenses/by/4.0/).