
Untargeted and Targeted Lipidomics Unveil Dynamic Lipid Metabolism Alterations in Type 2 Diabetes


Abstract
1. Introduction
2. Materials and Methods
2.1. Chemicals and Reagents
2.2. Study Subjects
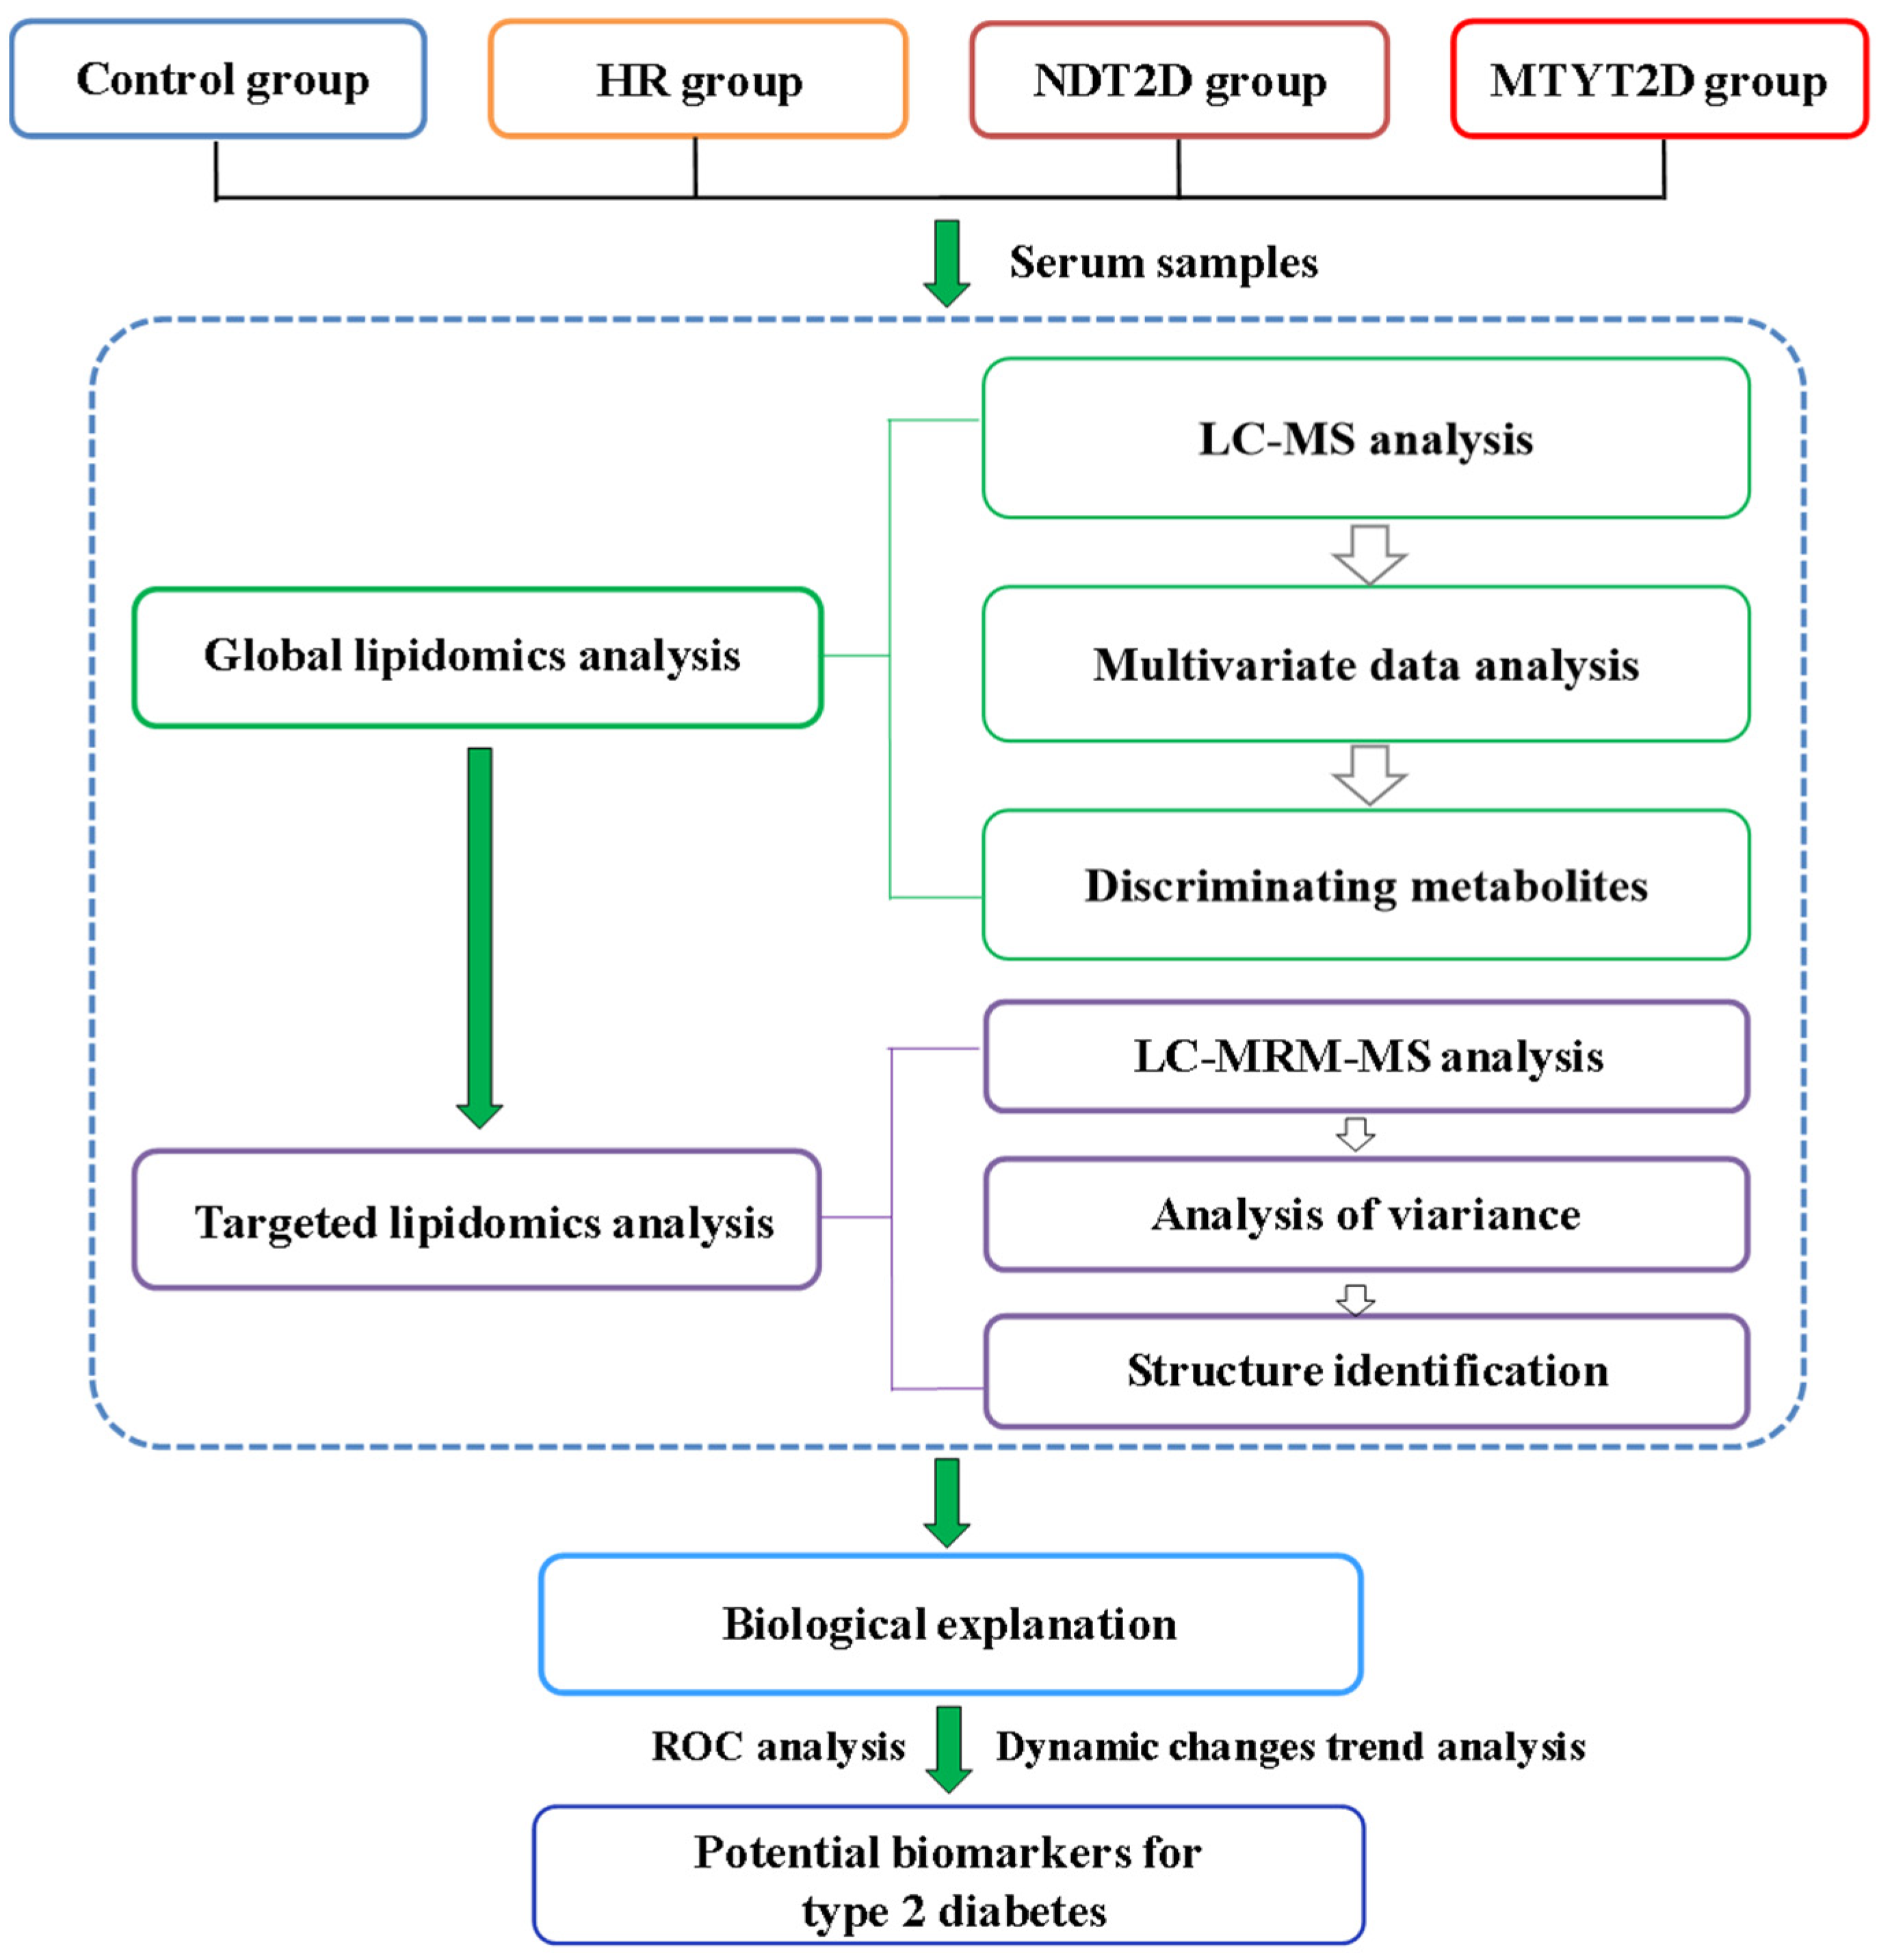
2.3. Lipidomics Analysis
2.3.1. Sample Preparation
2.3.2. Untargeted Lipidomics Analysis
2.3.3. Targeted Lipidomics Analysis
2.3.4. Raw Data Processing
2.4. Statistical Analysis
3. Results
3.1. Untargeted Lipidomics Analysis
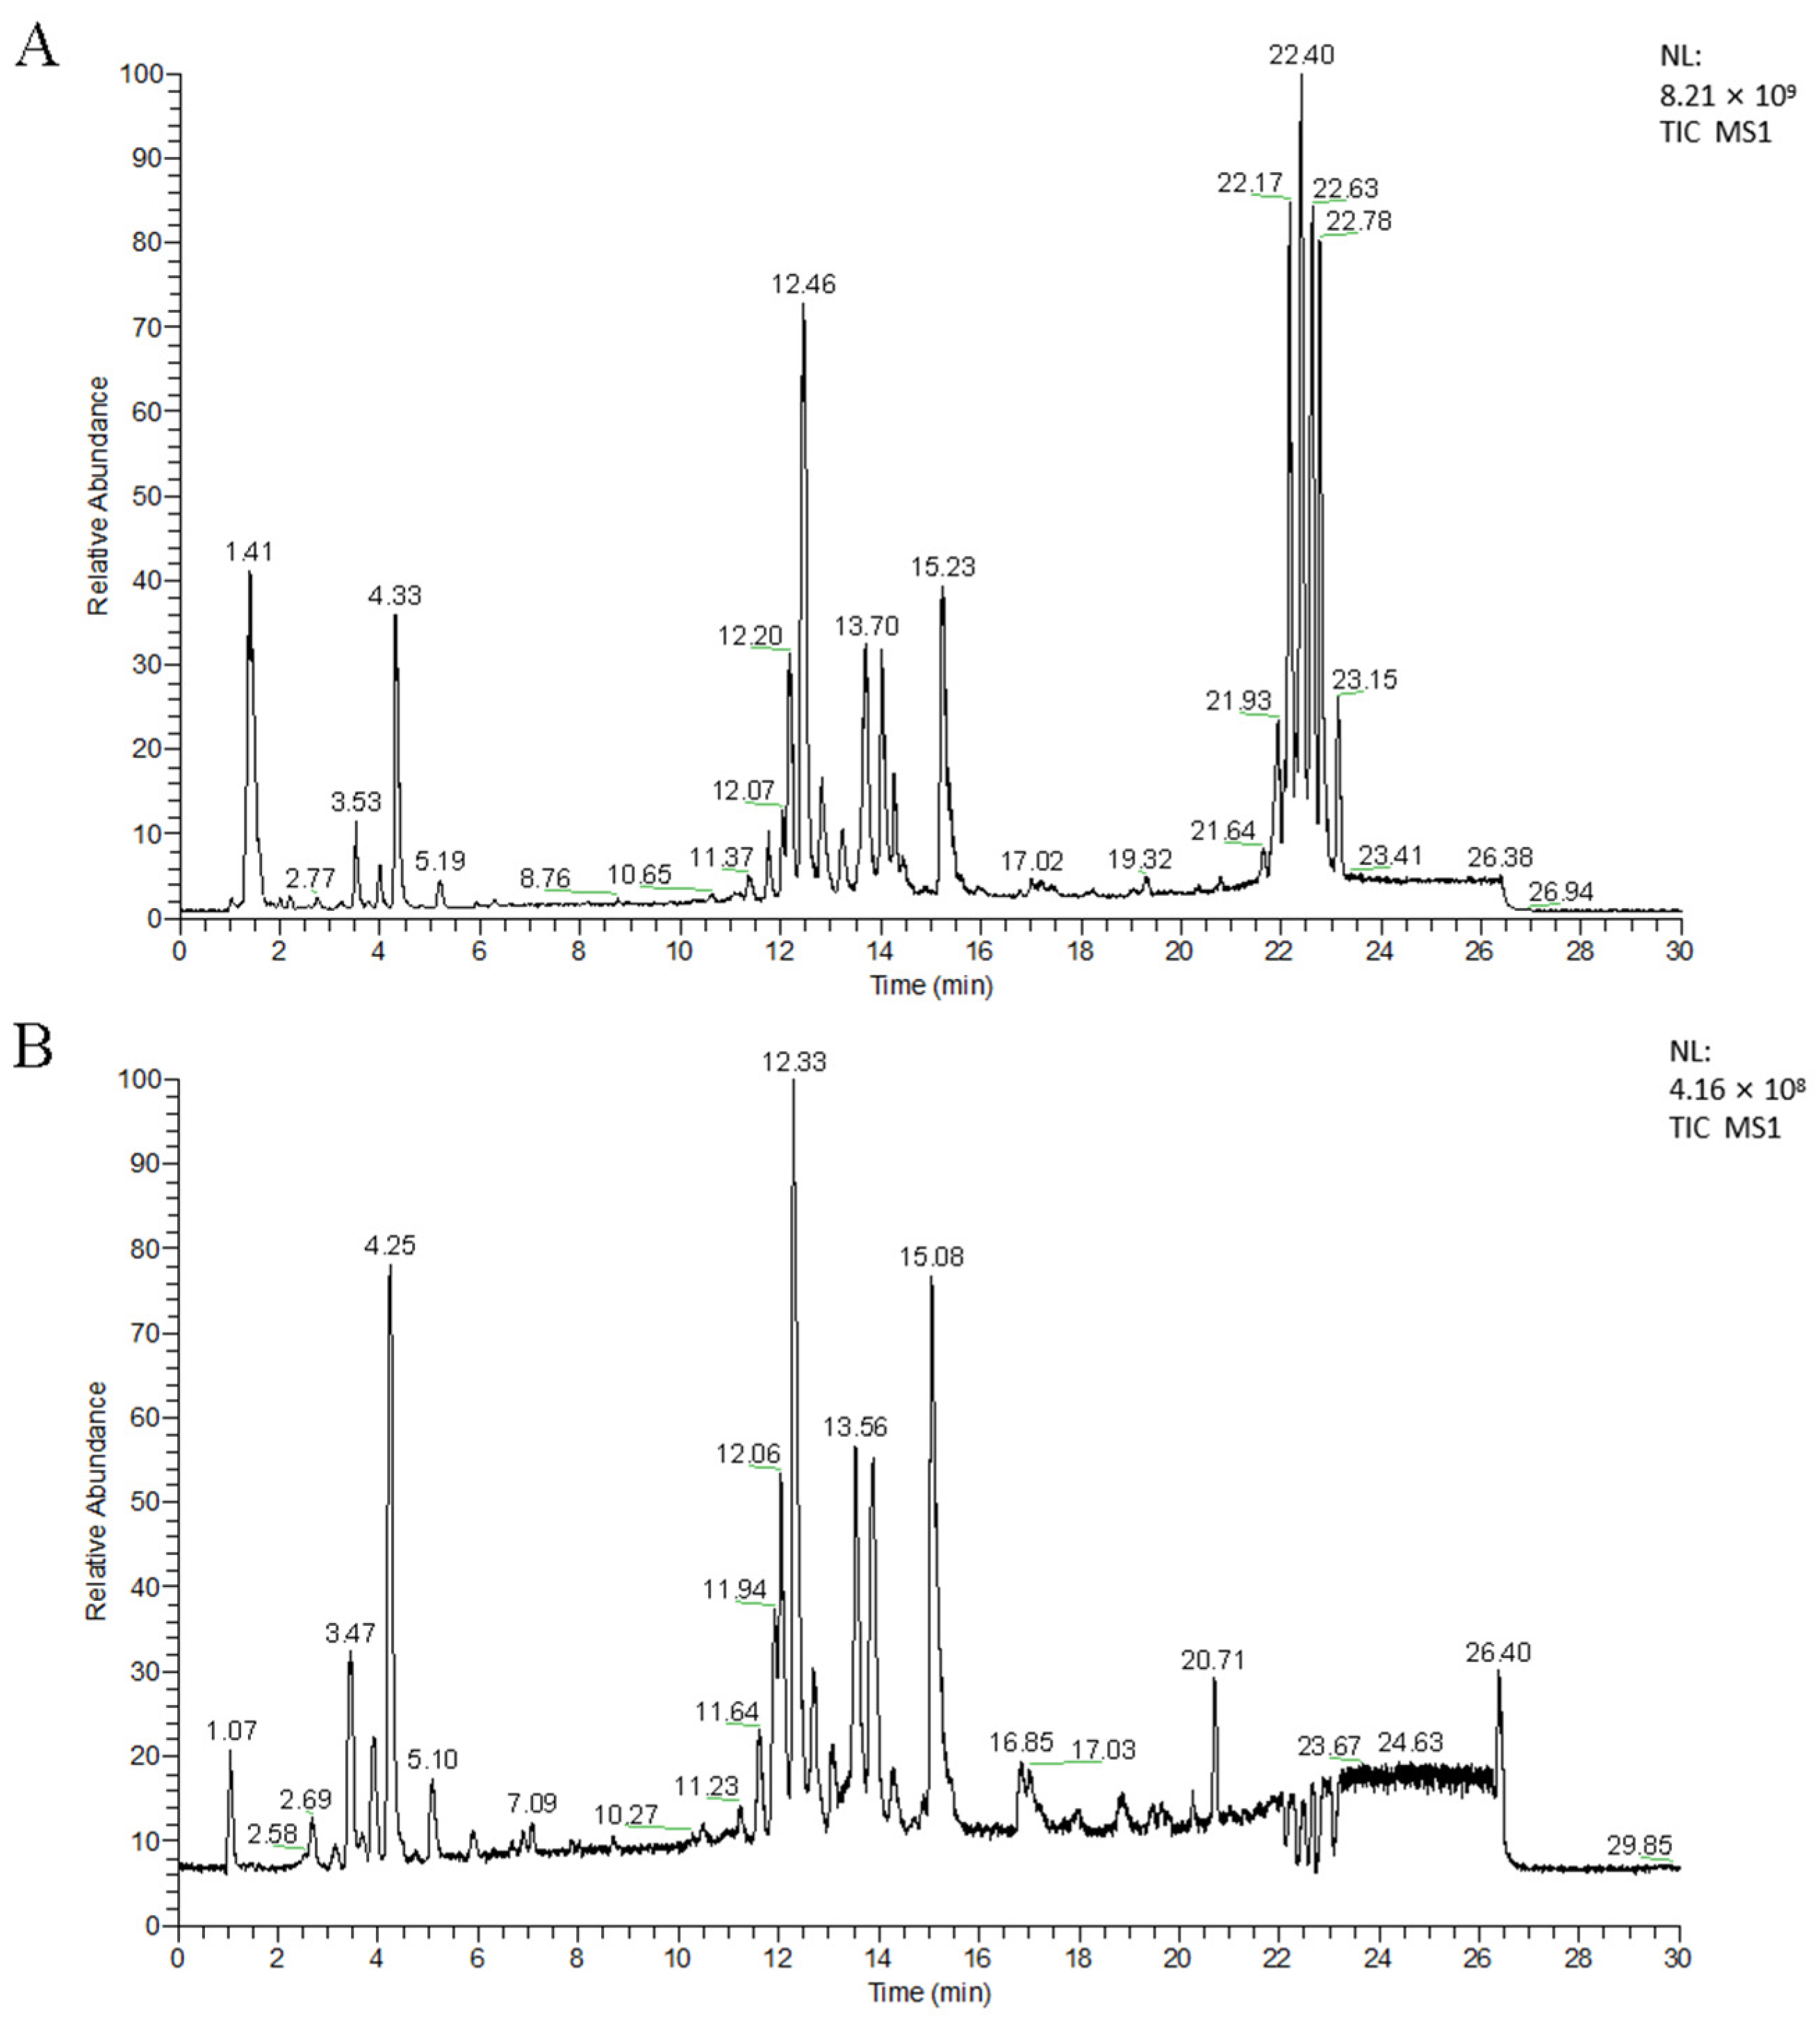
3.1.1. UPLC-MS Analysis
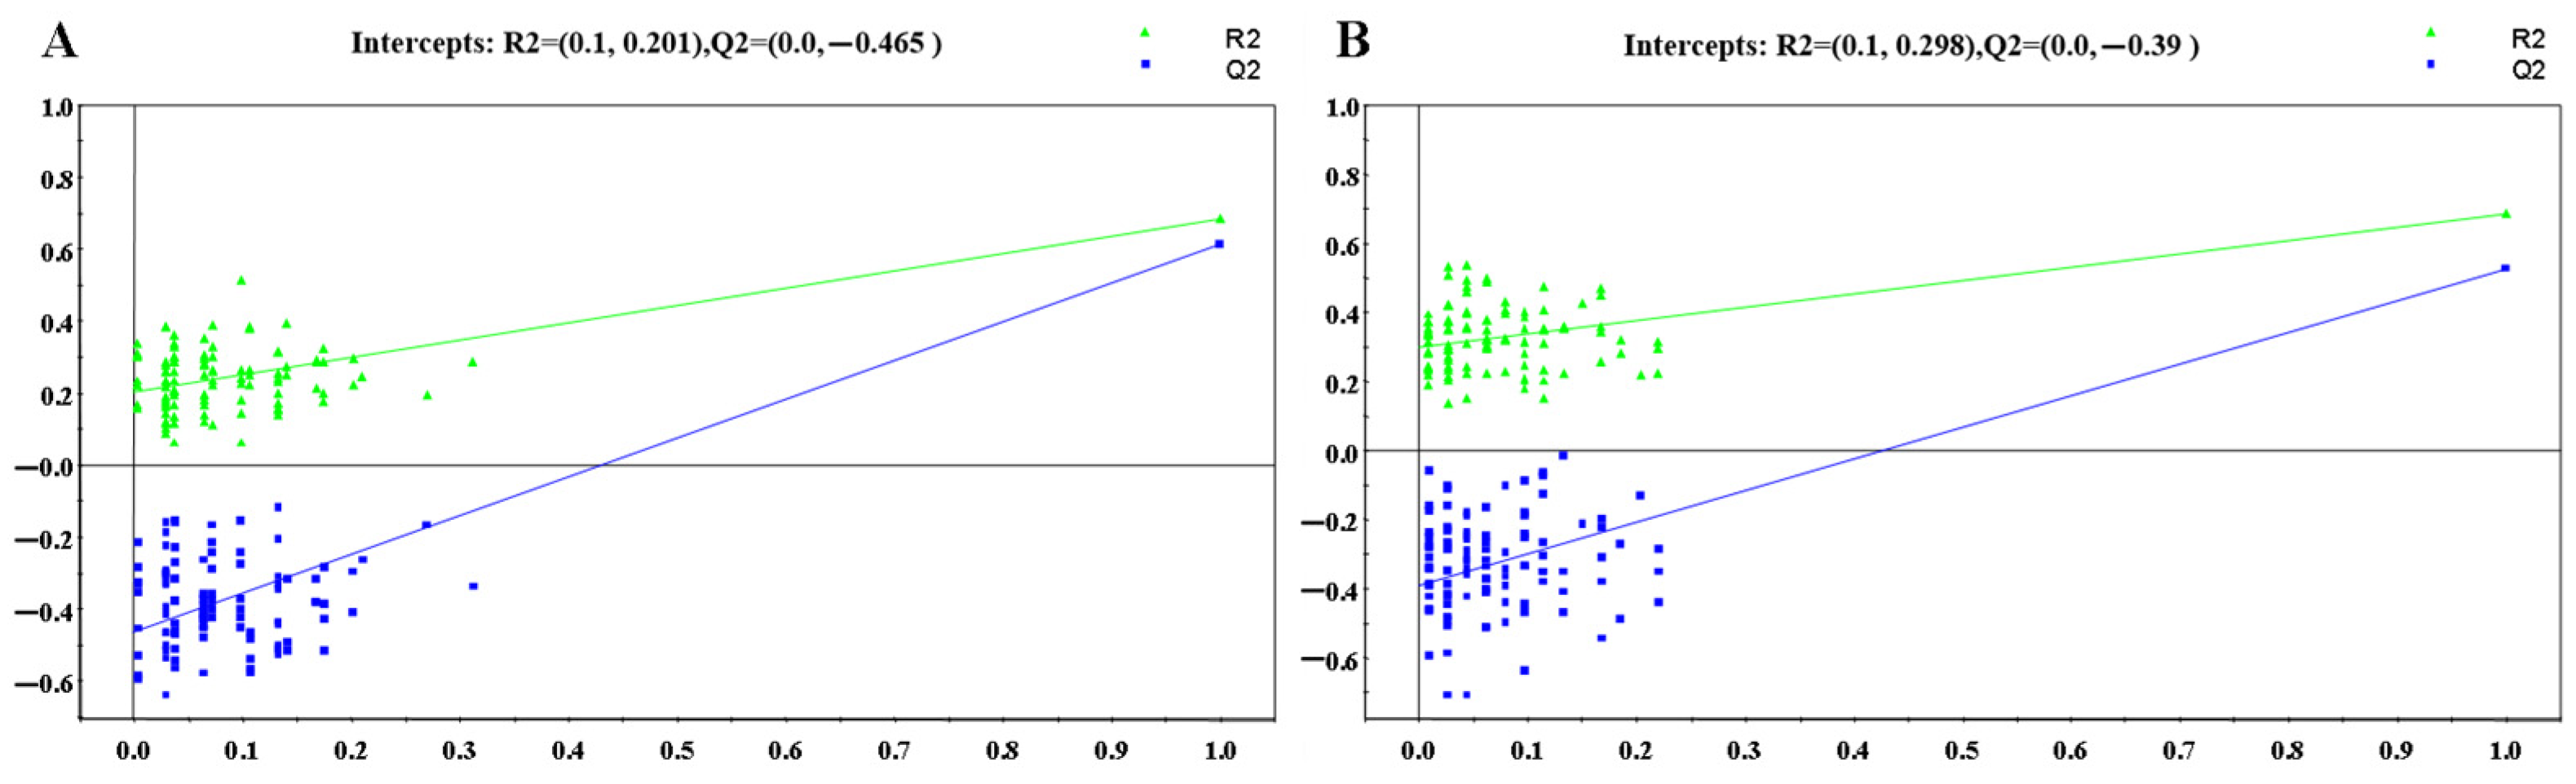
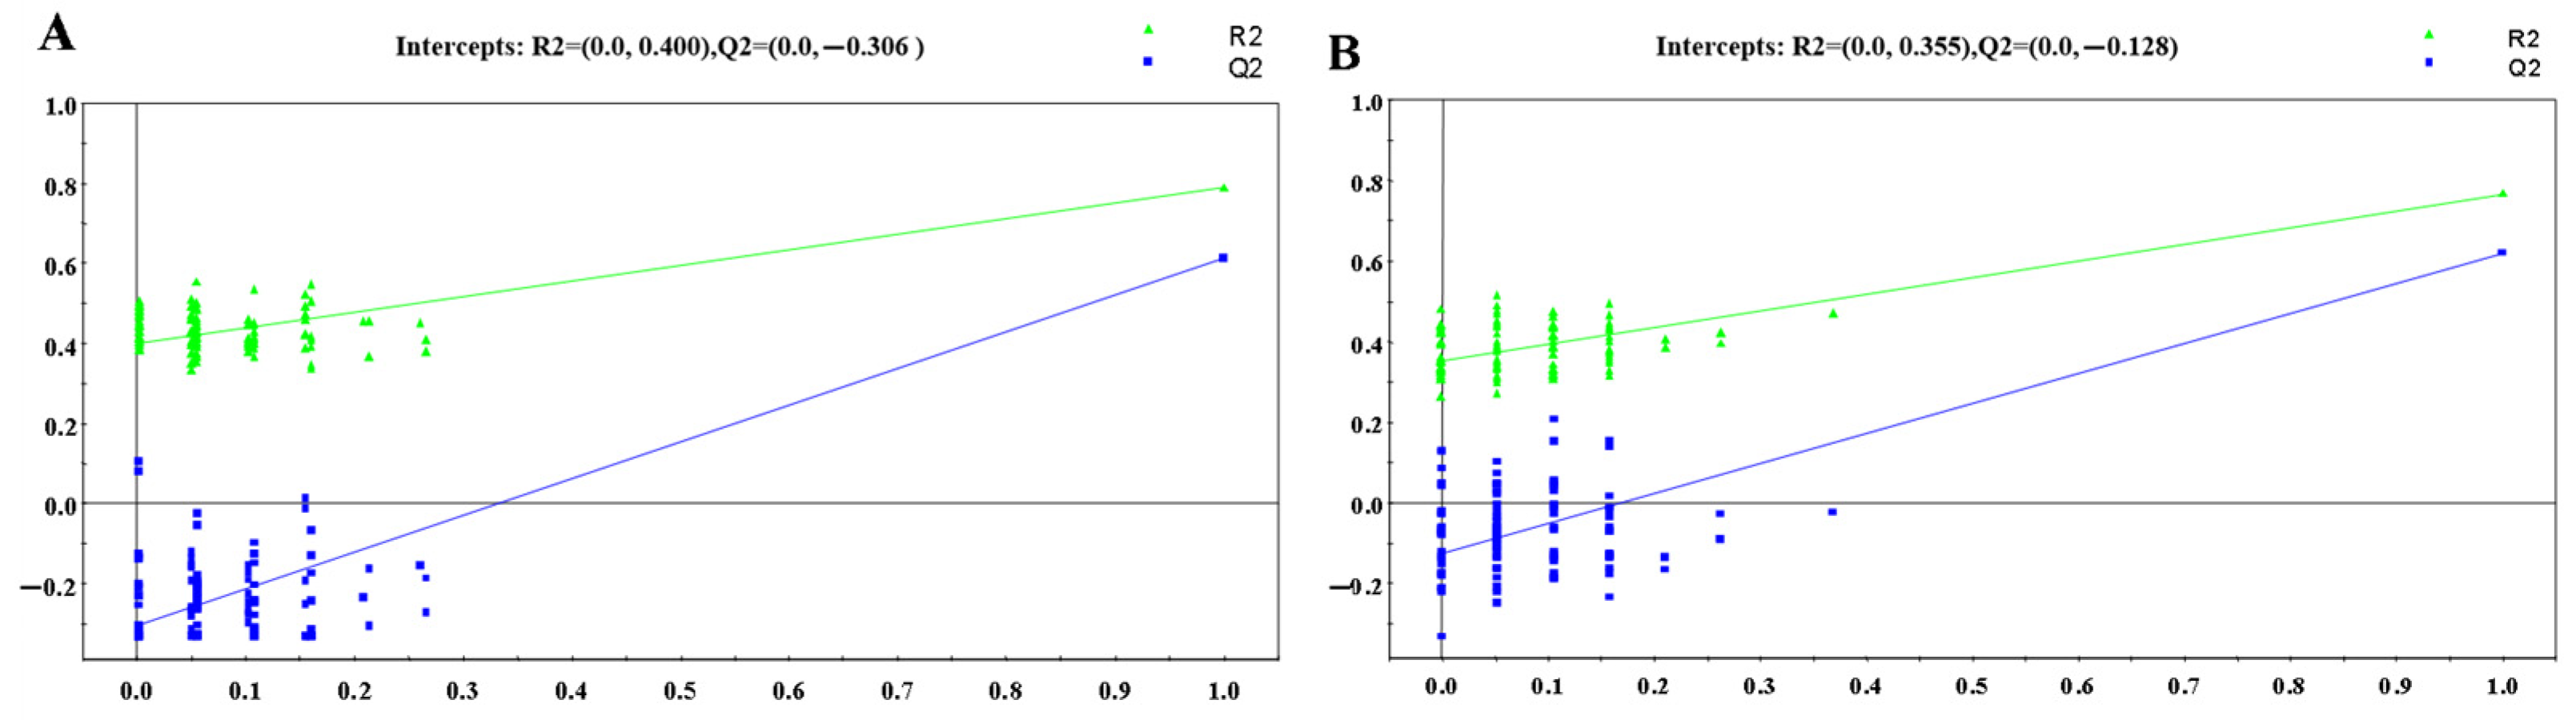
3.1.2. OPLS-DA Analysis
3.1.3. Screening of Differential Metabolites
3.2. Targeted Validation of Differential Metabolites
3.3. Structural Identification of Differential Metabolites
4. Discussion
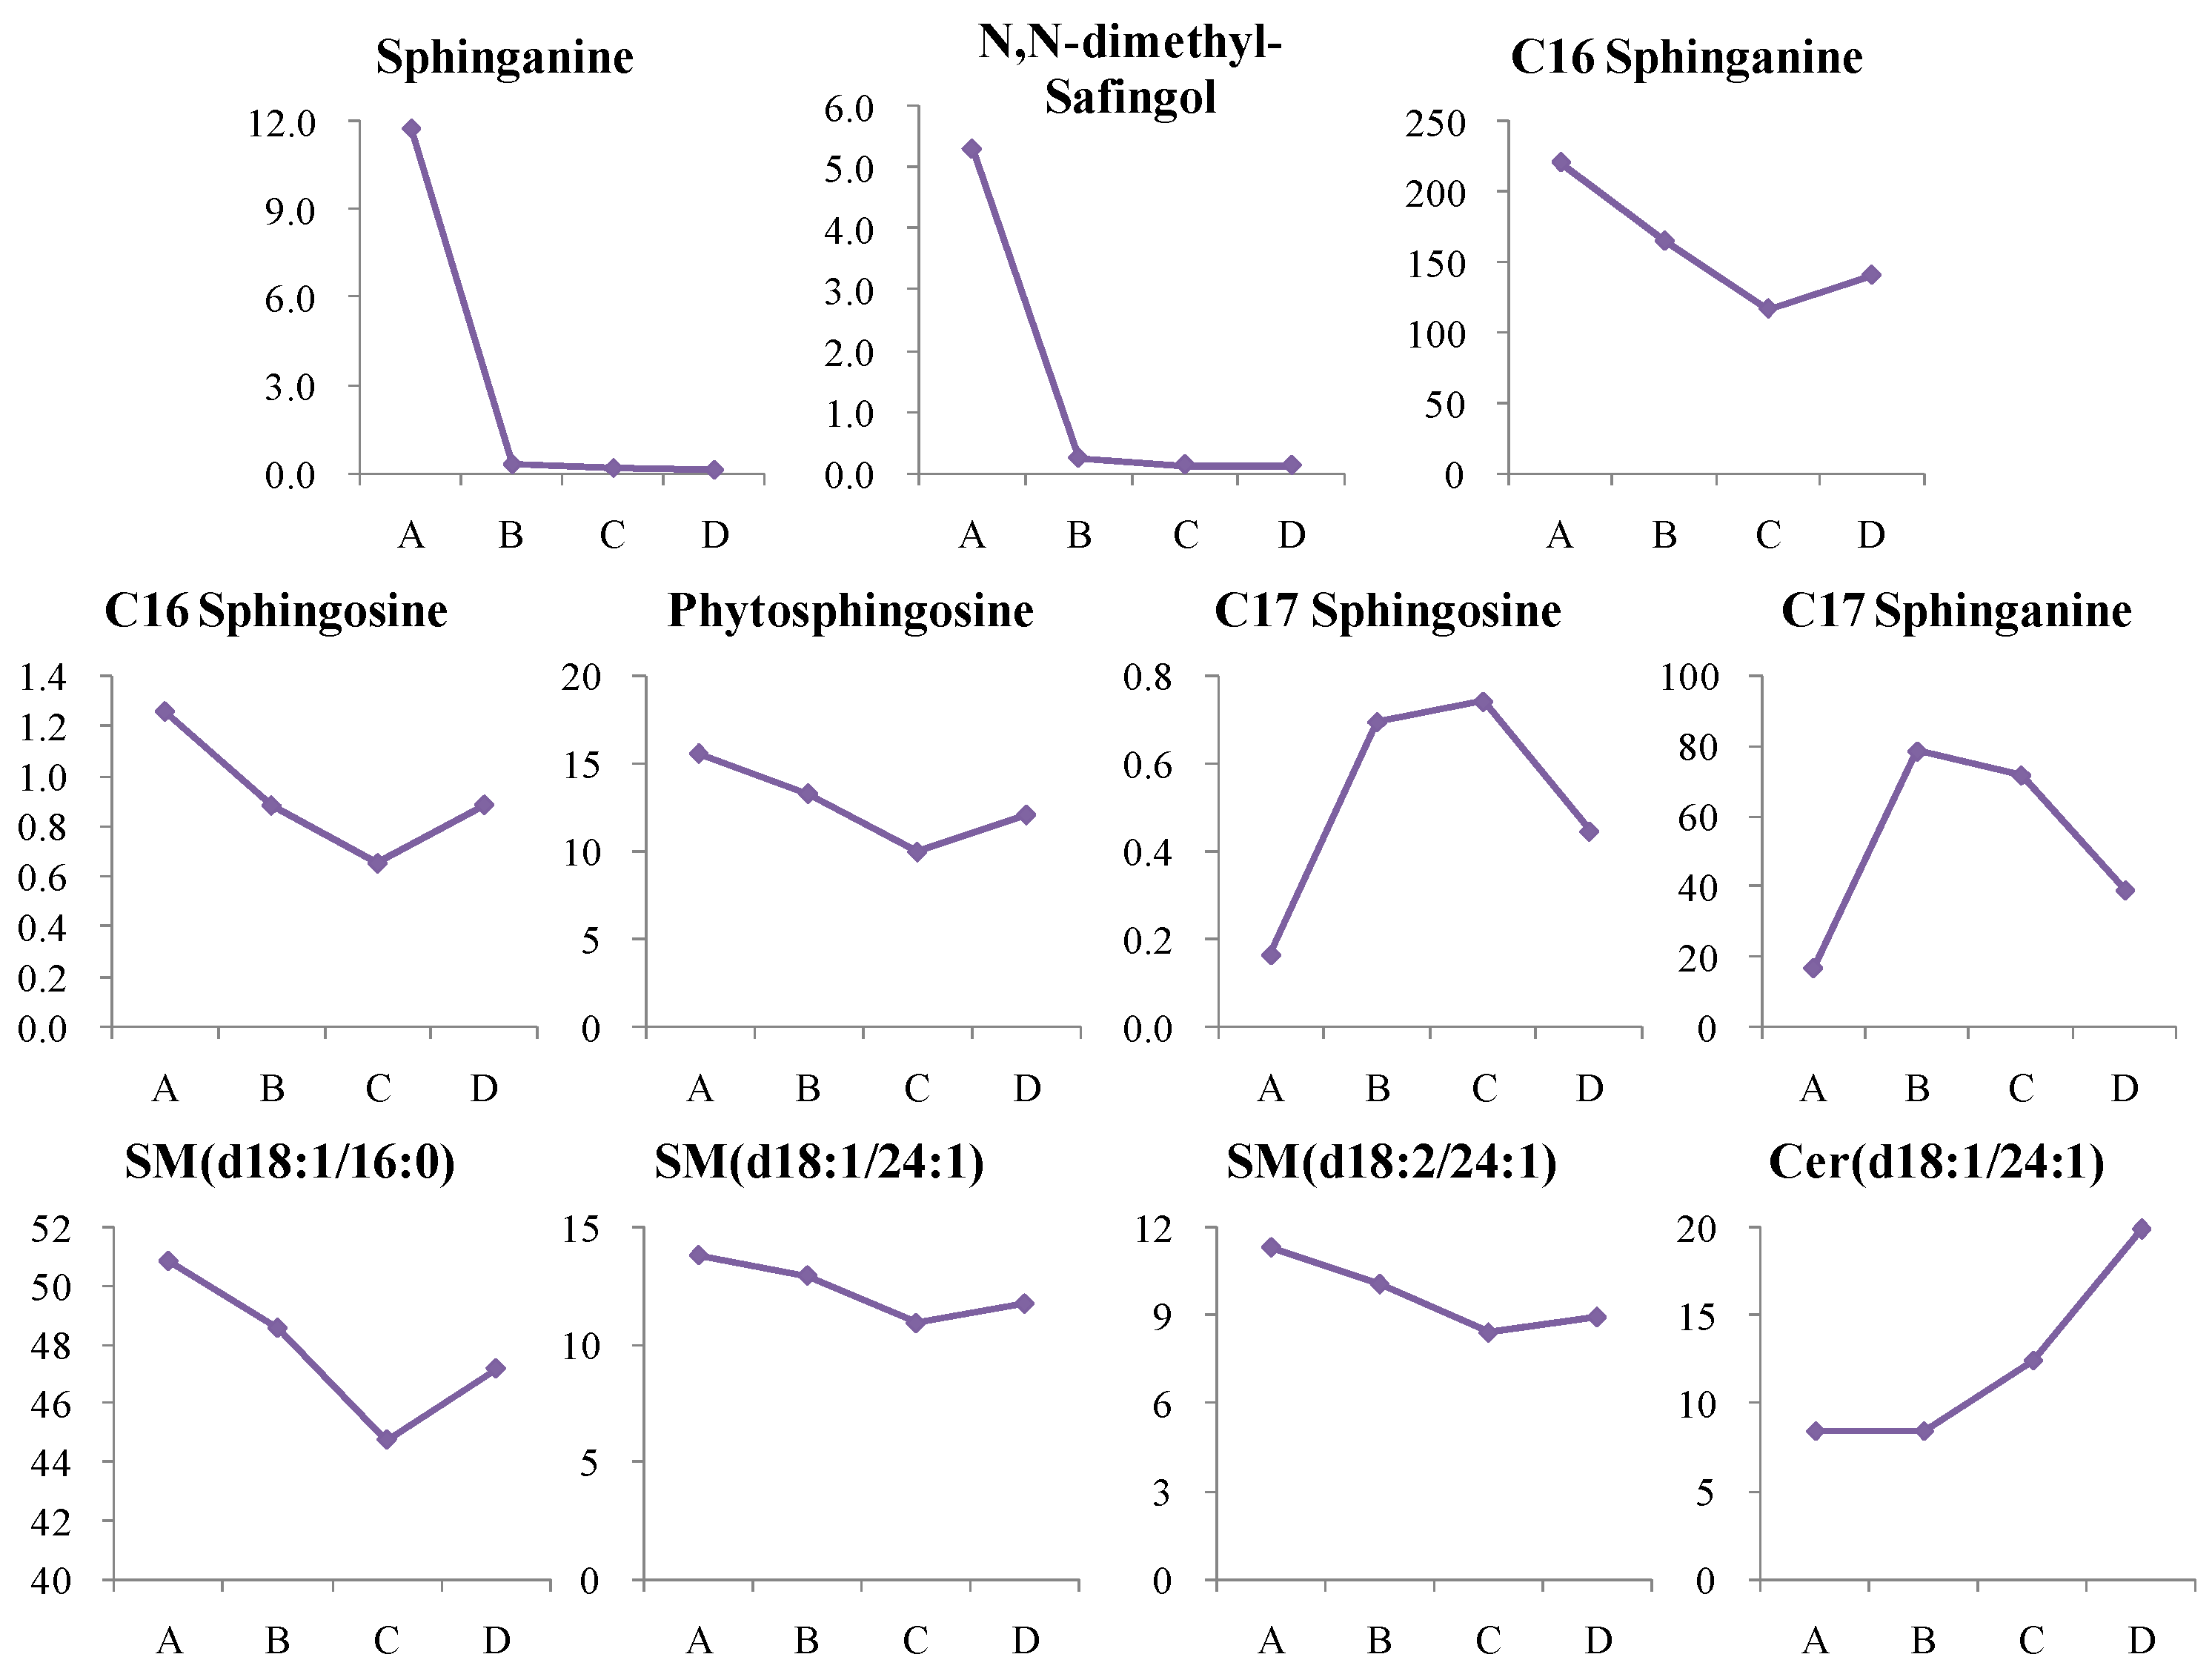
4.1. Dynamic Trend Analysis of Differential Metabolites
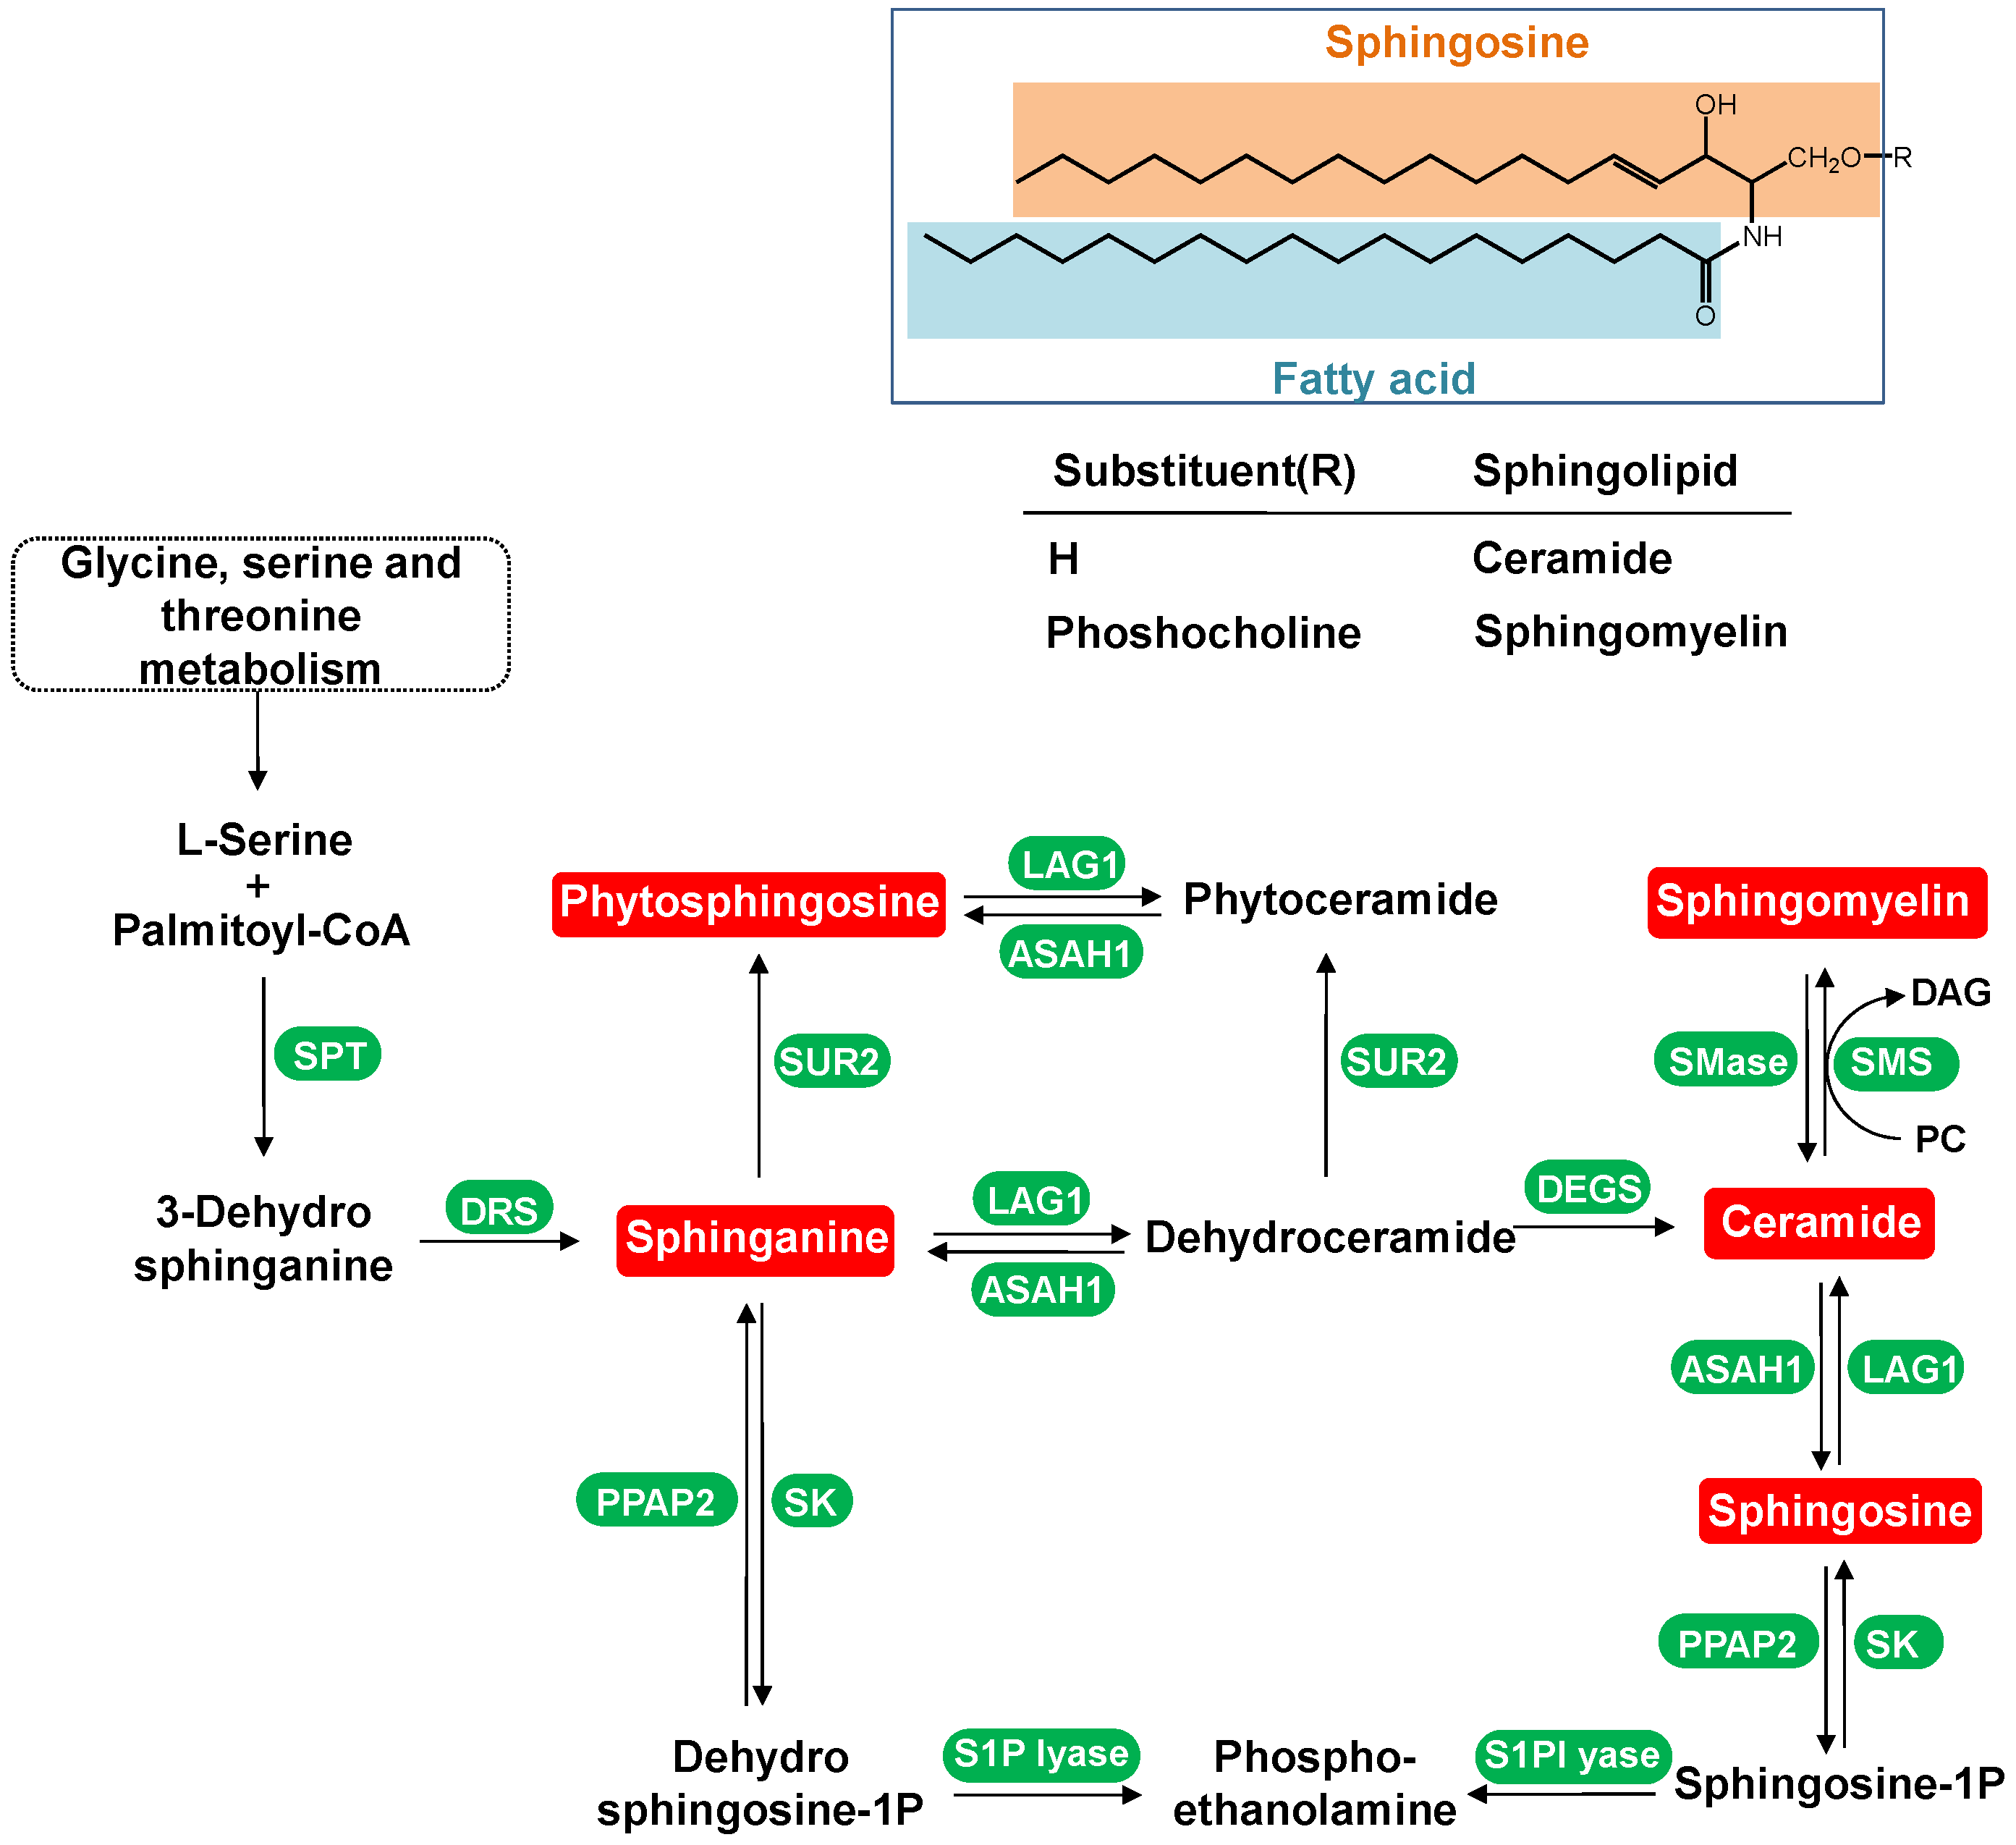
4.1.1. Dynamic Change in Sphingolipids Metabolism
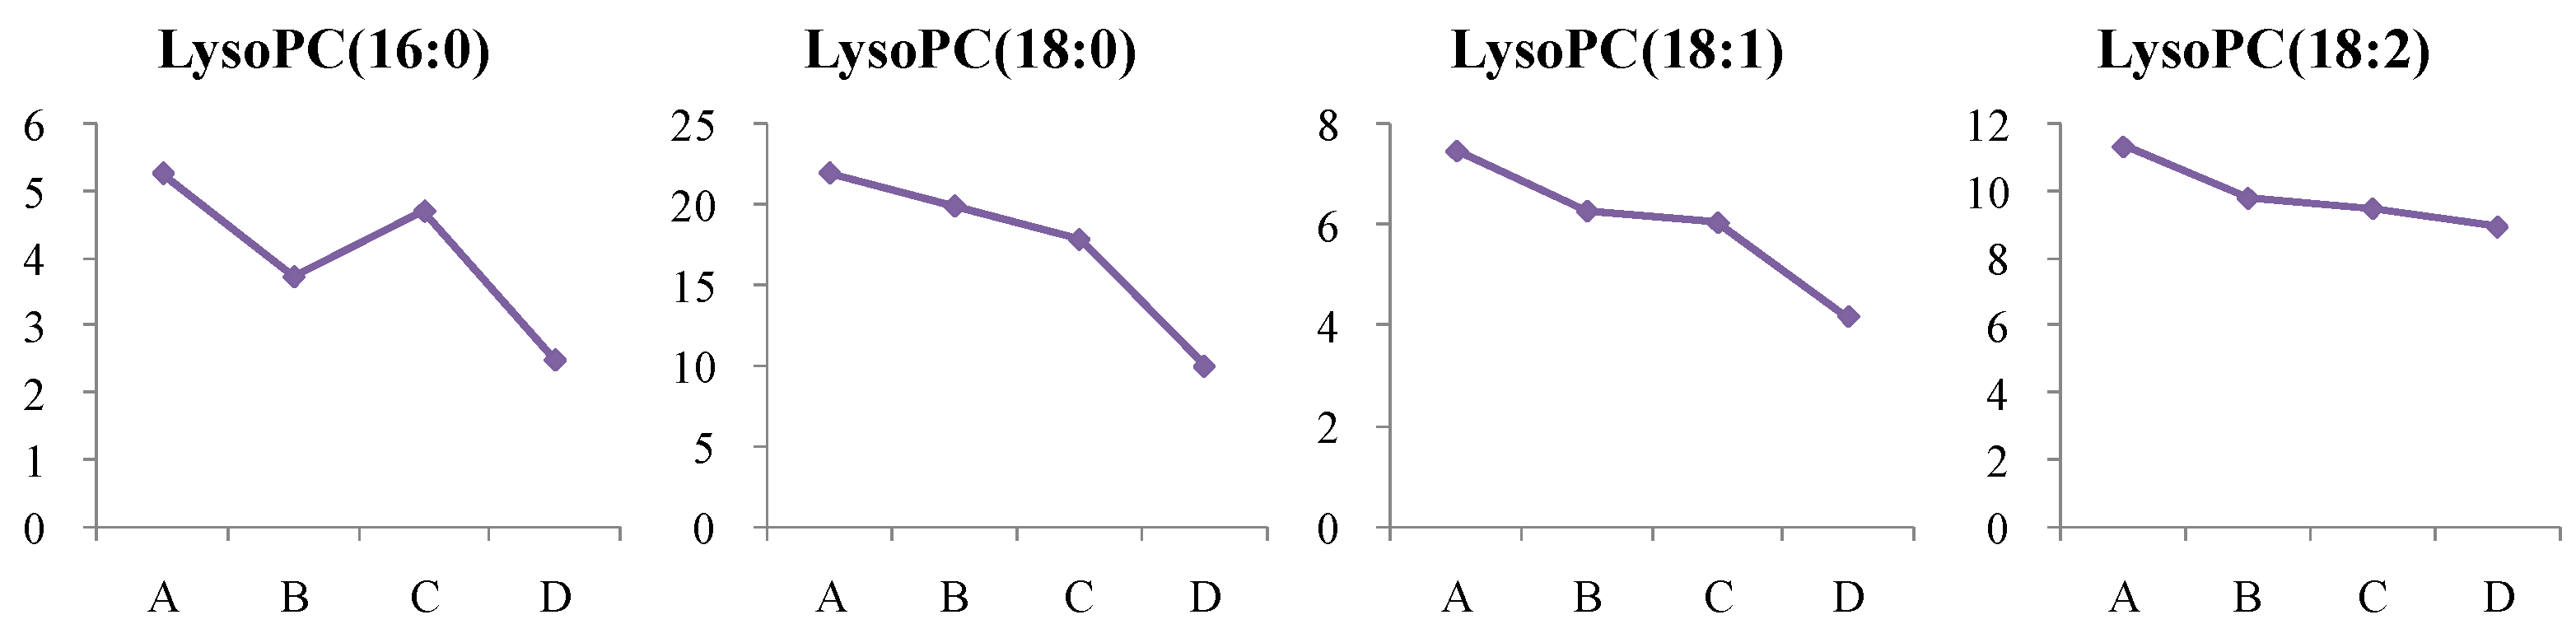
4.1.2. Dynamic Change in Lysophosphatidylcholine (LysoPC) Metabolism
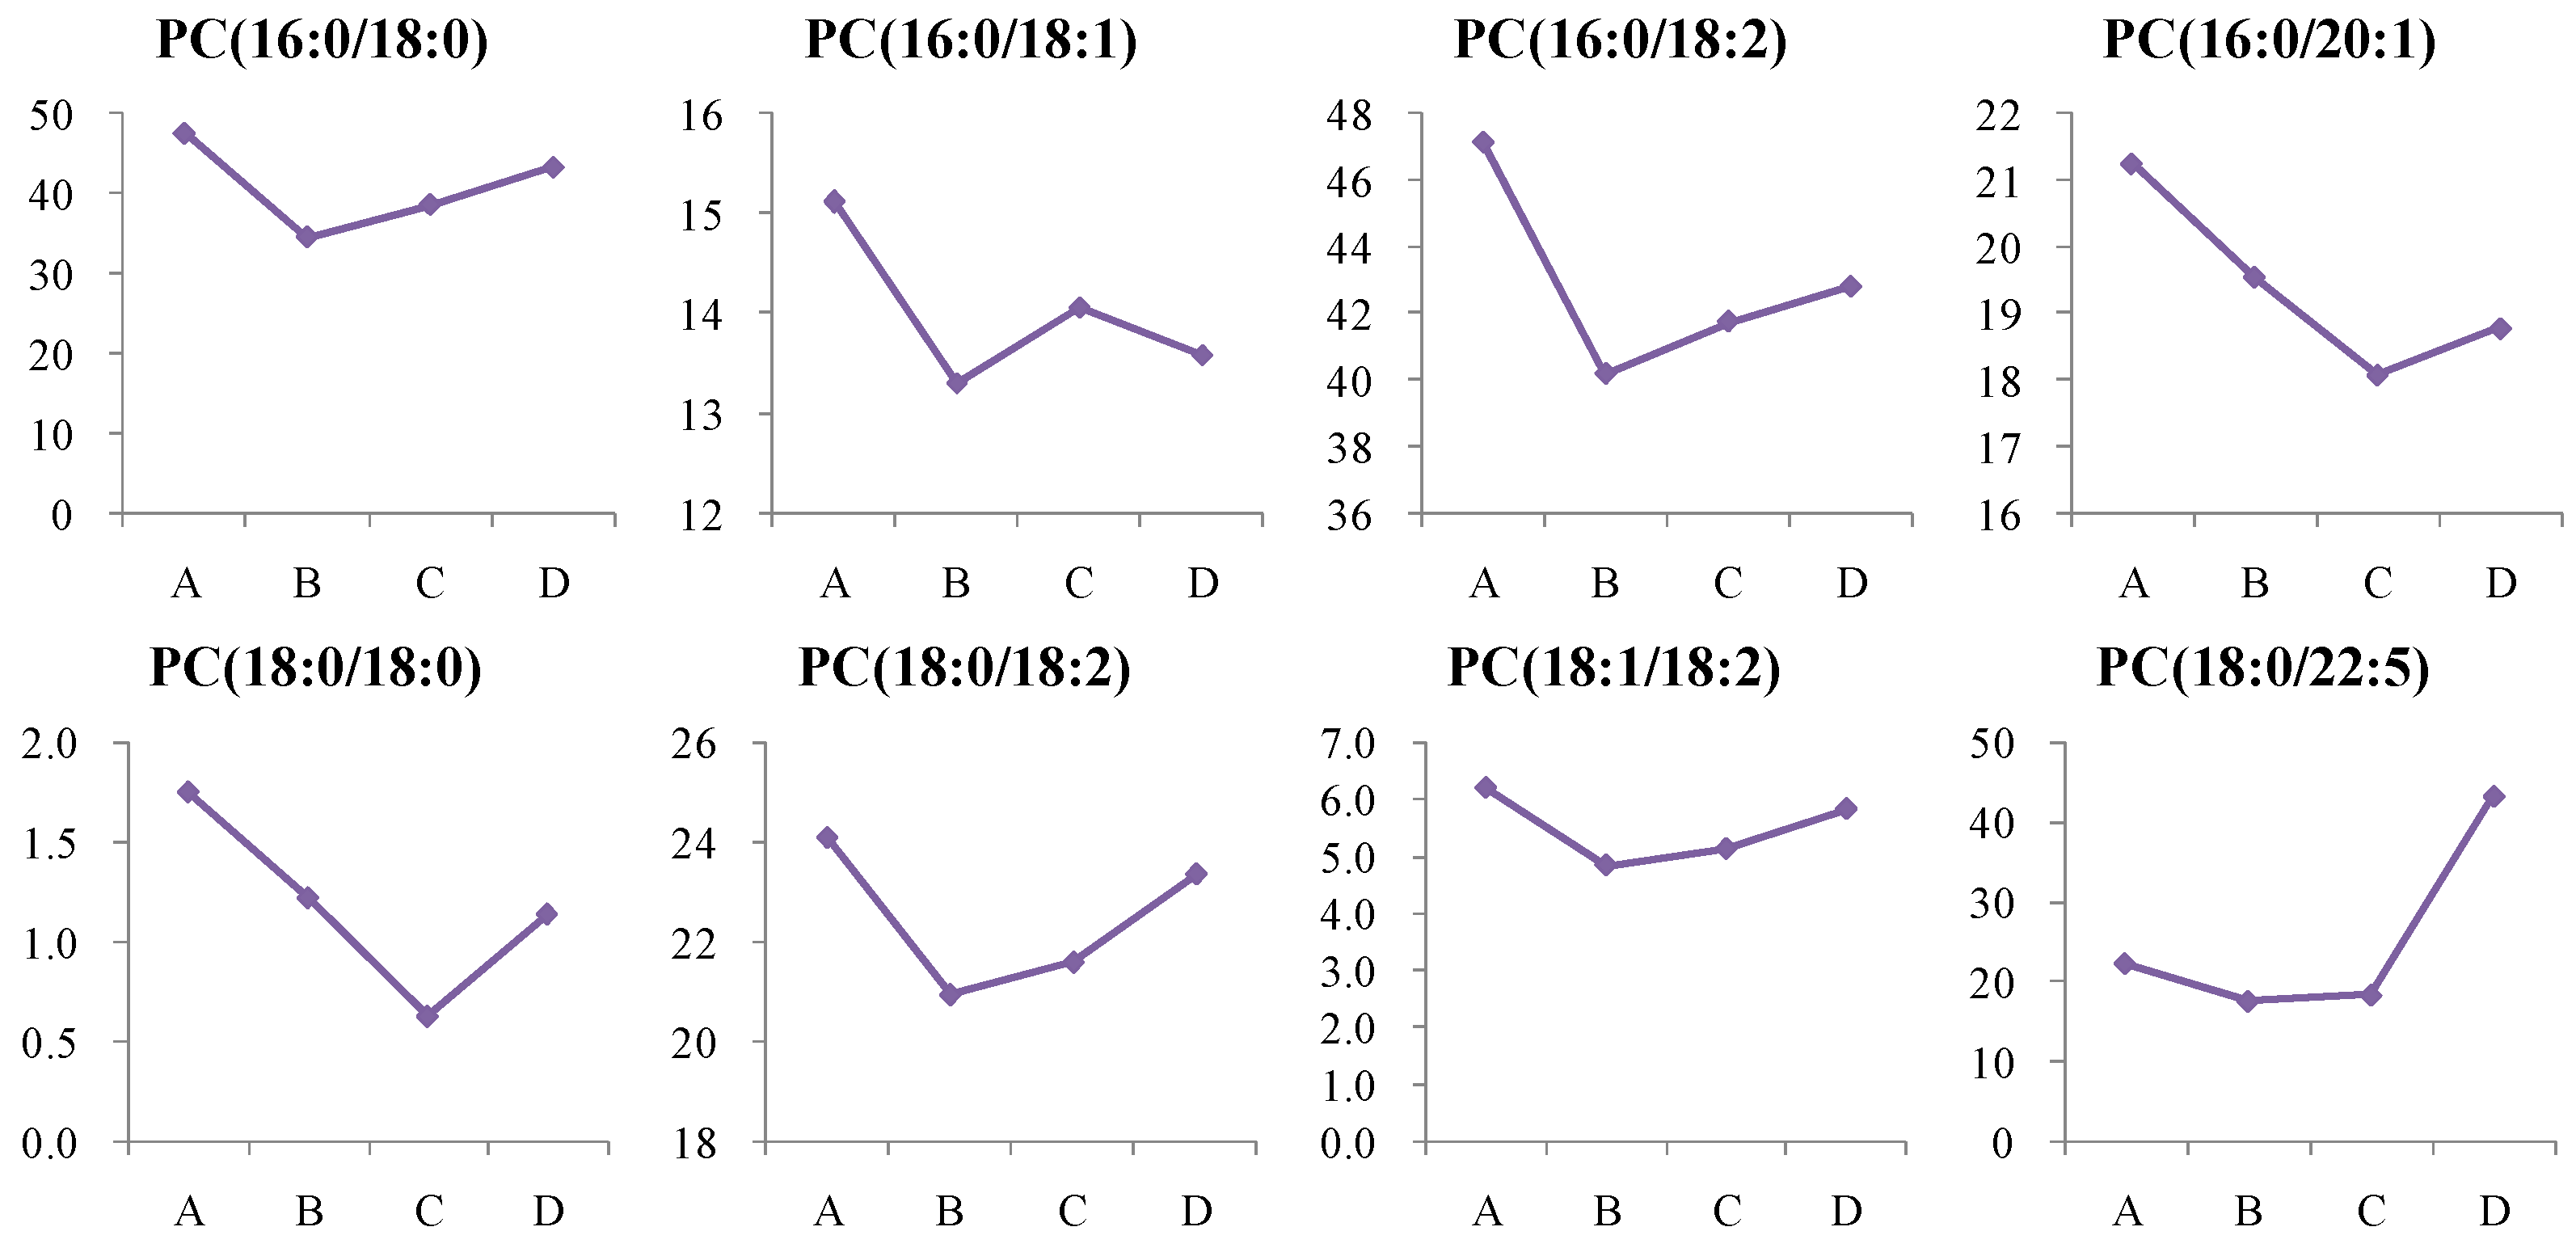
4.1.3. Dynamic Change in Phosphatidylcholine (PC) Metabolism
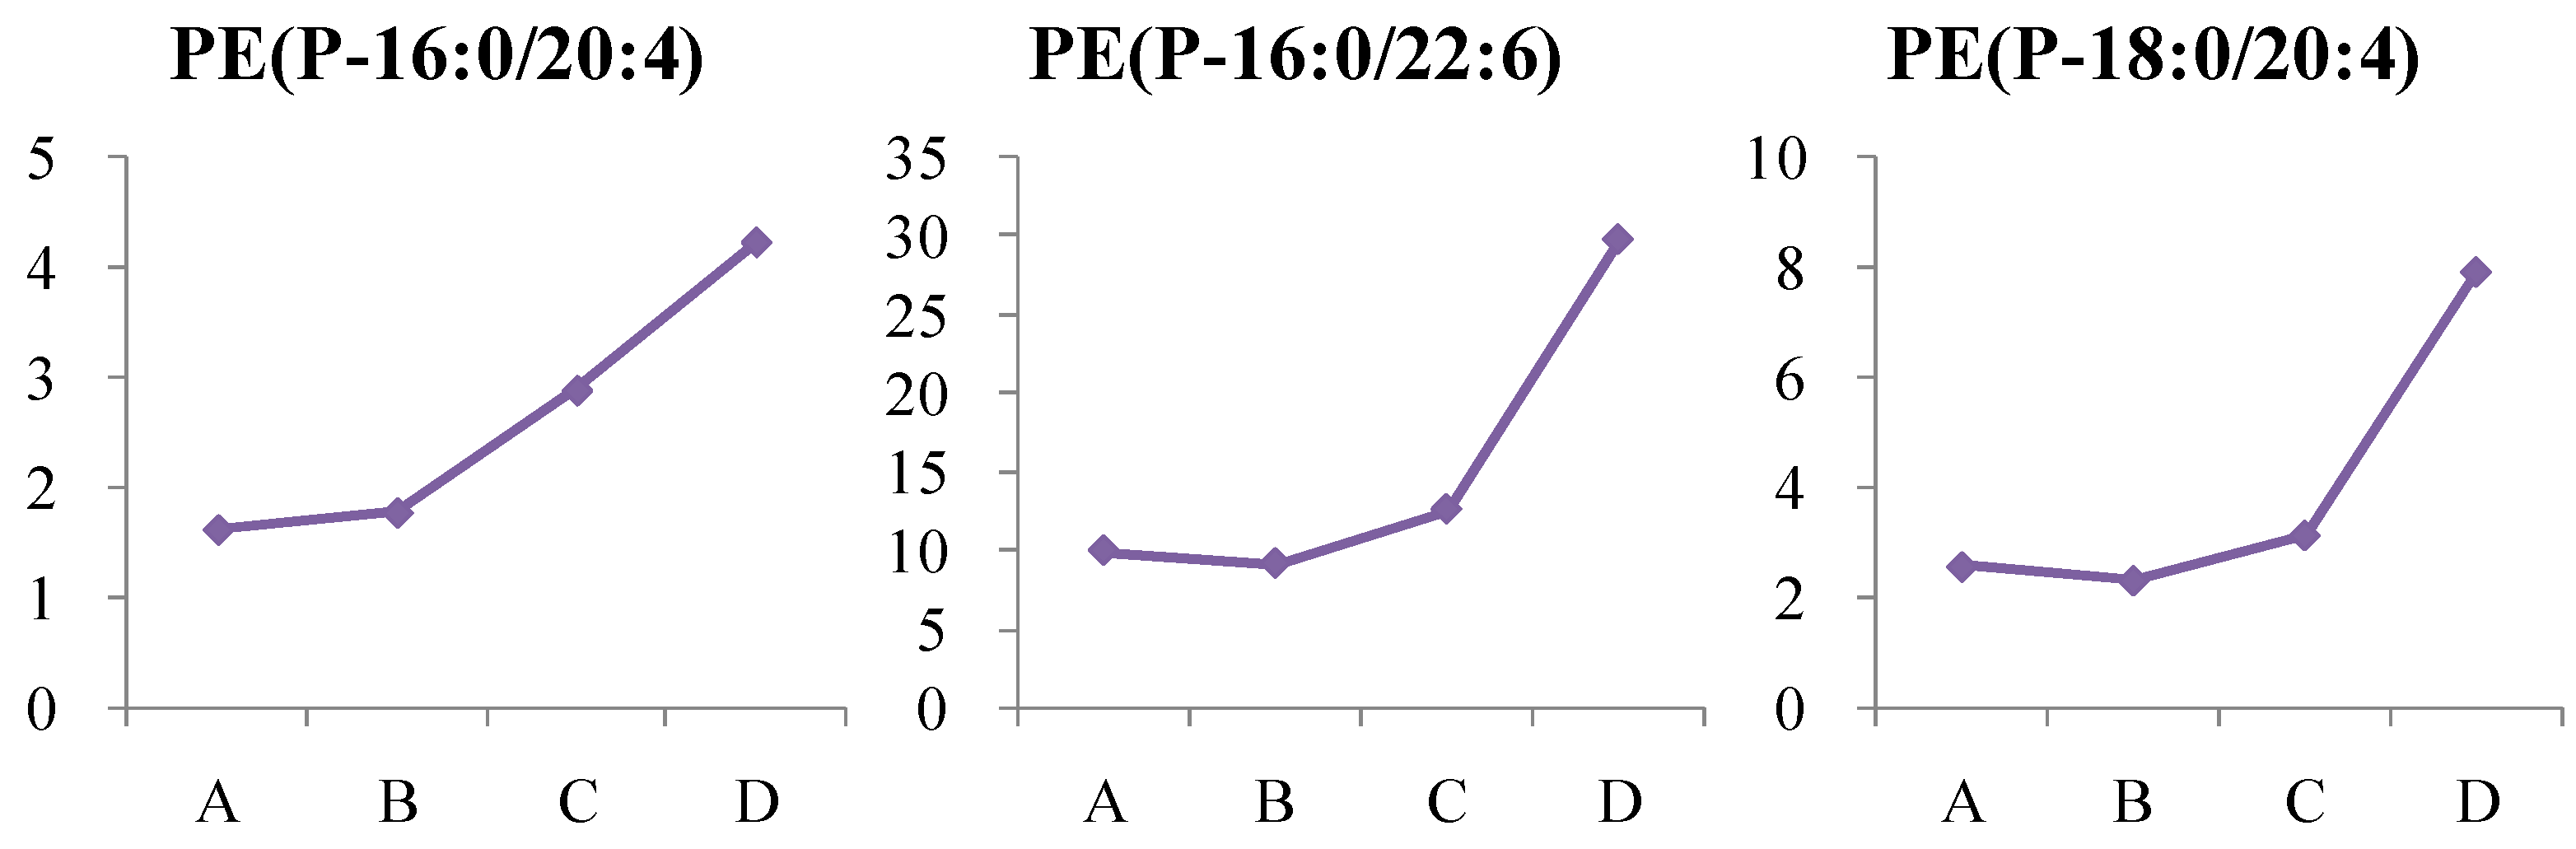
4.1.4. Dynamic Change in Phosphatidylethanolamine (PE) Metabolism
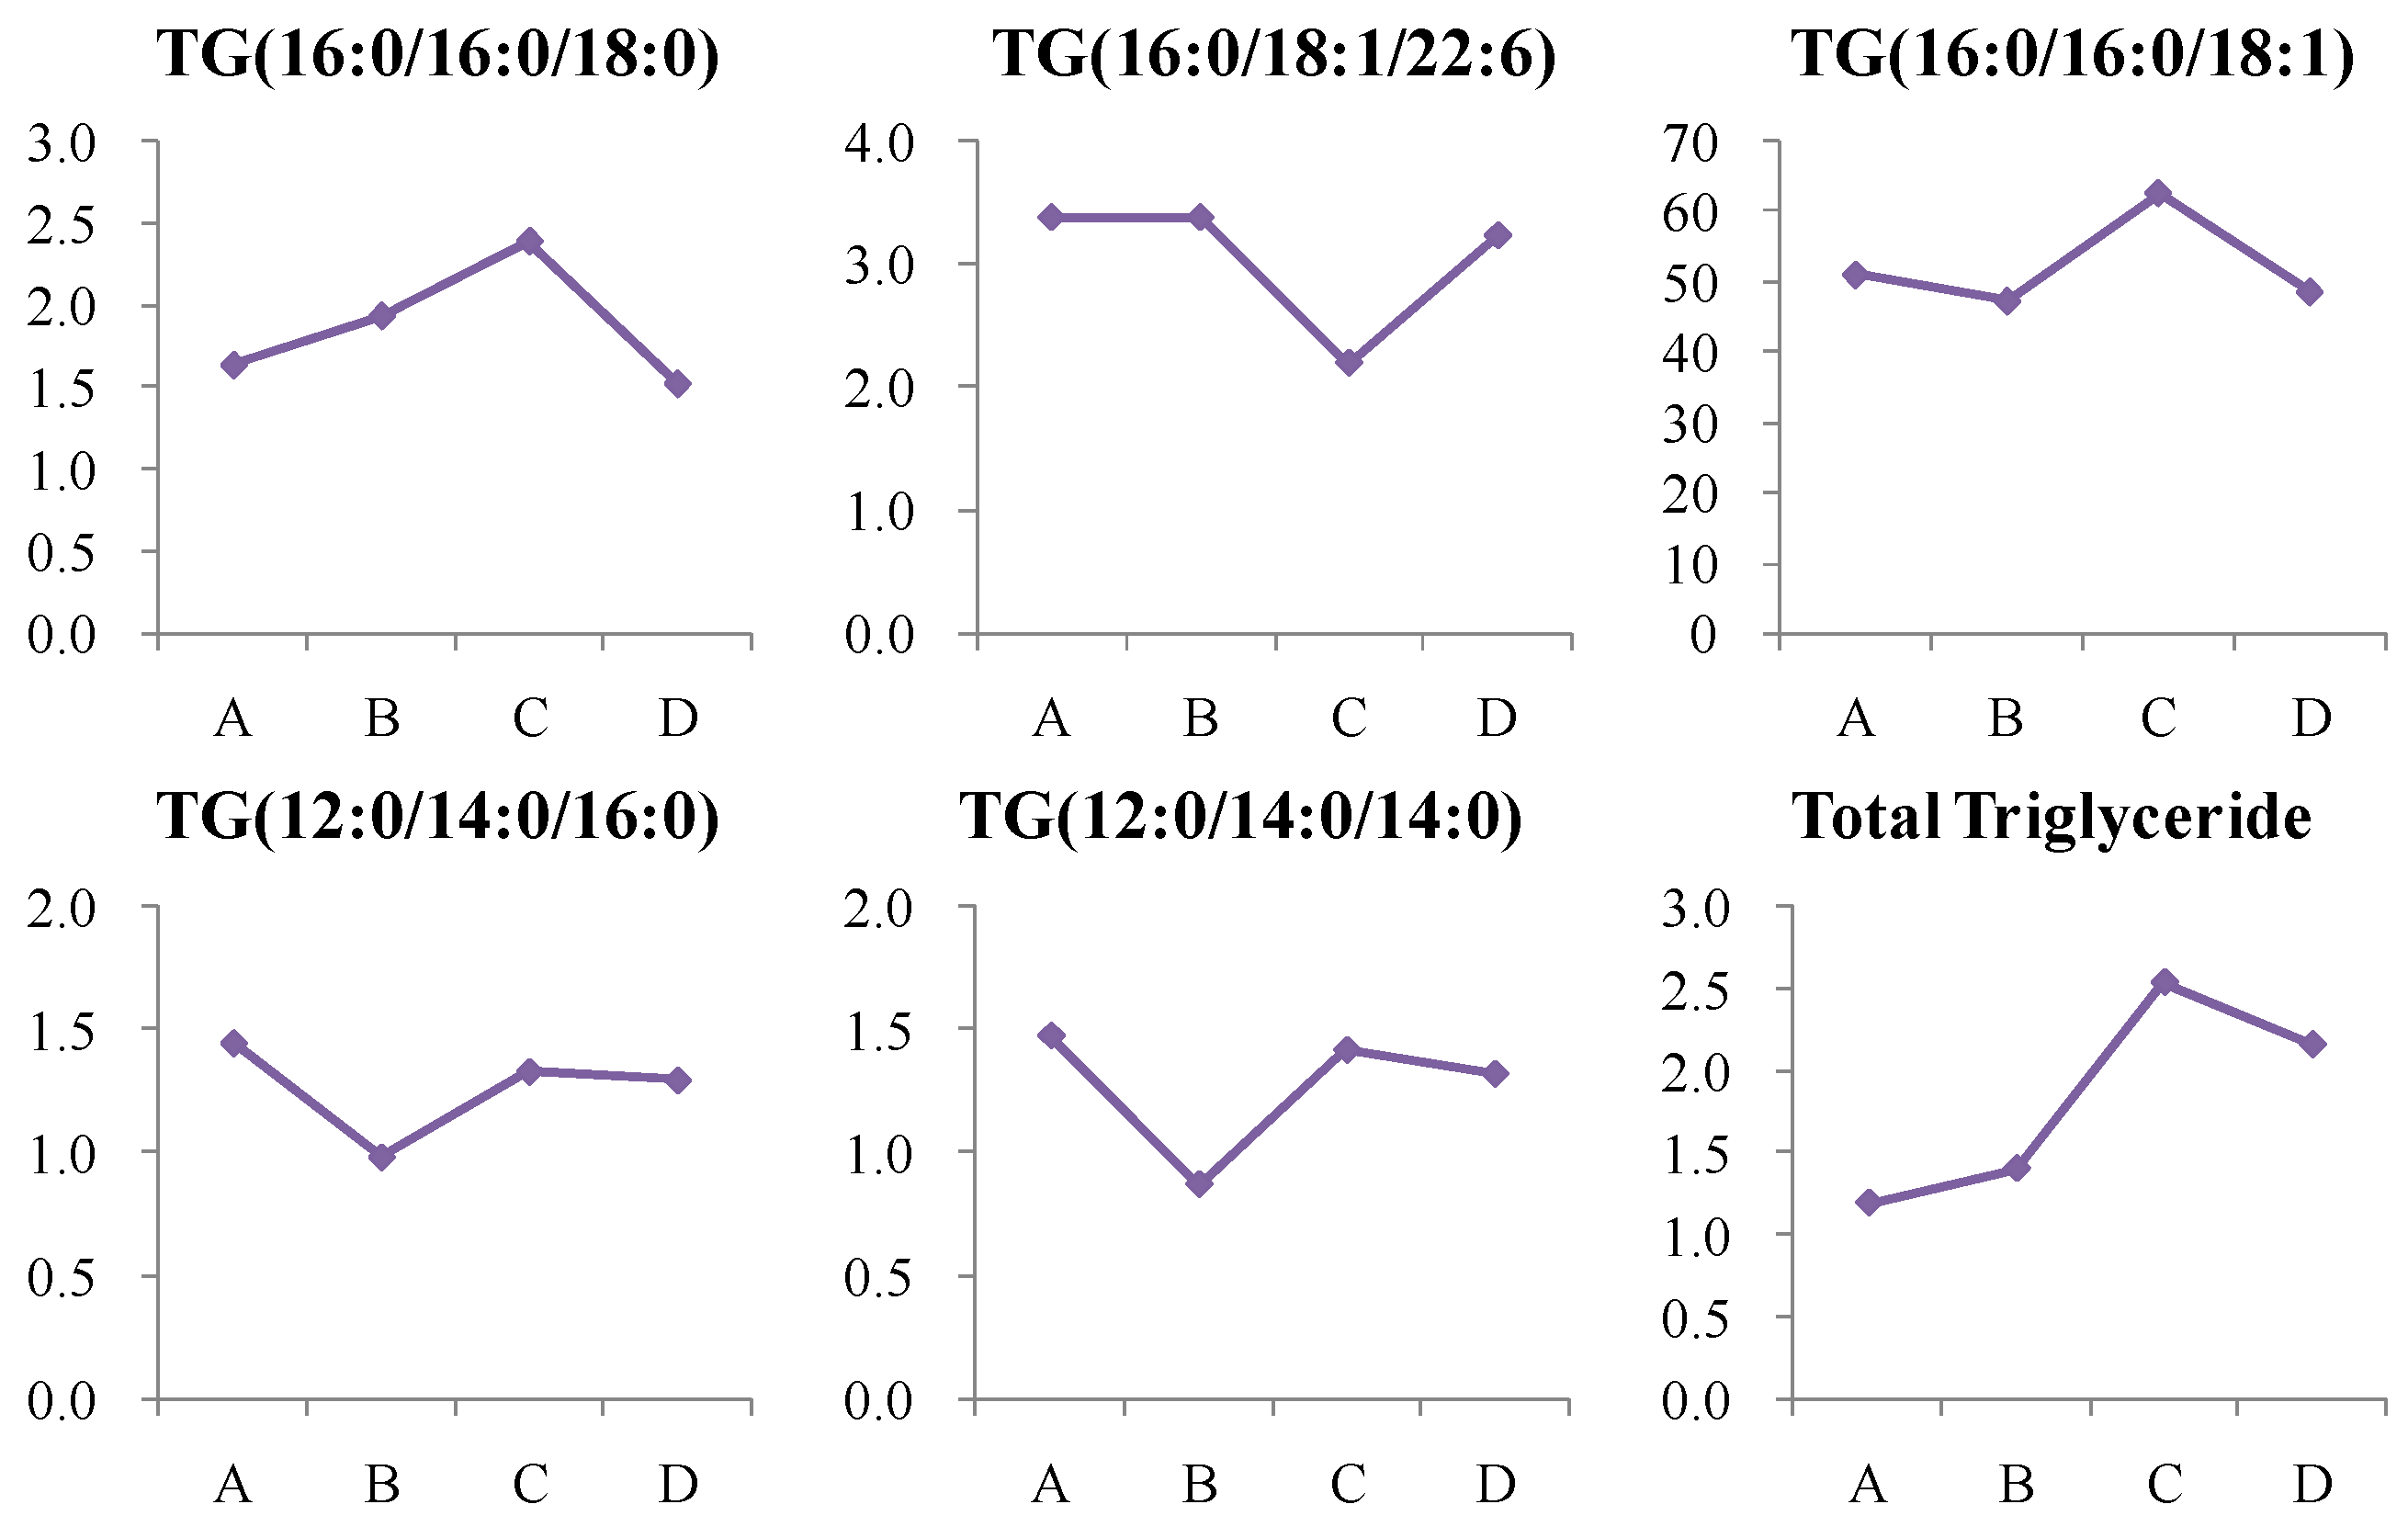
4.1.5. Dynamic Change in Triglycerides (TG) Metabolism
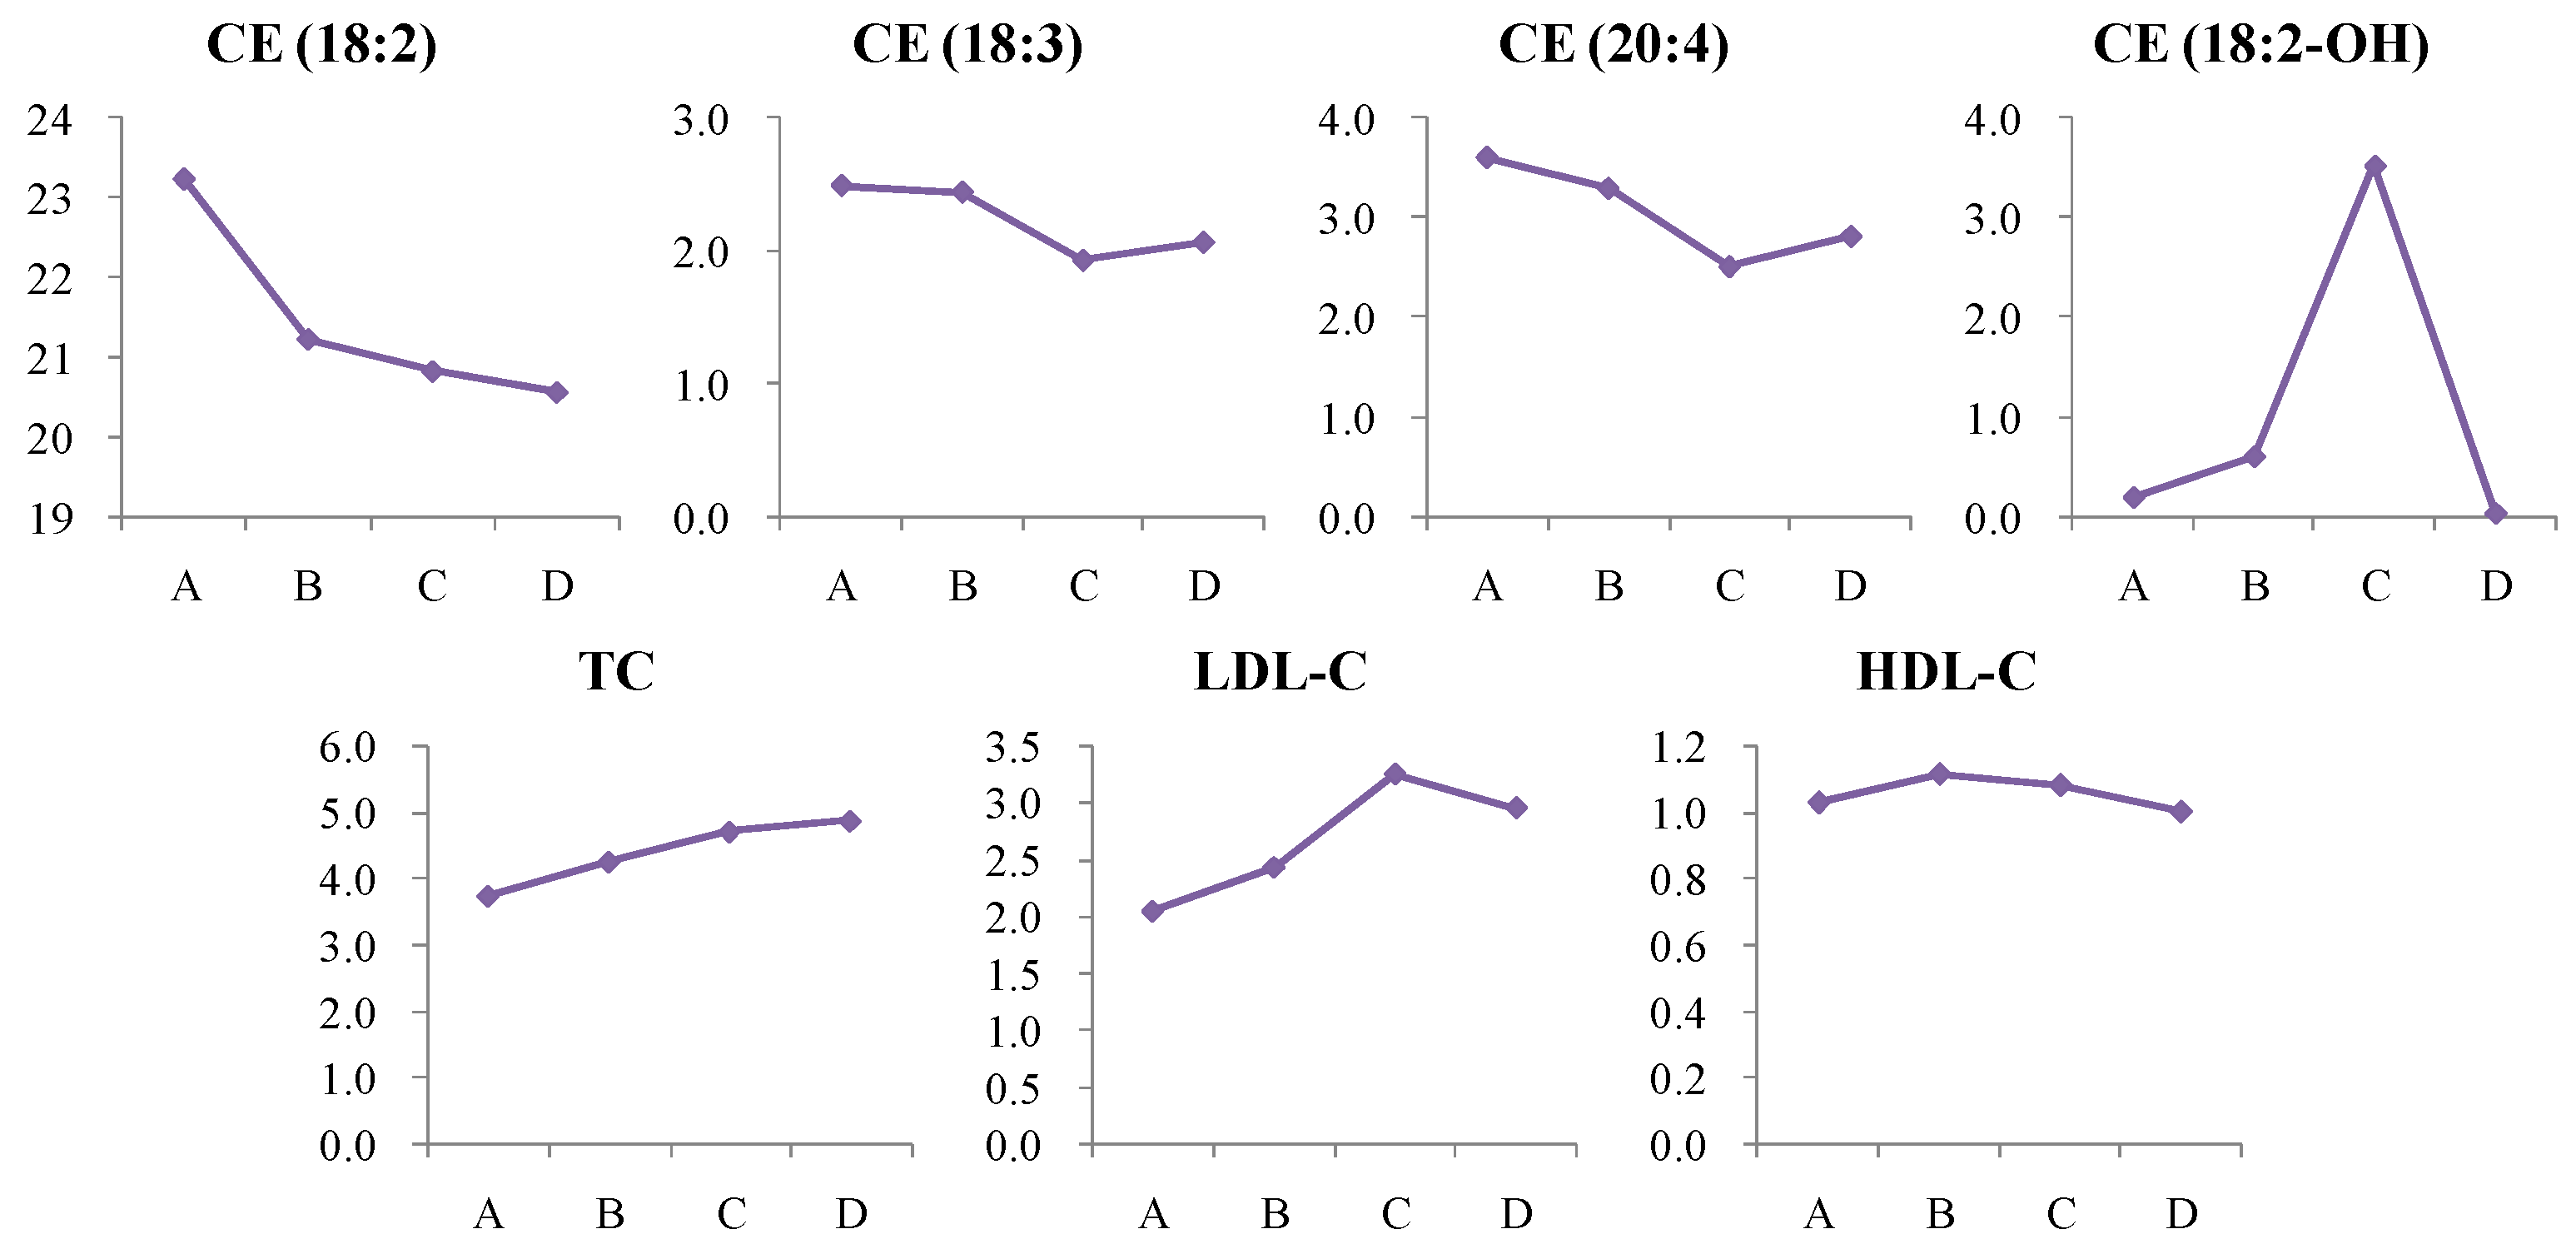
4.1.6. Dynamic Change in Cholesterol Ester (CE) Metabolism
4.2. Dynamic Lipid Biomarkers for T2D
5. Conclusions
Supplementary Materials
 : control group,
  : NDT2D group); Figure S5. PLS-DA validation plots of 100 random permutations based on the (A) LC-(+)ESIMS and (B) LC-(−)ESIMS data from the control and NDT2D groups; Figure S6. OPLS-DA score plots based on (A) LC-(+)ESIMS data (B) LC-(−) ESIMS data from control group and MTYT2D group (: control group, : NDT2D group); Figure S7. PLS-DA validation plots of 100 random permutations based on the (A) LC-(+)ESIMS and (B) LC-(−)ESIMS data from the control group and MTYT2D group; Table S1: Information of 17 typical standards from six lipids categories.; Table S2. Summary of discriminated metabolites between the control and HR groups via the LC-(+)ESIMS analysis; Table S3. Summary of discriminated metabolites between the control and NDT2TD groups via the LC-(+)ESIMS analysis; Table S4. Summary of discriminated metabolites between the control and HR groups via the LC-(−)ESIMS analysis; Table S5: Summary of discriminated metabolites between the control and NDT2TD groups via the LC-(−)ESIMS analysis; Table S6. The parameters of the LC-MRM-MS-based targeted metabolomic analysis in positive ion mode; Table S7: The parameters of the LC-MRM-MS-based targeted metabolomic analysis in negative ion mode.
Author Contributions
Funding
Institutional Review Board Statement
Informed Consent Statement
Data Availability Statement
Conflicts of Interest
References
- Arroyo, M.N.; Green, J.A.; Cnop, M.; Igoillo-Esteve, M. tRNA Biology in the Pathogenesis of Diabetes: Role of Genetic and Environmental Factors. Int. J. Mol. Sci. 2021, 22, 496. [Google Scholar] [CrossRef] [PubMed]
- Chaki, J.; Ganesh, S.T.; Cidham, S.K.; Theertan, S.A. Machine Learning and Artificial Intelligence based Diabetes Mellitus Detection and Self-Management: A Systematic Review. J. King Saud Univ.—Comput. Inf. Sci. 2020, 34, 3204–3225. [Google Scholar] [CrossRef]
- Jiang, S.; Young, J.L.; Wang, K.; Qian, Y.; Cai, L. Diabeticinduced alterations in hepatic glucose and lipid metabolism: The role of type 1 and type 2 diabetes mellitus (Review). Mol. Med. Rep. 2020, 22, 603–611. [Google Scholar] [CrossRef] [PubMed]
- Frayn, K.N. Insulin resistance and lipid metabolism. Curr. Opin. Lipidol. 1993, 4, 234. [Google Scholar] [CrossRef]
- Chen, H.; Wu, J.; Lyu, R. Expressions of glycemic parameters, lipid profile, and thyroid hormone in patients with type 2 diabetes mellitus and their correlation. Immun. Inflamm. Dis. 2024, 12, e1282. [Google Scholar] [CrossRef]
- Tautenhahn, R.; Patti, G.J.; Rinehart, D.; Siuzdak, G. XCMS Online: A Web-Based Platform to Process Untargeted Metabolomic Data. Anal. Chem. 2012, 84, 5035–5039. [Google Scholar] [CrossRef]
- Kuhl, C.; Tautenhahn, R.; Bottcher, C.; Larson, T.R.; Neumann, S. CAMERA: An integrated strategy for compound spectra extraction and annotation of liquid chromatography/mass spectrometry data sets. Anal. Chem. 2012, 84, 283–289. [Google Scholar] [CrossRef]
- Ihaka, R.; Gentleman, R. R: A Language for Data Analysis and Graphics. J. Comput. Graph. Stat. 1996, 5, 299–314. [Google Scholar] [CrossRef]
- Kind, T.; Fiehn, O. Seven Golden Rules for heuristic filtering of molecular formulas obtained by accurate mass spectrometry. BMC Bioinform. 2007, 8, 105. [Google Scholar] [CrossRef]
- Green, C.D.; Maceyka, M.; Cowart, L.A.; Spiegel, S. Sphingolipids in metabolic disease: The good, the bad, and the unknown. Cell Metab. 2021, 33, 1293–1306. [Google Scholar] [CrossRef]
- Chen, Q.; Wang, W.; Xia, M.-F.; Liu, Y.-L.; Bian, H.; Yu, C.; Li, X.-Y.; Vadas, M.A.; Gao, X.; Lin, H.-D.; et al. Identification of circulating sphingosine kinase-related metabolites for prediction of type 2 diabetes. J. Transl. Med. 2021, 19, 393. [Google Scholar] [CrossRef] [PubMed]
- Morita, Y.; Kurano, M.; Sakai, E.; Nishikawa, T.; Nishikawa, M.; Sawabe, M.; Aoki, J.; Yatomi, Y. Analysis of urinary sphingolipids using liquid chromatography-tandem mass spectrometry in diabetic nephropathy. J. Diabetes Investig. 2020, 11, 441–449. [Google Scholar] [CrossRef]
- Xia, Q.-S.; Lu, F.-E.; Wu, F.; Huang, Z.-Y.; Dong, H. New role for ceramide in hypoxia and insulin resistance. World J. Gastroenterol. 2020, 26, 56–65. [Google Scholar] [CrossRef] [PubMed]
- Summers, S.A. Ceramides in insulin resistance and lipotoxicity. Prog. Lipid Res. 2006, 45, 42–72. [Google Scholar] [CrossRef] [PubMed]
- Straczkowski, M.; Kowalska, I.; Baranowski, M.; Nikolajuk, A.; Otziomek, E.; Zabielski, P.; Adamska, A.; Blachnio, A.; Gorski, J.; Gorska, M. Increased skeletal muscle ceramide level in men at risk of developing type 2 diabetes. Diabetologia 2007, 50, 2366. [Google Scholar] [CrossRef]
- Law, S.H.; Chan, M.L.; Marathe, G.K.; Parveen, F.; Ke, L.Y. An Updated Review of Lysophosphatidylcholine Metabolism in Human Diseases. Int. J. Mol. Sci. 2019, 20, 1149. [Google Scholar] [CrossRef]
- Susanne, H.; Marcus, F.; Andrea, B.; Gerhard, L.; Alexander, S.; Stefan, W.; Gerd, S.; Ayyalasomayajula, V. Alterations of Plasma Lysophosphatidylcholine Species in Obesity and Weight Loss. PLoS ONE 2014, 9, e111348. [Google Scholar]
- Auguet, T.; Bertran, L.; Capellades, J.; Abelló, S.; Aguilar, C.; Sabench, F.; del Castillo, D.; Correig, X.; Yanes, O.; Richart, C. LC/MS-Based Untargeted Metabolomics Analysis in Women with Morbid Obesity and Associated Type 2 Diabetes Mellitus. Int. J. Mol. Sci. 2023, 24, 7761. [Google Scholar] [CrossRef]
- Yea, K.; Kim, J.; Lim, S.; Kwon, T.; Park, H.S.; Park, K.S.; Suh, P.-G.; Ryu, S.H. Lysophosphatidylserine regulates blood glucose by enhancing glucose transport in myotubes and adipocytes. Biochem. Biophys. Res. Commun. 2009, 378, 783–788. [Google Scholar] [CrossRef]
- Parmryd, I. Barrier and signal transduction functions could explain the lipid asymmetry of the plasma membrane. BioEssays 2023, 45, e2300191. [Google Scholar] [CrossRef]
- Sawada, N.; Obama, T.; Mizuno, M.; Fukuhara, K.; Iwamoto, S.; Aiuchi, T.; Makiyama, T.; Itabe, H. Transfer and Enzyme-Mediated Metabolism of Oxidized Phosphatidylcholine and Lysophosphatidylcholine between Low- and High-Density Lipoproteins. Antioxidants 2020, 9, 1045. [Google Scholar] [CrossRef] [PubMed]
- Raubenheimer, P.J.; Nyirenda, M.J.; Walker, B.R. A choline-deficient diet exacerbates fatty liver but attenuates insulin resistance and glucose intolerance in mice fed a high-fat diet. Diabetes 2006, 55, 2015–2020. [Google Scholar] [CrossRef] [PubMed]
- Loomba, R.; Friedman, S.L.; Shulman, G.I. Mechanisms and disease consequences of nonalcoholic fatty liver disease. Cell 2021, 184, 2537–2564. [Google Scholar] [CrossRef]
- Chakrabarti, A. Phospholipid Asymmetry in Biological Membranes: Is the Role of Phosphatidylethanolamine Underappreciated? J. Membr. Biol. 2021, 254, 127–132. [Google Scholar] [CrossRef]
- Lee, H.C.; Cheng, W.C.; Ma, W.L.; Lin, Y.H.; Shin, S.J.; Lin, Y.H. Association of lipid composition and unsaturated fatty acids of VLDL with atrial remodeling in metabolic syndrome. Sci. Rep. 2023, 13, 6575. [Google Scholar] [CrossRef]
- Xu, H.; Li, W.; Huang, L.; He, X.; Xu, B.; He, X.; Chen, W.; Wang, Y.; Xu, W.; Wang, S.; et al. Phosphoethanolamine cytidylyltransferase ameliorates mitochondrial function and apoptosis in hepatocytes in T2DM in vitro. J. Lipid Res. 2023, 64, 100337. [Google Scholar] [CrossRef] [PubMed]
- Chamroonkiadtikun, P.; Ananchaisarp, T.; Wanichanon, W. The triglyceride-glucose index, a predictor of type 2 diabetes development: A retrospective cohort study. Prim. Care Diabetes 2019, 14, 161–167. [Google Scholar] [CrossRef]
- Wang, Y. Higher fasting triglyceride predicts higher risks of diabetes mortality in US adults. Lipids Health Dis. 2021, 20, 181. [Google Scholar] [CrossRef] [PubMed]
- Rhee, E.P.; Cheng, S.; Larson, M.G.; Walford, G.A.; Gerszten, R.E. Lipid profiling identifies a triacylglycerol signature of insulin resistance and improves diabetes prediction in humans. J. Clin. Investig. 2011, 121, 1402–1411. [Google Scholar] [CrossRef]
- Sowah, S.A.; Hirche, F.; Milanese, A.; Johnson, T.S.; Grafetstätter, M.; Schübel, R.; Kirsten, R.; Ulrich, C.M.; Kaaks, R.; Zeller, G. Changes in plasma short-chain fatty acid levels after dietary weight loss among overweight and obese adults over 50 weeks. Nutrients 2020, 12, 452. [Google Scholar] [CrossRef]
- Rooney, M.R.; Rawlings, A.M.; Pankow, J.S.; Tcheugui, J.B.E.; Coresh, J.; Sharrett, A.R.; Selvin, E. Risk of progression to diabetes among older adults with prediabetes. JAMA Intern. Med. 2021, 181, 511–519. [Google Scholar] [CrossRef] [PubMed]
- Sekhar, M.S.; Marupuru, S.; Reddy, B.S.; Kurian, S.J.; Rao, M. Physiological Role of Cholesterol in Human Body. In Dietary Sugar, Salt and Fat in Human Health; Elsevier: Amsterdam, The Netherlands, 2020; pp. 453–481. [Google Scholar]
- Zhao, X.; Wang, D.; Qin, L. Lipid profile and prognosis in patients with coronary heart disease: A meta-analysis of prospective cohort studies. BMC Cardiovasc. Disord. 2021, 21, 69. [Google Scholar] [CrossRef] [PubMed]
- Mirza, A.Z.; Althagafi, I.I.; Shamshad, H. Role of PPAR receptor in different diseases and their ligands: Physiological importance and clinical implications. Eur. J. Med. Chem. 2019, 166, 502–513. [Google Scholar] [CrossRef] [PubMed]
- Lozhkina, N.; Gushchina, O.; Basov, N.; Gaisler, E.; Rogachev, A.; Sotnikova, Y.S.; Patrushev, Y.V.; Pokrovsky, A. Ceramides As Potential New Predictors of the Severity of Acute Coronary Syndrome in Conjunction with SARS-CoV-2 Infection. Acta Naturae 2024, 16, 53–60. [Google Scholar] [CrossRef]
- Janssens, A.C.J.; Martens, F.K. Reflection on modern methods: Revisiting the area under the ROC Curve. Int. J. Epidemiol. 2020, 49, 1397–1403. [Google Scholar] [CrossRef]
 : control group,
  : HR group, : NDT2D group,
  : MTYT2D group).
: control group, : HR group, : NDT2D group, : MTYT2D group).
: MTYT2D group).
: control group, : HR group, : NDT2D group, : MTYT2D group).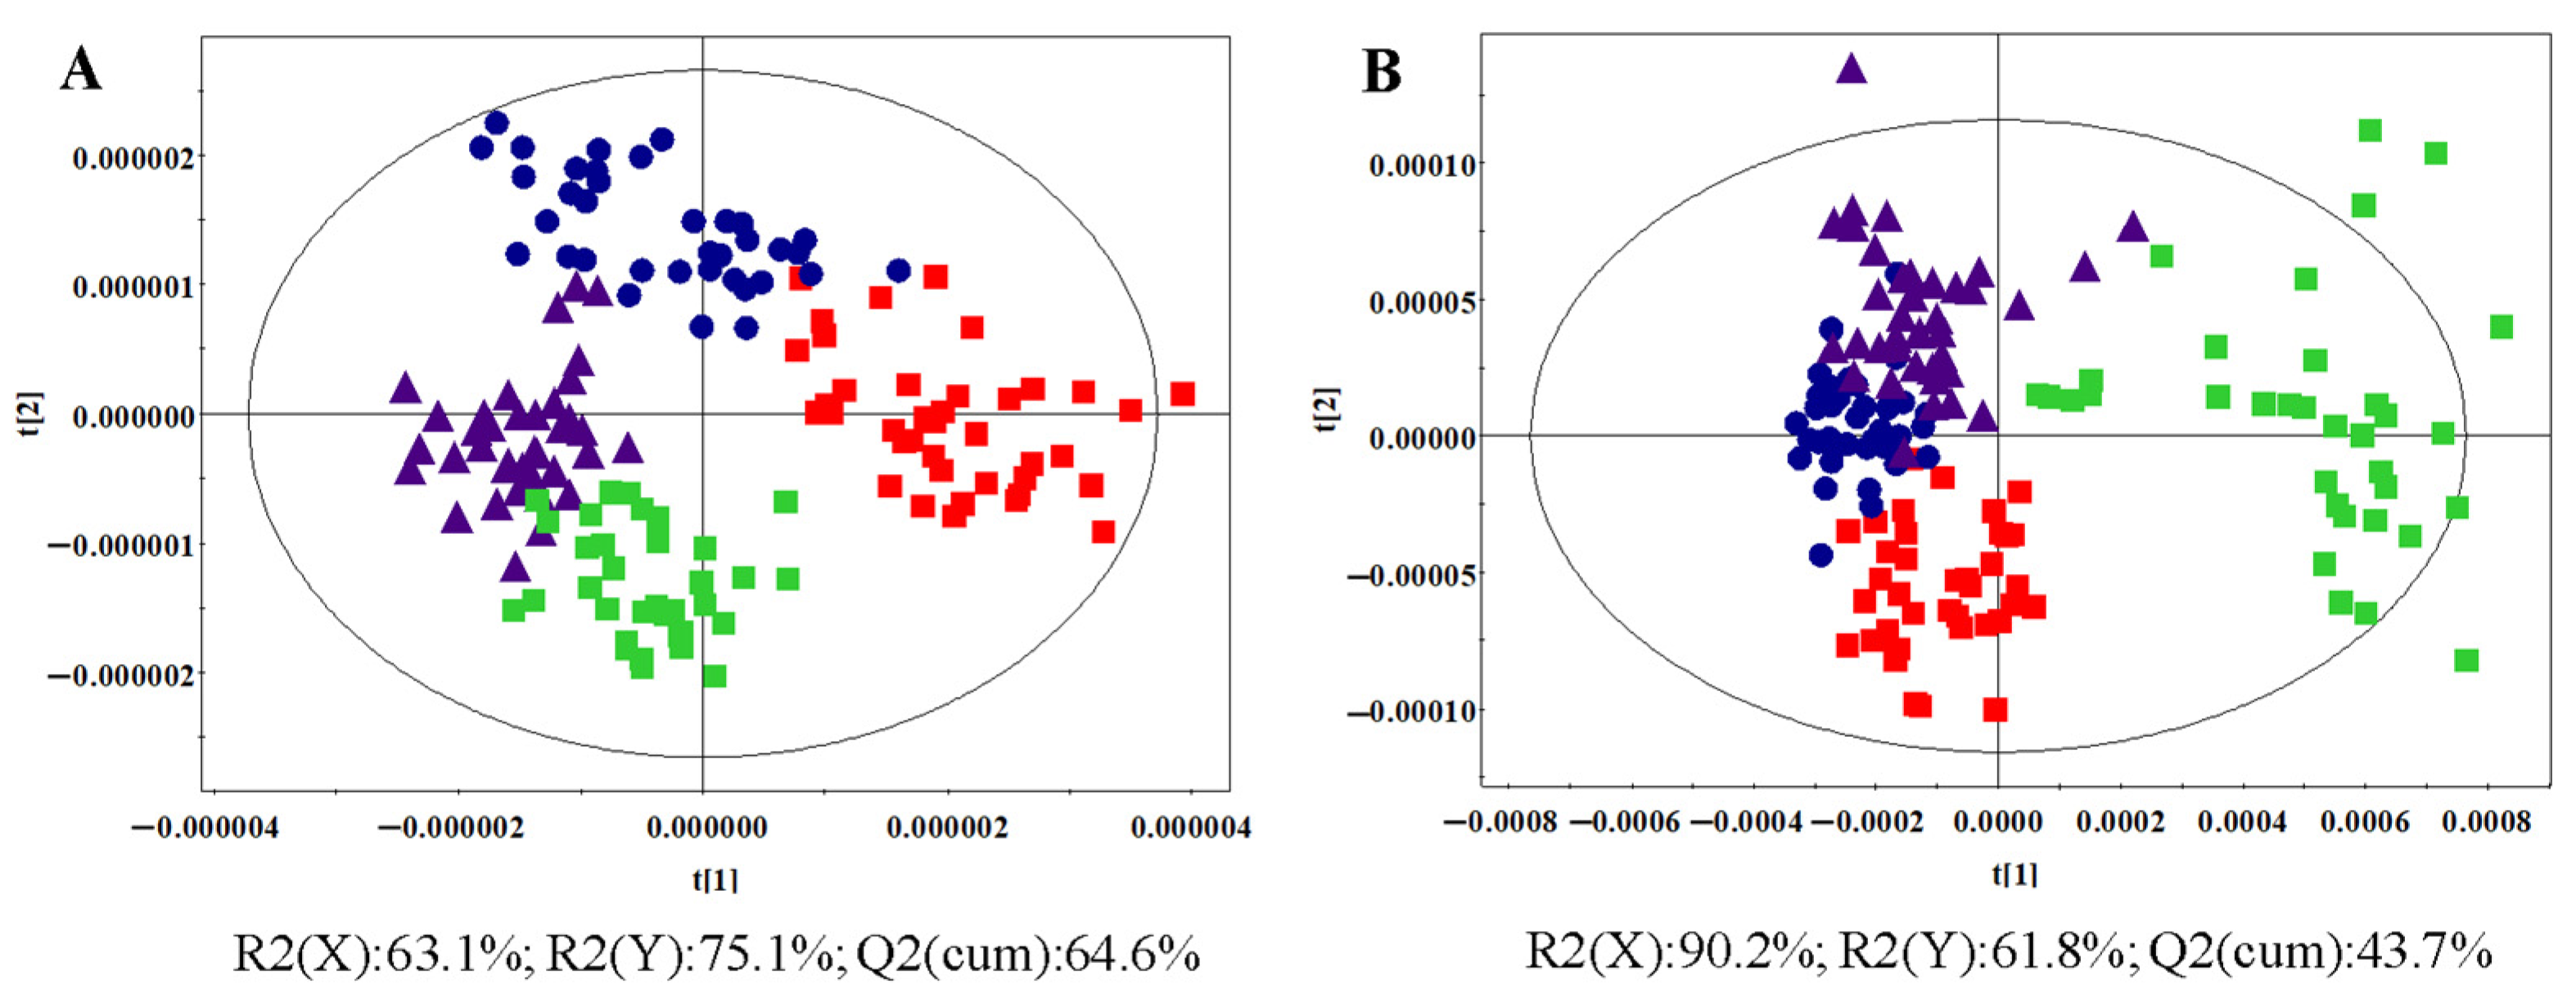
 : control group, : HR group).
: control group, : HR group).
: control group, : HR group).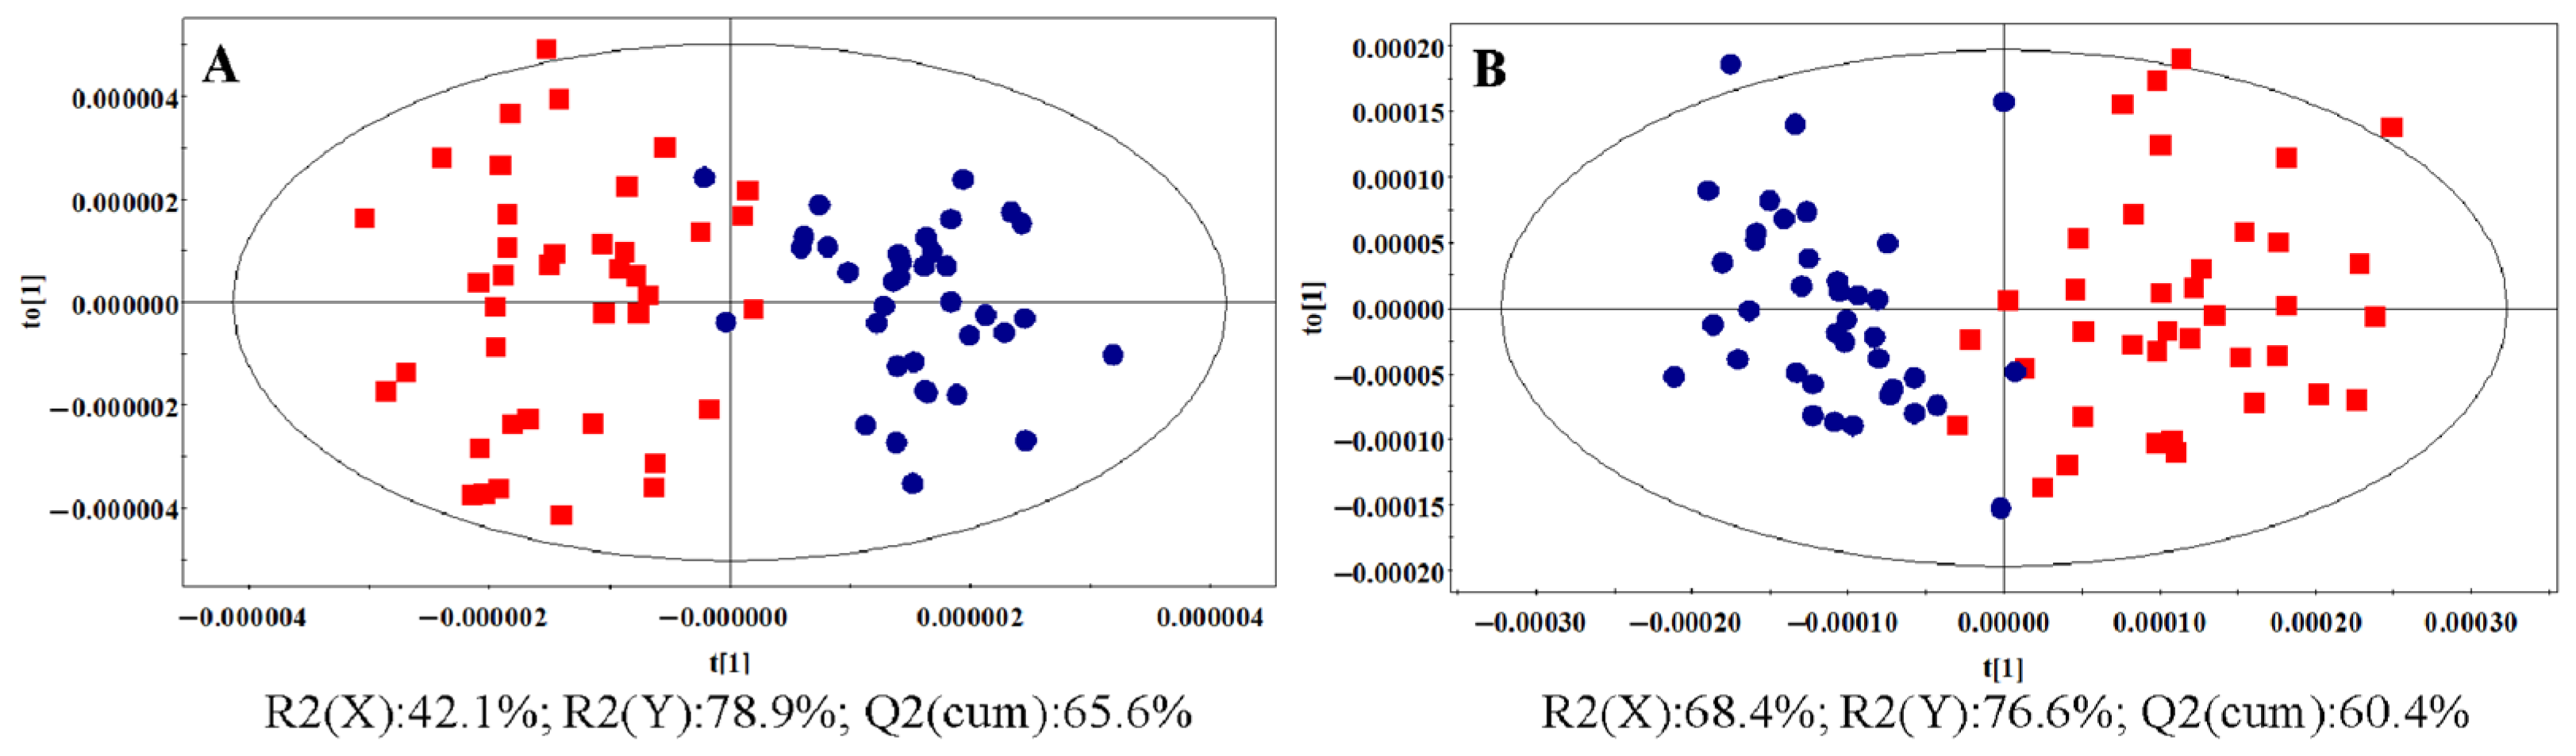


| Control Group | HR Group | NDT2D Group | MTYT2D Group | |
|---|---|---|---|---|
| No. of subjects | 40 | 40 | 39 | 36 |
| Age (year) | 53.7 ± 7.0 | 53.4 ± 6.1 | 50.2 ± 8.0 | 51.7 ± 10.8 |
| BMI (kg/m2) | 22.4 ± 0.6 | 26.4 ± 0.9 *** | 25.6 ± 5.3 *** | 26.5 ± 3.9 *** |
| FPG (mmol/L) | 4.87 ± 0.65 | 5.23 ± 0.98 * | 10.3 ± 3.59 ***### | 8.24 ± 2.41 ***& |
| HbA1c (%) | 5.65 ± 0.22 | 6.13 ± 0.20 *** | 8.16 ± 2.59 ***### | 7.88 ± 1.85 *** |
| TC (mmol/L) | 3.73 ± 0.91 | 4.23 ± 0.87 ** | 4.74 ± 1.11 *** | 4.87 ± 1.03 *** |
| TG (mmol/L) | 1.19 ± 0.59 | 1.40 ± 0.59 | 2.45 ± 2.02 ***## | 2.16 ± 2.08 ** |
| LDL-C (mmol/L) | 2.05 ± 0.68 | 2.41 ± 0.63 * | 3.28 ± 2.40 ***# | 2.95 ± 0.95 ** |
| HDL-C (mmol/L) | 1.03 ± 0.26 | 1.11 ± 0.63 | 1.18 ± 0.24 | 1.00 ± 0.26 |
| RT | m/z | Adduct Ion | Elemental Composition | Metabolite Identification a,b | Category | p Value | Fold Change (HR/Control) | VIP |
|---|---|---|---|---|---|---|---|---|
| 1.41 | 318.2993 | [M+H]+ | C18H39NO3 | Phytosphingosine b | Sphingolipids | 2.46 × 10⁻³ | 0.85 | 2.82 |
| 1.43 | 274.2732 | [M+H]+ | C16H35NO2 | C16 Sphinganine b | 1.66 × 10⁻⁵ | 0.75 | 15.0 | |
| 1.60 | 288.2889 | [M+H]+ | C17H37NO2 | C17 Sphinganine b | 1.15 × 10⁻¹¹ | 4.62 | 18.9 | |
| 1.64 | 272.2578 | [M+H]+ | C16H33NO2 | C16 Sphingosine b | 3.19 × 10⁻⁷ | 0.70 | 1.30 | |
| 1.86 | 302.3047 | [M+H]+ | C18H39NO2 | Sphinganine b | 4.03 × 10⁻⁵ | 0.03 | 6.48 | |
| 1.90 | 286.2734 | [M+H]+ | C17H35NO2 | C17 Sphingosine b | 1.70 × 10⁻¹⁰ | 4.24 | 1.73 | |
| 2.73 | 330.3358 | [M+H]+ | C20H43NO2 | N,N-dimethyl-Safingol b | 4.89 × 10⁻⁵ | 0.05 | 4.29 | |
| 15.44 | 855.6609 | [M+FA−H]− | C47H91N2O6P | SM(d18:2/24:1) b | 3.20 × 10⁻⁴ | 0.73 | 2.48 | |
| 15.48 | 811.6665 | [M+H]+ | C47H91N2O6P | 4.29 × 10⁻² | 0.89 | 1.39 | ||
| 17.00 | 857.6768 | [M+FA−H]− | C47H93N2O6P | SM(d18:1/24:1) b | 2.64 × 10⁻³ | 0.78 | 2.42 | |
| 3.77 | 566.3469 | [M+FA−H]− | C27H54NO9P | LysoPC(18:1) a,b | Lysophosphatidylcholine (LysoPC) | 6.36 × 10⁻⁴ | 0.80 | 1.65 |
| 5.18 | 568.3625 | [M+FA−H]− | C26H54NO7P | LysoPC(18:0) a,b | 2.33 × 10⁻⁵ | 0.89 | 2.46 | |
| 3.25 | 496.3388 | [M+H]+ | C24H50NO7P | LysoPC(16:0) a | 9.75 × 10⁻⁴ | 0.71 | 2.31 | |
| 14.05 | 808.5800 | [M+Na]+ | C44H84NO8P | PC(18:0/18:2) a,b | Phosphatidylcholine (PC) | 4.51 × 10⁻⁴ | 0.87 | 2.89 |
| 12.47 | 780.5487 | [M+Na]+ | C42H80NO8P | PC(16:0/18:2) a,b | 7.17 × 10⁻⁷ | 0.85 | 5.54 | |
| 12.56 | 784.5827 | [M+Na]+ | C42H84NO8P | PC(16:0/18:0) b | 3.77 × 10⁻³ | 0.73 | 6.02 | |
| 12.56 | 806.5648 | [M+Na]+ | C44H82NO8P | PC(18:1/18:2) b | 1.89 × 10⁻³ | 0.78 | 1.95 | |
| 13.24 | 742.5729 | [M+H]+ | C42H80NO7P | PC(O-16:1/18:2) b | 4.40 × 10⁻² | 0.85 | 1.18 | |
| 13.22 | 838.5980 | [M+FA−H]− | C46H84NO7P | PC(P-18:0/20:4) | 4.55 × 10⁻³ | 0.73 | 1.01 | |
| 13.74 | 880.6082 | [M−H]− | C49H88NO10P | PC(18:0/22:5) b | 8.01 × 10⁻⁴ | 0.79 | 1.07 | |
| 12.47 | 758.5677 | [M+H]+ | C42H80NO8P | PC(18:2/16:0) | 9.74 × 10⁻⁴ | 0.88 | 11.7 | |
| 13.26 | 878.5931 | [M+FA−H]− | C48H84NO8P | PC(18:0/22:6) a | 4.20 × 10⁻² | 0.85 | 1.20 | |
| 13.62 | 734.5679 | [M+H]+ | C40H80NO8P | PC(16:0/16:0) | 6.32 × 10⁻³ | 0.83 | 1.85 | |
| 13.68 | 782.5648 | [M+Na]+ | C42H82NO8P | PC(16:0/18:1) a | 3.58 × 10⁻³ | 0.88 | 1.90 | |
| 21.95 | 920.7677 | [M+NH4]+ | C59H98O6 | TG(16:0/18:2/22:6) b | Triglycerides (TG) | 1.57 × 10⁻² | 1.46 | 2.72 |
| 22.42 | 879.7385 | [M+Na]+ | C55H100O6 | TG(16:1/18:1/18:1) b | 1.39 × 10⁻⁶ | 0.87 | 3.31 | |
| 21.35 | 712.6435 | [M+NH4]+ | C43H82O6 | TG(12:0/14:0/14:0) | 7.32 × 10⁻⁹ | 0.59 | 1.76 | |
| 21.62 | 918.7527 | [M+NH4]+ | C59H96O6 | TG(18:2/20:5/18:2) | 1.02 × 10⁻³ | 2.03 | 1.46 | |
| 21.80 | 740.6746 | [M+NH4]+ | C45H86O6 | TG(12:0/14:0/16:0) | 3.429 × 10⁻⁹ | 0.68 | 1.54 | |
| 22.80 | 671.5718 | [M+Na]+ | C45H76O2 | CE(18:2) b | Cholesterol ester (CE) | 1.49 × 10⁻² | 0.91 | 2.14 |
| RT | m/z | Adduct Ion | Elemental Composition | Metabolite Identification a,b | Category | p Value | Fold Change (NDT2D/Control) | VIP |
|---|---|---|---|---|---|---|---|---|
| 1.41 | 318.2993 | [M+H]+ | C18H39NO3 | Phytosphingosine b | Sphingolipids | 1.58 × 10⁻⁹ | 0.64 | 4.99 |
| 1.43 | 274.2732 | [M+H]+ | C16H35NO2 | C16 Sphinganine b | 3.25 × 10⁻¹² | 0.53 | 21.6 | |
| 1.60 | 288.2889 | [M+H]+ | C17H37NO2 | C17 Sphinganine b | 5.49 × 10⁻¹⁶ | 4.22 | 16.3 | |
| 1.64 | 272.2578 | [M+H]+ | C16H33NO2 | C16 Sphingosine b | 1.81 × 10⁻¹² | 0.52 | 1.68 | |
| 1.86 | 302.3047 | [M+H]+ | C18H39NO2 | Sphinganine b | 4.12 × 10⁻⁵ | 0.02 | 5.56 | |
| 1.90 | 286.2734 | [M+H]+ | C17H35NO2 | C17 Sphingosine b | 1.12 × 10⁻²⁴ | 4.53 | 1.79 | |
| 2.73 | 330.3358 | [M+H]+ | C20H43NO2 | N,N-dimethyl-Safingol b | 4.35 × 10⁻⁵ | 0.03 | 3.71 | |
| 15.48 | 811.6665 | [M+H]+ | C47H91N2O6P | SM(d18:2/24:1) b | 4.47 × 10⁻⁵ | 0.75 | 2.73 | |
| 15.44 | 855.6609 | [M+FA−H]− | C47H91N2O6P | 3.88 × 10⁻³ | 0.76 | 4.30 | ||
| 17.00 | 857.6768 | [M+FA−H]− | C47H93N2O6P | SM(d18:1/24:1) b | 2.28 × 10⁻² | 0.81 | 3.90 | |
| 17.05 | 813.6825 | [M+H]+ | C47H93N2O6P | 1.21 × 10⁻³ | 0.79 | 2.46 | ||
| 12.06 | 703.5733 | [M+H]+ | C39H79N2O6P | SM(d18:1/16:0) a | 2.98 × 10⁻² | 0.88 | 2.98 | |
| 19.92 | 692.6211 | [M+FA−H]− | C42H81NO3 | Cer(d18:1/24:1) | 5.31 × 10⁻³ | 1.48 | 1.19 | |
| 3.79 | 522.3545 | [M+H]+ | C26H52NO7P | LysoPC(18:1) a,b | Lysophosphatidylcholine (LysoPC) | 4.03 × 10⁻⁴ | 0.81 | 1.78 |
| 3.77 | 566.3469 | [M+FA−H]− | C26H52NO7P | 1.04 × 10⁻² | 0.84 | 2.02 | ||
| 5.21 | 524.3701 | [M+H]+ | C26H54NO7P | LysoPC(18:0) a,b | 9.97 × 10⁻⁵ | 0.81 | 3.16 | |
| 5.18 | 568.3625 | [M+FA−H]− | C26H54NO7P | 9.63 × 10⁻⁸ | 0.85 | 4.79 | ||
| 2.77 | 520.3389 | [M+H]+ | C26H50NO7P | LysoPC(18:2) | 3.71 × 10⁻² | 0.84 | 1.69 | |
| 12.47 | 780.5487 | [M+Na]+ | C42H80NO8P | PC(16:0/18:2) a,b | Phosphatidylcholine (PC) | 9.05 × 10⁻⁴ | 0.89 | 3.31 |
| 12.56 | 784.5827 | [M+Na]+ | C42H84NO8P | PC(16:0/18:0) b | 3.43 × 10⁻² | 0.81 | 3.99 | |
| 12.56 | 806.5648 | [M+Na]+ | C44H82NO8P | PC(18:1/18:2) b | 1.08 × 10⁻² | 0.83 | 1.44 | |
| 13.24 | 742.5729 | [M+H]+ | C42H80NO7P | PC(O-16:1/18:2) b | 3.24 × 10⁻² | 0.84 | 1.10 | |
| 13.75 | 832.5801 | [M+Na]+ | C46H84NO8P | PC(18:0/20:4) a | 6.57 × 10⁻³ | 0.84 | 1.58 | |
| 14.05 | 808.5800 | [M+Na]+ | C44H84NO8P | PC(18:0/18:2) a,b | 4.36 × 10⁻³ | 0.90 | 2.31 | |
| 13.74 | 880.6082 | [M−H]− | C49H88NO10P | PC(18:0/22:5) b | 2.04 × 10⁻³ | 0.82 | 1.46 | |
| 14.01 | 812.6125 | [M+Na]+ | C44H88NO8P | PC(18:0/18:0) | 7.03 × 10⁻⁷ | 0.36 | 1.83 | |
| 14.43 | 856.6086 | [M+FA−H]− | C46H86NO8P | PC(18:0/20:3) | 1.02 × 10⁻² | 0.84 | 2.53 | |
| 15.37 | 788.6140 | [M+H]+ | C44H86NO8P | PC(16:0/20:1) | 2.21 × 10⁻³ | 0.85 | 2.65 | |
| 12.91 | 746.5143 | [M−H]− | C43H74NO7P | PE(P-16:0/22:6) | Phosphatidylethanolamine (PE) | 2.69 × 10⁻³ | 1.27 | 1.14 |
| 13.39 | 722.5144 | [M−H]− | C41H74NO7P | PE(P-16:0/20:4) | 1.72 × 10⁻¹⁰ | 1.78 | 1.52 | |
| 15.05 | 750.5456 | [M−H]− | C43H78NO7P | PE(P-18:0/20:4) | 4.72 × 10⁻² | 1.22 | 1.62 | |
| 21.95 | 920.7677 | [M+NH4]+ | C59H98O6 | TG(16:0/18:2/22:6) b | Triglycerides (TG) | 4.14 × 10⁻² | 1.30 | 1.50 |
| 22.42 | 879.7385 | [M+Na]+ | C55H100O6 | TG(16:1/18:1/18:1) b | 1.58 × 10⁻⁴ | 0.89 | 2.15 | |
| 21.65 | 894.7523 | [M+NH4]+ | C57H96O6 | TG(18:2/18:2/18:3) | 4.02 × 10⁻² | 0.69 | 1.77 | |
| 22.08 | 927.7384 | [M+Na]+ | C59H100O6 | TG(16:0/18:1/22:6) | 1.65 × 10⁻⁴ | 0.65 | 1.76 | |
| 22.19 | 898.7833 | [M+NH4]+ | C57H100O6 | TG(16:0/18:1/20:4) | 3.11 × 10⁻² | 0.85 | 4.34 | |
| 22.41 | 900.7985 | [M+NH4]+ | C57H102O6 | TG(18:1/18:1/18:2) | 2.89 × 10⁻² | 0.87 | 4.32 | |
| 22.65 | 850.7839 | [M+NH4]+ | C53H100O6 | TG(16:0/16:0/18:1) | 1.37 × 10⁻² | 1.23 | 4.24 | |
| 22.88 | 904.8303 | [M+NH4]+ | C57H106O6 | TG(18:1/18:1/18:0) | 4.09 × 10⁻² | 1.33 | 3.06 | |
| 22.90 | 878.8150 | [M+NH4]+ | C55H104O6 | TG(16:0/18:1/18:0) | 2.05 × 10⁻³ | 1.68 | 5.31 | |
| 22.92 | 852.7994 | [M+NH4]+ | C53H102O6 | TG(16:0/16:0/18:0) | 4.15 × 10⁻⁵ | 1.46 | 1.41 | |
| 23.17 | 906.8463 | [M+NH4]+ | C57H108O6 | TG(18:1/18:0/18:0) | 2.65 × 10⁻² | 1.72 | 1.60 | |
| 22.63 | 876.7993 | [M+NH4]+ | C55H102O6 | TG(16:0/18:1/18:1) | 7.63 × 10⁻³ | 1.22 | 7.80 | |
| 22.80 | 671.5718 | [M+Na]+ | C45H76O2 | CE(18:2) b | Cholesterol ester (CE) | 2.81 × 10⁻² | 0.90 | 1.84 |
| 20.71 | 687.5680 | [M+Na]+ | C45H76O3 | CE(18:2-OH) | 1.08 × 10⁻⁵ | 18.2 | 3.12 | |
| 22.53 | 664.6013 | [M+NH4]+ | C45H74O2 | CE(18:3) | 3.45 × 10⁻² | 0.78 | 1.03 | |
| 22.59 | 695.5720 | [M+Na]+ | C47H76O2 | CE(20:4) | 3.99 × 10⁻² | 0.70 | 1.14 | |
| 17.43 | 617.5102 | [M+Na]+ | C37H70O5 | DG(16:0/18:1) | Diacylglycerol | 2.83 × 10⁻³ | 1.44 | 1.24 |
| Discriminated Metabolites | AUC | Sensitivity | Specificity | Change Trend * |
|---|---|---|---|---|
| FPG | 1.000 | 1.000 | 1.000 | ↑ |
| HbA1c | 0.920 | 0.920 | 1.000 | ↑ |
| TG | 0.893 | 0.800 | 0.925 | ↑ |
| LDL-C | 0.845 | 0.800 | 0.800 | ↑ |
| BMI | 0.833 | 0.800 | 1.000 | ↑ |
| C17 Sphingosine | 1.000 | 1.000 | 1.000 | ↑ |
| Sphinganine | 0.985 | 1.000 | 0.949 | ↓ |
| C16 Sphingosine | 0.960 | 0.950 | 0.949 | ↓ |
| C16 Sphinganine | 0.956 | 0.950 | 0.872 | ↓ |
| N,N-dimethyl-Safingol | 0.936 | 0.875 | 0.821 | ↓ |
| C17 Sphinganine | 0.935 | 1.000 | 0.850 | ↑ |
| Phytosphingosine | 0.917 | 0.875 | 0.821 | ↓ |
| PE(P-16:0/22:6) | 0.900 | 1.000 | 0.825 | ↑ |
| TG(16:0/16:0/18:0) | 0.873 | 0.800 | 0.900 | ↑ |
| PC(18:0/18:0) | 0.798 | 0.750 | 0.769 | ↓ |
| PE(P-18:0/20:4) | 0.785 | 0.800 | 0.775 | ↑ |
| SM(d18:2/24:1) | 0.764 | 0.725 | 0.692 | ↓ |
| LysoPC(18:1) | 0.752 | 0.875 | 0.615 | ↓ |
| TG(16:0/18:1/18:0) | 0.745 | 1.000 | 0.525 | ↑ |
| TG(16:0/18:1/22:6) | 0.736 | 0.650 | 0.692 | ↓ |
| TG(16:1/18:1/18:1) | 0.731 | 0.725 | 0.667 | ↓ |
| LysoPC(18:0) | 0.726 | 0.525 | 0.872 | ↓ |
| CE(18:2-OH) | 0.724 | 0.641 | 0.700 | ↑ |
| SM(d18:1/24:1) | 0.720 | 0.725 | 0.692 | ↓ |
| PC(16:0/18:2) | 0.700 | 0.625 | 0.667 | ↓ |
Disclaimer/Publisher’s Note: The statements, opinions and data contained in all publications are solely those of the individual author(s) and contributor(s) and not of MDPI and/or the editor(s). MDPI and/or the editor(s) disclaim responsibility for any injury to people or property resulting from any ideas, methods, instructions or products referred to in the content. |
© 2024 by the authors. Licensee MDPI, Basel, Switzerland. This article is an open access article distributed under the terms and conditions of the Creative Commons Attribution (CC BY) license (https://creativecommons.org/licenses/by/4.0/).
Share and Cite
Feng, L.; He, B.; Xia, J.; Wang, Z. Untargeted and Targeted Lipidomics Unveil Dynamic Lipid Metabolism Alterations in Type 2 Diabetes. Metabolites 2024, 14, 610. https://doi.org/10.3390/metabo14110610
Feng L, He B, Xia J, Wang Z. Untargeted and Targeted Lipidomics Unveil Dynamic Lipid Metabolism Alterations in Type 2 Diabetes. Metabolites. 2024; 14(11):610. https://doi.org/10.3390/metabo14110610
Chicago/Turabian StyleFeng, Li, Bingshu He, Jianzhen Xia, and Zhonghua Wang. 2024. "Untargeted and Targeted Lipidomics Unveil Dynamic Lipid Metabolism Alterations in Type 2 Diabetes" Metabolites 14, no. 11: 610. https://doi.org/10.3390/metabo14110610
APA StyleFeng, L., He, B., Xia, J., & Wang, Z. (2024). Untargeted and Targeted Lipidomics Unveil Dynamic Lipid Metabolism Alterations in Type 2 Diabetes. Metabolites, 14(11), 610. https://doi.org/10.3390/metabo14110610