Article

Vitamin D and Its Metabolites Status before and during Chemotherapy in Caucasian Breast Cancer Patients

by
Małgorzata Kimsa-Furdzik
1,
Anna Bednarek
2,3,
Grzegorz Hibner
1,
Paulina Czajka-Francuz
3,
Sylwia Cisoń-Jurek
3,
Dobromiła Karawasiecka
3,
Bożena Szymczak
3,
Jerzy Wojnar
3,
Jerzy Chudek
3 and
Tomasz Francuz
1,*
1
Department of Biochemistry, Faculty of Medical Sciences in Katowice, Medical University of Silesia, Medyków 18 St., 40-752 Katowice, Poland
2
1st Department of Cardiology, Medical University of Silesia, 47 Ziołowa St., 40-635 Katowice, Poland
3
Department of Internal Medicine and Oncological Chemotherapy, Faculty of Medical Sciences in Katowice, Medical University of Silesia, Reymonta 8 St., 40-027 Katowice, Poland
*
Author to whom correspondence should be addressed.
Metabolites 2023, 13(9), 996; https://doi.org/10.3390/metabo13090996
Submission received: 19 July 2023 / Revised: 29 August 2023 / Accepted: 31 August 2023 / Published: 6 September 2023
(This article belongs to the Special Issue Metabolism and Cancer Biology)

Abstract

:
Background: The predictive role of vitamin D (VD) in breast cancer (BC) patients’ survival is still being investigated. This paper aims to evaluate the changes in VD metabolites during chemotherapy (CTH) and the predictive role of VD status in Caucasian BC patients treated with CTH. Methods: Vitamin D and its metabolites were assessed with reference LC–MS/MS methodology in 98 consecutive BC patients starting CHT, after 3 and 6 months, and compared to the control group. Results: The frequency of VD deficiency in BC patients was greater than in the control group (56.1% vs. 37.2%). After 6 months of CTH, the number of VD-deficient BC patients slightly increased to 60%. The concentrations of VD active forms [25(OH)D2, 25(OH)D3], and catabolites [24,25(OH)2D3 and 3-epi-25(OH)D3] decreased after 3 and 6 months of CTH compared to the baseline values. Strong positive correlations between concentrations of 3-epi-25(OH)D3 and 25(OH)D in both groups were found. Similar correlations were also observed between 24,25(OH)2D3 and 25(OH)D levels. Kaplan–Meier survival analysis showed significantly longer survival in BC patients without deficiency (>20 ng/mL) at baseline (HR = 2.44 (95% CI 1.07–5.59), p = 0.026). Conclusions: (1) Our data provide further evidence that BC patients before CTH are more VD-deficient than the general population and this deficiency increases further during CTH treatment, as observed using the reference LC-MS methodology. (2) Presented results show that VD catabolism is not affected in BC patients. (3) The poorer survival in VD-deficient BP patients supports the importance of VD supplementation in BC patients with 25(OH)D levels below 20 ng/mL.

1. Introduction

Breast cancer (BC) is the most common malignancy and cause of cancer-related mortality among women worldwide [1]. Vitamin D (VD) via stimulation of Vitamin D receptor (VDR) plays an important role in BC development, modulating cancer cell proliferation, differentiation, apoptosis, and epithelial–mesenchymal transition, as shown in preclinical and clinical studies [2,3,4]. VD plays a critical role not only in cancer, but also in maintaining homeostasis in various conditions including cardiovascular and lung diseases, diabetes, infections and pregnancy. VD deficiency has a negative impact on all-cause mortality [5].
New research emphasizes the involvement of VD in the regulation of tumor metabolism [6]. Of note, BC cells have a similar ability to convert the 25-OH metabolite of the active form—1,25(OH)2 D as periurethral cells in the kidney, and this process is independent of the hydroxylation regulation in the kidneys [7].
Low levels of VD increase the risk of BC development [8], and may affect the efficacy of treatment and patients’ prognosis [7,9]. The metabolic effects of VD are mediated not only by its active form but also metabolites [10].
Laboratory assessments of VD status in daily clinical practice are usually limited to 25-monohydroxylated forms: 25(OH)D2 and 25(OH)D3. Contrary to the main active form, 1,25(OH)2D, characterized by a short half-life (of 4–6 h), monohydroxylated forms have a longer half-life of app. 15 days [11]. These compounds can be assessed with immunoassays, high-performance liquid chromatography (HPLC), or liquid chromatography/tandem mass spectrometry (LC–MS/MS). Immunoassays assessments offer high sensitivity and automation. However, this method could over- or underestimate the total 25(OH)D level depending on the immunoassay type [12,13] due to the cross-reactivity of different VD forms. HPLC is characterized by low costs, but has low sensitivity and reduced ability to distinguish VD metabolites. LC–MS/MS is more expensive, but it identifies VD metabolites with high specificity and sufficient sensitivity. This technique also enables quantification and differentiation between 25(OH)D2 and 25(OH)D3 and other VD derivatives. Thus, LC–MS/MS is considered as the current reference method for the determination of VD [14,15].
The majority of BC patients before [7,15], and even more after chemotherapy (CTH) [16,17,18] demonstrated VD deficiency, but few previously published studies [7,19,20,21] used LC–MS/MS assessments. Importantly, metabolically active vitamin D2 and D3 derivatives levels depend significantly on the patient’s genotype [11], but limited data regarding BC Caucasian population have been published so far. That is why we aimed to assess baseline VD status and its changes during CTH using LC–MS/MS methodology in the Caucasian population.
Vitamin D metabolic effects depend on its catabolism. Thus, we considered the significance of its catabolic pathways in BC patients. Vitamin D is catabolized mainly by the transformation of 1,25(OH)2D and its precursor 25(OH)D via 24-hydroxylase enzyme into 24,25(OH)2D and 1,24,25(OH)3D derivatives, known as inactive metabolites. Far less information is available about the function of the C3-epimerase catabolic pathway [22,23], resulting in 3-epi-25(OH)D3 synthesis. However, due to different impacts on calcium and bone metabolism [24], distinguishing between 25(OH)D3 and the C-3 epimer is considered of biological importance [25]. So far, few clinical data are available regarding 3-epi-25(OH)D3 in BC patients. Therefore, we assessed the level of VD catabolites, 24,25(OH)2D3 and 3-epi-25(OH)D3, to provide further data on VD catabolic pathways in these patients.
Previous studies showed that VD could affect BC patients’ survival; however, the data are inconsistent [26].
We evaluated changes in VD metabolites during CTH and the predictive role of VD status in Caucasian patients with BC treated using CTH via the LC–MS/MS methodology.

2. Materials and Methods

2.1. Subjects

All patients screened for the study were admitted into the Department of Internal Medicine and Chemotherapy between 2013 and 2018. The main inclusion criteria included the diagnosis of BC confirmed with pathology result: Eastern Cooperative Oncology Group (ECOG) performance status ≤ 2. The main exclusion criteria were pregnancy or lactation, acute or chronic inflammatory diseases, and Vitamin D supplementation. All patients signed an informed consent form before enrollment. Finally, 105 women with BC were enrolled in the study. Subjects received CTH as neoadjuvant, adjuvant, or palliative treatment with or without surgery, as planned by the oncologist, in accordance with the current clinical guidelines of the National Comprehensive Cancer Network (NCCN), dated 2014 [27]. Patients were assessed at baseline and followed-up for 6 months after the start of treatment, then assessed for survival. Vitamin D levels were compared to the control group which consisted of 43 all-comer women [age 59.0 ± 17.5 years; BMI 28.0 (24.9–29.7) kg/m2; mean values ± SD] admitted consecutively into the endocrinology ward for the diagnosis of suprarenal gland adenoma, found free of the disease. Characteristics of the study group are shown in Table 1. The study was approved by the Bioethics Committee of the Medical University of Silesia in Katowice (EC approval no: KNW/0022/KB1/2/15) and was conducted in accordance with the Declaration of Helsinki.

2.2. Materials

Metabolites of Vitamin D (25(OH)D3, 3-epi-25(OH)D3, 25(OH)D2, and 24,25(OH)2D3) and deuterated internal standards (d6-25(OH)D3, d3-3-epi-25(OH)D3, d3-25(OH)D2, and d6-24,25(OH)2D3) were purchased from Sigma-Aldrich (Gillingham, Dorset, UK). During sample preparation, several reagents were used, such as water, methanol, ethyl acetate, hexane (Honeywell, Sigma-Aldrich), and zinc sulfate (POCh S.A., Gliwice, Poland). 4-(4′-dimethylaminophenyl)-1,2,4-triazoline-3,5-dione (DAPTAD) was used as a derivatization agent. It was synthesized by Masdiag Laboratory (Warsaw, Poland). For chromatographic separation, Agilent Eclipse ZORBAX XDB-C18 (1.7 m; 50 × 4.6 mm) column was used. (Advanced Chromatography Technologies Ltd., Aberdeen, Scotland).

2.3. Apparatus and Chromatographic Conditions

ExionLC high-performance liquid chromatograph (Sciex, Framingham, MA, USA) with CTC PAL autosampler (Zwinger, Switzerland) coupled with QTRAP® 4500 MS/MS system (Sciex) was used. Liquid chromatograph was equipped with a degasser, two pumps, and a column oven. Analyses were performed in a positive mode using electrospray ionization (ESI). For quantitative analysis, multiple reaction monitoring (MRM) was used. The ion source parameters were optimized with the flow injection analyses of the standards mixture. The following operating parameters of MS/MS system were applied: curtain gas (CUR) 30, ion source voltage (IS) 3000 V, temperature (TEM) 500 °C, nebulizing gas (GS1) 40, and drying gas (GS2) 50. CUR, GS1, and GS2 values are expressed in arbitrary units. The raw data were collected with the use of Analyst Software. Multiquant Software was used to process and quantify the collected data. The chromatographic analysis was performed using the Agilent Eclipse ZORBAX XDB-C18 (1.7 m; 50 × 4.6 mm) column at a flow rate of 0.8 mL∙min−1 and the column oven temperature was 40 °C. The mobile phase was prepared using water and acetonitrile with 0.1% formic acid. The gradient elution program was as follows: 0 min.—50% B, 2.5 min.—78% B, 3.2 min.—98% B, 4.5 min.—98% B, and 4.6 min.—50% B. The injection volume was 20 μL. Total run time was 5.5 min. The quantitative analysis of vitamin D metabolites was performed using the isotope dilution method. The concentration was calculated on the basis of the ratio of the area of a given metabolite peak to the area of the internal standard peak. The obtained values from serum were compared with the calibration curve. All LC-MS/MS assessments were performed according to the methodology described in detail in the publications [28,29].

2.4. Serum Sample Preparation

Venous blood samples were collected before the administration of CTH and during the selected follow-up visits (after 3 and 6 months of CTH initiation). Vitamin D concentration was assessed in serum samples stored at a temperature below −170 °C until analysis was carried out. The sample preparation process was started by incubating 100 µL of serum with 10 µL of solution of isotope-labeled standards for 30 min. Then, protein precipitation was performed using 0.2 M zinc sulfate solution and methanol. The mixture was vortexed for 10 s. Subsequently, liquid–liquid extraction was carried out using hexane as an extractant. The extraction was performed twice. After each extraction step, the sample was vortexed and centrifuged (13,000 RPM, 5 min). Organic extracts were combined and evaporated under a stream of nitrogen. Afterward, the derivatization reaction was performed with the use of DAPTAD as a derivatization agent, for 30 min at room temperature. The mixture was evaporated under the stream of nitrogen and the residue was dissolved in methanol/water (1:1) solution. Finally, 20 μL of an aliquot was subjected to LC-MS/MS analysis.

2.5. Data Analysis

The total 25(OH)D concentration was calculated as the sum of 25(OH)D3 and 25(OH)D2 concentration. Subjects in the study and control groups were classified according to 25(OH)D concentration as severe deficient (≤10 ng/mL), deficient (10–20 ng/mL), insufficient (20–30 ng/mL), and sufficient (>30 ng/mL) [30,31].

2.6. Statistical Analyses

Statistical analyses were performed using Statistica 13.3 software (StatSoft, Tulsa, OK, USA). The level of significance was set at p < 0.05. The Shapiro–Wilk test was used to determine the distribution of the data. When the data were not distributed normally, nonparametric tests were applied for statistical analyses. For normally distributed data Student’s t-test was used. The chi-square test was applied to the categorical variables. The ANOVA Friedman test and post hoc test were used to assess the differences between the concentrations of 25(OH)D2, 25(OH)D3, 25(OH)D, 24,25(OH)2D3, and 3-epi-25(OH)D3 in the BC patients prior and after CTH. Patients with missing values were not considered in the statistical analysis for matched pairs. The correlation coefficients were calculated using the Spearman rank correlation test. For Kaplan–Meier analysis, the time from sample collection till the end of the follow-up or till death was taken into account.

3. Results

3.1. Vitamin D Status in BC Patients before and during Chemotherapy

In the BC patients group, at baseline, 56.1% of the patients were VD-deficient, 23.5% were insufficient and 20.4% of the patients were sufficient. In the control group, 37.2% of the patients were deficient, 46.5% of the patients were insufficient and 16.3% of the patients were sufficient (Table 2). The proportion of BC patients with 25(OH)D deficiency at baseline was significantly lower than in controls. After 6 months, the number of BC patients with 25(OH)D deficiency increased further to 60% (Table 2).

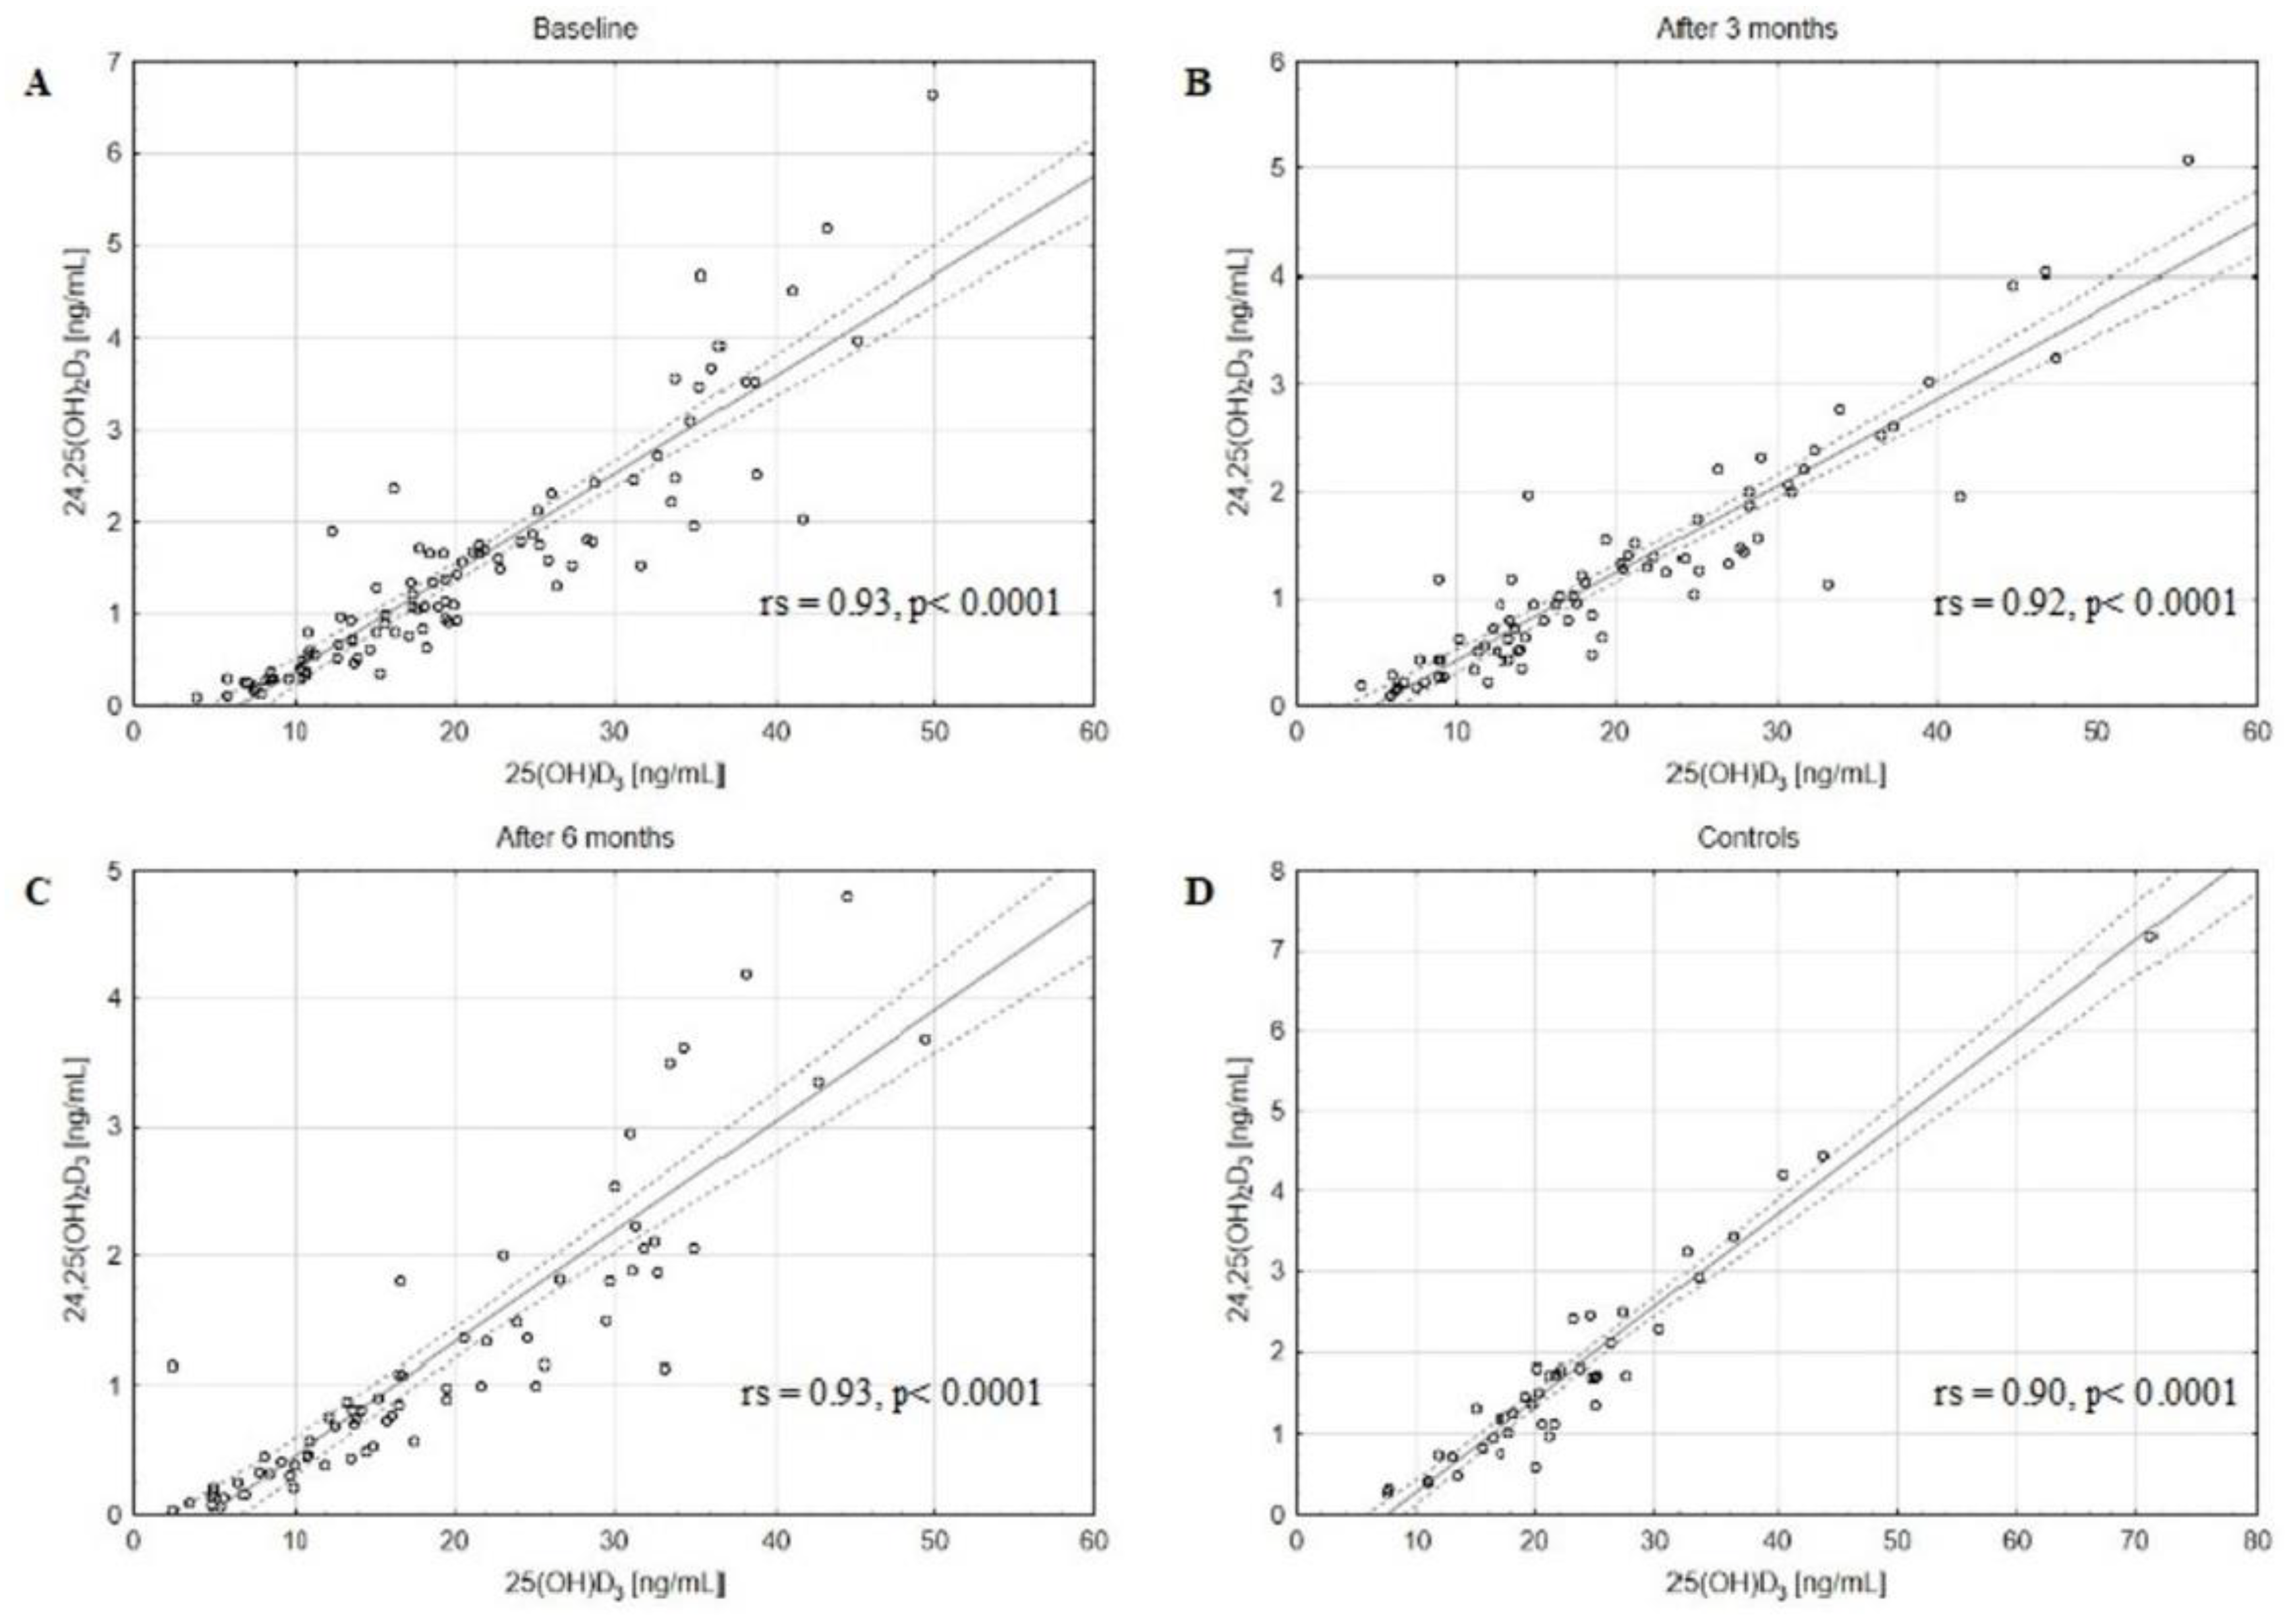
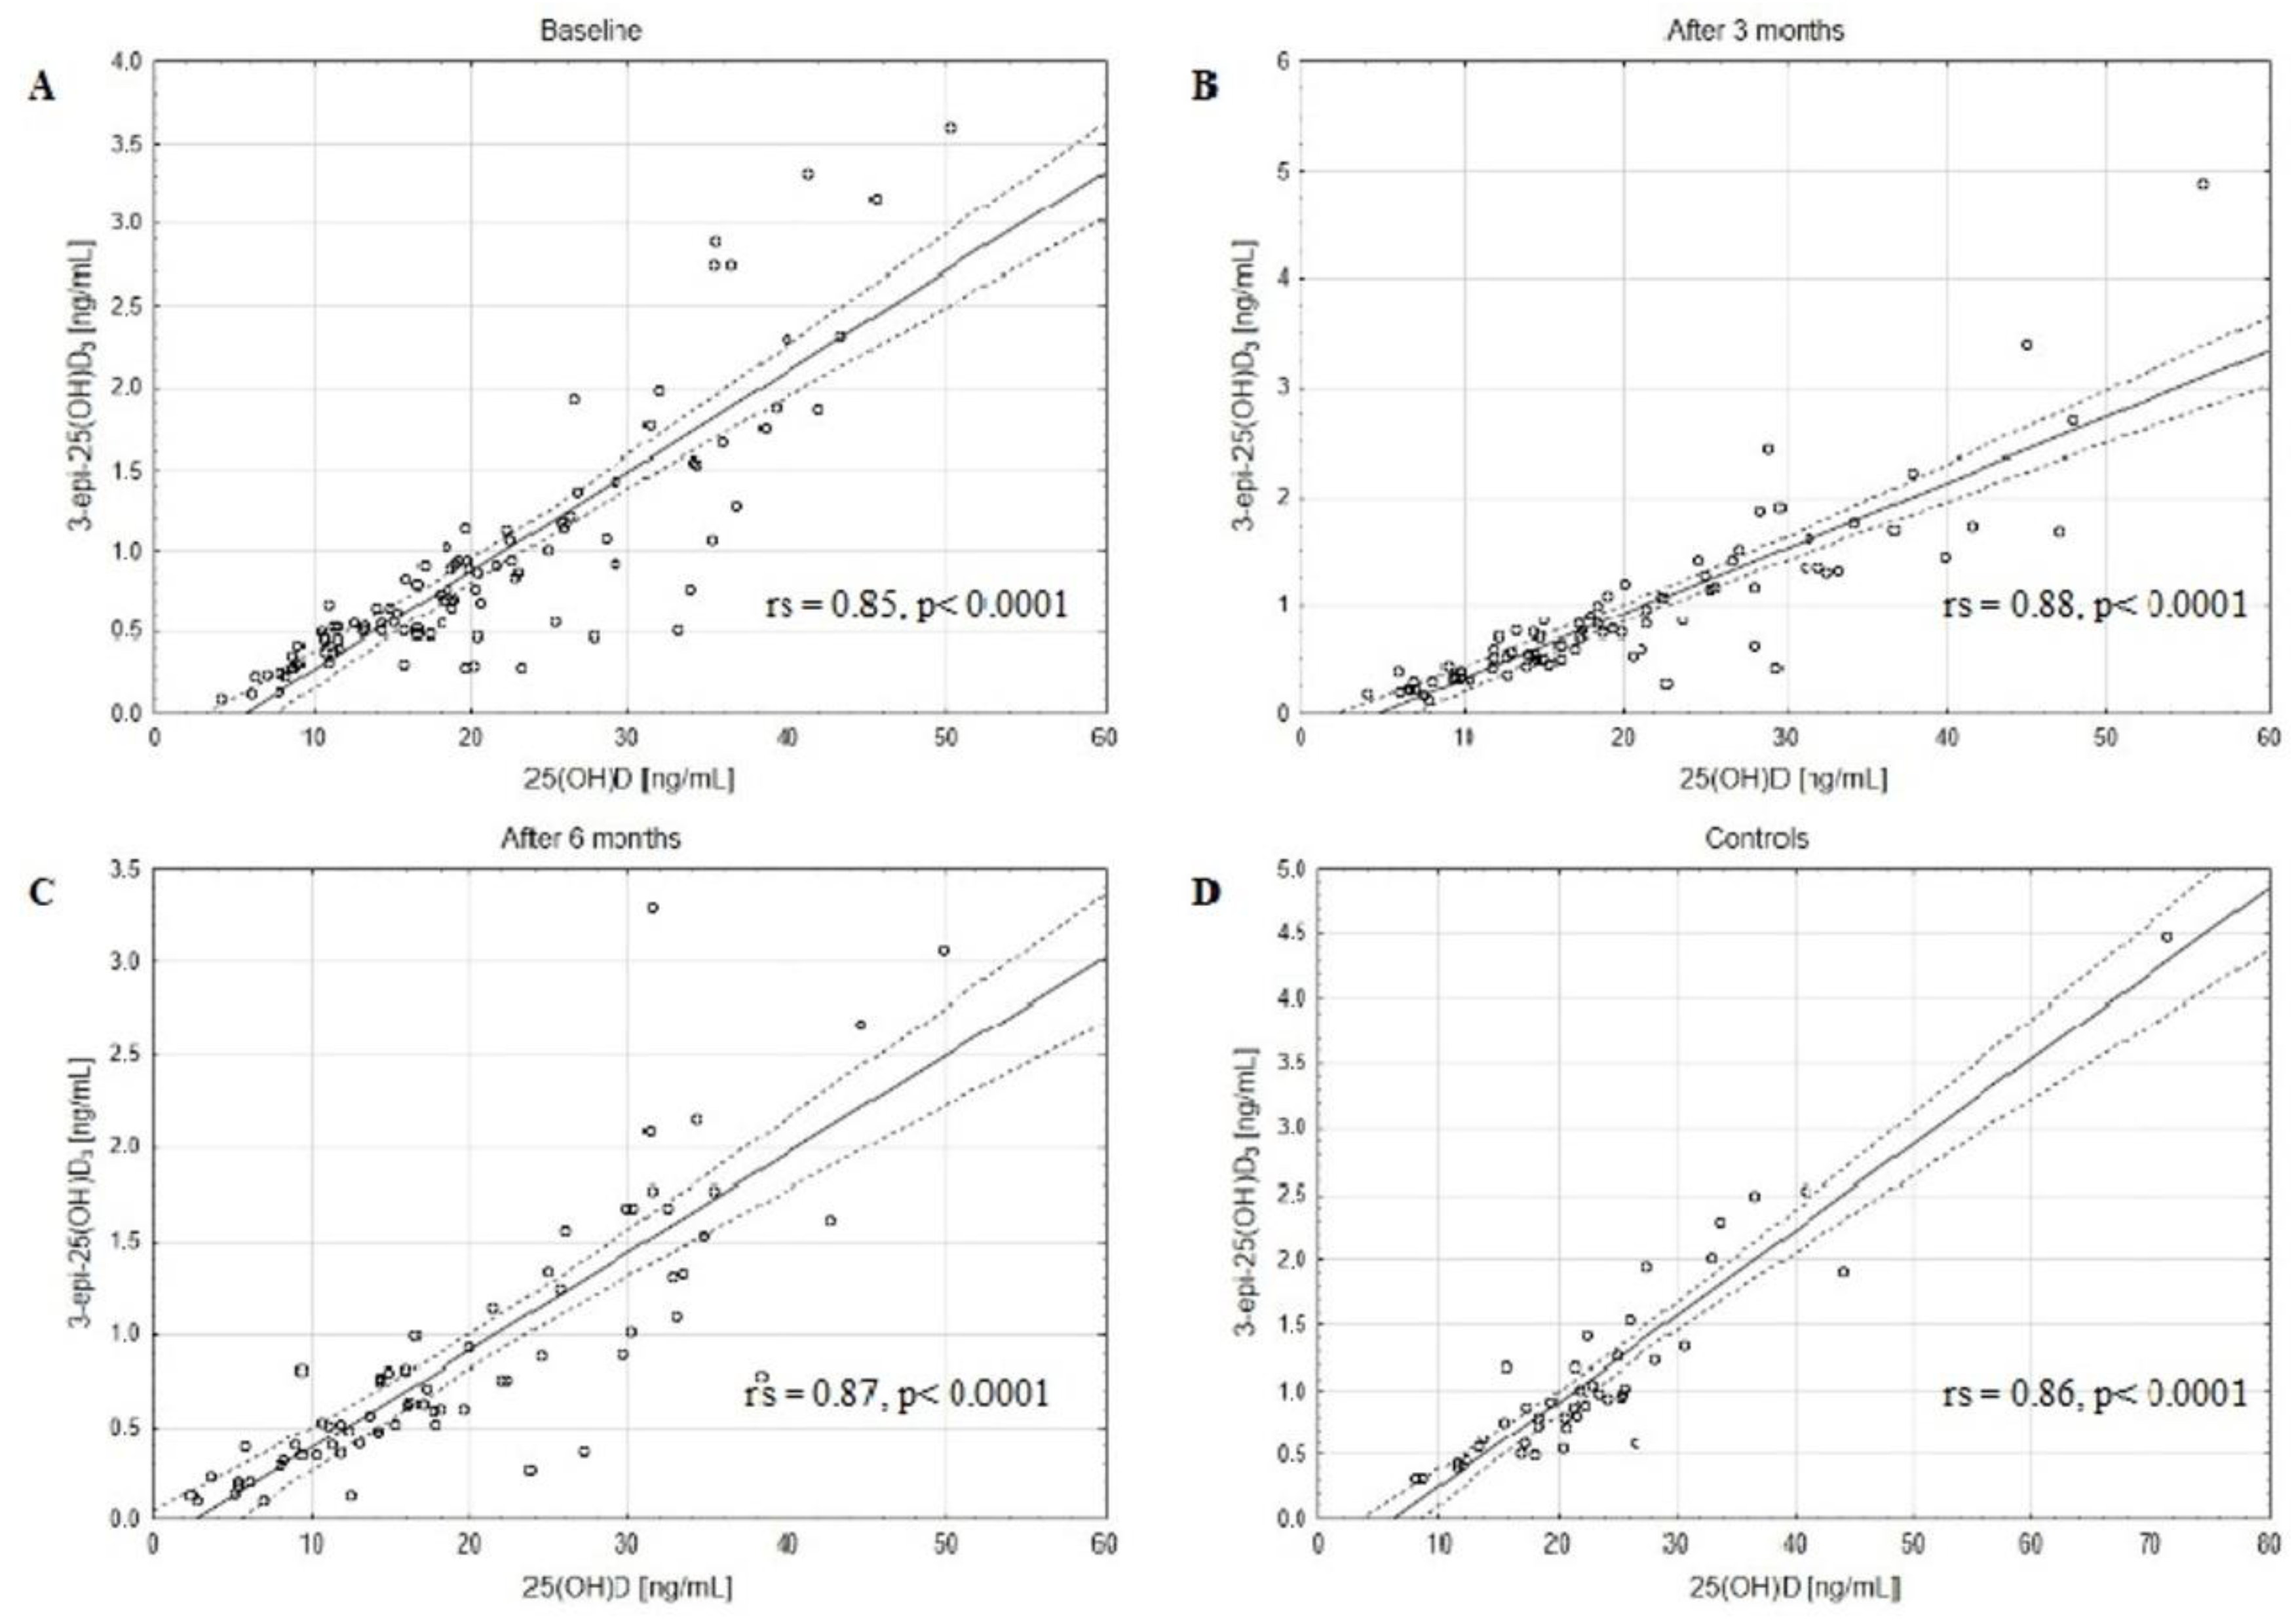
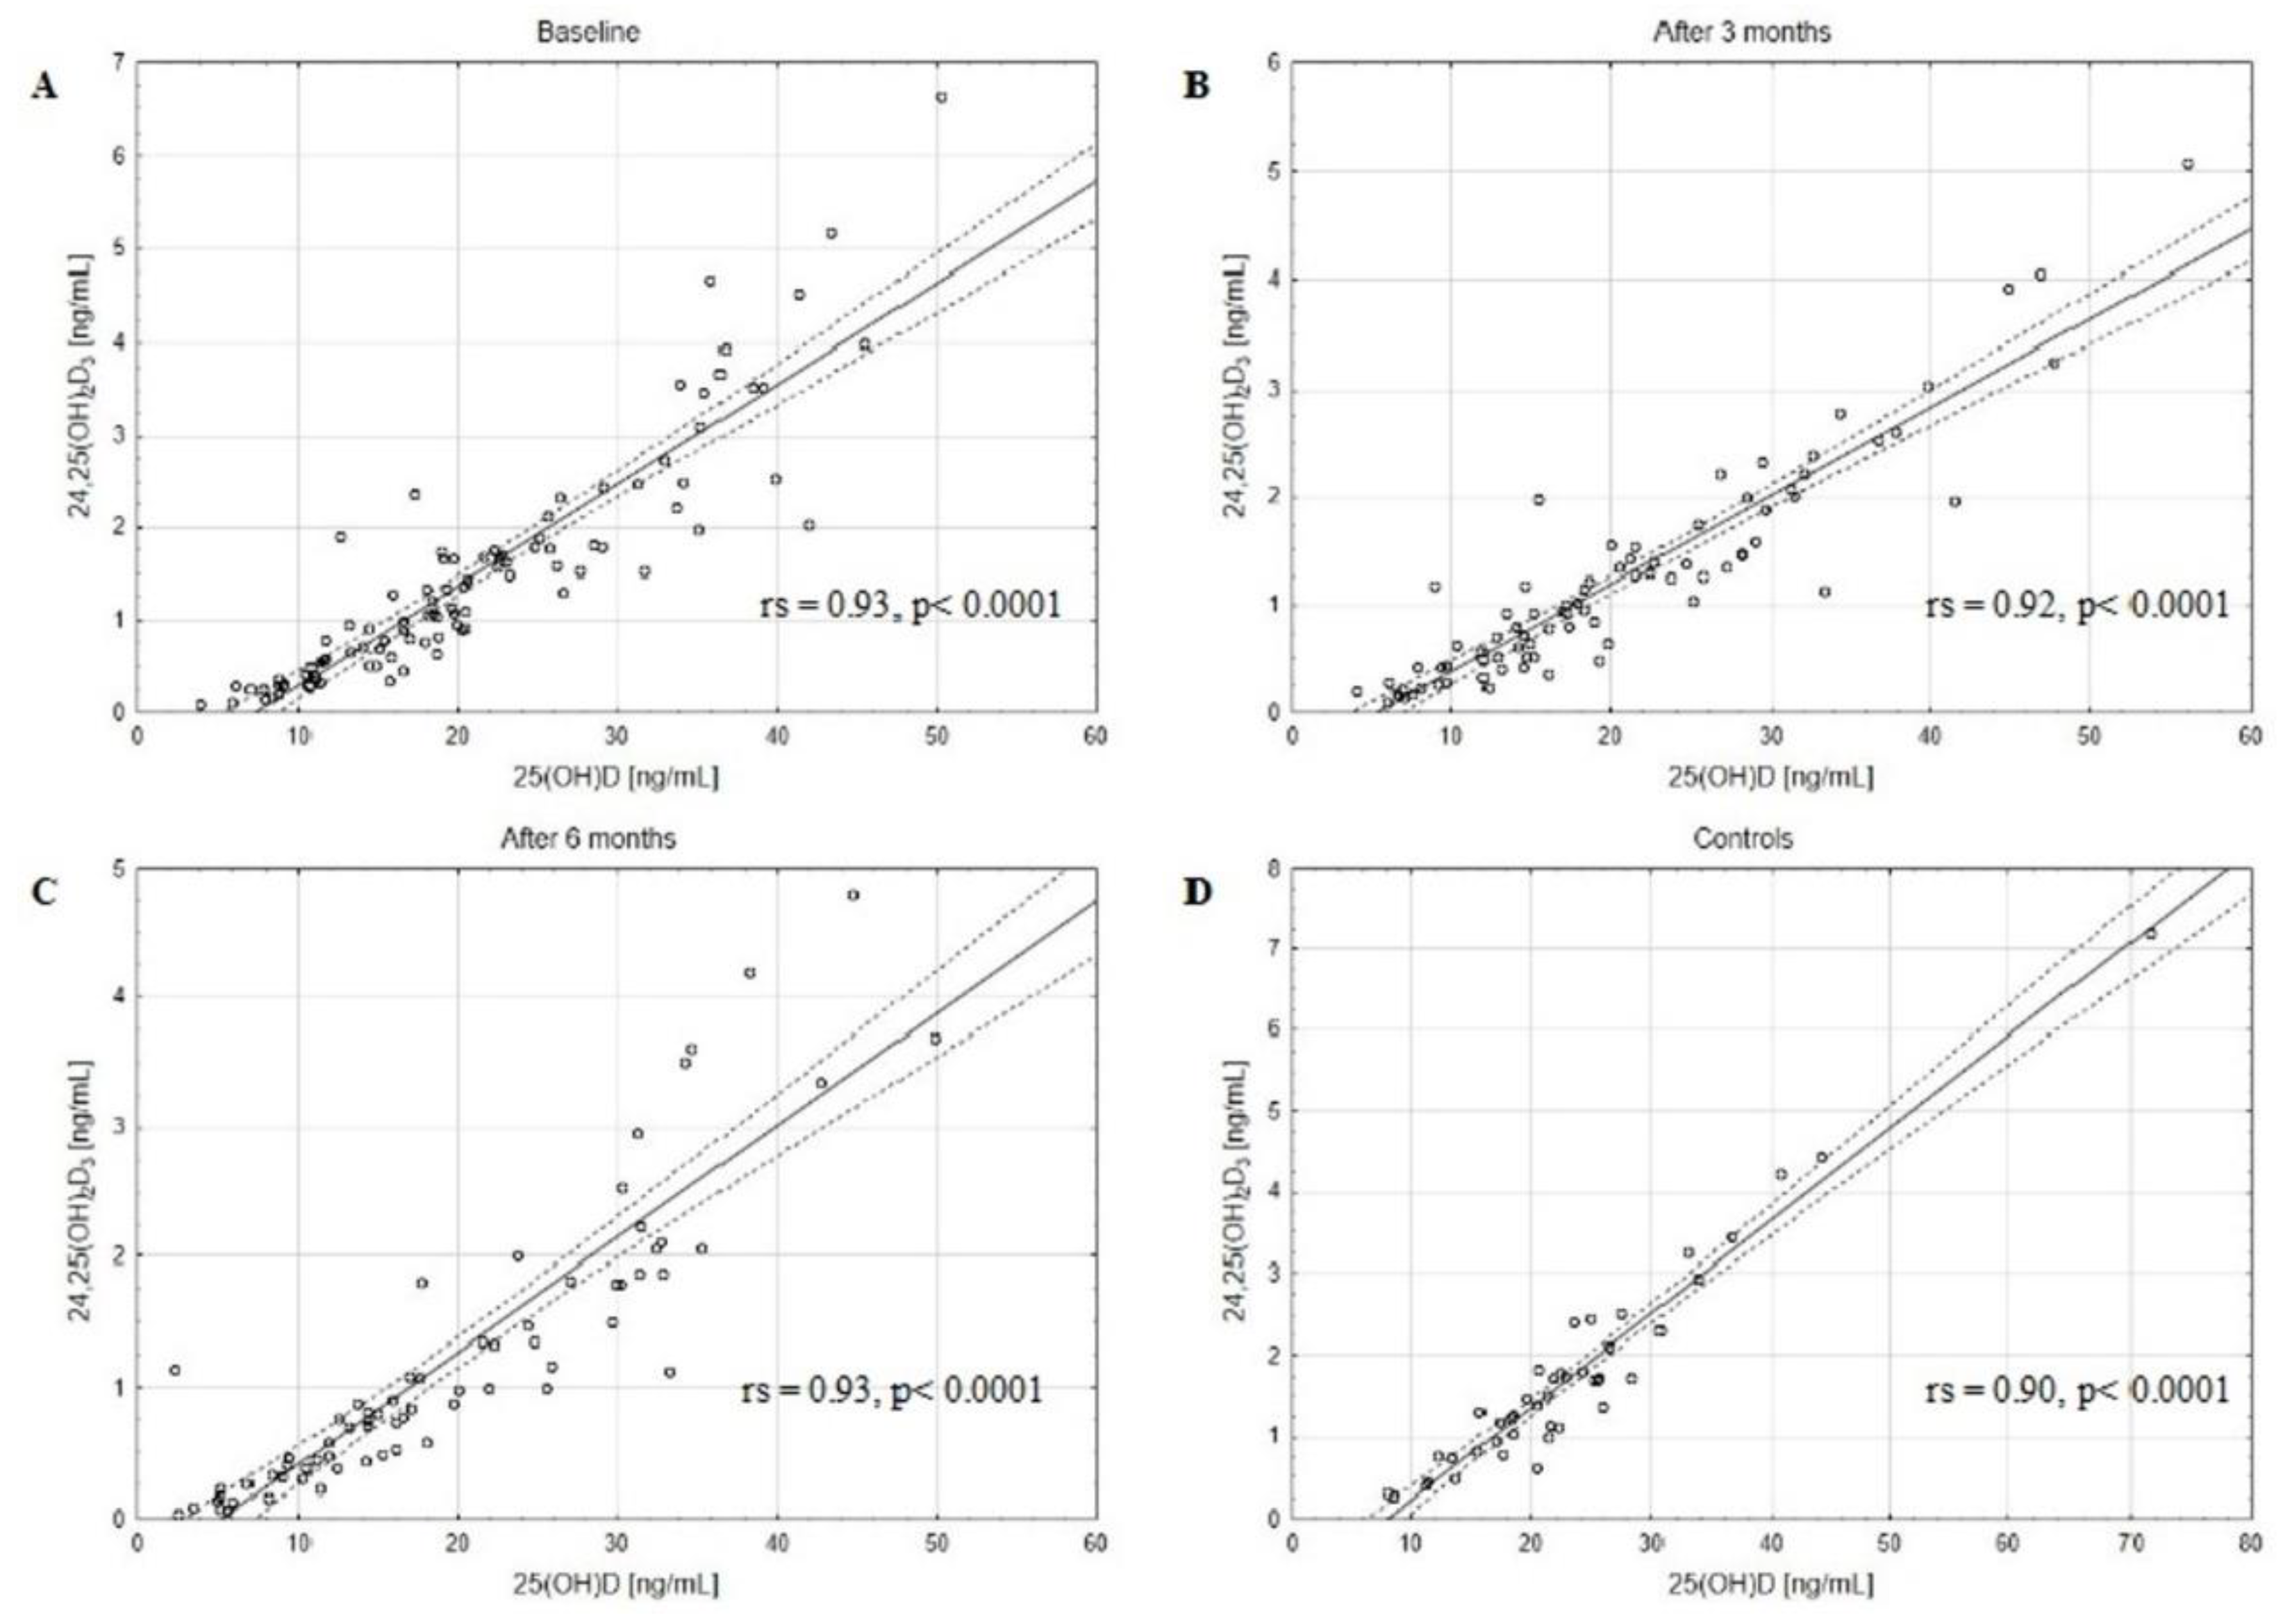
3.2. Changes in 25(OH)D, 25(OH)D2, 25(OH)D3, 24,25(OH)2D3 and 3-epi-25(OH)D3 Levels during Chemotherapy

The concentrations of assessed VD active forms, 25(OH)D2, 25(OH)D3, and 25(OH)D, as well as catabolites, 24,25(OH)2D3 and 3-epi-25(OH)D3, decreased in BC patients after 3 and 6 months of CTH compared to the baseline (Table 2). The matched pairs analysis showed a significant decrease in 25(OH)D, 25(OH)D2, 25(OH)D3, 24,25(OH)2D3, and 3-epi-25(OH)D3 levels in patients after 3 and 6 months of follow-up (Figure S1). Moreover, a strong positive correlation between the serum concentrations of 3-epi-25(OH)D3 and 25(OH)D3 in the BC patients at baseline, after 3 and 6 months of CTH, and in the control group was revealed (Figure 1). Similar positive correlations were also observed between 24,25(OH)2D3 and 25(OH)D3 levels (Figure 2). Of note, strong positive correlations were found also between 3-epi-25(OH)D3 and 25(OH)D (Figure 3) as well as 24,25(OH)2D3 and 25(OH)D levels (Figure 4).
In this study, BC patients receiving neoadjuvant, adjuvant, and palliative CTH, BC patients with different biological subtypes, histological subtypes, clinical stages, BC surgery, radiation therapy, hormone therapy, immunotherapy, and biological subtype were shown to have no significant differences in 25(OH)D, 3-epi-25(OH)D3, and 24,25(OH)2D3 levels at baseline, after 3, and 6 months of CTH (Kruskal–Wallis test or Mann–Whitney U test, p > 0.05).

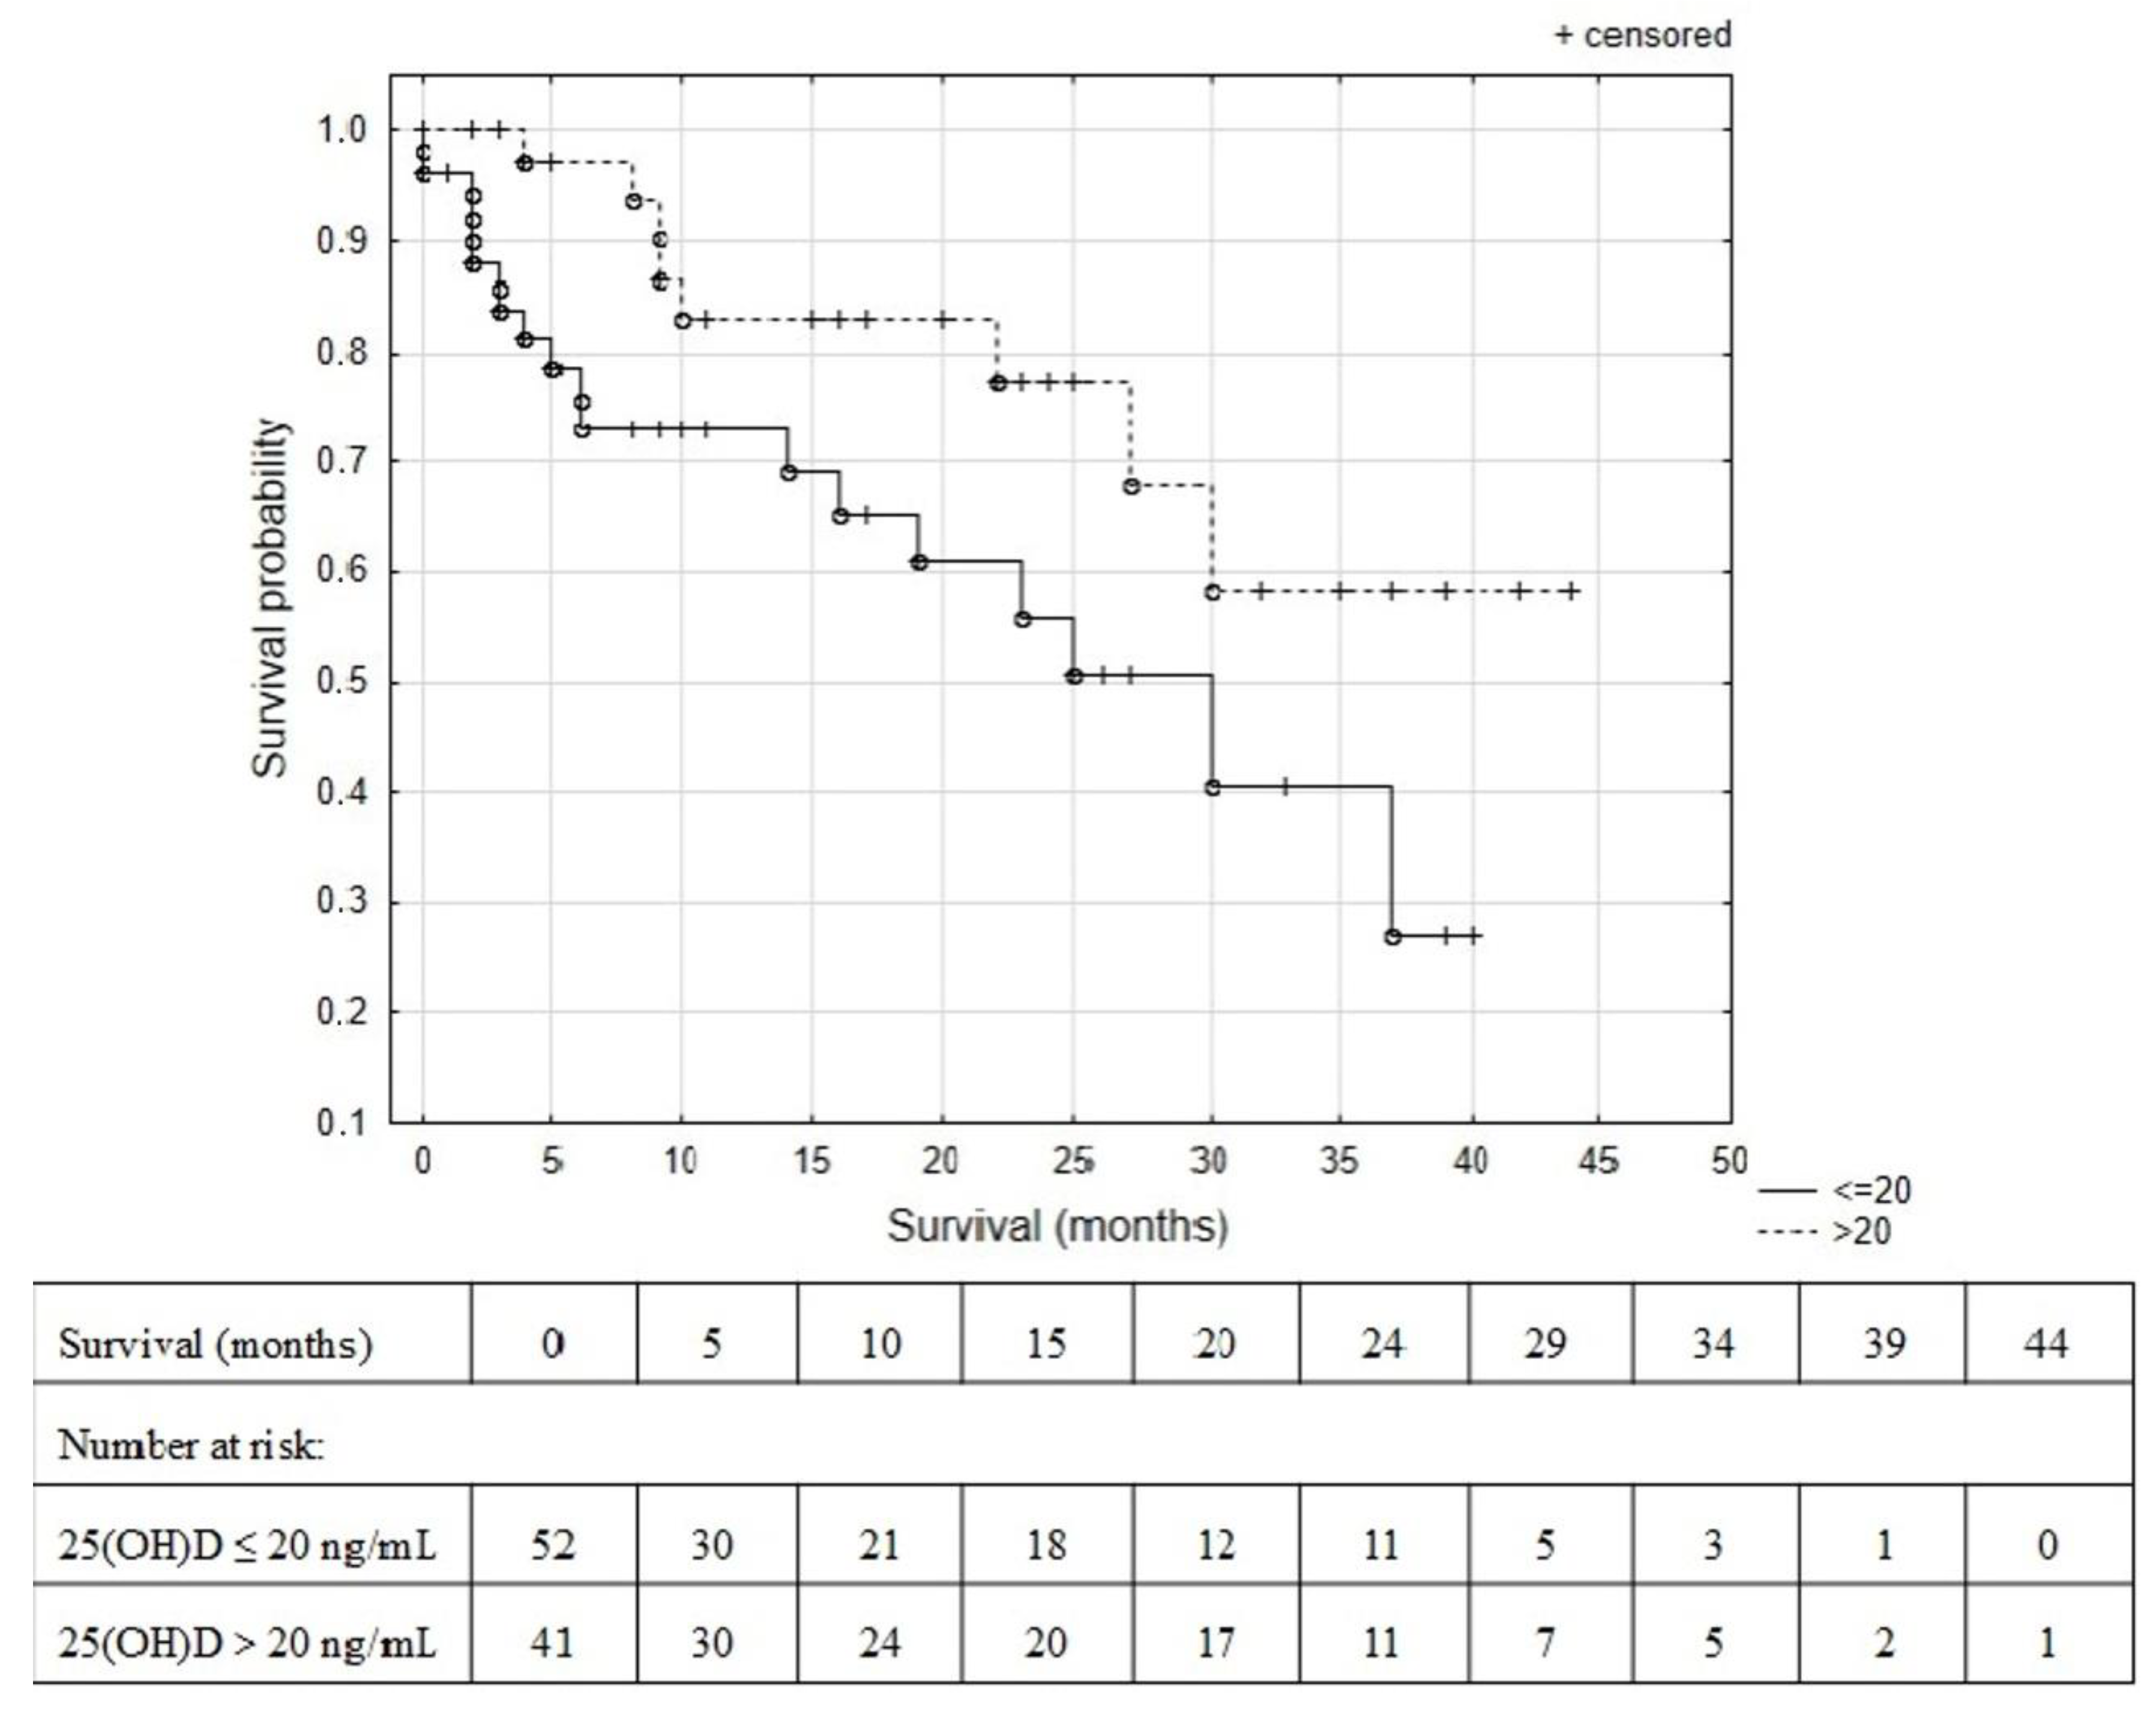
3.3. Predictive Role of Vitamin D Status

The survival probability of BC patients was analyzed using the Kaplan–Meier estimate for baseline measurement of 25(OH)D levels (Table 1). There was a significant survival difference between BC patients with 25(OH)D levels ≤ 20 ng/mL and >20 ng/mL at baseline (log-rank test, HR = 2.44 (95% CI 1.07–5.59), p = 0.026), see Figure 5. The 25th percentile of the survival time was 6 months for BC patients with 25(OH)D level ≤ 20 ng/mL and 23 months for BC patients with 25(OH)D level > 20 ng/mL at baseline. Moreover, the median overall survival was 25 months for patients with 25(OH)D deficiency.

4. Discussion

4.1. Vitamin D Status in BC Patients at Baseline and during CTH

The aim of this study was to assess baseline VD status [defined as a sum of serum levels of 25-(OH)D2 and 25-(OH)D3] and changes during CTH using LC–MS/MS methodology in non-supplemented BC patients.
At baseline, 56.1% BC patients were VD-deficient (<20 ng/mL), 23.5% were insufficient and only 20.4% had sufficient VD levels (>30 ng/mL). In comparison with the control group, we found more patients with VD deficiency (56.1% vs. 37.2%) among the BC patients. Decreased levels of VD in BC patients compared to control subjects were observed previously [32,33,34,35,36,37,38,39], and our results confirm these findings with the LC–MS/MS methodology. Presented findings could be a result of decreased sun exposure. However, we cannot exclude the increased demand for VD during carcinogenesis among the BC patients.
Moreover, the concentrations of VD [measured as a sum of 25(OH)D2 and 25(OH)D3], were further decreased in BC patients after 3 or 6 months of CTH, reaching 60% of BC patients with deficiency after 6 months. In an Indonesian study, similar results were recently published with the ELISA methodology. Severe VD deficiency [25(OH)D2 and 25(OH)D3) was found in 82.4% of BC patients at baseline and the rate further increased to 89.0% after CTH [16]. Kok et al. recorded decreased level of 25(OH)D3 1 to 3 weeks after CTH compared to 25(OH)D3 status prior to CTH in BC patients using the LC-MS/MS method; however only one VD form was assessed [33]. Kim et al. showed that only 26.9% of BC women were VD-sufficient after 6 months of CTH compared to 49.5% before CTH [40]. Our observations provide further evidence regarding the necessity of VD assessments and supplementation during CTH in BC patients. It seems even more important in the context of recent findings by El-Bassiouny et al. showing promising clinical evidence to support the cardioprotective effects of VD against pro-inflammatory cytokines induced by doxorubicin CTH [41].

4.2. Catabolites Status of 24,25(OH)2D3 and 3-epi-25(OH)D3 at Baseline and during Chemotherapy

Another aim of this study was to determine the level of VD catabolites, 24,25(OH)2D3 and 3-epi-25-(OH)D3, to provide further data regarding VD catabolic pathways in BC patients.
We found that the concentrations of the main catabolites, 24,25(OH)2D3 and 3-epi-25(OH)D3, were decreased at baseline in comparison to the control group and decreased in BC patients after 3 and 6 months of CTH as compared to baseline. Strong positive correlations between the serum concentrations of 3-epi-25(OH)D3 and 25(OH)D in the BC patients at baseline, after 3 and 6 months of CTH, and in the control group were found. Similar correlations were also observed between 24,25(OH)2D3 and 25(OH)D levels. Additionally, we revealed strong positive correlations between 3-epi-25(OH)D3 and 25(OH)D3, 24,25(OH)2D3, and 25(OH)D3 levels both in the study and control groups. The clinical implication of the observed strong correlations could be the limitation of VD assessment to only 25(OH)D levels. However, the results should be confirmed in other studies.
The presented results provide evidence that both catabolic pathways, via 24-hydroxylase enzyme into 24,25(OH)2D and 1,24,25(OH)3D, considered as inert metabolites, and via C3-epimerase catabolic pathway [22,23] resulting in 3-epi-25(OH)D3 synthesis, are engaged in the catabolism of VD in BC patients, similar to healthy subjects.
Although several authors showed the positive correlation between serum concentrations of 3-epi-25(OH)D3 and 25(OH)D3 using the LC-MS/MS method [42,43,44] in different populations, no data so far has been published for BC patients. To our knowledge, this is the first paper evaluating the impact of CTH on 24,25(OH)2D3 and 3-epi-25(OH)D3 metabolites in BC patients.

4.3. Predictive Role of Vitamin D Status

The additional goal of this study was to evaluate the predictive role of VD status in Caucasian BC patients treated with CTH. The Kaplan–Meier survival analysis showed poorer survival probability in BC patients with 25(OH)D levels ≤ 20 ng/mL at baseline.
Previously published results were inconsistent, but many authors observed an inverse association between VD levels before treatment and mortality in BC patients [45,46]; others did not confirm this relationship [47]. Among others, Tokunaga et al. showed that levels of VD over 23.6 ng/mL diminished the risk of BC-related mortality in newly diagnosed patients [9]. Vrieling et al. in a prospective study of BC patients found that a lower level of 25(OH)D assessed via enzyme immunoassay methodology was related to a higher risk of death [48]. In another study, Yao et al. investigated the predictive role of 25(OH)D serum levels measured at the time of diagnosis and found that 25(OH)D concentrations measured via immunochemiluminometric assay were inversely associated with the risk of disease progression and death [49].
Such results seem to justify vitamin VD supplementation in BC patients. Several studies analyzed the supplementation of VD post cancer diagnosis. A recent study showed that VD supplementation was associated with lower total mortality [50]. Other authors found that de novo post-diagnostic supplementation of VD was associated with a 20% reduction in breast cancer-specific mortality in a large cohort study [51].
The LC-MS/MS methodology presents a possibility to reliably assess VD and spectrum of its metabolites. The main novelty of this study is presenting VD catabolism data in BC patients using the LC-MS/MS methodology. Altered VD catabolism via 24-hydroxylase and 3-epimerase pathways could potentially contribute to decreased VD levels in BC patients. We showed that that VD catabolism is not affected in Caucasian BC patients receiving CHT. Correlations observed between VD and its catabolites allow for assessment of only 25(OH)D in the Caucasian BC patients. Moreover, this study provides additional data regarding the negative impact of VD deficiency for OS in Caucasian BC patients.
We realize some of this study’s limitations, including a lack of seasonal analysis related to sunshine exposure, assessment of eating habits, and heterogeneity of the group of BC patients starting CTH. Moreover, due to splitting the patients into deficiency/non-deficiency subgroups, the sample size was smaller, which can affect the statistical analysis.

5. Conclusions

The presented data provide further evidence that BC patients before CTH are more VD-deficient than the general population, and this deficiency increases further during the CTH treatment, as observed using the reference LC-MS/MS methodology. VD metabolites produced via 24-hydroxylase and C3-epimerase pathways could potentially contribute to VD deficiency. They show that VD catabolism is not affected in BC patients.
VD is considered an important factor in BC development, affecting BC cells metabolism and proliferation. VD deficiency can impact overall survival in BC patients’ population. The presented results confirm decreased survival in VD-deficient BC patients. This finding could suggest that VD supplementation is beneficial for patients with 25(OH)D levels below 20 ng/mL. However, the benefits from supplementation may not translate directly into improved survival, and such recommendations should be assessed in the future studies.

Supplementary Materials

The following supporting information can be downloaded at: https://www.mdpi.com/article/10.3390/metabo13090996/s1, Figure S1. The quantitative relationships between serum levels of 25(OH)D2 (A), 25(OH)D3 (B), 25(OH)D (C), 24,25(OH)2D3 (D) and 3-epi-25(OH)D3 (E) in the paired samples of the breast cancer patients at baseline and after chemotherapy. Each line represents an individual subject, the bold black lines represent the median values, * p < 0.05 ANOVA Friedman test followed with post hoc test, N = 68.

Author Contributions

Conceptualization, M.K.-F., J.C., A.B. and T.F.; methodology, M.K.-F., G.H. and T.F.; software, M.K.-F., G.H. and T.F.; validation, T.F. and J.C.; formal analysis, J.C., J.W. and T.F.; investigation, S.C.-J., A.B., D.K. and B.S.; resources, S.C.-J., A.B., D.K., P.C.-F. and B.S.; data curation, G.H., P.C.-F., M.K.-F., A.B. and D.K.; writing—original draft preparation, M.K.-F. and G.H.; writing—review and editing, P.C.-F., M.K.-F., G.H., J.C. and T.F.; visualization, M.K.-F. and G.H.; supervision, J.C., T.F. and J.W.; funding acquisition, J.C., J.W. and T.F. All authors have read and agreed to the published version of the manuscript.

Funding

This research was funded by the Medical University of Silesia in Katowice (PCN-1-026/N/1/0).

Institutional Review Board Statement

The study was conducted in accordance with the Declaration of Helsinki and approved by the Bioethics Committee of the Medical University of Silesia (EC approval no: KNW/0022/KB1/2/15).

Informed Consent Statement

Informed consent was obtained from all subjects involved in the study.

Data Availability Statement

The data presented in this study are available on request from the corresponding author. The data are not publicly available due to subject privacy restrictions.

Conflicts of Interest

The authors declare no conflict of interest.

References

  1. Sung, H.; Ferlay, J.; Siegel, R.L.; Laversanne, M.; Soerjomataram, I.; Jemal, A.; Bray, F. Global Cancer Statistics 2020: GLOBOCAN Estimates of Incidence and Mortality Worldwide for 36 Cancers in 185 Countries. CA Cancer J. Clin. 2021, 71, 209–249. [Google Scholar] [CrossRef] [PubMed]
  2. Carlberg, C.; Velleuer, E. Vitamin D and the risk for cancer: A molecular analysis. Biochem. Pharmacol. 2022, 196, 114735. [Google Scholar] [CrossRef]
  3. Fleet, J.C.; Desmet, M.; Johnson, R.; Li, Y. Vitamin D and cancer: A review of molecular mechanisms. Biochem. J. 2012, 441, 61–76. [Google Scholar] [CrossRef]
  4. Vanhevel, J.; Verlinden, L.; Doms, S.; Wildiers, H.; Verstuyf, A. The role of vitamin D in breast cancer risk and progression. Endocr.-Relat. Cancer 2022, 29, R33–R55. [Google Scholar] [CrossRef] [PubMed]
  5. Amrein, K.; Scherkl, M.; Hoffmann, M.; Neuwersch-Sommeregger, S.; Köstenberger, M.; Tmava Berisha, A.; Martucci, G.; Pilz, S.; Malle, O. Vitamin D deficiency 2.0: An update on the current status worldwide. Eur. J. Clin. Nutr. 2020, 74, 1498–1513. [Google Scholar] [CrossRef] [PubMed]
  6. Zheng, W.; Tayyari, F.; Gowda, G.N.; Raftery, D.; McLamore, E.S.; Shi, J.; Porterfield, D.M.; Donkin, S.S.; Bequette, B.; Teegarden, D. 1,25-Dihydroxyvitamin D regulation of glucose metabolism in Harvey-ras transformed MCF10A human breast epithelial cells. J. Steroid Biochem. Mol. Biol. 2013, 138, 81–89. [Google Scholar] [CrossRef]
  7. McNamara, M.; Rosenberger, K.D. The Significance of Vitamin D Status in Breast Cancer: A State of the Science Review. J. Midwifery Women’s Health 2019, 64, 276–288. [Google Scholar] [CrossRef] [PubMed]
  8. Voutsadakis, I.A. Vitamin D baseline levels at diagnosis of breast cancer: A systematic review and meta-analysis. Hematol. Oncol. Stem Cell Ther. 2020, 14, 16–26. [Google Scholar] [CrossRef]
  9. Tokunaga, E.; Masuda, T.; Ijichi, H.; Tajiri, W.; Koga, C.; Koi, Y.; Nakamura, Y.; Ohno, S.; Taguchi, K.; Okamoto, M. Impact of serum vitamin D on the response and prognosis in breast cancer patients treated with neoadjuvant chemotherapy. Breast Cancer 2022, 29, 156–163. [Google Scholar] [CrossRef]
  10. Bikle, D.D. Vitamin D Metabolism, Mechanism of Action, and Clinical Applications. Chem. Biol. 2014, 21, 319–329. [Google Scholar] [CrossRef]
  11. Jones, K.S.; Assar, S.; Harnpanich, D.; Bouillon, R.; Lambrechts, D.; Prentice, A.; Schoenmakers, I. 25(OH)D2 Half-Life Is Shorter Than 25(OH)D3 Half-Life and Is Influenced by DBP Concentration and Genotype. J. Clin. Endocrinol. Metab. 2014, 99, 3373–3381. [Google Scholar] [CrossRef]
  12. Lee, J.H.; Choi, J.-H.; Kweon, O.J.; Park, A.J. Discrepancy between Vitamin D Total Immunoassays due to Various Cross-reactivities. J. Bone Metab. 2015, 22, 107–112. [Google Scholar] [CrossRef]
  13. Dirks, N.F.; Ackermans, M.T.; Lips, P.; De Jongh, R.T.; Vervloet, M.G.; De Jonge, R.; Heijboer, A.C. The When, What & How of Measuring Vitamin D Metabolism in Clinical Medicine. Nutrients 2018, 10, 482. [Google Scholar] [CrossRef] [PubMed]
  14. Shah, I.; Akhtar, M.K.; Hisaindee, S.; Rauf, M.A.; Sadig, M.; Ashraf, S.S. Clinical diagnostic tools for vitamin D assessment. J. Steroid Biochem. Mol. Biol. 2018, 180, 105–117. [Google Scholar] [CrossRef] [PubMed]
  15. Zelzer, S.; Goessler, W.; Herrmann, M. Measurement of vitamin D metabolites by mass spectrometry, an analytical challenge. J. Lab. Precis. Med. 2018, 3, 99. [Google Scholar] [CrossRef]
  16. Puspitaningtyas, H.; Sulistyoningrum, D.C.; Witaningrum, R.; Widodo, I.; Hardianti, M.S.; Taroeno-Hariadi, K.W.; Kurnianda, J.; Purwanto, I.; Hutajulu, S.H. Vitamin D status in breast cancer cases following chemotherapy: A pre and post observational study in a tertiary hospital in Yogyakarta, Indonesia. PLoS ONE 2022, 17, e0270507. [Google Scholar] [CrossRef]
  17. Hauser, K.; Walsh, D.; Shrotriya, S.; Karafa, M. Low 25-hydroxyvitamin D levels in people with a solid tumor cancer diagnosis: The tip of the iceberg? Support Care Cancer 2014, 22, 1931–1939. [Google Scholar] [CrossRef]
  18. Kailajärvi, M.E.H.; Salminen, E.K.; Paija, O.M.M.; Virtanent, A.M.; Leino, A.E.; Irjala, K.A. Serum bone markers in breast cancer patients during 5-fluorouracil, epirubicin and cyclophosphamide (FEC) therapy. Anticancer Res. 2004, 24, 1271–1274. [Google Scholar]
  19. Hatse, S.; Lambrechts, D.; Verstuyf, A.; Smeets, A.; Brouwers, B.; Vandorpe, T.; Brouckaert, O.; Peuteman, G.; Laenen, A.; Verlinden, L.; et al. Vitamin D status at breast cancer diagnosis: Correlation with tumor characteristics, disease outcome, and genetic determinants of vitamin D insufficiency. Carcinogenesis 2012, 33, 1319–1326. [Google Scholar] [CrossRef]
  20. Janbabai, G.; Shekarriz, R.; Hassanzadeh, H.; Aarabi, M.; Borhani, S.S. A survey on the relationship between serum 25-hydroxy vitamin D level and tumor characteristics in patients with breast cancer. Int. J. Hematol. Stem Cell Res. 2016, 10, 30–36. [Google Scholar]
  21. Imtiaz, S.; Siddiqui, N.; Raza, S.A.; Loya, A.; Muhammad, A. Vitamin D deficiency in newly diagnosed breast cancer patients. Indian J. Endocrinol. Metab. 2012, 16, 409–413. [Google Scholar] [CrossRef] [PubMed]
  22. Al-Zohily, B.; Al-Menhali, A.; Gariballa, S.; Haq, A.; Shah, I. Epimers of Vitamin D: A Review. Int. J. Mol. Sci. 2020, 21, 470. [Google Scholar] [CrossRef] [PubMed]
  23. Nygaard, R.H.; Nielsen, M.C.; Antonsen, K.W.; Højskov, C.S.; Sørensen, B.S.; Møller, H.J. Metabolism of 25-Hydroxy-Vitamin D in Human Macrophages Is Highly Dependent on Macrophage Polarization. Int. J. Mol. Sci. 2022, 23, 10943. [Google Scholar] [CrossRef]
  24. Molnár, F.; Sigüeiro, R.; Sato, Y.; Araujo, C.; Schuster, I.; Antony, P.; Peluso, J.; Muller, C.; Mouriño, A.; Moras, D.; et al. 1α,25(OH)2-3-Epi-Vitamin D3, a Natural Physiological Metabolite of Vitamin D3: Its Synthesis, Biological Activity and Crystal Structure with Its Receptor. PLoS ONE 2011, 6, e18124. [Google Scholar] [CrossRef] [PubMed]
  25. Stepman, H.C.; Vanderroost, A.; Stöckl, D.; Thienpont, L.M. Fullscan mass spectral evidence for 3-epi-25-hydroxyvitamin D3 in serum of infants and adults. Clin. Chem. Lab. Med. 2011, 49, 253–256. [Google Scholar] [CrossRef]
  26. Hu, K.; Callen, D.F.; Li, J.; Zheng, H. Circulating Vitamin D and Overall Survival in Breast Cancer Patients: A Dose-Response Meta-Analysis of Cohort Studies. Integr. Cancer Ther. 2017, 17, 217–225. [Google Scholar] [CrossRef] [PubMed]
  27. Gradishar, W.J.; Anderson, B.O.; Blair, S.L.; Burstein, H.J.; Cyr, A.; Elias, A.D.; Farrar, W.B.; Forero, A.; Giordano, S.H.; Goldstein, L.J.; et al. Breast Cancer Version 3.2014. J. Natl. Compr. Cancer Netw. 2014, 12, 542–590. [Google Scholar] [CrossRef]
  28. Rola, R.; Kowalski, K.; Bieńkowski, T.; Studzińska, S. Improved sample preparation method for fast LC-MS/MS analysis of vitamin D metabolites in serum. J. Pharm. Biomed. Anal. 2020, 190, 113529. [Google Scholar] [CrossRef]
  29. Rola, R.; Kowalski, K.; Bieńkowski, T.; Witwicki, J.; Studzińska, S. Evaluation of different biological matrices to assess the vitamin D status in newborns using LC-MS/MS. Microchem. J. 2021, 168, 106368. [Google Scholar] [CrossRef]
  30. Rusińska, A.; Płudowski, P.; Walczak, M.; Borszewska-Kornacka, M.K.; Bossowski, A.; Chlebna-Sokół, D.; Czech-Kowalska, J.; Dobrzańska, A.; Franek, E.; Helwich, E.; et al. Vitamin D Supplementation Guidelines for General Population and Groups at Risk of Vitamin D Deficiency in Poland-Recommendations of the Polish Society of Pediatric Endocrinology and Diabetes and the Expert Panel with Participation of National Specialist Consultants and Representatives of Scientific Societies-2018 Update. Front. Endocrinol. 2018, 9, 246. [Google Scholar]
  31. Holick, M.F. The vitamin D deficiency pandemic: Approaches for diagnosis, treatment and prevention. Rev. Endocr. Metab. Disord. 2017, 18, 153–165. [Google Scholar] [CrossRef] [PubMed]
  32. Jacot, W.; Pouderoux, S.; Thezenas, S.; Chapelle, A.; Bleuse, J.P.; Romieu, G.; Lamy, P.J. Increased prevalence of vitamin D in-sufficiency in patients with breast cancer after neoadjuvant chemotherapy. Breast Cancer Res. Treat. 2012, 134, 709–717. [Google Scholar] [CrossRef]
  33. Kok, D.E.; van den Berg, M.M.G.A.; Posthuma, L.; van’t Erve, I.; van Duijnhoven, F.J.B.; de Roos, W.K.; Grosfeld, S.; Los, M.; Sommeijer, D.W.; van Laarhoven, H.W.M.; et al. Changes in Circulating Levels of 25-hydroxyvitamin D3 in Breast Cancer Patients Receiving Chemotherapy. Nutr. Cancer 2019, 71, 756–766. [Google Scholar] [CrossRef] [PubMed]
  34. Chen, Y.; Xu, G.; Yang, F. Effect of Neoadjuvant Chemotherapy on the Serum Levels of Bone Turnover Markers in Women with Early-Stage Breast Cancer. PLoS ONE 2015, 10, e0126053. [Google Scholar] [CrossRef] [PubMed]
  35. Pineda-Moncusí, M.; Garcia-Perez, M.A.; Rial, A.; Casamayor, G.; Cos, M.L.; Servitja, S.; Tusquets, I.; Diez-Perez, A.; Cano, A.; Garcia-Giralt, N. Vitamin D levels in Mediterranean breast cancer patients compared with those in healthy women. Maturitas 2018, 116, 83–88. [Google Scholar] [CrossRef]
  36. Gabr, H.M.; Marei, E.S. Vitamin D Level in Breast Cancer Premenopausal Patients before and after Adjuvant Therapy. Egypt. J. Radiat. Sci. Appl. 2017, 30, 85–93. [Google Scholar] [CrossRef]
  37. Peppone, L.J.; Huston, A.J.; Reid, M.E.; Rosier, R.N.; Zakharia, Y.; Trump, D.L.; Mustian, K.M.; Janelsins, M.C.; Purnell, J.Q.; Morrow, G.R. The effect of various vitamin D supple-mentation regimens in breast cancer patients. Breast Cancer Res. Treat. 2011, 127, 171–177. [Google Scholar] [CrossRef]
  38. Alco, G.; Igdem, S.; Dincer, M.; Ozmen, V.; Saglam, S.; Selamoglu, D.; Erdogan, Z.; Ordu, C.; Pilanci, K.N.; Bozdogan, A.; et al. Vitamin D levels in patients with breast cancer: Importance of dressing style. Asian Pac. J. Cancer Prev. 2014, 15, 1357–1362. [Google Scholar] [CrossRef] [PubMed]
  39. Goodwin, P.J.; Ennis, M.; Pritchard, K.I.; Koo, J.; Hood, N. Prognostic Effects of 25-Hydroxyvitamin D Levels in Early Breast Cancer. J. Clin. Oncol. 2009, 27, 3757–3763. [Google Scholar] [CrossRef]
  40. Kim, H.J.; Koh, B.S.; Yu, J.H.; Lee, J.W.; Son, B.H.; Kim, S.B.; Ahn, S.H. Changes in serum hydroxyvitamin D levels of breast cancer patients during tamoxifen treatment or chemotherapy in premenopausal breast cancer patients. Eur. J. Cancer 2014, 50, 1403–1411. [Google Scholar] [CrossRef]
  41. El-Bassiouny, N.A.; Helmy, M.W.; Hassan, M.A.E.; Khedr, G.A. The Cardioprotective Effect of Vitamin D in Breast Cancer Patients Receiving Adjuvant Doxorubicin Based Chemotherapy. Clin. Breast Cancer 2022, 22, 359–366. [Google Scholar] [CrossRef] [PubMed]
  42. Schleicher, R.L.; Sternberg, M.R.; Looker, A.C.; Yetley, E.A.; Lacher, D.A.; Sempos, C.T.; Taylor, C.L.; Durazo-Arvizu, R.A.; Maw, K.L.; Chaudhary-Webb, M.; et al. National Estimates of Serum Total 25-Hydroxyvitamin D and Metabolite Concentrations Measured by Liquid Chromatography-Tandem Mass Spectrome-try in the US Population during 2007–2010. J. Nutr. 2016, 146, 1051–1061. [Google Scholar] [CrossRef] [PubMed]
  43. Lutsey, P.L.; Eckfeldt, J.H.; Ogagarue, E.R.; Folsom, A.R.; Michos, E.D.; Gross, M. The 25-hydroxyvitamin D3 C-3 epimer: Distribution, correlates, and reclassification of 25-hydroxyvitamin D status in the population-based Atherosclerosis Risk in Communities Study (ARIC). Clin. Chim. Acta 2015, 442, 75–81. [Google Scholar] [CrossRef]
  44. Cashman, K.D.; Kinsella, M.; Walton, J.; Flynn, A.; Hayes, A.; Lucey, A.J.; Seamans, K.M.; Kiely, M. The 3 Epimer of 25-Hydroxycholecalciferol Is Present in the Circulation of the Majority of Adults in a Nationally Representative Sample and Has Endogenous Origins. J. Nutr. 2014, 144, 1050–1057. [Google Scholar] [CrossRef]
  45. Robsahm, T.E.; Tretli, S.; Torjesen, P.A.; Babigumira, R.; Schwartz, G.G. Serum 25-hydroxyvitamin D levels predict cancer survival: A prospective cohort with measurements prior to and at the time of cancer diagnosis. Clin. Epidemiol. 2019, 11, 695–705. [Google Scholar] [CrossRef] [PubMed]
  46. Kim, Y.; Je, Y. Vitamin D intake, blood 25(OH)D levels, and breast cancer risk or mortality: A meta-analysis. Br. J. Cancer 2014, 110, 2772–2784. [Google Scholar] [CrossRef]
  47. Villaseñor, A.; Ballard-Barbash, R.; Ambs, A.; Bernstein, L.; Baumgartner, K.; Baumgartner, R.; Ulrich, C.M.; Hollis, B.W.; McTiernan, A.; Neuhouser, M.L. Associations of serum 25-hydroxyvitamin D with overall and breast cancer–specific mortality in a multiethnic cohort of breast cancer survivors. Cancer Causes Control 2013, 24, 759–767. [Google Scholar] [CrossRef]
  48. Vrieling, A.; Hein, R.; Abbas, S.; Schneeweiss, A.; Flesch-Janys, D.; Chang-Claude, J. Serum 25-hydroxyvitamin D and post-menopausal breast cancer survival: A prospective patient cohort study. Breast Cancer Res. 2011, 13, R74. [Google Scholar] [CrossRef]
  49. Yao, S.; Kwan, M.L.; Ergas, I.J.; Roh, J.M.; Cheng, T.-Y.D.; Hong, C.-C.; McCann, S.E.; Tang, L.; Davis, W.; Liu, S.; et al. Association of Serum Level of Vitamin D at Diagnosis with Breast Cancer Survival: A Case-Cohort Analysis in the Pathways Study. JAMA Oncol. 2017, 3, 351–357. [Google Scholar] [CrossRef]
  50. Kanellopoulou, A.; Riza, E.; Samoli, E.; Benetou, V. Dietary Supplement Use after Cancer Diagnosis in Relation to Total Mortality, Cancer Mortality and Recurrence: A Systematic Review and Meta-Analysis. Nutr. Cancer 2020, 73, 16–30. [Google Scholar] [CrossRef]
  51. Madden, J.M.; Murphy, L.; Zgaga, L.; Bennett, K. De novo vitamin D supplement use post-diagnosis is associated with breast cancer survival. Breast Cancer Res. Treat. 2018, 172, 179–190. [Google Scholar] [CrossRef] [PubMed]
Figure 1. The positive correlations between 3-epi-25(OH)D3 and 25(OH)D3 levels in the BC patients at baseline (A), after 3 (B) and 6 (C) months of CTH, and in the control group (D); rs—Spearman’s rank correlation coefficient, solid line represents the regression line, dashed lines represent the 95% CI.
Metabolites 13 00996 g001
Figure 2. The positive correlations between 24,25(OH)2D3 and 25(OH)D3 levels in the BC patients at baseline (A), after 3 (B) and 6 (C) months of CTH, and in the control group (D); rs—Spearman’s rank correlation coefficient, solid line represents the regression line, dashed lines represent the 95% CI.
Metabolites 13 00996 g002
Figure 3. The positive correlations between 3-epi-25(OH)D3 and 25(OH)D levels in the BC patients at baseline (A), after 3 (B) and 6 (C) months of CTH, and in the control group (D); rs—Spearman’s rank correlation coefficient, solid line represents the regression line, dashed lines represent the 95% CI.
Metabolites 13 00996 g003
Figure 4. The positive correlations between 24,25(OH)2D3 and 25(OH)D levels in the BC patients at baseline (A), after 3 (B) and 6 (C) months of CTH and in the control group (D); rs—Spearman’s rank correlation coefficient, solid line represents the regression line, dashed lines represent the 95% CI.
Metabolites 13 00996 g004
Figure 5. Kaplan–Meier curves for survival probability of BC patients with 25(OH)D levels (a sum of serum levels of 25(OH)D2 and 25(OH)D3] ≤ 20 ng/mL and > 20 ng/mL at baseline (log-rank test, HR = 2.44 (95% CI 1.07–5.59) p = 0.026).
Metabolites 13 00996 g005
Table 1. Characteristics of the study group with stratification according to Vitamin D status.
ParameterBC Patients
N = 98
25(OH)D ≤ 20 ng/mL
N = 55
25(OH)D > 20 ng/mL
N = 43
p-Value 4
Age [years]58.4 ± 11.058.1 ± 12.058.9 ± 9.80.72 1
Body mass index [kg/m2]26.7 (24.5–29.9)26.4 (24.3–30.1)27.0 (24.6–29.9)0.77 2
Clinical stage: 0.06 3
I14 (14%)11 (20%)3 (7%)
II44 (45%)18 (33%)26 (60%)
III29 (30%)18 (33%)11 (26%)
IV8 (8%)5 (9%)3 (7%)
n/a2 (2%)2 (4%)0 (0%)
Histological subtype: 0.30 3
NST74 (76%)41 (76%)33 (77%)
lobular17 (18%)8 (15%)9 (21%)
others6 (6%)5 (9%)1 (2%)
Biological subtype: 0.43 3
luminal A19 (20%)7 (13%)12 (28%)
luminal B33 (34%)20 (37%)13 (30%)
luminal B HER2 positive16 (16%)9 (17%)7 (16%)
non-luminal HER2 positive13 (13%)8 (15%)5 (12%)
triple negative16 (16%)10 (19%)6 (14%)
Chemotherapy: 0.25 3
neoadjuvant23 (24%)12 (23%)11 (26%)
adjuvant41 (43%)20 (38%)21 (50%)
palliative31 (33%)21 (40%)10 (24%)
Data presented as mean values ± SD or median (1–3Q). 1 Student’s t-test; 2 Mann–Whitney U test; 3 chi-square test; 4 Student’s t-test, Mann–Whitney U test, chi-square test analyses performed for comparison between 25(OH)D ≤ 20 ng/mL and 25(OH)D > 20 ng/mL groups; NST—invasive carcinoma of no special type.
Table 2. Results of 25(OH)D status (sum of 25(OH)D2 and 25(OH)D3 concentrations), 25(OH)D2, 25(OH)D3, 24,25(OH)2D3 and 3-epi-25(OH)D3 serum levels in the BC patients at baseline and after 3 and 6 months of CTH compared to the control group. Kruskall–Wallis test was non-significant for comparison among all tested groups (control group, baseline, 3 months, 6 months, (p > 0.05). p values were calculated for each group: baseline, after 3 and 6 months vs. control group. Chi-square test was significant for comparisons among each group (baseline, 3 and 6 months) vs. the control group.
Vitamin D Status (25(OH)D [ng/mL])Control Group
N (%)
Breast Cancer Patient Group N (%)
Baselinep-Value 1after 3 Monthsp-Value 1after 6 Monthsp-Value 1
Severe deficiency (≤10) 2 (4.7%)12 (12.2%)0.0415 (18.5%)0.0315 (21.4%)0.002
Deficiency (10–20)14 (32.5%)43 (43.9%)33 (40.7%)27 (38.6%)
Insufficiency (20–30)20 (46.5%)23 (23.5%)19 (23.5%)11 (15.7%)
Sufficiency (>30)7 (16.3%)20 (20.4%)14 (17.3%)17 (24.3%)
Vitamin D and Vitamin D Metabolites [ng/mL] 2Control GroupBreast Cancer Patient Group
Baselineafter 3 Monthsafter 6 Months
25(OH)D 21.45 (17.23–25.94)18.91 (13.07–26.60)17.85 (12.66–27.11)16.63 (11.00–29.91)
25(OH)D2 0.44 (0.29–0.70)0.44 (0.29–0.71)0.42 (0.27–0.63)0.38 (0.26–0.59)
25(OH)D3 21.08 (16.90–25.10)18.31 (12.69–26.34)17.39 (12.23–26.92)16.30 (9.84–29.64)
24,25(OH)2D3 1.47 (0.96–2.12)1.18 (0.57–1.88)1.02 (0.51–1.56)0.89 (0.44–1.81)
3-epi-25(OH)D30.92 (0.59–1.27)0.71 (0.48–1.14)0.74 (0.45–1.29)0.65 (0.40–1.25)
1 chi-square test, 2 data presented as medians with 25th and 75th percentiles.
Disclaimer/Publisher’s Note: The statements, opinions and data contained in all publications are solely those of the individual author(s) and contributor(s) and not of MDPI and/or the editor(s). MDPI and/or the editor(s) disclaim responsibility for any injury to people or property resulting from any ideas, methods, instructions or products referred to in the content.

