
Antioxidative Stress Metabolic Pathways in Moderately Active Individuals

 , , , ,
Abstract
:1. Introduction
2. Materials and Methods
2.1. Data Source and Study Participants
2.2. Metabolomics
2.3. Statistical Analysis
3. Results
3.1. Comparing the Effect of Physical Activity on Clinical Metabolic Traits
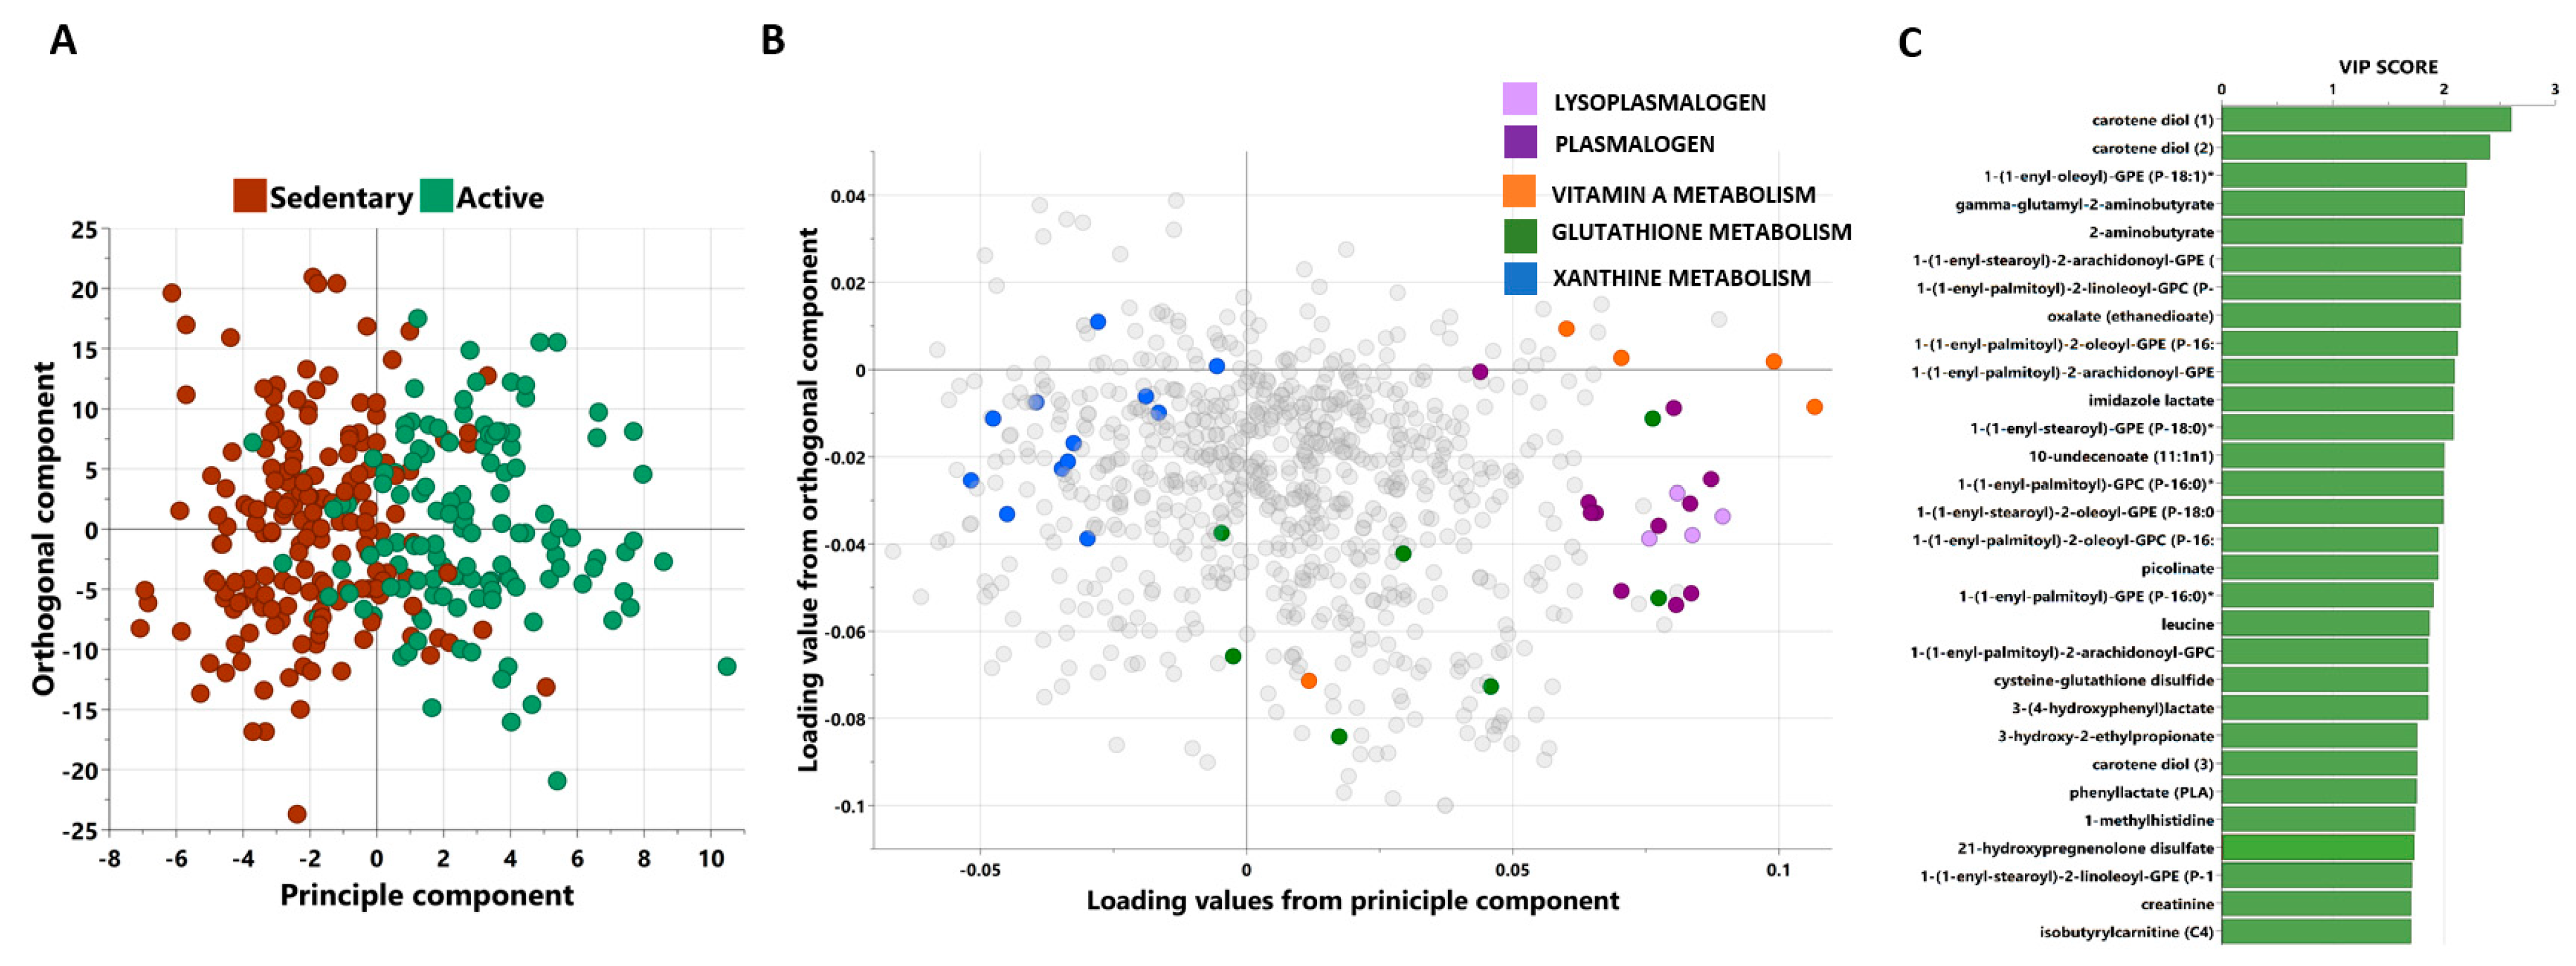
3.2. Multivariate Analysis of Metabolites Differentiating between Active and Sedentary Individuals
3.3. Univariate Analysis of Metabolites Differentiating between Moderately Active and Sedentary Individuals
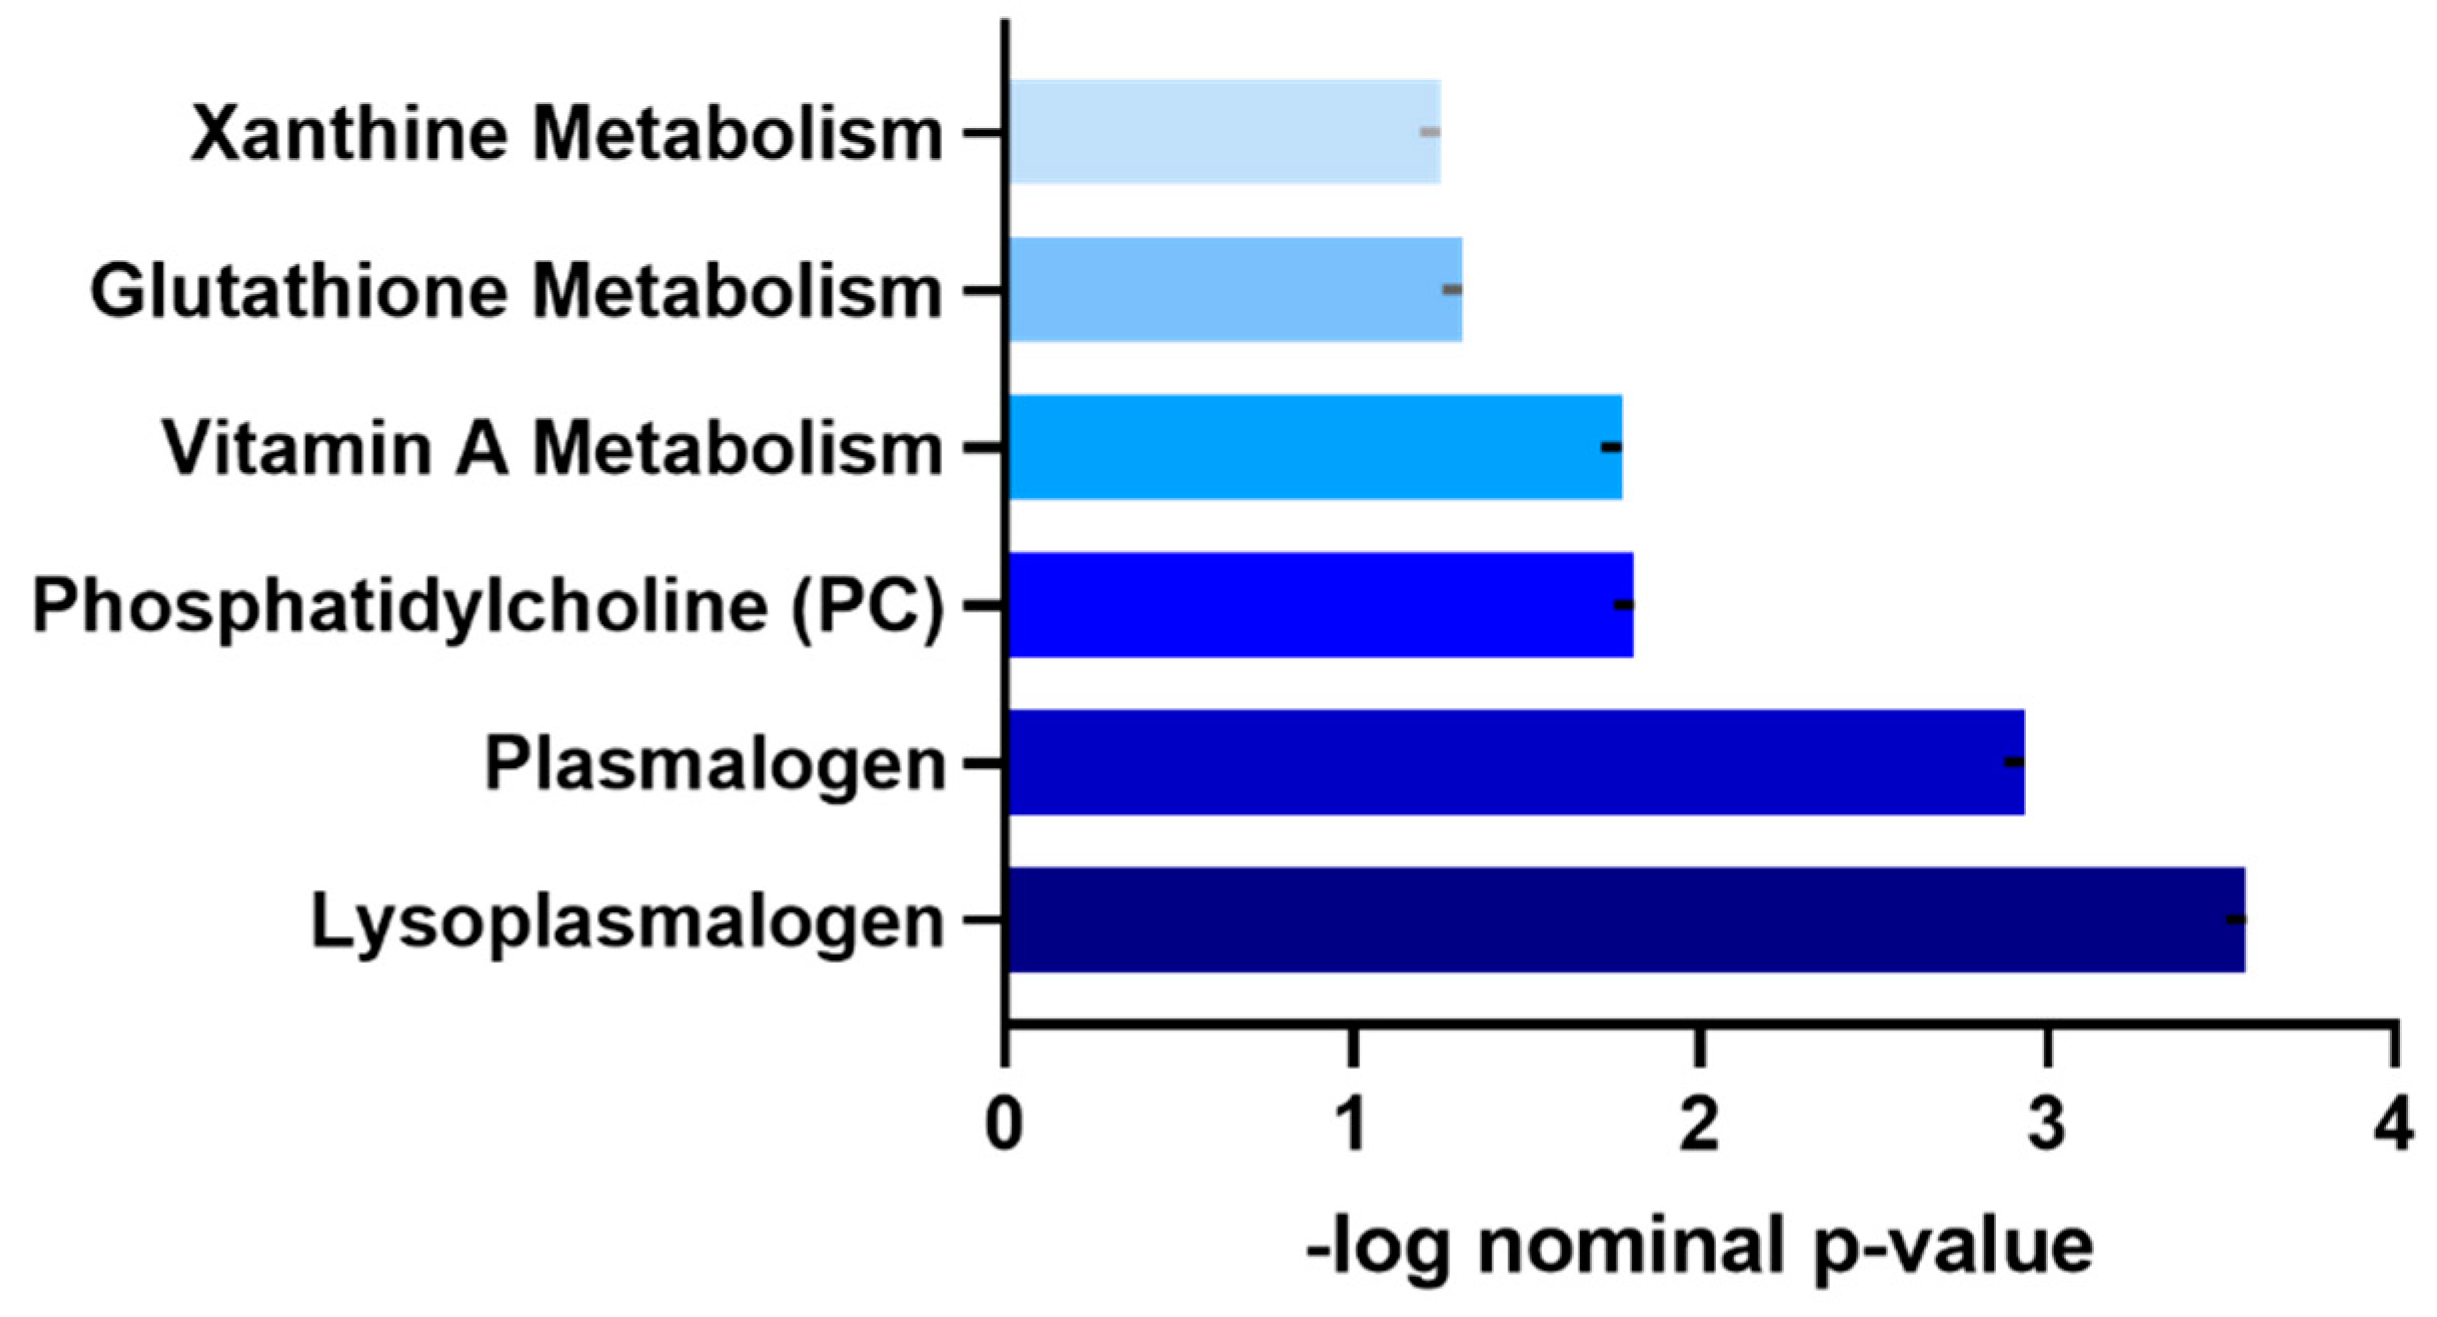
3.4. Functional Enrichment Analysis of Metabolites Differentiating Moderately Active and Sedentary Non-Obese Individuals
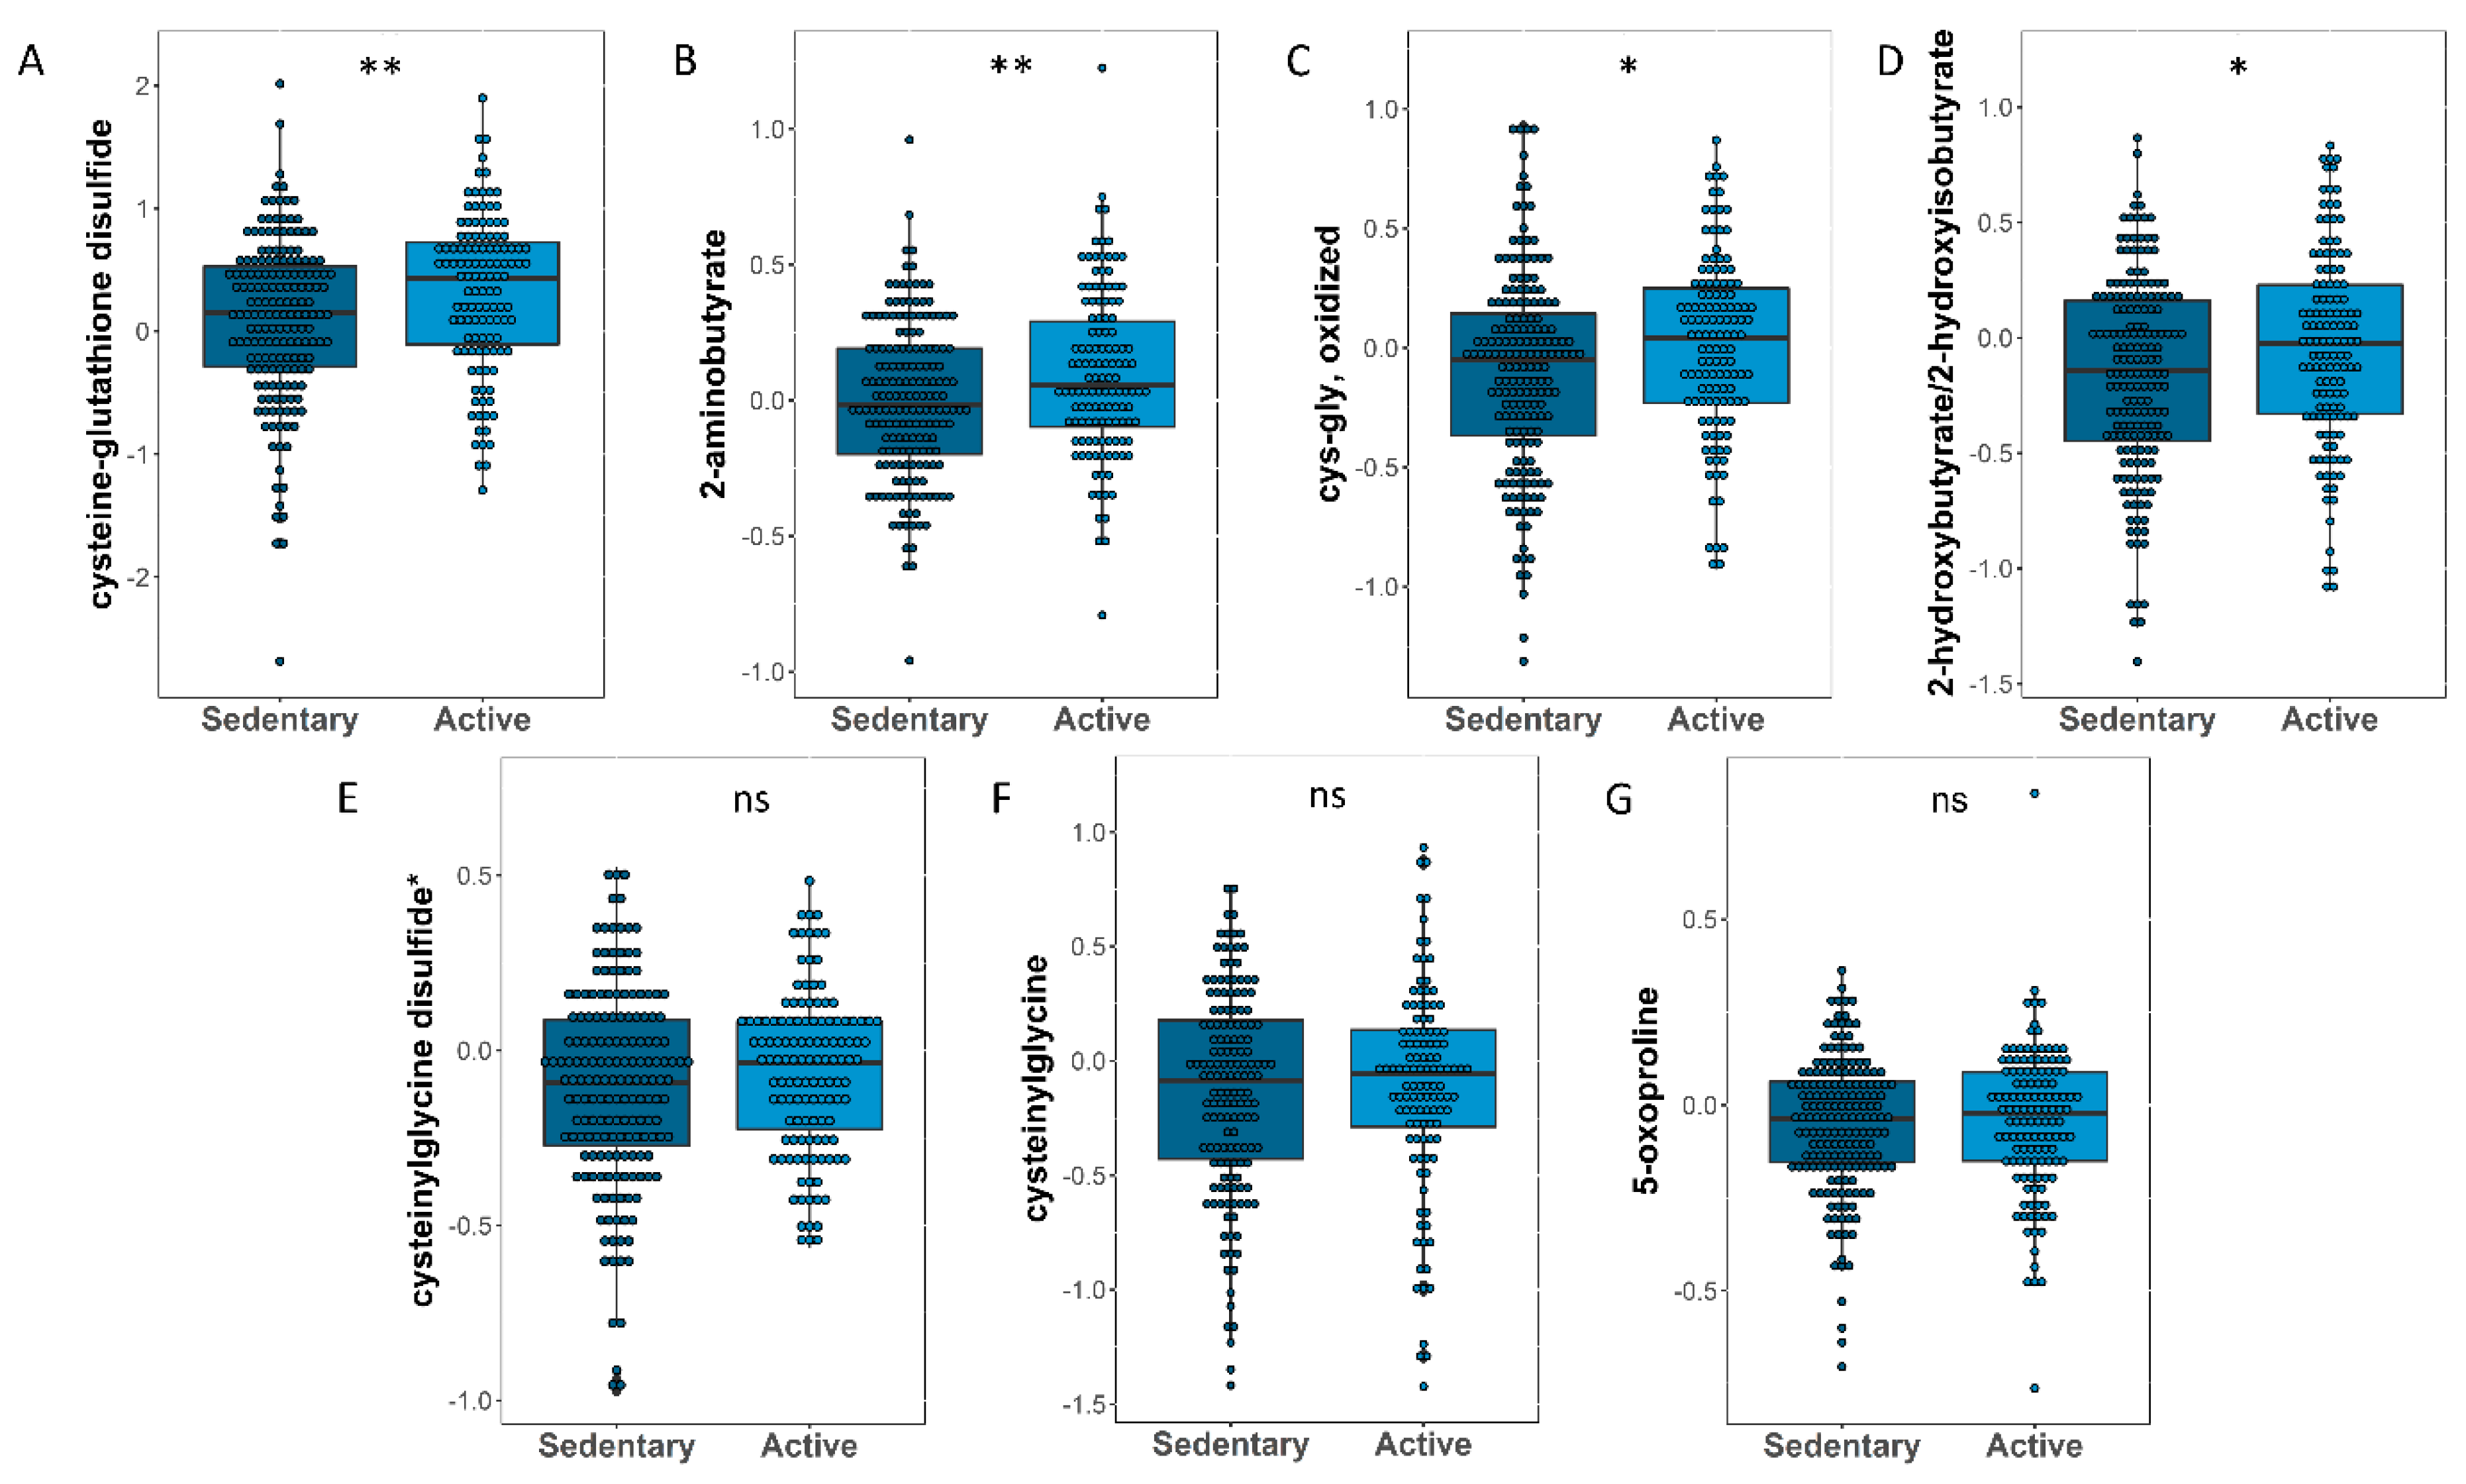
3.5. Identifying Oxidative Stress-Related Metabolites That Significantly Changed between Sedentary and Active Participants
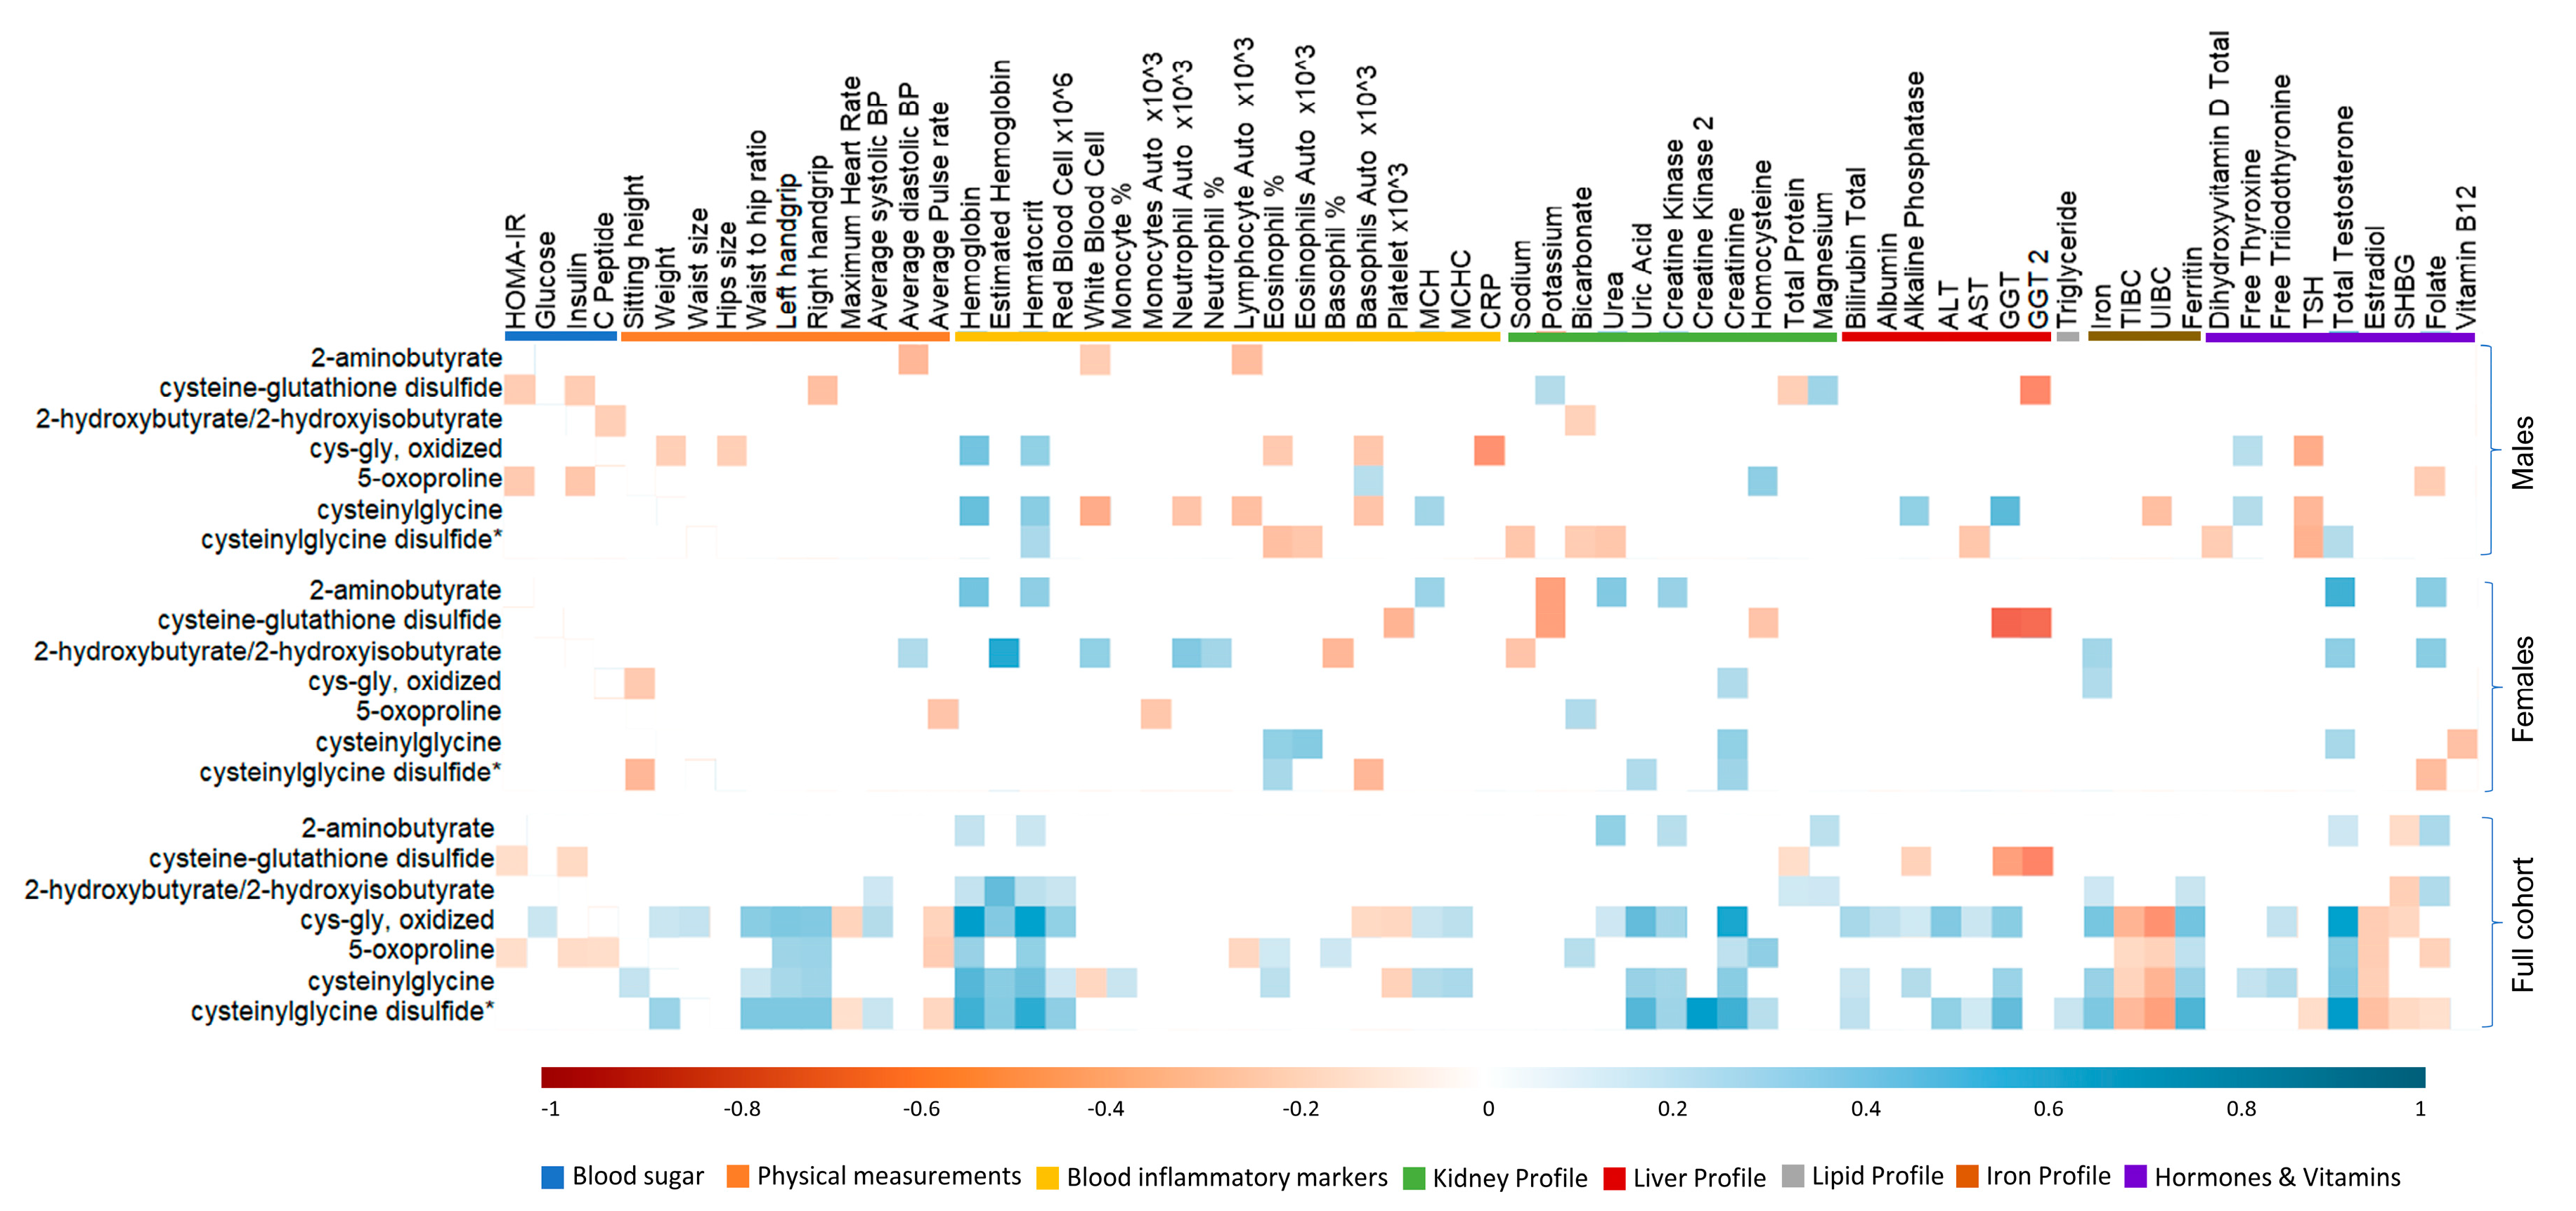
3.6. Association between Antioxidant Response and Clinical Traits in Active Individuals
4. Discussion
5. Conclusions
Author Contributions
Funding
Institutional Review Board Statement
Informed Consent Statement
Data Availability Statement
Acknowledgments
Conflicts of Interest
Appendix A

| Males | Females | |||||
|---|---|---|---|---|---|---|
| Clinical Traits | Sedentary (89) | Moderately Active (70) | Sedentary (88) | Moderately Active (58) | ||
| HOMA-IR (categorical) | ||||||
| <1.85 | 56 | 44 | 0.993 | 54 | 34 | 0.740 |
| >1.85 | 33 | 26 | 34 | 24 | ||
| Vital signs | ||||||
| Age | 26 (24–28) | 26 (24–28) | 0.807 | 26 (23–28) | 25 (23–28) | 0.586 |
| BMI | 25.33 (23.05–27.28) | 25.5 (23.65–27.39) | 0.381 | 23.8 (22.25–26.145) | 24.235 (21.99–27.41) | 0.507 |
| Average systolic BP | 112 (106–119) | 113 (106–119) | 0.718 | 98 (93.75–104) | 101 (97–106) | 0.031 |
| Average diastolic BP | 71 (65–76) | 69 (62.5–75) | 0.167 | 66 (62–70) | 66.5 (61.25–71) | 0.911 |
| Average pulse rate | 66 (61–73) | 64 (59–71.75) | 0.258 | 71 (67–77.25) | 70 (63.25–76) | 0.165 |
| Blood sugar | ||||||
| Fasting time (minutes) | 139 (74–259) | 209 (100–635 | 0.027 | 168 (94–569.75) | 174 (76.5–593.25) | 0.940 |
| Glucose (mmol/L) | 5 (4.7–5.4) | 4.9 (4.7–5.2) | 0.213 | 4.7 (4.5–5) | 4.8 (4.5–5.065) | 0.994 |
| Hb A1c | 5.2 (5.1–5.4) | 5.3 (5.1–5.4) | 0.638 | 5.2 (5–5.4) | 5.2 (5–5.4) | 0.335 |
| Insulin (Uu/mL) | 10 (6.4–16.775) | 7 (5.47–11.87) | 0.015 | 7.5 (6–10.15) | 8 (6–11) | 0.903 |
| HOMA-IR (continuous) | 2.195 (1.39–3.735) | 1.585 (1.11–2.73) | 0.011 | 1.59 (1.215–2.28) | 1.76 (1.195–2.43) | 0.936 |
| C-Peptide ng mL | 2.13 (1.57–3.39) | 1.78 (1.34–2.79) | 0.043 | 1.65 (1.39–2.42) | 1.7 (1.36–2.495) | 0.723 |
| Physical tests | ||||||
| Sitting height (cm) | 91.4 (88.3–96.5) | 91.95 (88.27–136.12) | 0.898 | 89.2 (84–134.65) | 85.6 (82.875–133.575) | 0.163 |
| Weight (kg) | 75.7 (68.6–82.7) | 76.3 (69.175–83.625) | 0.537 | 60.6 (57.7–66.225) | 61.3 (56.55–70.825) | 0.722 |
| Waist size (cm) | 87 (79–90) | 83.5 (79–89) | 0.416 | 73 (69–77) | 74 (69–79) | 0.319 |
| Hip size (cm) | 99 (96–104) | 101 (96–105) | 0.491 | 101 (97–106) | 103 (97–107) | 0.805 |
| Waist to hip ratio | 0.847 (0.8–0.89) | 0.84 (0.795–0.865) | 0.211 | 0.725 (0.68–0.75) | 0.72 (0.70–0.77) | 0.331 |
| Handgrip (left) | 38 (34–44) | 43.5 (36.25–48) | 0.007 | 22 (18–24) | 22 (18–28) | 0.200 |
| Handgrip (right) | 40 (36–46) | 46.5 (39.25–50) | 0.002 | 22.5 (20–28) | 26 (20.25–28) | 0.092 |
| Maximum heart rate (beats/min) | 118.5 (108–128) | 114 (106–125) | 0.292 | 139 (129–150) | 131 (120–139) | 0.001 |
| Run time (seconds) | 764 (742–764) | 764 (742–764) | 0.795 | 743 (684–764) | 743 (684–764) | 0.912 |
| Blood inflammatory markers | ||||||
| Hemoglobin (g/dL) | 15 (14.4–15.7) | 14.9 (14.5–15.6) | 0.616 | 12.4 (11.15–13.25) | 12.45 (11.8–13) | 0.516 |
| Estimated hemoglobin * | 19.65 (18.22–20.295) | 18.9 (17.65–20.54) | 0.394 | 16. 7 (3.8) | 16.98 (15.36–21.02) | 0.078 |
| Hematocrit % | 44.5 (42.7–46.5) | 44.7 (43–46.3) | 0.413 | 37.9 (34.85–39.85) | 37.65 (36.025–39.55) | 0.356 |
| Red Blood Cell × 106 µL | 5.2 (5–5.6) | 5.3 (5–5.5) | 0.898 | 4.5 (4.3–4.8) | 4.5 (4.225–4.9) | 0.780 |
| White Blood Cell (×103 µL) | 5.8 (4.9–7) | 6.3 (5.5–7.4) | 0.128 | 6.8 (5.75–7.95) | 6.75 (5.425–7.9) | 0.430 |
| Monocyte auto % | 8.1 (6.8–9.5) | 7.6 (6.4–8.8) | 0.129 | 6.4 (5.6–7.95) | 7 (5.525–7.675) | 0.678 |
| Monocytes Auto (×103 µL) | 0.5 (0.4–0.6) | 0.5 (0.4–0.6) | 0.981 | 0.4 (0.4–0.6) | 0.4 (0.4–0.5) | 0.661 |
| Neutrophil Auto (×103 µL) | 3 (2.5–3.9) | 3.3 (2.7–4.1) | 0.193 | 4 (3.15–4.9) | 3.4 (2.825–4.4) | 0.084 |
| Neutrophil auto % | 51.3 (46.2–58.5) | 53.4 (9.64) | 0.347 | 57.2 (8.42) | 54.5 (10.26) | 0.034 |
| Lymphocyte Auto (×103 µL) | 2.2 (1.7–2.6) | 2.2 (1.9–2.4) | 0.936 | 2.2 (1.85–2.65) | 2.3 (1.925–2.8) | 0.366 |
| Lymphocyte auto % | 36.4 (30.7–40.7) | 34.8 (31.3–40.8) | 0.276 | 32.5 (28.6–36.7) | 35.85 (31.1–42.475) | 0.016 |
| Eosinophil auto % | 2.9 (1.7–3.6) | 2.9 (1.6–4.3) | 0.671 | 1.7 (1–2.7) | 1.8 (1.125–2.85) | 0.601 |
| Eosinophils Auto (×103 µL) | 0.2 (0.1–0.2) | 0.2 (0.1–0.3) | 0.793 | 0.1 (0.1–0.2) | 0.1 (0.1–0.2) | 0.825 |
| Basophil auto % | 0.6 (0.4–0.8) | 0.6 (0.4–0.7) | 0.318 | 0.7 (0.45–0.8) | 0.5 (0.3–0.8) | 0.023 |
| Basophils Auto (×10 µL) | 0 (0–0.1) | 0 (0–0) | 0.317 | 0 (0–0.1) | 0 (0–0.0325) | 0.216 |
| Platelet (×103 µL) | 211 (180–259.75) | 220 (197–254) | 0.356 | 268.5 (233–302.75) | 254.5 (218.5–297.75) | 0.308 |
| Mean Cell Hemoglobin (pg) | 28.9 (27.2–29.9) | 28.5 (26.7–29.9) | 0.813 | 27.8 (24.8–29.45) | 27.65 (25.725–29.2) | 0.974 |
| Mean Cell Hemoglobin Concentration (g/dL) | 33.8 (33.2–34.5) | 33.5 (32.9–34) | 0.007 | 33 (32.2–33.6) | 32.8 (32.325–33.475) | 0.546 |
| C Reactive Protein (mg/L) | 5 (5–5) | 5 (5–5) | 0.900 | 5 (5–5) | 5 (5–5) | 0.990 |
| Kidney profile | ||||||
| Sodium (mmol/L) | 141 (140–142) | 141 (140–142) | 0.678 | 139 (138–141) | 140 (139–141) | 0.098 |
| Potassium (mmol/L) | 4.3 (4.1–4.4) | 4.3 (4.2–4.5) | 0.058 | 4.25 (4–4.425) | 4.2 (4–4.4) | 0.594 |
| Chloride (mmol/L) | 101 (100–102) | 101 (99.25–102) | 0.757 | 101 (100–103) | 101 (100–102) | 0.897 |
| Bicarbonate (mmol/L) | 27 (26–28) | 27.5 (26–28) | 0.106 | 26 (24–27) | 25 (24–27) | 0.775 |
| Urea (mmol/L) | 4.6 (4–5.2) | 4.8 (3.95–5.4) | 0.424 | 3.6 (2.975–4.3) | 3.7 (3–4.875) | 0.655 |
| Creatinine (mmol/L) | 77 (71–83) | 77.5 (72–85.5) | 0.238 | 55 (51–61) | 54 (49.5–60) | 0.424 |
| Calcium (mmol/L) | 2.42 (0.07) | 2.41 (0.06) | 0.730 | 2.37 (0.07) | 2.39 (0.07) | 0.113 |
| Calcium Corrected (mmol/L) | 2.27 (0.07) | 2.27 (0.07) | 0.932 | 2.27 (0.06) | 2.27 (0.06) | 0.441 |
| Phosphorus (mmol/L) | 1.15 (1.18) | 1.18 (0.17) | 0.319 | 1.18 (0.16) | 1.20 (0.13) | 0.447 |
| Uric Acid (µmol/L) | 333 (301–369) | 338.5 (308.25–380.75) | 0.714 | 230 (199–254.5) | 238.5 (202–267) | 0.459 |
| Creatine kinase | 113 (78–171.5) | 121 (95.5–255) | 0.036 | 60 (48.5–81.5) | 66.5 (53.25–85.75) | 0.291 |
| Creatine Kinase_1 (ng/mL) | 1.65 (1.1025–1.865) | 1.385 (1.125–1.6625) | 0.725 | 1.02 (0.6075–1.395) | 0.89 (0.525–1.1425) | 0.577 |
| Creatine kinase_2 (u/L) | 112 (72.75–155.5) | 161 (115–255) | 0.151 | 58 (53.5–80.5) | 67 (51.25–83.5) | 0.805 |
| Magnesium (µmol/L) | 0.835 (0.05) | 0.83 (0.04) | 0.655 | 0.836 (0.05) | 0.82 (0.05) | 0.451 |
| Homocysteine (µmol/L) | 8.95 (7.78–11.025) | 9.1 (7.55–10.75) | 0.689 | 7.5 (5.9–8.95) | 7.55 (6.075–9.7) | 0.546 |
| Total Protein (g/L) | 74 (71–76) | 74 (71–76) | 0.442 | 73 (70–75.25) | 74.5 (72–77) | 0.024 |
| Liver profile | ||||||
| Total bilirubin (µmol/L) | 8 (5.85–10) | 7.5 (5.7–12) | 0.532 | 6.05 (4.075–8) | 5.7 (4.2–7.4) | 0.344 |
| Albumin (g/L) | 47 (46–49) | 47 (46–49) | 0.689 | 45 (44–47) | 46 (45–47) | 0.131 |
| Alkaline phosphatase (u/L) | 70 (60–79) | 64.5 (55.25–77.5) | 0.061 | 59.5 (51–69) | 59.5 (48.75–71.75) | 0.916 |
| Alanine transaminase (u/L) | 24 (18–38) | 22 (17–34) | 0.419 | 13 (9.75–17) | 12.5 (11–16.75) | 0.744 |
| Aspartate aminotransferase (u/L) | 19 (16–23) | 21 (17–26) | 0.065 | 16 (13.75–19) | 17 (14.25–19) | 0.169 |
| GGT (u/L) | 20.5 (17–28.75) | 16 (12.5–23.5) | 0.025 | 10 (8–14) | 11 (9–13.25) | 0.951 |
| GGT 2 (u/L) | 24 (16–38) | 17 (13–23) | 0.002 | 14 (11.75–18.5) | 11 (9–17.75) | 0.051 |
| Lipid profile | ||||||
| HDL Cholesterol (mmol/L) | 1.20 (0.31) | 1.29 (0.34) | 0.100 | 1.53 (0.26) | 1.66 (0.35) | 0.018 |
| LDL Cholesterol Calc (mmol/L) | 2.96 (2.475–3.715) | 2.85 (2.085–3.42) | 0.127 | 2.635 (2.06–3) | 2.8 (2.01–3.03) | 0.518 |
| Triglyceride (mmol/L) | 1.12 (0.86–1.5) | 0.98 (0.6225–1.2975) | 0.010 | 0.8 (0.55–1.10) | 0.8 (0.6025–1) | 0.974 |
| Iron profile | ||||||
| Iron (umol/L) | 18 (14.91–21.87) | 16.595 (14.08–20.61) | 0.286 | 12.95 (7.205–17.075) | 12 (8.79–15) | 0.995 |
| TIBC (umol/L) | 55 (51–59.5) | 55 (52.25–60) | 0.491 | 64 (60–73.5) | 61 (57–70) | 0.083 |
| UIBC (umol/L) | 37.25 (32.225–42) | 39 (31.6–45.2) | 0.222 | 50.7 (43–63.5) | 48.9 (42–61.2) | 0.382 |
| Ferritin (µg/L) | 101 (62.5–149) | 105 (57.25–133.75) | 0.653 | 13.5 (7–28.25) | 19 (9–33.75) | 0.200 |
| Hormones | ||||||
| Free Thyroxine (pmol/L) | 13.4 (12.61–14.58) | 13.36 (12.49–14.455) | 0.449 | 13.47 (12.3075–14.7) | 13.35 (12.395–14.44) | 0.994 |
| Free triiodothyronine (nmol/L) | 4.7 (4.4–5.1) | 4.6 (4.34–4.9475) | 0.146 | 4.38 (4–4.85) | 4.4 (3.95–4.8) | 0.733 |
| TSH (mU/L) | 1.43 (0.95–2.14) | 1.22 (0.9925–1.8275) | 0.263 | 1.535 (0.915–2.46) | 1.34 (1.035–1.92) | 0.537 |
| Total Testosterone (nmol/L) | 19.51 (15.56–23.06) | 21.34 (16.99–26.64) | 0.135 | 1.335 (0.935–1.61) | 1.19 (0.9–1.49) | 0.583 |
| Estradiol (pmol/L) | 86 (69.25–113) | 98 (77–121) | 0.107 | 285 (148.75–596) | 246 (165–505) | 0.848 |
| SHBG (nmol/L) | 28.65 (22.15–38.2) | 33 (24–43.1) | 0.180 | 61 (45–102.7) | 64 (45–91) | 0.887 |
| Vitamins | ||||||
| Folate (nmol/L) | 20.49 (8.0) | 21.05 (16.325–26.175) | 0.332 | 25.1 (7.74) | 23.2 (17.1–28.7) | 0.235 |
| Vitamin B12 (pmol/L) | 331.5 (245.25–422.75) | 322 (249–429.5) | 0.927 | 270.5 (216.5–327.5) | 252 (200.5–309) | 0.237 |
| Dihydroxyvitamin D Total (ng/mL) | 14 (12–20) | 14 (12–21.75) | 0.927 | 14 (10–20.5) | 14.5 (10.25–23) | 0.743 |
| Metabolite | Sub-Pathway | Super-Pathway | Estimate | SE | p-Value |
|---|---|---|---|---|---|
| cysteine-glutathione disulfide | Glutathione Metabolism | Amino Acid | 0.23 | 0.08 | 0.003 |
| 2-aminobutyrate | Glutathione Metabolism | Amino Acid | 0.09 | 0.03 | 0.009 |
| cys-gly, oxidized | Glutathione Metabolism | Amino Acid | 0.09 | 0.04 | 0.02 |
| 1-(1-enyl-oleoyl)-GPE (P-18:1) * | Lysoplasmalogen | Lipid | 0.12 | 0.04 | 0.003 |
| 1-(1-enyl-stearoyl)-GPE (P-18:0) * | Lysoplasmalogen | Lipid | 0.11 | 0.04 | 0.007 |
| 1-(1-enyl-palmitoyl)-GPC (P-16:0) * | Lysoplasmalogen | Lipid | 0.08 | 0.03 | 0.01 |
| 1-(1-enyl-palmitoyl)-GPE (P-16:0) * | Lysoplasmalogen | Lipid | 0.09 | 0.04 | 0.019 |
| 1-myristoyl-2-arachidonoyl-GPC (14:0/20:4) * | Phosphatidylcholine (PC) | Lipid | −0.16 | 0.06 | 0.011 |
| 1-palmitoyl-2-dihomo-linolenoyl-GPC (16:0/20:3n3 or 6) * | Phosphatidylcholine (PC) | Lipid | −0.11 | 0.04 | 0.013 |
| 1-myristoyl-2-palmitoyl-GPC (14:0/16:0) | Phosphatidylcholine (PC) | Lipid | −0.15 | 0.06 | 0.018 |
| 1-palmitoyl-2-palmitoleoyl-GPC (16:0/16:1) * | Phosphatidylcholine (PC) | Lipid | −0.11 | 0.05 | 0.021 |
| 1-stearoyl-2-linoleoyl-GPC (18:0/18:2) * | Phosphatidylcholine (PC) | Lipid | −0.05 | 0.02 | 0.038 |
| 1-stearoyl-2-oleoyl-GPC (18:0/18:1) | Phosphatidylcholine (PC) | Lipid | −0.07 | 0.03 | 0.048 |
| 1-(1-enyl-palmitoyl)-2-arachidonoyl-GPC (P-16:0/20:4) * | Plasmalogen | Lipid | 0.08 | 0.03 | 0.009 |
| 1-(1-enyl-palmitoyl)-2-oleoyl-GPC (P-16:0/18:1) * | Plasmalogen | Lipid | 0.08 | 0.03 | 0.013 |
| 1-(1-enyl-palmitoyl)-2-linoleoyl-GPC (P-16:0/18:2) * | Plasmalogen | Lipid | 0.08 | 0.03 | 0.018 |
| 1-(1-enyl-stearoyl)-2-arachidonoyl-GPE (P-18:0/20:4) * | Plasmalogen | Lipid | 0.09 | 0.04 | 0.02 |
| 1-(1-enyl-palmitoyl)-2-arachidonoyl-GPE (P-16:0/20:4) * | Plasmalogen | Lipid | 0.08 | 0.04 | 0.02 |
| 1-(1-enyl-palmitoyl)-2-oleoyl-GPE (P-16:0/18:1) * | Plasmalogen | Lipid | 0.07 | 0.03 | 0.026 |
| carotene diol (2) | Vitamin A Metabolism | Cofactors and Vitamins | 0.17 | 0.05 | 0.001 |
| carotene diol (1) | Vitamin A Metabolism | Cofactors and Vitamins | 0.16 | 0.05 | 0.001 |
| carotene diol (3) | Vitamin A Metabolism | Cofactors and Vitamins | 0.11 | 0.05 | 0.043 |
| paraxanthine | Xanthine Metabolism | Xenobiotics | −0.35 | 0.1 | <0.001 |
| theophylline | Xanthine Metabolism | Xenobiotics | −0.25 | 0.09 | 0.009 |
| 1-methylurate | Xanthine Metabolism | Xenobiotics | −0.2 | 0.1 | 0.035 |
| caffeine | Xanthine Metabolism | Xenobiotics | −0.29 | 0.14 | 0.044 |
References
- Zhang, X.; Cash, R.E.; Bower, J.K.; Focht, B.C.; Paskett, E.D. Physical Activity and Risk of Cardiovascular Disease by Weight Status among U.S Adults. PLoS ONE 2020, 15, e0232893. [Google Scholar] [CrossRef] [PubMed]
- de Oliveira, L.D.S.S.C.B.; Souza, E.C.; Rodrigues, R.A.S.; Fett, C.A.; Piva, A.B. The Effects of Physical Activity on Anxiety, Depression, and Quality of Life in Elderly People Living in the Community. Trends Psychiatry Psychother. 2019, 41, 36–42. [Google Scholar] [CrossRef] [PubMed]
- Morelli, C.; Avolio, E.; Galluccio, A.; Caparello, G.; Manes, E.; Ferraro, S.; De Rose, D.; Santoro, M.; Barone, I.; Catalano, S.; et al. Impact of Vigorous-Intensity Physical Activity on Body Composition Parameters, Lipid Profile Markers, and Irisin Levels in Adolescents: A Cross-Sectional Study. Nutrients 2020, 12, 742. [Google Scholar] [CrossRef]
- Myers, J.; Kokkinos, P.; Nyelin, E. Physical Activity, Cardiorespiratory Fitness, and the Metabolic Syndrome. Nutrients 2019, 11, 1652. [Google Scholar] [CrossRef]
- Yang, D.; Yang, Y.; Li, Y.; Han, R. Physical Exercise as Therapy for Type 2 Diabetes Mellitus: From Mechanism to Orientation. Ann. Nutr. Metab. 2019, 74, 313–321. [Google Scholar] [CrossRef]
- Iaccarino, G.; Franco, D.; Sorriento, D.; Strisciuglio, T.; Barbato, E.; Morisco, C. Modulation of Insulin Sensitivity by Exercise Training: Implications for Cardiovascular Prevention. J. Cardiovasc. Transl. Res. 2020, 14, 256–270. [Google Scholar] [CrossRef]
- Sampath Kumar, A.; Maiya, A.G.; Shastry, B.A.; Vaishali, K.; Ravishankar, N.; Hazari, A.; Gundmi, S.; Jadhav, R. Exercise and Insulin Resistance in Type 2 Diabetes Mellitus: A Systematic Review and Meta-Analysis. Ann. Phys. Rehabil. Med. 2019, 62, 98–103. [Google Scholar] [CrossRef]
- Wadley, A.J.; Chen, Y.-W.; Lip, G.Y.H.; Fisher, J.P.; Aldred, S. Low Volume–High Intensity Interval Exercise Elicits Antioxidant and Anti-Inflammatory Effects in Humans. J. Sports Sci. 2015, 34, 1–9. [Google Scholar] [CrossRef] [PubMed]
- Mullins, A.L.; van Rosendal, S.P.; Briskey, D.R.; Fassett, R.G.; Wilson, G.R.; Coombes, J.S. Variability in Oxidative Stress Biomarkers Following a Maximal Exercise Test. Biomarkers 2013, 18, 446–454. [Google Scholar] [CrossRef]
- Aldred, S. Oxidative and Nitrative Changes Seen in Lipoproteins Following Exercise. Atherosclerosis 2007, 192, 1–8. [Google Scholar] [CrossRef]
- Elosua, R.; Molina, L.; Fito, M.; Arquer, A.; Sanchez-Quesada, J.L.; Covas, M.I.; Ordoñez-Llanos, J.; Marrugat, J. Response of Oxidative Stress Biomarkers to a 16-Week Aerobic Physical Activity Program, and to Acute Physical Activity, in Healthy Young Men and Women. Atherosclerosis 2003, 167, 327–334. [Google Scholar] [CrossRef]
- Powers, S.K.; Deruisseau, K.C.; Quindry, J.; Hamilton, K.L. Dietary Antioxidants and Exercise. J. Sports Sci. 2004, 22, 81–94. [Google Scholar] [CrossRef]
- Schranner, D.; Kastenmüller, G.; Schönfelder, M.; Römisch-Margl, W.; Wackerhage, H. Metabolite Concentration Changes in Humans After a Bout of Exercise: A Systematic Review of Exercise Metabolomics Studies. Sports Med. Open 2020, 6, 11. [Google Scholar] [CrossRef]
- Verri Hernandes, V.; Dordevic, N.; Hantikainen, E.M.; Sigurdsson, B.B.; Smárason, S.V.; Garcia-Larsen, V.; Gögele, M.; Caprioli, G.; Bozzolan, I.; Pramstaller, P.P.; et al. Age, Sex, Body Mass Index, Diet and Menopause Related Metabolites in a Large Homogeneous Alpine Cohort. Metabolites 2022, 12, 205. [Google Scholar] [CrossRef]
- Al-Khelaifi, F.; Diboun, I.; Donati, F.; Botrè, F.; Alsayrafi, M.; Georgakopoulos, C.; Suhre, K.; Yousri, N.A.; Elrayess, M.A. A Pilot Study Comparing the Metabolic Profiles of Elite-Level Athletes from Different Sporting Disciplines. Sports Med. Open 2018, 4, 2. [Google Scholar] [CrossRef]
- Evans, A.M.; Bridgewater, B.R.; Liu, Q.; Mitchell, M.W.; Robinson, R.J.; Dai, H.; Stewart, S.J.; DeHaven, C.D.; Miller, L.A.D. High Resolution Mass Spectrometry Improves Data Quantity and Quality as Compared to Unit Mass Resolution Mass Spectrometry in High-Throughput Profiling Metabolomics. J. Postgenomics Drug Biomark. Dev. 2014, 4, 1. [Google Scholar] [CrossRef]
- Powers, S.K.; Duarte, J.; Kavazis, A.N.; Talbert, E.E. Reactive Oxygen Species Are Signalling Molecules for Skeletal Muscle Adaptation. Exp. Physiol. 2009, 95, 1–9. [Google Scholar] [CrossRef]
- Powers, S.K.; Jackson, M.J. Exercise-Induced Oxidative Stress: Cellular Mechanisms and Impact on Muscle Force Production. Physiol. Rev. 2008, 88, 1243–1276. [Google Scholar] [CrossRef]
- Vinña, J.; Gomez-Cabrera, M.-C.; Lloret, A.; Marquez, R.; Miñana, J.B.; Pallardó, F.V.; Sastre, J. Free Radicals in Exhaustive Physical Exercise: Mechanism of Production, and Protection by Antioxidants. IUBMB Life 2000, 50, 271–277. [Google Scholar] [CrossRef]
- Cooper, C.E.; Vollaard, N.B.J.; Choueiri, T.; Wilson, M.T. Exercise, Free Radicals and Oxidative Stress. Biochem. Soc. Trans. 2002, 30, 280–285. [Google Scholar] [CrossRef]
- Tauler, P.; Aguiló, A.; Gimeno, I.; Guix, P.; Tur, J.A.; Pons, A. Different Effects of Exercise Tests on the Antioxidant Enzyme Activities in Lymphocytes and Neutrophils. J. Nutr. Biochem. 2004, 15, 479–484. [Google Scholar] [CrossRef]
- Cipryan, L. The Effect of Fitness Level on Cardiac Autonomic Regulation, IL-6, Total Antioxidant Capacity, and Muscle Damage Responses to a Single Bout of High-Intensity Interval Training. J. Sport Health Sci. 2018, 7, 363–371. [Google Scholar] [CrossRef]
- Varamenti, E.; Tod, D.; Pullinger, S.A. Redox Homeostasis and Inflammation Responses to Training in Adolescent Athletes: A Systematic Review and Meta-Analysis. Sports Med. Open 2020, 6, 34. [Google Scholar] [CrossRef]
- Batista, D.F.; Polegato, B.F.; da Silva, R.C.; Claro, R.T.; Azevedo, P.S.; Fernandes, A.A.; Okoshi, K.; de Paiva, S.A.R.; Minicucci, M.F.; Zornorff, L.A.M. Impact of Modality and Intensity of Early Exercise Training on Ventricular Remodeling after Myocardial Infarction. Oxidative Med. Cell. Longev. 2020, 2020, 5041791. [Google Scholar] [CrossRef]
- Chevion, S.; Moran, D.S.; Heled, Y.; Shani, Y.; Regev, G.; Abbou, B.; Berenshtein, E.; Stadtman, E.R.; Epstein, Y. Plasma Antioxidant Status and Cell Injury after Severe Physical Exercise. Proc. Natl. Acad. Sci. USA 2003, 100, 5119–5123. [Google Scholar] [CrossRef]
- Palazzetti, S.; Richard, M.-J.; Favier, A.; Margaritis, I. Overloaded Training Increases Exercise-Induced Oxidative Stress and Damage. Can. J. Appl. Physiol. 2003, 28, 588–604. [Google Scholar] [CrossRef]
- Hendrix, J.; Nijs, J.; Ickmans, K.; Godderis, L.; Ghosh, M.; Polli, A. The Interplay between Oxidative Stress, Exercise, and Pain in Health and Disease: Potential Role of Autonomic Regulation and Epigenetic Mechanisms. Antioxidants 2020, 9, 1166. [Google Scholar] [CrossRef]
- Accattato, F.; Greco, M.; Pullano, S.A.; Carè, I.; Fiorillo, A.S.; Pujia, A.; Montalcini, T.; Foti, D.P.; Brunetti, A.; Gulletta, E. Effects of Acute Physical Exercise on Oxidative Stress and Inflammatory Status in Young, Sedentary Obese Subjects. PLoS ONE 2017, 12, e0178900. [Google Scholar] [CrossRef]
- Dorninger, F.; Werner, E.R.; Berger, J.; Watschinger, K. Regulation of Plasmalogen Metabolism and Traffic in Mammals: The Fog Begins to Lift. Front. Cell Dev. Biol. 2022, 10, 946393. [Google Scholar] [CrossRef]
- Paul, S.; Lancaster, G.I.; Meikle, P.J. Plasmalogens: A Potential Therapeutic Target for Neurodegenerative and Cardiometabolic Disease. Prog. Lipid Res. 2019, 74, 186–195. [Google Scholar] [CrossRef]
- Astudillo, A.M.; Balboa, M.A.; Balsinde, J. Compartmentalized Regulation of Lipid Signaling in Oxidative Stress and Inflammation: Plasmalogens, Oxidized Lipids and Ferroptosis as New Paradigms of Bioactive Lipid Research. Prog. Lipid Res. 2023, 89, 101207. [Google Scholar] [CrossRef] [PubMed]
- Stadelmann-Ingrand, S.; Favreliere, S.; Fauconneau, B.; Mauco, G.; Tallineau, C. Plasmalogen Degradation by Oxidative Stress: Production and Disappearance of Specific Fatty Aldehydes and Fatty α-Hydroxyaldehydes. Free Radic. Biol. Med. 2001, 31, 1263–1271. [Google Scholar] [CrossRef] [PubMed]
- Wu, L.-C.; Pfeiffer, D.R.; Calhoon, E.A.; Madiai, F.; Marcucci, G.; Liu, S.; Jurkowitz, M.S. Purification, Identification, and Cloning of Lysoplasmalogenase, the Enzyme That Catalyzes Hydrolysis of the Vinyl Ether Bond of Lysoplasmalogen. J. Biol. Chem. 2011, 286, 24916–24930. [Google Scholar] [CrossRef] [PubMed]
- Olubukola Sinbad, O.; Folorunsho, A.A.; Olabisi, O.L.; Abimbola Ayoola, O.; Johnson Temitope, E. Vitamins as Antioxidants. J. Food Sci. Nutr. Res. 2019, 2, 214–235. [Google Scholar] [CrossRef]
- Carlsson, E.R.; Allin, K.H.; Madsbad, S.; Fenger, M. Phosphatidylcholine and Its Relation to Apolipoproteins A-1 and B Changes after Roux-En-Y Gastric Bypass: A Cohort Study. Lipids Health Dis. 2019, 18, 169. [Google Scholar] [CrossRef]
- Li, J.; Xin, Y.; Li, J.; Chen, H.; Li, H. Phosphatidylethanolamine N-Methyltransferase: From Functions to Diseases. Aging Dis. 2023, 14, 879. [Google Scholar] [CrossRef]
- Hashioka, S.; Han, Y.-H.; Fujii, S.; Kato, T.; Monji, A.; Utsumi, H.; Sawada, M.; Nakanishi, H.; Kanba, S. Phosphatidylserine and Phosphatidylcholine-Containing Liposomes Inhibit Amyloid β and Interferon-γ-Induced Microglial Activation. Free Radic. Biol. Med. 2007, 42, 945–954. [Google Scholar] [CrossRef]
- Kim, S.T.; Kyung, E.J.; Suh, J.S.; Lee, H.S.; Lee, J.H.; Chae, S.I.; Park, E.S.; Chung, Y.H.; Bae, J.; Lee, T.J.; et al. Phosphatidylcholine Attenuated Docetaxel-Induced Peripheral Neurotoxicity in Rats. Drug Chem. Toxicol. 2017, 41, 476–485. [Google Scholar] [CrossRef]
- Lee, S.; Norheim, F.; Gulseth, H.L.; Langleite, T.M.; Aker, A.; Gundersen, T.E.; Holen, T.; Birkeland, K.I.; Drevon, C.A. Skeletal Muscle Phosphatidylcholine and Phosphatidylethanolamine Respond to Exercise and Influence Insulin Sensitivity in Men. Sci. Rep. 2018, 8, 6531. [Google Scholar] [CrossRef]
- Irato, P.; Santovito, G. Enzymatic and Non-Enzymatic Molecules with Antioxidant Function. Antioxidants 2021, 10, 579. [Google Scholar] [CrossRef]
- Forman, H.J.; Zhang, H.; Rinna, A. Glutathione: Overview of Its Protective Roles, Measurement, and Biosynthesis. Mol. Asp. Med. 2009, 30, 1–12. [Google Scholar] [CrossRef]
- Pechlivanis, A.; Papaioannou, K.G.; Tsalis, G.; Saraslanidis, P.; Mougios, V.; Theodoridis, G.A. Monitoring the Response of the Human Urinary Metabolome to Brief Maximal Exercise by a Combination of RP-UPLC-MS and 1H NMR Spectroscopy. J. Proteome Res. 2015, 14, 4610–4622. [Google Scholar] [CrossRef] [PubMed]
- Gomez-Cabrera, M.C.; Carretero, A.; Millan-Domingo, F.; Garcia-Dominguez, E.; Correas, A.G.; Olaso-Gonzalez, G.; Viña, J. Redox-Related Biomarkers in Physical Exercise. Redox Biol. 2021, 42, 101956. [Google Scholar] [CrossRef] [PubMed]
- Waggiallah, H.; Alzohairy, M. The Effect of Oxidative Stress on Human Red Cells Glutathione Peroxidase, Glutathione Reductase Level, and Prevalence of Anemia among Diabetics. N. Am. J. Med. Sci. 2011, 3, 344–347. [Google Scholar] [CrossRef]
- Murphy, W.G. The Sex Difference in Haemoglobin Levels in Adults—Mechanisms, Causes, and Consequences. Blood Rev. 2014, 28, 41–47. [Google Scholar] [CrossRef] [PubMed]
- Creeden, J.F.; Gordon, D.M.; Stec, D.E.; Hinds, T.D. Bilirubin as a Metabolic Hormone: The Physiological Relevance of Low Levels. Am. J. Physiol. -Endocrinol. Metab. 2021, 320, E191–E207. [Google Scholar] [CrossRef]
- Vasavda, C.; Kothari, R.; Malla, A.P.; Tokhunts, R.; Lin, A.; Ji, M.; Ricco, C.; Xu, R.; Saavedra, H.G.; Sbodio, J.I.; et al. Bilirubin Links Heme Metabolism to Neuroprotection by Scavenging Superoxide. Cell Chem. Biol. 2019, 26, 1450–1460.e7. [Google Scholar] [CrossRef]
- Vítek, L.; Tiribelli, C. Bilirubin: The Yellow Hormone? J. Hepatol. 2021, 75, 1485–1490. [Google Scholar] [CrossRef]
- Svensson, M.B.; Ekblom, B.; Cotgreave, I.A.; Norman, B.; Sjöberg, B.; Ekblom, Ö.; Sjödin, B.; Sjödin, A. Adaptive Stress Response of Glutathione and Uric Acid Metabolism in Man Following Controlled Exercise and Diet. Acta Physiol. Scand. 2002, 176, 43–56. [Google Scholar] [CrossRef]
- Wang, Y.; Jia, Y.; Xu, Y.; Liu, X.; Wang, Z.; Liu, Y.; Li, B.; Liu, J. Exploring the Association between Glutathione Metabolism and Ferroptosis in Osteoblasts with Disuse Osteoporosis and the Key Genes Connecting Them. Comput. Math. Methods Med. 2022, 2022, 4914727. [Google Scholar] [CrossRef]

| Clinical Traits | Sedentary (177) | Moderately Active (128) | p Value |
|---|---|---|---|
| HOMA-IR (categorical) | |||
| <1.85 | 87 | 78 | 0.048 |
| >1.85 | 90 | 50 | |
| Gender | |||
| Male | 89 | 70 | 0.486 |
| Female | 88 | 58 | |
| Vital signs | |||
| Age | 26 (23–28) | 26 (24–28) | 0.928 |
| BMI | 24.31 (22.64–26.68) | 24.67 (23.06–27.41) | 0.163 |
| Average systolic BP | 105 (98–112) | 107 (101–115) | 0.090 |
| Average diastolic BP | 68.6 (7.75) | 67.6 (7.45) | 0.250 |
| Average pulse rate | 69 (63–76) | 66.5 (60–73) | 0.051 |
| Blood sugar | |||
| Fasting time (minutes) | 152 (87–365) | 196 (84.5–630.5) | 0.138 |
| Glucose (mmol/L) | 4.8 (4.6–5.2) | 4.9 (4.56–5.2) | 0.525 |
| Hb A1c | 5.2 (5–5.4) | 5.2 (5–5.4) | 0.700 |
| Insulin (Uu/mL) | 8.2 (6–14.5) | 7.5 (5.7–11.825) | 0.067 |
| HOMA-IR (continuous) | 1.88 (1.325–3.165) | 1.6 (1.1425–2.6025) | 0.064 |
| C-Peptide ng mL | 1.84 (1.415–2.97) | 1.74 (1.35–2.51) | 0.087 |
| Physical tests | |||
| Sitting height (cm) | 91.4 (86.65–134.375) | 90.7 (85.5–134.275) | 0.407 |
| Weight (kg) | 67 (59.2–76.5) | 69.95 (61.45–77.325) | 0.219 |
| Waist size (cm) | 78 (72–87) | 79 (73.75–86.25) | 0.404 |
| Hip size (cm) | 100.8 (6.29) | 101 (6.55) | 0.804 |
| Waist to hip ratio | 0.78 (0.08) | 0.79 (0.07) | 0.570 |
| Handgrip (left) | 28 (21–38) | 33 (22–44) | 0.015 |
| Handgrip (right) | 30 (22–40) | 34 (26–48) | 0.007 |
| Maximum heart rate (beats/min) | 128 (114–141) | 120 (109.25–133) | 0.002 |
| Run time (seconds) | 764 (729–764) | 764 (742–764) | 0.953 |
| Blood inflammatory markers | |||
| Hemoglobin (g/dL) | 13.8 (12.4–15) | 13.7 (12.5–15) | 0.644 |
| Estimated hemoglobin | 17.9 (3.86) | 18.6 (3.27) | 0.261 |
| Hematocrit % | 41.05 (37.9–44.5) | 42.1 (38.05–45.05) | 0.245 |
| Red blood cell × 106 µL | 4.9 (4.5–5.3) | 5 (4.5–5.3) | 0.438 |
| White blood cell (×103 µL) | 6.55 (5.3–7.725) | 6.5 (5.5–7.6) | 0.711 |
| Monocyte auto % | 7.2 (6–8.725) | 7.1 (6.2–8.3) | 0.571 |
| Monocytes Auto (×103 µL) | 0.5 (0.4–0.6) | 0.5 (0.4–0.6) | 0.779 |
| Neutrophil Auto (×103 µL) | 3.5 (2.7–4.5) | 3.4 (2.75–4.4) | 0.646 |
| Neutrophil auto % | 54.4 (9.31) | 53.9 (9.91) | 0.654 |
| Lymphocyte Auto (×103 µL) | 2.2 (1.8–2.6) | 2.2 (1.9–2.7) | 0.550 |
| Lymphocyte auto % | 34.9 (7.69) | 35.5 (8.73) | 0.562 |
| Eosinophil auto % | 2.2 (1.5–3.425) | 2.3 (1.35–3.75) | 0.685 |
| Eosinophils Auto (×103 µL) | 0.1 (0.1–0.2) | 0.1 (0.1–0.2) | 0.763 |
| Basophil auto % | 0.6 (0.4–0.8) | 0.6 (0.4–0.7) | 0.019 |
| Basophils Auto (×103 µL) | 0 (0–0.1) | 0 (0–0.01) | 0.105 |
| Platelet (×103 µL) | 238 (201.75–283.25) | 235 (207–269) | 0.599 |
| Mean cell hemoglobin (pg) | 28.3 (26.175–29.7) | 28.2 (26.15–29.5) | 0.947 |
| Mean cell hemoglobin concentration (g/dL) | 33.4 (32.6–34.025) | 33.1 (32.6–33.7) | 0.046 |
| C reactive Protein (mg/L) | 5 (5–5) | 5 (5–5) | 0.852 |
| Kidney profile | |||
| Sodium (mmol/L) | 140 (139–142) | 141 (139–142) | 0.142 |
| Potassium (mmol/L) | 4.3 (4.1–4.4) | 4.3 (4.1–4.5) | 0.341 |
| Chloride (mmol/L) | 101 (100–102) | 101 (100–102) | 0.973 |
| Bicarbonate (mmol/L) | 26 (25–27) | 26 (25–28) | 0.212 |
| Urea (mmol/L) | 4.2 (3.4–4.8) | 4.25 (3.4–5.2) | 0.221 |
| Creatinine (mmol/L) | 65 (55–77) | 68 (54–79) | 0.501 |
| Calcium (mmol/L) | 2.39 (0.08) | 2.4 (0.07) | 0.307 |
| Calcium Corrected (mmol/L) | 2.27 (0.07) | 2.27 (0.06) | 0.557 |
| Phosphorus (mmol/L) | 1.17 (0.17) | 1.19 (0.15) | 0.233 |
| Uric Acid (µmol/L) | 277 (229–335) | 291.5 (238.5–344.25) | 0.291 |
| Creatine kinase | 78.5 (58–116.5) | 91 (66–152) | 0.023 |
| Creatine Kinase-1 (ng/mL) | 1.16 (0.675–1.745) | 1.13 (0.9225–1.495) | 0.941 |
| Creatine kinase-2 (u/L) | 78 (57.5–122) | 82 (59–142.5) | 0.631 |
| Magnesium (umol/L) | 0.835 (0.05) | 0.834 (0.04) | 0.813 |
| Homocysteine (umol/L) | 8.1 (6.35–9.9) | 8.55 (6.6–10.125) | 0.383 |
| Total Protein (g/L) | 74 (71–76) | 74 (72–77) | 0.034 |
| Liver profile | |||
| Total bilirubin (umol/L) | 7 (5–9) | 7 (5–9) | 0.963 |
| Albumin (g/L) | 46 (45–48) | 47 (45–48) | 0.531 |
| Alkaline phosphatase (u/L) | 65 (56–75) | 63 (52–75.25) | 0.241 |
| Alanine transaminase (u/L) | 17 (13–28) | 18 (12–25) | 0.955 |
| Aspartate aminotransferase (u/L) | 17 (15–21) | 18.5 (16–22) | 0.030 |
| GGT (u/L) | 14 (9–21) | 13 (10.25–18.25) | 0.547 |
| GGT 2 (u/L) | 20 (13–33) | 15 (11–22) | 0.002 |
| Lipid profile | |||
| HDL Cholesterol (mmol/L) | 1.36 (0.33) | 1.45 (0.39) | 0.031 |
| LDL cholesterol calc (mmol/L) | 2.8 (2.2175–3.185) | 2.83 (2.0575–3.1025) | 0.560 |
| Triglyceride (mmol/L) | 0.97 (0.7–1.4) | 0.9 (0.6075–1.2) | 0.059 |
| Iron profile | |||
| Iron (µmol/L) | 15.89 (11–19.97) | 15 (10.85–19) | 0.513 |
| Total iron binding capacity (µmol/L) | 60 (53–65) | 58 (54–64.5) | 0.348 |
| Unsaturated iron binding capacity (µmol/L) | 42 (35–51) | 43.15 (36.125–50) | 0.995 |
| Ferritin (µg/L) | 45 (12–106) | 49 (17.75–109.25) | 0.395 |
| Hormones | |||
| Free Thyroxine (pmol/L) | 13.43 (12.54–14.6) | 13.36 (12.48–14.45) | 0.589 |
| Free triiodothyronine (nmol/L) | 4.54 (4.26–5) | 4.5 (4.01–4.88) | 0.312 |
| Thyroid stimulating hormone (mU/L) | 1.46 (0.95–2.26) | 1.305 (0.9975–1.92) | 0.223 |
| Total Testosterone (nmol/L) | 6.5 (1.36–19.51) | 9.115 (1.26–21.69) | 0.294 |
| Estradiol (pmol/L) | 119.5 (82–265.25) | 123.5 (87–236.25) | 0.579 |
| Sex hormone binding globulin (nmol/L) | 40 (26.4–64.8) | 43.05 (28.15–62.62) | 0.718 |
| Vitamins | |||
| Folate (nmol/L) | 22.7 (8.04) | 22.2 (7.66) | 0.565 |
| Vitamin B12 (pmol/L) | 293.5 (226–375.5) | 274.5 (221.25–404.75) | 0.717 |
| Dihydroxyvitamin D Total (ng/mL) | 14 (11–20) | 14 (11–22) | 0.788 |
| Metabolite | Sub-Pathway | Super-Pathway | Estimate | SE | p-Value | fdr |
|---|---|---|---|---|---|---|
| 10-undecenoate (11:1n1) | Medium chain fatty acid | Lipid | 0.22 | 0.06 | 7.61 × 10⁻⁵ | 0.06 |
| imidazole lactate | Histidine metabolism | Amino Acid | 0.12 | 0.03 | 2.04 × 10⁻⁴ | 0.06 |
| 1-palmitoyl-GPA (16:0) | Lysophospholipid | Lipid | −0.24 | 0.07 | 2.58 × 10⁻⁴ | 0.06 |
| paraxanthine | Xanthine metabolism | Xenobiotics | −0.35 | 0.10 | 3.58 × 10⁻⁴ | 0.06 |
| undecenoylcarnitine (C11:1) | Fatty acid metabolism (acyl carnitine, monounsaturated) | Lipid | 0.21 | 0.06 | 3.69 × 10⁻⁴ | 0.06 |
| carotene diol (2) | Vitamin A metabolism | Cofactors and Vitamins | 0.17 | 0.05 | 5.53 × 10⁻⁴ | 0.08 |
| thyroxine | Tyrosine metabolism | Amino acid | −0.11 | 0.03 | 6.31 × 10⁻⁴ | 0.08 |
| fructosyllysine | Lysine metabolism | Amino acid | −0.14 | 0.04 | 7.16 × 10⁻⁴ | 0.08 |
| carotene diol (1) | Vitamin A metabolism | Cofactors and vitamins | 0.16 | 0.05 | 1.04 × 10⁻³ | 0.09 |
| sphingomyelin (d18:2/14:0, d18:1/14:1) * | Sphingomyelins | Lipid | −0.10 | 0.03 | 1.16 × 10⁻³ | 0.09 |
| fructose | Fructose, mannose and galactose metabolism | Carbohydrate | −0.09 | 0.03 | 1.23 × 10⁻³ | 0.09 |
| gamma-glutamyl-2-aminobutyrate | Gamma-glutamyl amino acid | Peptide | 0.14 | 0.04 | 1.52 × 10⁻³ | 0.1 |
| N-acetylproline | Urea cycle; arginine and proline metabolism | Amino Acid | −0.13 | 0.04 | 1.77 × 10⁻³ | 0.1 |
| oxalate (ethanedioate) | Ascorbate and aldarate metabolism | Cofactors and Vitamins | 0.13 | 0.04 | 2.12 × 10⁻³ | 0.1 |
| Glutathione Metabolites | Estimate | SE | p-Value |
|---|---|---|---|
| cysteine-glutathione disulfide | 0.229 | 0.078 | 0.003 |
| 2-aminobutyrate | 0.089 | 0.034 | 0.009 |
| cys-gly, oxidized | 0.091 | 0.039 | 0.020 |
| 2-hydroxybutyrate/2-hydroxyisobutyrate | 0.094 | 0.050 | 0.051 |
| cysteinylglycine disulfide * | 0.026 | 0.025 | 0.296 |
| cysteinylglycine | −0.011 | 0.054 | 0.836 |
| 5-oxoproline | 0.001 | 0.020 | 0.962 |
Disclaimer/Publisher’s Note: The statements, opinions and data contained in all publications are solely those of the individual author(s) and contributor(s) and not of MDPI and/or the editor(s). MDPI and/or the editor(s) disclaim responsibility for any injury to people or property resulting from any ideas, methods, instructions or products referred to in the content. |
© 2023 by the authors. Licensee MDPI, Basel, Switzerland. This article is an open access article distributed under the terms and conditions of the Creative Commons Attribution (CC BY) license (https://creativecommons.org/licenses/by/4.0/).
Share and Cite
Almuraikhy, S.; Anwardeen, N.; Doudin, A.; Sellami, M.; Domling, A.; Agouni, A.; Althani, A.A.; Elrayess, M.A. Antioxidative Stress Metabolic Pathways in Moderately Active Individuals. Metabolites 2023, 13, 973. https://doi.org/10.3390/metabo13090973
Almuraikhy S, Anwardeen N, Doudin A, Sellami M, Domling A, Agouni A, Althani AA, Elrayess MA. Antioxidative Stress Metabolic Pathways in Moderately Active Individuals. Metabolites. 2023; 13(9):973. https://doi.org/10.3390/metabo13090973
Chicago/Turabian StyleAlmuraikhy, Shamma, Najeha Anwardeen, Asmma Doudin, Maha Sellami, Alexander Domling, Abdelali Agouni, Asmaa A. Althani, and Mohamed A. Elrayess. 2023. "Antioxidative Stress Metabolic Pathways in Moderately Active Individuals" Metabolites 13, no. 9: 973. https://doi.org/10.3390/metabo13090973
APA StyleAlmuraikhy, S., Anwardeen, N., Doudin, A., Sellami, M., Domling, A., Agouni, A., Althani, A. A., & Elrayess, M. A. (2023). Antioxidative Stress Metabolic Pathways in Moderately Active Individuals. Metabolites, 13(9), 973. https://doi.org/10.3390/metabo13090973