
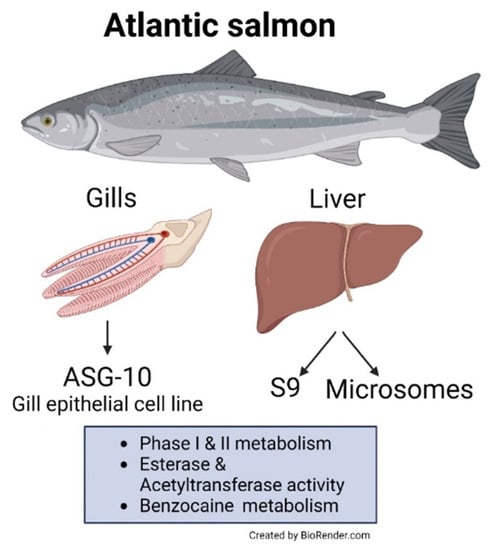
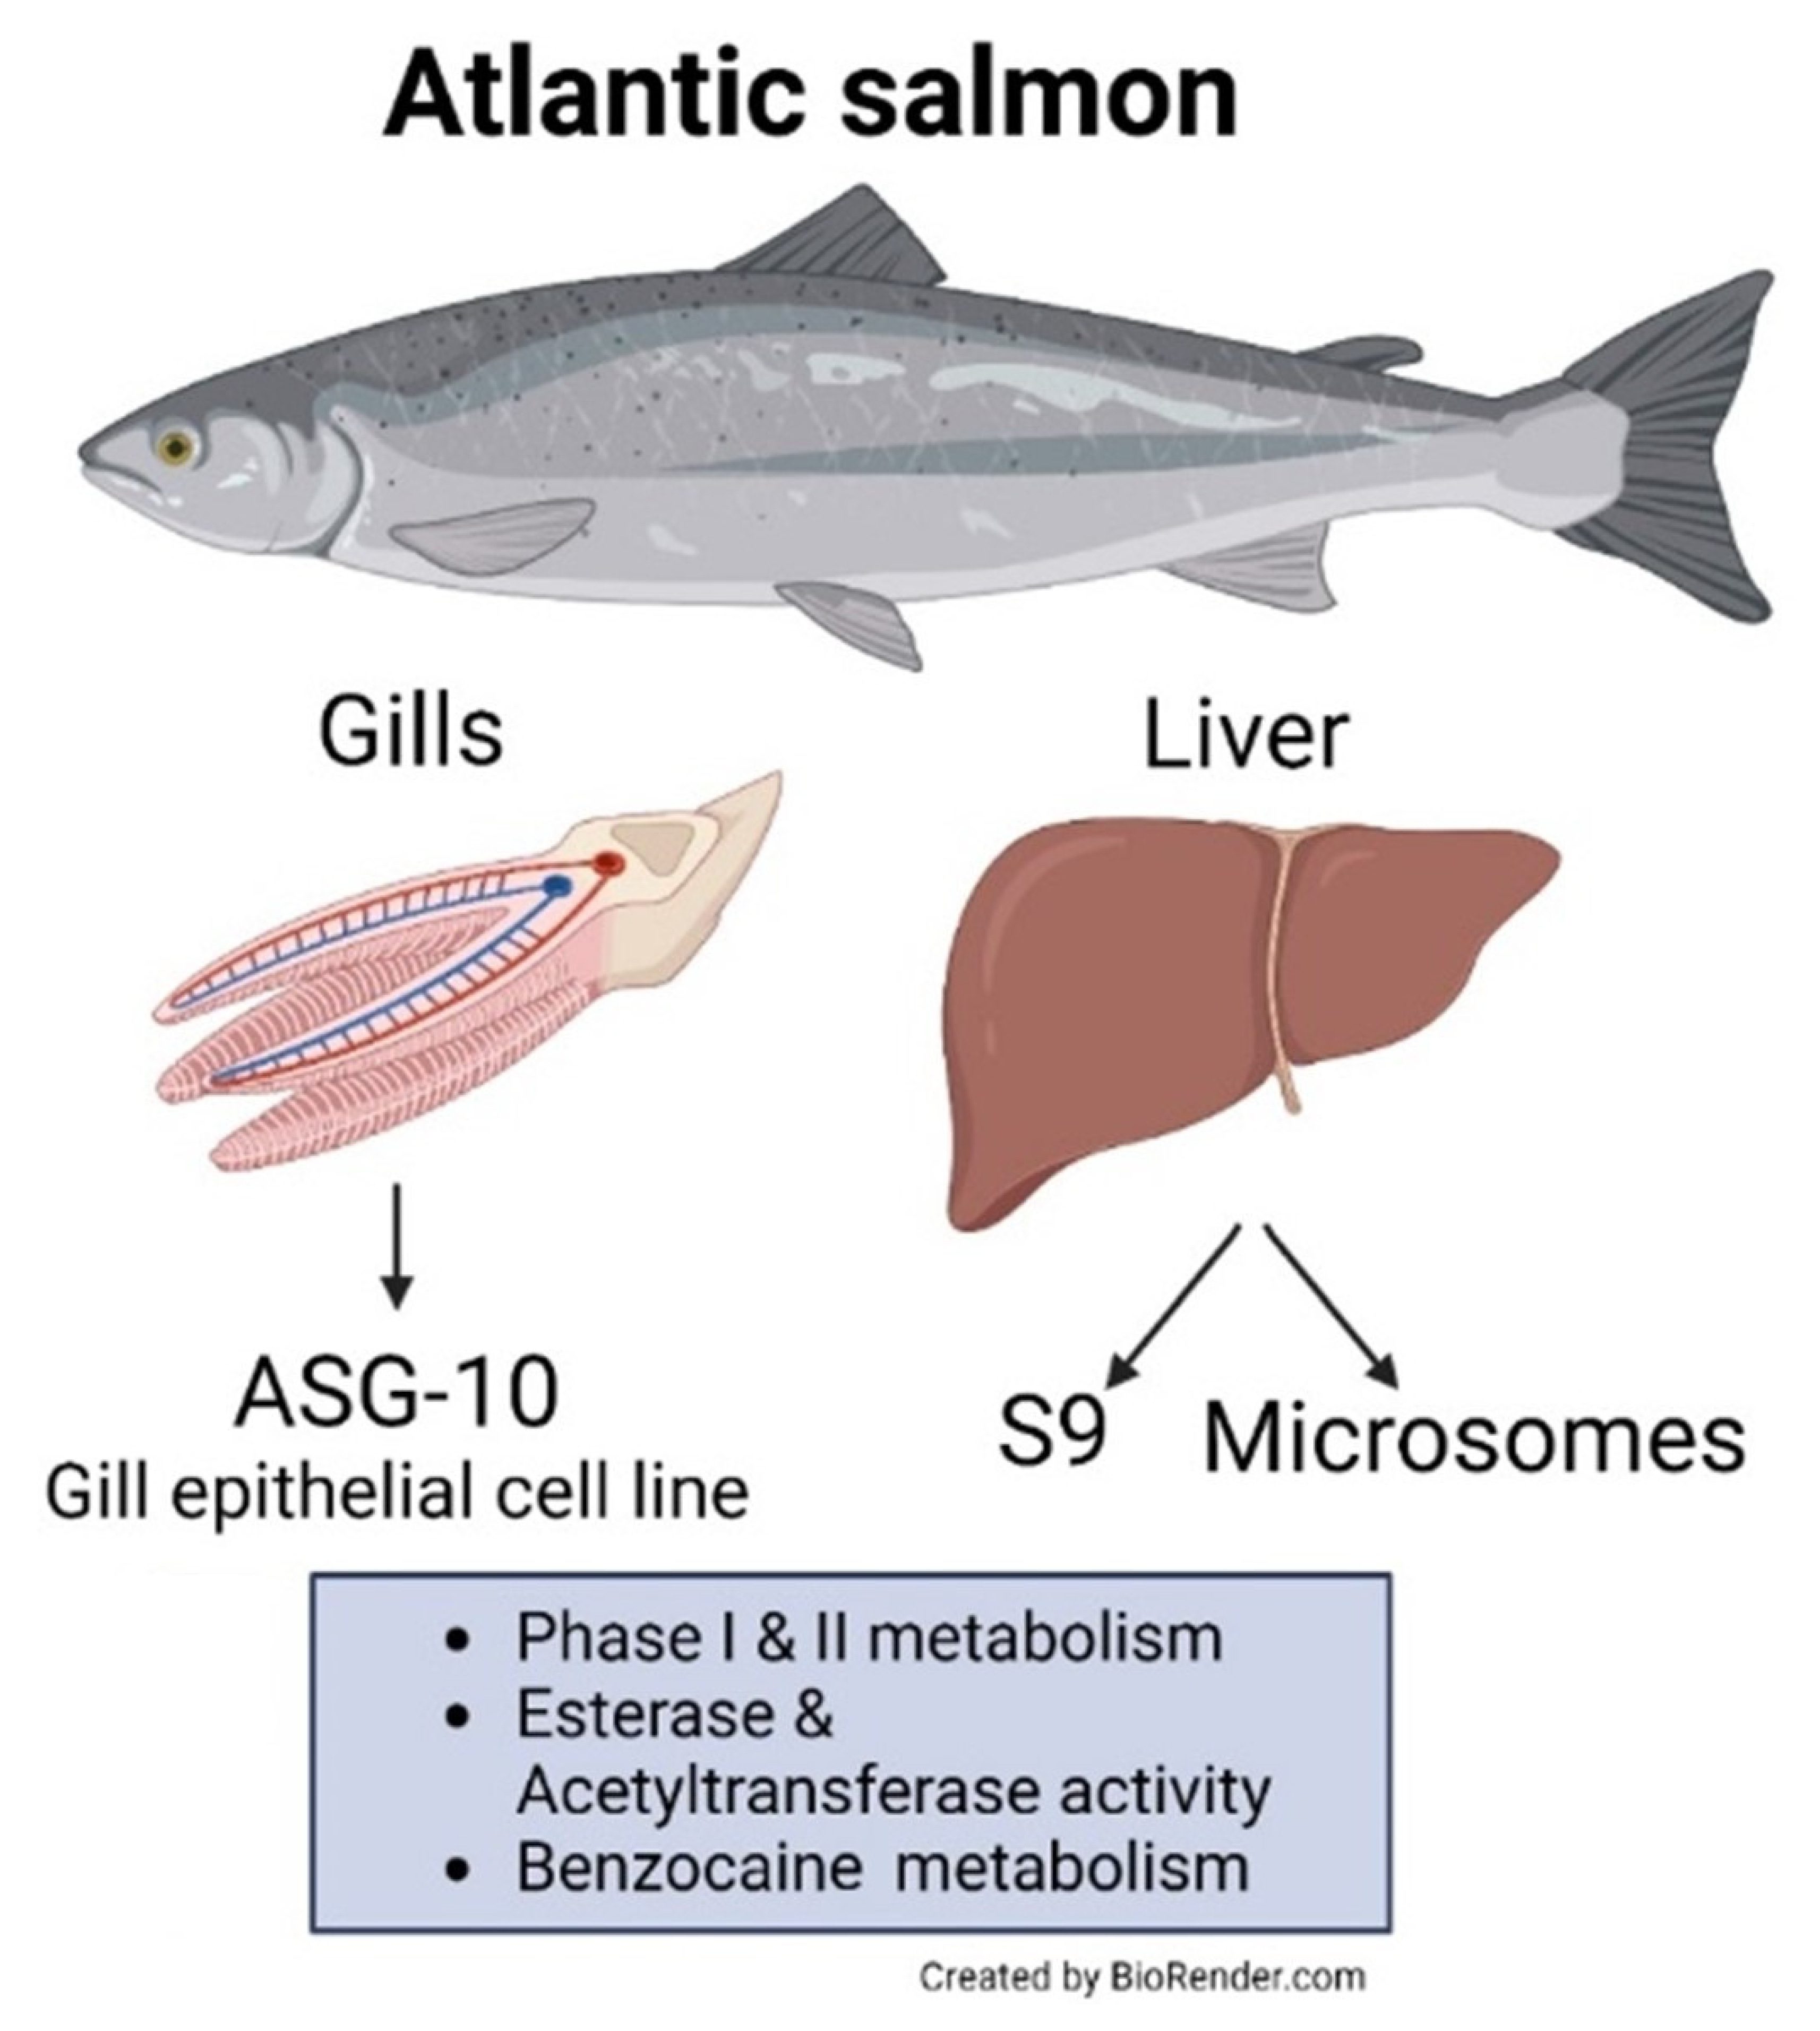
Atlantic Salmon Gill Epithelial Cell Line (ASG-10) as a Suitable Model for Xenobiotic Biotransformation


Abstract
1. Introduction
2. Materials and Methods
2.1. Chemicals and Reagents
2.2. Cell Culture
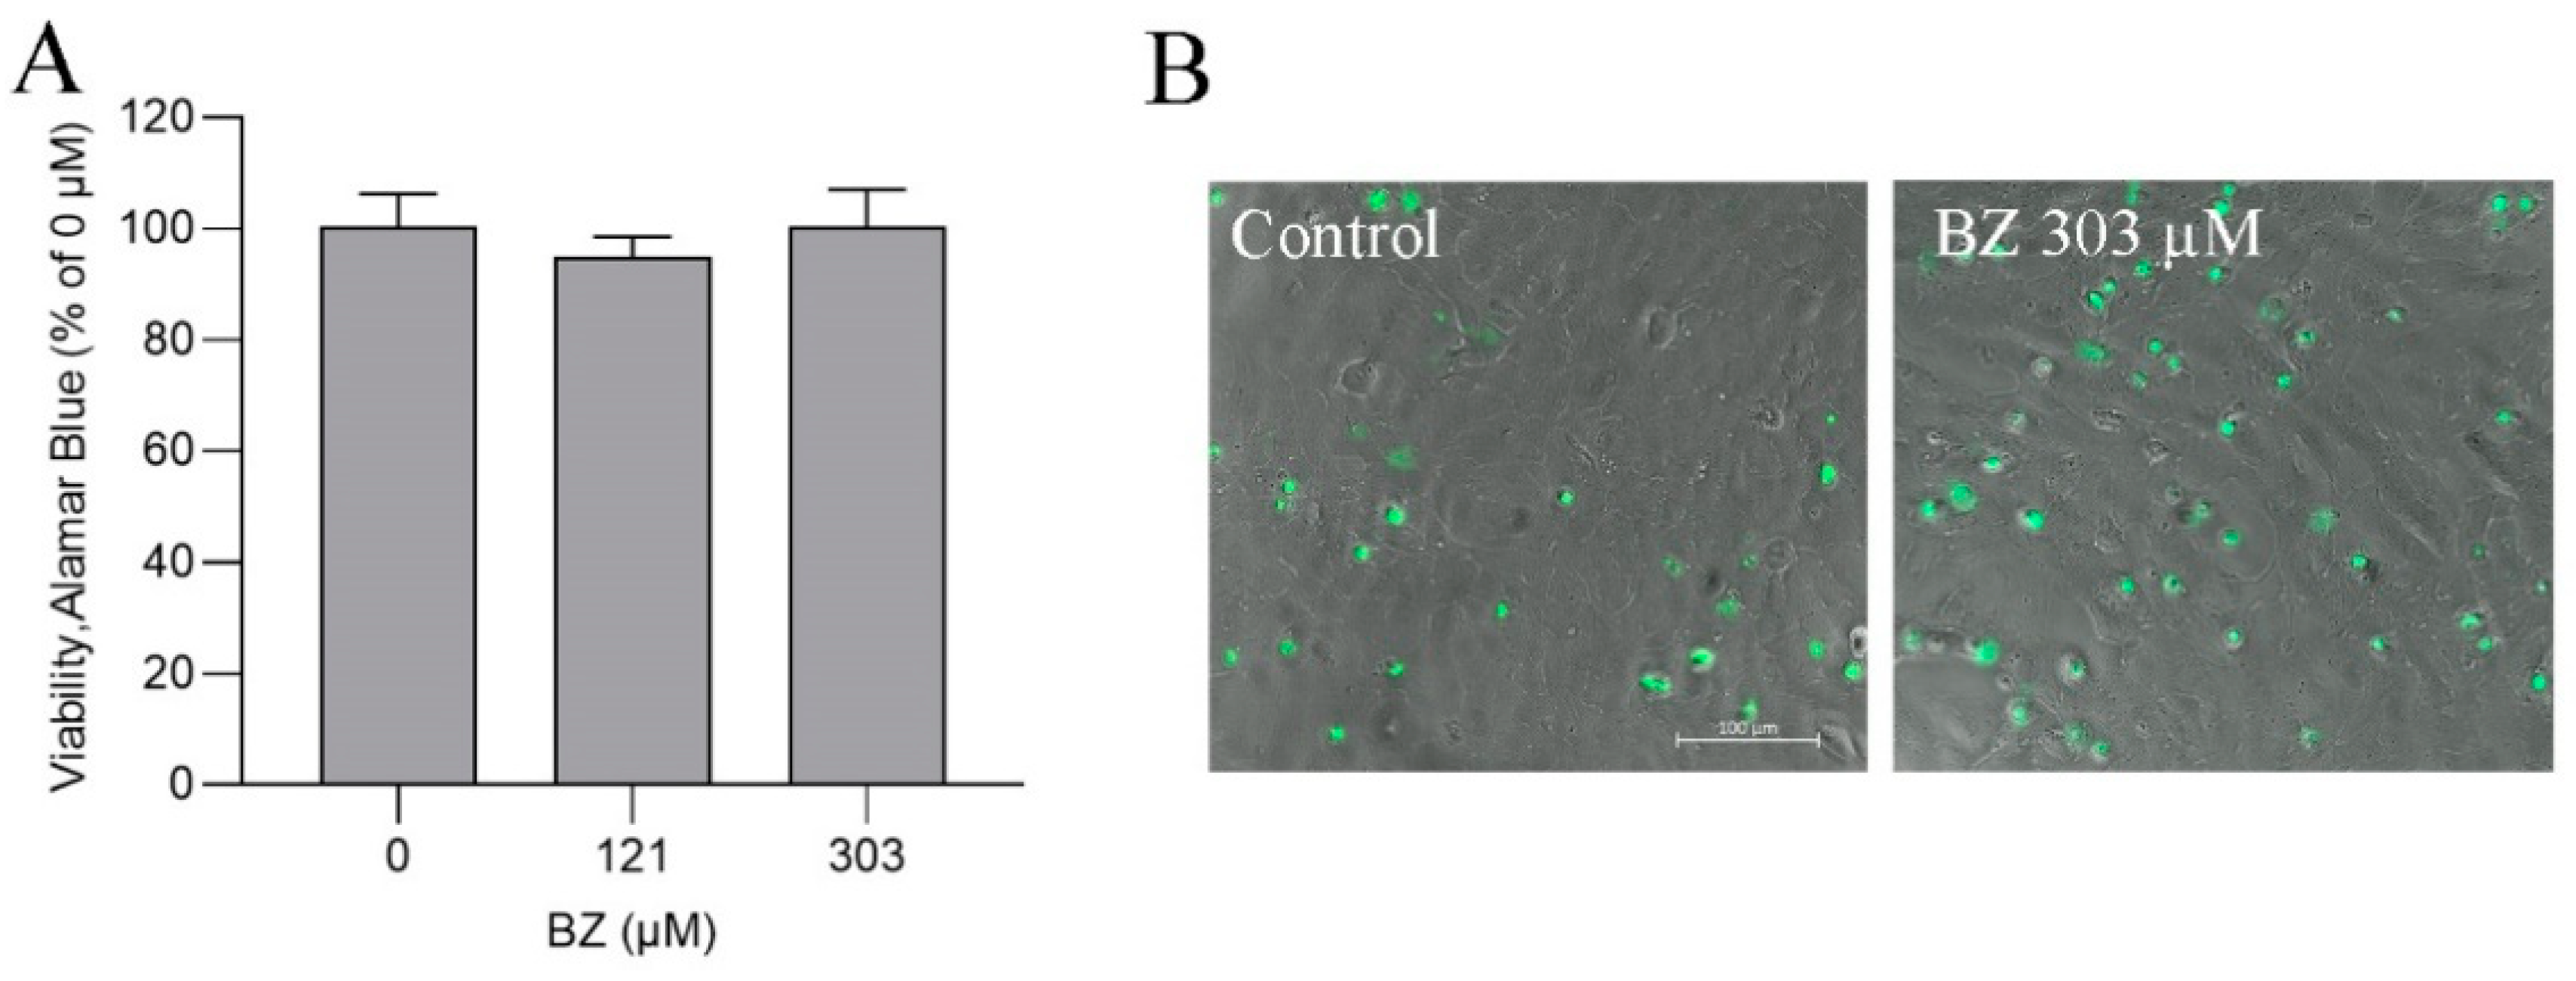
2.3. Cell Viability
2.4. Cytochrome P450 (CYP) 1A Immunochemical Analysis
2.5. EROD Assay
2.6. Preparation of S9 Fractions and Liver Microsomes from Atlantic Salmon
2.7. Preparation of Chemical Standards
2.8. Characterization of Biotransformation Capacities
2.8.1. ASG-10
2.8.2. SLMs and S9
2.9. Plasma Extraction
2.10. Protection of Free Amino Groups from Hydroxylation by Acetylation
2.11. Mass Spectrometric Analysis Using Triple Quadrupole (TQMS) and High-Resolution Tandem Mass Spectrometry (HRMS/MS) Systems
2.12. Statistical Analysis
3. Results and Discussion
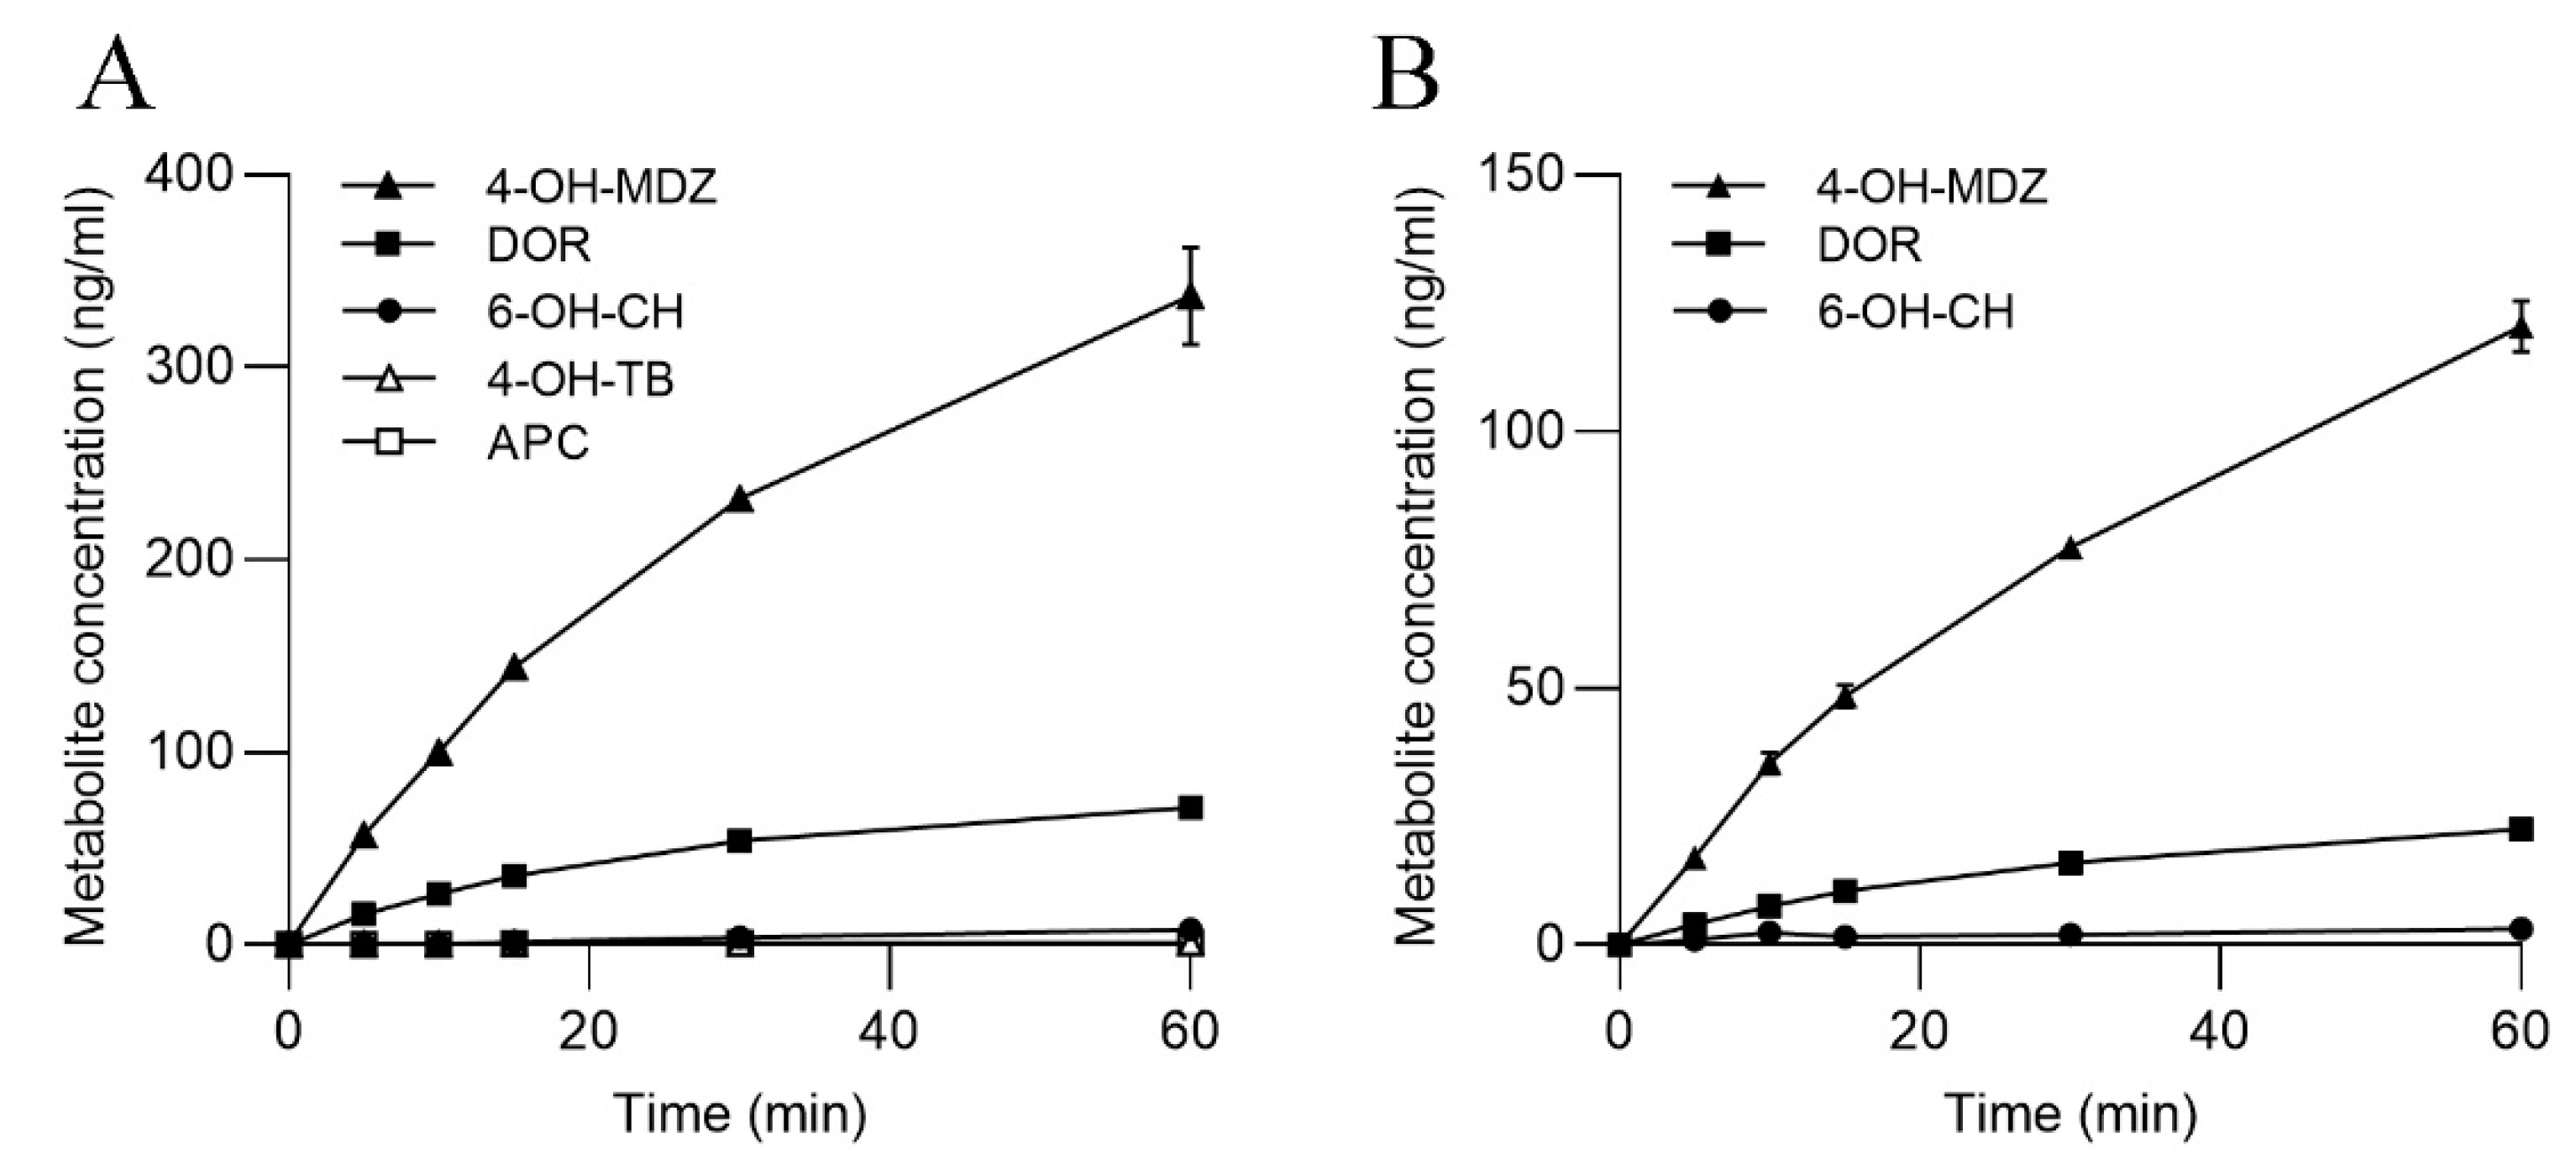
3.1. CYP Activities in ASG-10
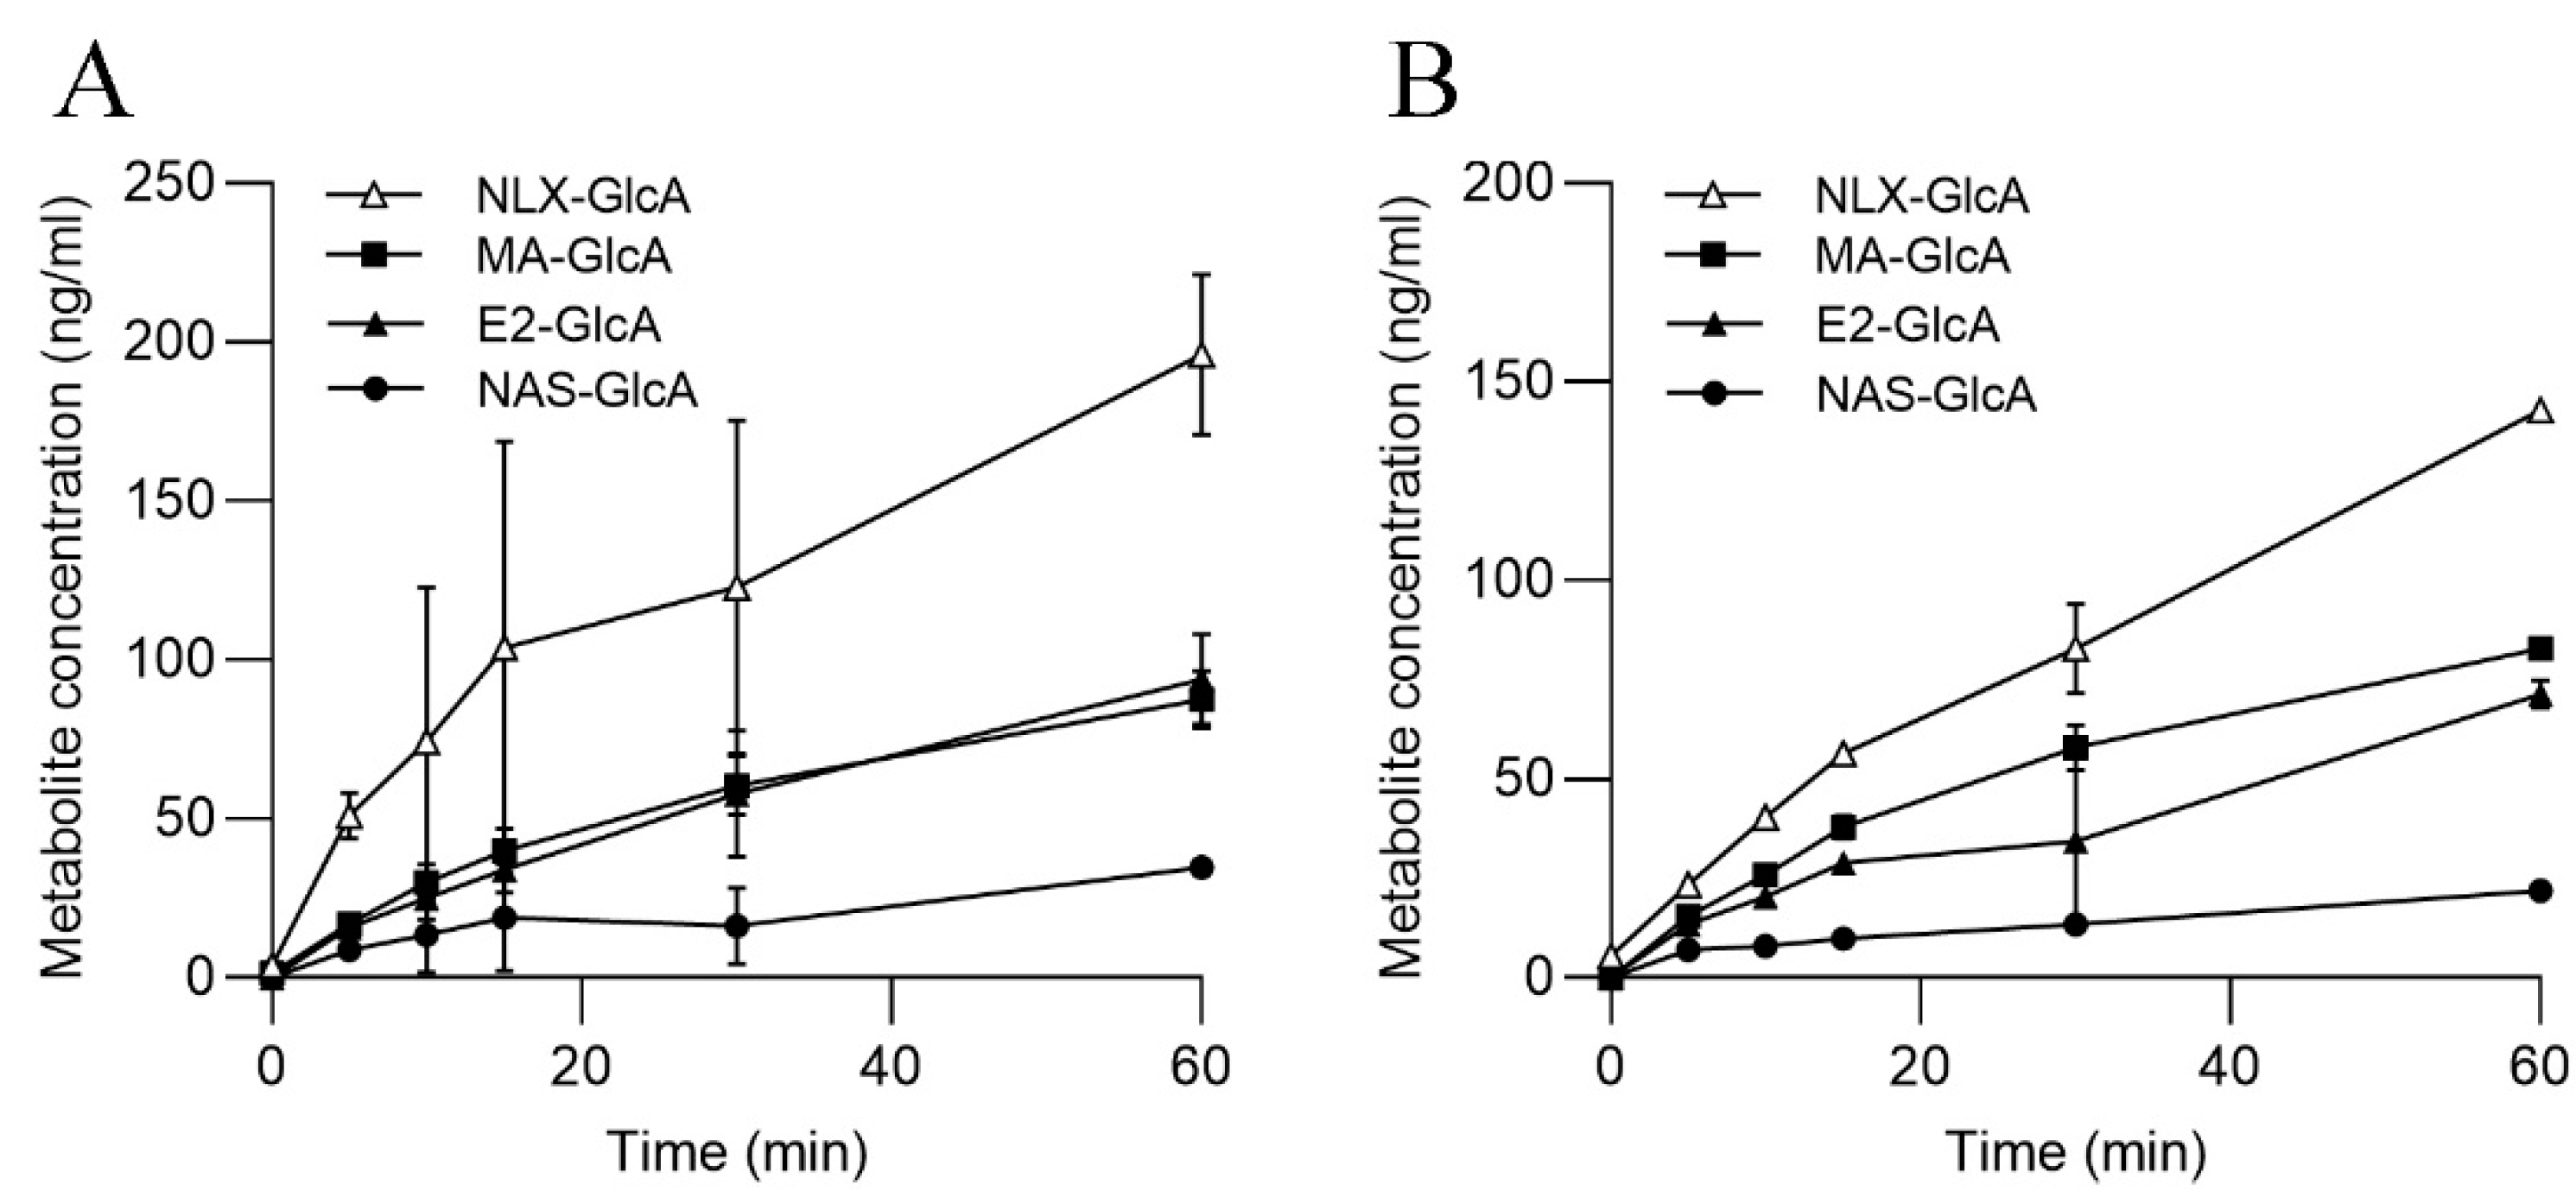
3.2. UGT Activities in ASG-10
3.3. CYP Activities in SLM and S9
3.4. UGT Activities in SLMs and S9
3.5. BZ Metabolism in ASG-10
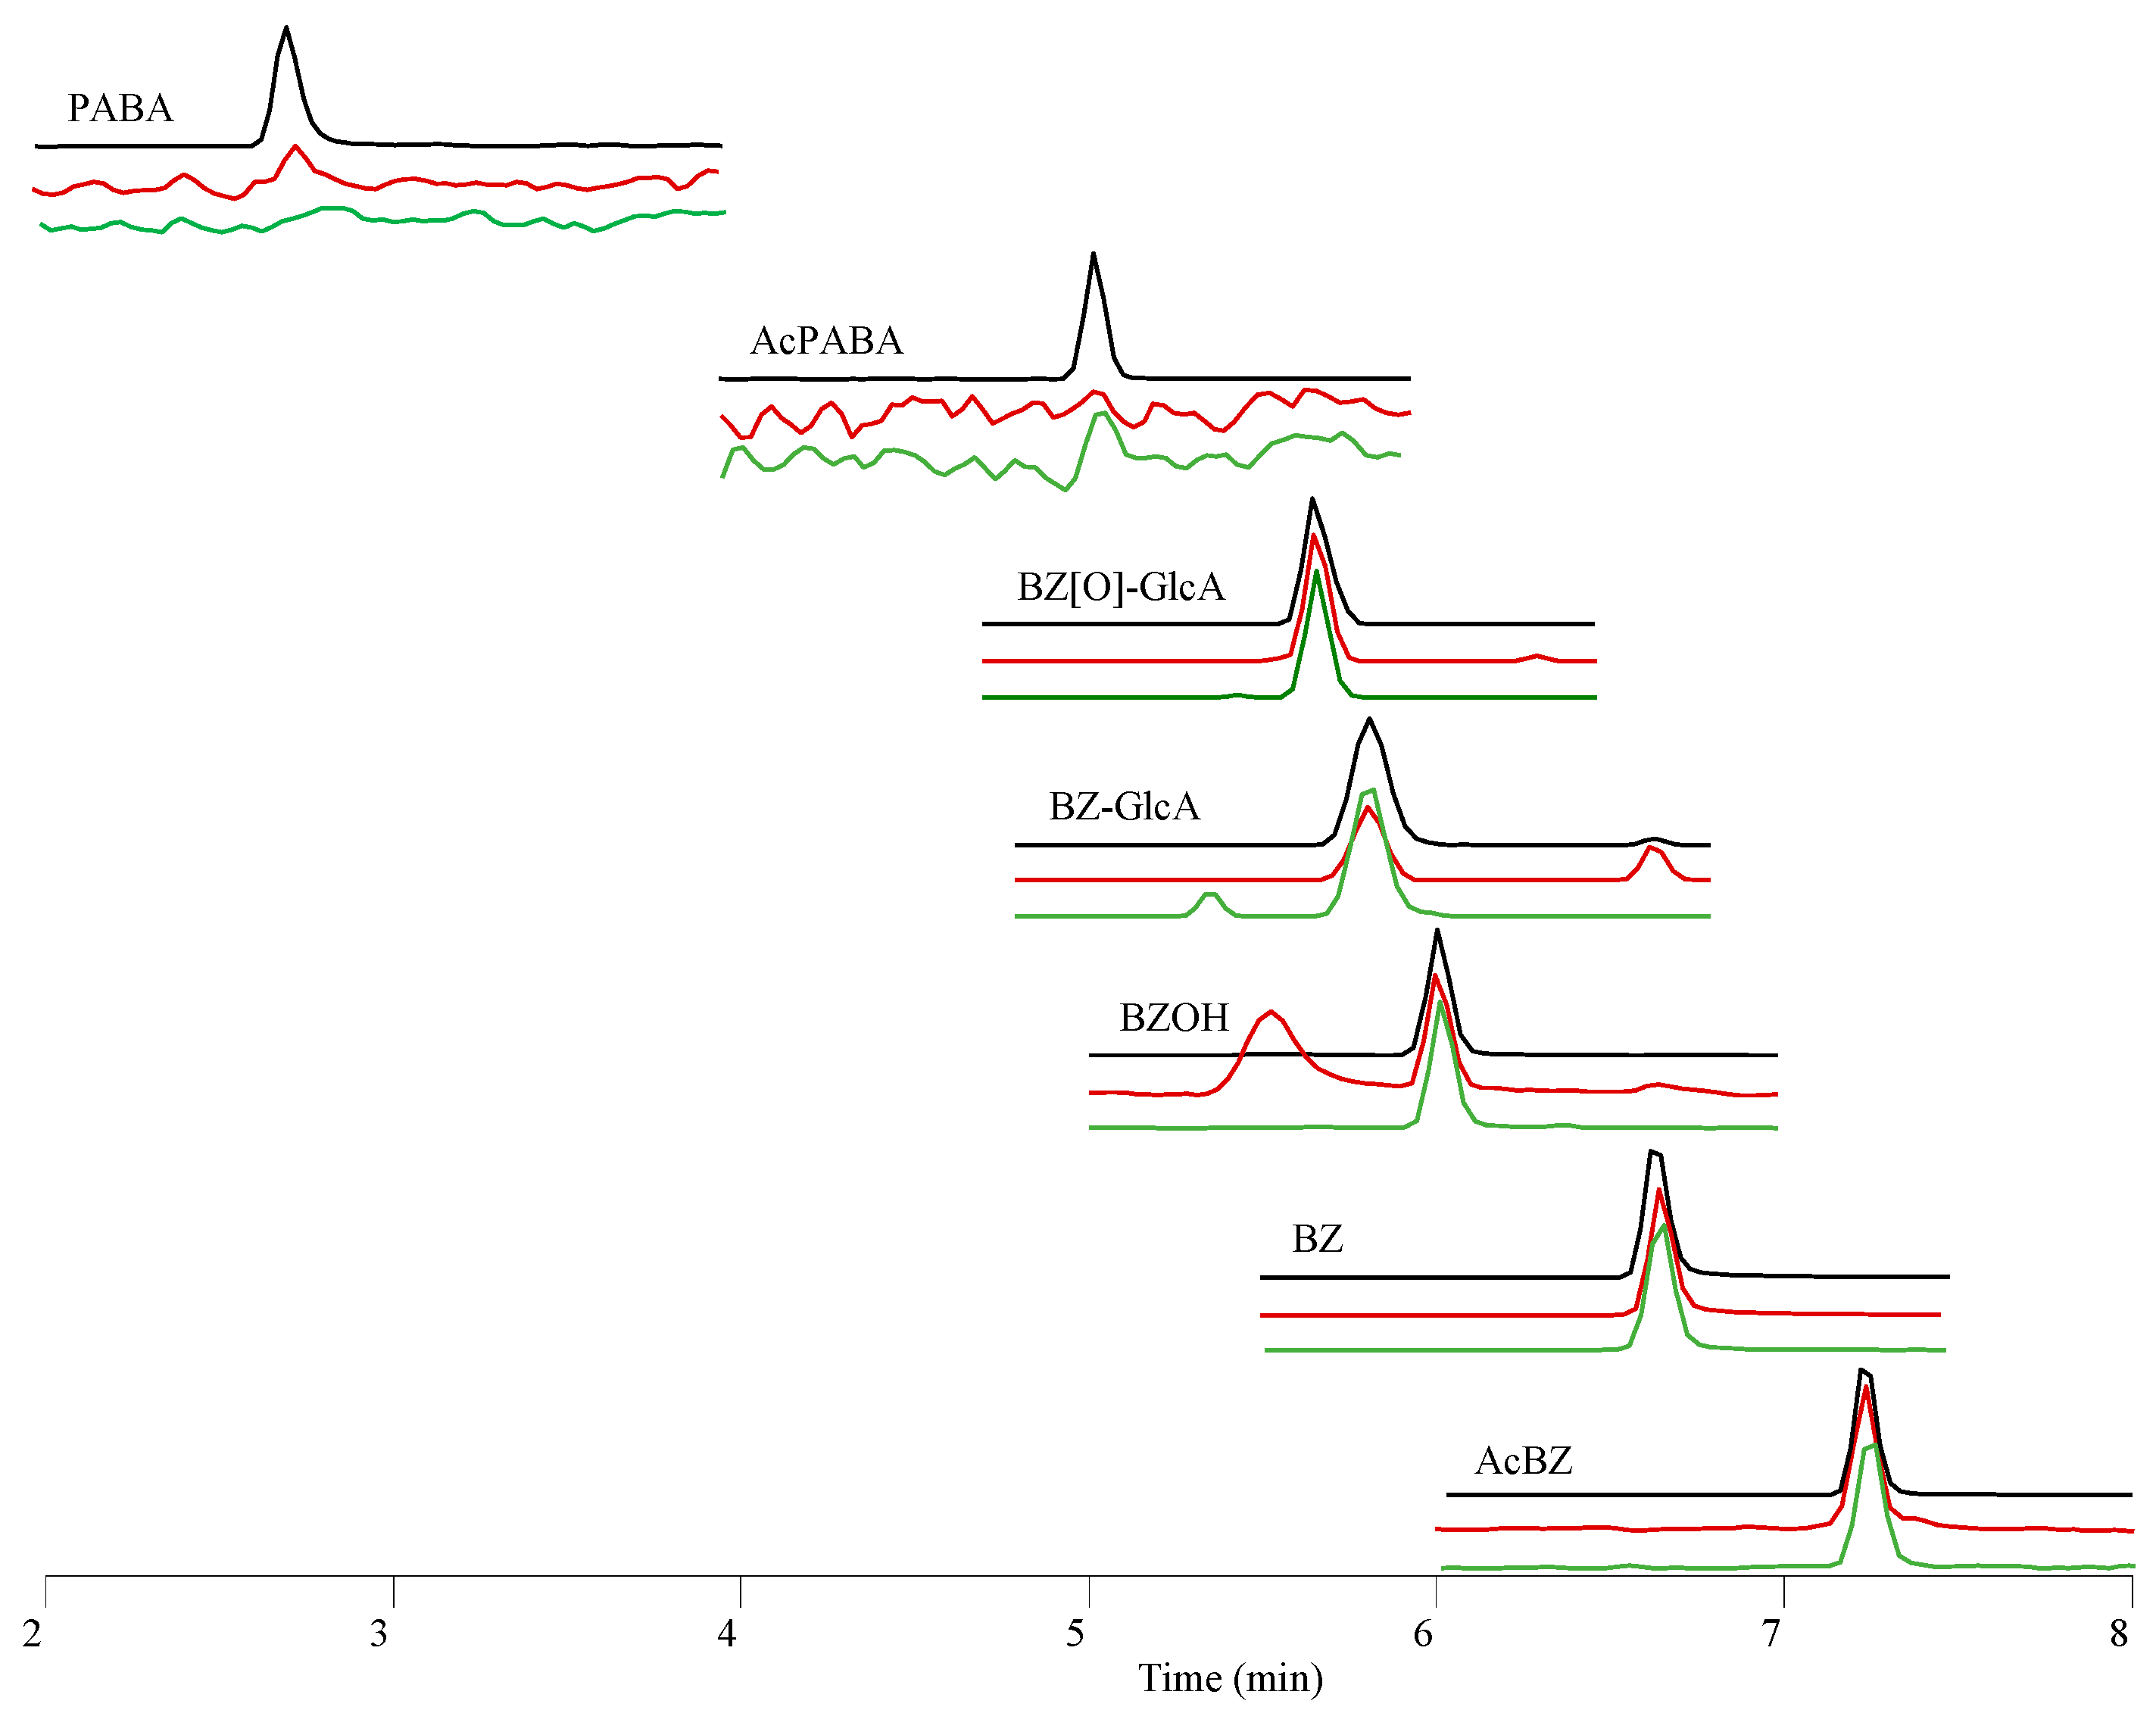
3.6. Determination of BZ Metabolites
4. Conclusions
Supplementary Materials
Author Contributions
Funding
Institutional Review Board Statement
Informed Consent Statement
Data Availability Statement
Acknowledgments
Conflicts of Interest
References
- Amiard, J.-C.; Amiard-Triquet, C. Chapter 2—Conventional Risk Assessment of Environmental Contaminants. In Aquatic Ecotoxicology: Advancing Tools for Dealing with Emerging Risks; Amiard-Triquet, C., Amiard, J.-C., Mouneyrac, C., Eds.; Elsevier: Amsterdam, The Netherlands; Academic Press: Cambridge, MA, USA, 2015; pp. 25–49. [Google Scholar] [CrossRef]
- Ellison, C.A.; Api, A.M.; Becker, R.A.; Efremenko, A.Y.; Gadhia, S.; Hack, C.E.; Hewitt, N.J.; Varcin, M.; Schepky, A. Internal Threshold of Toxicological Concern (iTTC): Where We Are Today and What Is Possible in the Near Future. Front. Toxicol. 2021, 2, 621541. [Google Scholar] [CrossRef] [PubMed]
- Gomez, C.F.; Constantine, L.; Huggett, D.B. The influence of gill and liver metabolism on the predicted bioconcentration of three pharmaceuticals in fish. Chemosphere 2010, 81, 1189–1195. [Google Scholar] [CrossRef] [PubMed]
- Olson, K.R. Gill circulation: Regulation of perfusion distribution and metabolism of regulatory molecules. J. Exp. Zool. 2002, 293, 320–335. [Google Scholar] [CrossRef] [PubMed]
- McKim, J.M.; Erickson, R.J. Environmental Impacts on the Physiological Mechanisms Controlling Xenobiotic Transfer across Fish Gills. Physiol. Zool. 1991, 64, 39–67. [Google Scholar] [CrossRef]
- Michel-Levy, J. Topics in Local Anesthetics. In Topics in Local Anesthetics; Víctor, M.W.-L., Enrique, H.-C., Eds.; IntechOpen: Rijeka, Croatia, 2020; p. 192. [Google Scholar] [CrossRef]
- Meinertz, J.R.; Stehly, G.R.; Gingerich, W.H. Metabolism, Elimination, and Pharmacokinetics of the Fish Anesthetic Benzocaine. In Xenobiotics in Fish; Smith, D.J., Gingerich, W.H., Beconi-Barker, M.G., Eds.; Springer: Boston, MA, USA, 1999; pp. 189–200. [Google Scholar] [CrossRef]
- Kiessling, A.; Johansson, D.; Zahl, I.H.; Samuelsen, O.B. Pharmacokinetics, plasma cortisol and effectiveness of benzocaine, MS-222 and isoeugenol measured in individual dorsal aorta-cannulated Atlantic salmon (Salmo salar) following bath administration. Aquaculture 2009, 286, 301–308. [Google Scholar] [CrossRef]
- Gjessing, M.C.; Aamelfot, M.; Batts, W.N.; Benestad, S.L.; Dale, O.B.; Thoen, E.; Weli, S.C.; Winton, J.R. Development and characterization of two cell lines from gills of Atlantic salmon. PLoS ONE 2018, 13, e0191792. [Google Scholar] [CrossRef]
- Sommerset, I.; Wiik-Nielsen, J.; De Oliveira, V.H.S.; Moldal, T.; Bornø, G.; Haukaas, A.; Brun, E. Norwegian Fish Health Report 2022, Norwegian Veterinary Institute Report; Norwegian Veterinary Institute: Ås, Norway, 2023. Available online: https://www.vetinst.no/rapporter-og-publikasjoner/rapporter/2023/norwegian-fish-health-report-2022 (accessed on 26 May 2023).
- Rehberger, K.; Kropf, C.; Segner, H. In vitro or not in vitro: A short journey through a long history. Environ. Sci. Eur. 2018, 30, 23. [Google Scholar] [CrossRef]
- Nichols, J.W.; Schultz, I.R.; Fitzsimmons, P.N. In vitro-in vivo extrapolation of quantitative hepatic biotransformation data for fish. I. A review of methods, and strategies for incorporating intrinsic clearance estimates into chemical kinetic models. Aquat. Toxicol. 2006, 78, 74–90. [Google Scholar] [CrossRef]
- Sandbacka, M.; Pärt, P.; Isomaa, B. Gill epithelial cells as tools for toxicity screening—Comparison between primary cultures, cells in suspension and epithelia on filters. Aquat. Toxicol. 1999, 46, 23–32. [Google Scholar] [CrossRef]
- Stott, L.C.; Schnell, S.; Hogstrand, C.; Owen, S.F.; Bury, N.R. A primary fish gill cell culture model to assess pharmaceutical uptake and efflux: Evidence for passive and facilitated transport. Aquat. Toxicol. 2015, 159, 127–137. [Google Scholar] [CrossRef]
- Franco, M.E.; Sutherland, G.E.; Lavado, R. Xenobiotic metabolism in the fish hepatic cell lines Hepa-E1 and RTH-149, and the gill cell lines RTgill-W1 and G1B: Biomarkers of CYP450 activity and oxidative stress. Comp. Biochem. Physiol. C Toxicol. Pharmacol. 2018, 206–207, 32–40. [Google Scholar] [CrossRef] [PubMed]
- Heinrich, P.; Diehl, U.; Forster, F.; Braunbeck, T. Improving the in vitro ethoxyresorufin-O-deethylase (EROD) assay with RTL-W1 by metabolic normalization and use of beta-naphthoflavone as the reference substance. Comp. Biochem. Physiol. C Toxicol. Pharmacol. 2014, 164, 27–34. [Google Scholar] [CrossRef]
- Sindre, H.; Gjessing, M.C.; Fosse, J.H.; Hermansen, L.C.; Bockerman, I.; Amundsen, M.M.; Dahle, M.K.; Solhaug, A. Establishment and Characterization of a Novel Gill Cell Line, LG-1, from Atlantic Lumpfish (Cyclopterus lumpus L.). Cells 2021, 10, 2442. [Google Scholar] [CrossRef] [PubMed]
- Johny, A.; Ivanova, L.; Knutsdatter Ostbye, T.K.; Faeste, C.K. Biotransformation of phytoestrogens from soy in enzymatically characterized liver microsomes and primary hepatocytes of Atlantic salmon. Ecotoxicol. Environ. Saf. 2020, 197, 110611. [Google Scholar] [CrossRef] [PubMed]
- Goldstone, J.V.; McArthur, A.G.; Kubota, A.; Zanette, J.; Parente, T.; Jönsson, M.E.; Nelson, D.R.; Stegeman, J.J. Identification and developmental expression of the full complement of Cytochrome P450 genes in Zebrafish. BMC Genom. 2010, 11, 643. [Google Scholar] [CrossRef] [PubMed]
- Uno, T.; Ishizuka, M.; Itakura, T. Cytochrome P450 (CYP) in fish. Environ. Toxicol. Pharmacol. 2012, 34, 1–13. [Google Scholar] [CrossRef] [PubMed]
- Nelson, D.R.; Nebert, D.W. Cytochrome P450 (CYP) Gene Superfamily. In Encyclopedia of Life Sciences; Wiley: Chichester, UK, 2018; pp. 1–19. [Google Scholar] [CrossRef]
- Jonsson, E.M.; Abrahamson, A.; Brunstrom, B.; Brandt, I. Cytochrome P4501A induction in rainbow trout gills and liver following exposure to waterborne indigo, benzo[a]pyrene and 3,3’,4,4’,5-pentachlorobiphenyl. Aquat. Toxicol. 2006, 79, 226–232. [Google Scholar] [CrossRef]
- Matsuo, A.Y.; Gallagher, E.P.; Trute, M.; Stapleton, P.L.; Levado, R.; Schlenk, D. Characterization of Phase I biotransformation enzymes in coho salmon (Oncorhynchus kisutch). Comp. Biochem. Physiol. C Toxicol. Pharmacol. 2008, 147, 78–84. [Google Scholar] [CrossRef]
- Lee, R.F.; Anderson, J.W. Significance of cytochrome P450 system responses and levels of bile fluorescent aromatic compounds in marine wildlife following oil spills. Mar. Pollut. Bull. 2005, 50, 705–723. [Google Scholar] [CrossRef]
- Meucci, V.; Arukwe, A. The xenoestrogen 4-nonylphenol modulates hepatic gene expression of pregnane X receptor, aryl hydrocarbon receptor, CYP3A and CYP1A1 in juvenile Atlantic salmon (Salmo salar). Comp. Biochem. Physiol. C Toxicol. Pharmacol. 2006, 142, 142–150. [Google Scholar] [CrossRef]
- Goksøyr, A.; Förlin, L. The cytochrome P-450 system in fish, aquatic toxicology and environmental monitoring. Aquat. Toxicol. 1992, 22, 287–311. [Google Scholar] [CrossRef]
- Woodin, B.R.; Smolowitz, R.M.; Stegeman, J.J. Induction of Cytochrome P4501A in the Intertidal Fish Anoplarchus purpurescens by Prudhoe Bay Crude Oil and Environmental Induction in Fish from Prince William Sound. Environ. Sci. Technol. 1997, 31, 1198–1205. [Google Scholar] [CrossRef]
- Oliveira, M.; Pacheco, M.; Santos, M.A. Cytochrome P4501A, genotoxic and stress responses in golden grey mullet (Liza aurata) following short-term exposure to phenanthrene. Chemosphere 2007, 66, 1284–1291. [Google Scholar] [CrossRef] [PubMed]
- Navas, J.M.; Segner, H. Modulation of trout 7-ethoxyresorufin-O-deethylase (EROD) activity by estradiol and octylphenol. Mar. Environ. Res. 2000, 50, 157–162. [Google Scholar] [CrossRef] [PubMed]
- Elskus, A.A. Estradiol and estriol suppress CYP1A expression in rainbow trout primary hepatocytes. Mar. Environ. Res. 2004, 58, 463–467. [Google Scholar] [CrossRef] [PubMed]
- Goksøyr, A. Use of cytochrome P450 1A (CYP1A) in fish as a biomarker of aquatic pollution. In Toxicology in Transition; Springer: Berlin/Heidelberg, Germany, 1995; pp. 80–95. [Google Scholar]
- Arinç, E.; Sen, A.; Bozcaarmutlu, A. Cytochrome P4501A and associated mixed-function oxidase induction in fish as a biomarker for toxic carcinogenic pollutants in the aquatic environment. Pure Appl. Chem. 2000, 72, 985–994. [Google Scholar] [CrossRef]
- Široká, Z.; Drastichova, J. Biochemical marker of aquatic environment contamination-cytochrome P450 in fish. A review. Acta Vet. Brno. 2004, 73, 123–132. [Google Scholar] [CrossRef]
- Mdegela, R.; Myburgh, J.; Correia, D.; Braathen, M.; Ejobi, F.; Botha, C.; Sandvik, M.; Skaare, J.U. Evaluation of the gill filament-based EROD assay in African sharptooth catfish (Clarias gariepinus) as a monitoring tool for waterborne PAH-type contaminants. Ecotoxicology 2006, 15, 51–59. [Google Scholar] [CrossRef]
- Celander, M.; Bremer, J.; Hahn, M.E.; Stegeman, J.J. Glucocorticoid-xenobiotic interactions: Dexamethasone-mediated potentiation of cytochrome P4501A induction by β-naphthoflavone in a fish hepatoma cell line (PLHC-1). Environ. Toxicol. Chem. 1997, 16, 900–907. [Google Scholar] [CrossRef]
- Smeets, J.M.; van Holsteijn, I.; Giesy, J.P.; van den Berg, M. The anti-estrogenicity of Ah receptor agonists in carp (Cyprinus carpio) hepatocytes. Toxicol. Sci. 1999, 52, 178–188. [Google Scholar] [CrossRef]
- Pesonen, M.; Andersson, T. Characterization and induction of xenobiotic metabolizing enzyme activities in a primary culture of rainbow trout hepatocytes. Xenobiotica 1991, 21, 461–471. [Google Scholar] [CrossRef]
- Slattery, O.; Dahle, M.K.; Sundaram, A.; Nowak, B.F.; Gjessing, M.C.; Solhaug, A. Functional and molecular characterization of the Atlantic salmon gill epithelium cell line ASG-10 as a tool for in vitro gill research. Front. Mol. Biosci. 2023; submitted. [Google Scholar]
- Wang, Y.; Huang, H.; Wu, Q. Characterization of the zebrafish Ugt repertoire reveals a new class of drug-metabolizing UDP glucuronosyltransferases. Mol. Pharmacol. 2014, 86, 62–75. [Google Scholar] [CrossRef] [PubMed]
- Huang, H.; Wu, Q. Cloning and comparative analyses of the zebrafish Ugt repertoire reveal its evolutionary diversity. PLoS ONE 2010, 5, e9144. [Google Scholar] [CrossRef] [PubMed]
- Clarke, D.J.; George, S.G.; Burchell, B. Multiplicity of UDP-glucuronosyltransferases in fish. Purification and characterization of a phenol UDP-glucuronosyltransferase from the liver of a marine teleost, Pleuronectes platessa. Biochem. J. 1992, 284, 417–423. [Google Scholar] [CrossRef]
- Leaver, M.J.; Wright, J.; Hodgson, P.; Boukouvala, E.; George, S.G. Piscine UDP-glucuronosyltransferase 1B. Aquat. Toxicol. 2007, 84, 356–365. [Google Scholar] [CrossRef] [PubMed]
- Bury, N.R.; Schnell, S.; Hogstrand, C. Gill cell culture systems as models for aquatic environmental monitoring. J. Exp. Biol. 2014, 217, 639–650. [Google Scholar] [CrossRef]
- Rees, C.B.; McCormick, S.D.; Vanden Heuvel, J.P.; Li, W. Quantitative PCR analysis of CYP1A induction in Atlantic salmon (Salmo salar). Aquat. Toxicol. 2003, 62, 67–78. [Google Scholar] [CrossRef]
- Arukwe, A.; Förlin, L.; Goksøyr, A. Xenobiotic and steroid biotransformation enzymes in Atlantic salmon (Salmo salar) liver treated with an estrogenic compound, 4-nonylphenol. Environ. Toxicol. Chem. 1997, 16, 2576–2583. [Google Scholar] [CrossRef]
- Ferreira, A.L.; de Souza e Silva, W.; Neves, L.d.C.; Ferreira, N.S.; Takata, R.; Luz, R.K. Benzocaine and menthol as anesthetics for the African cichlid Aulonocara nyassae. Aquacult. Int. 2020, 28, 1837–1846. [Google Scholar] [CrossRef]
- Meinertz, J.R.; Stehly, G.R.; Gingerich, W.H. Pharmacokinetics of benzocaine in rainbow trout (Oncorhynchus mykiss) after intraarterial dosing. Aquaculture 1996, 148, 39–48. [Google Scholar] [CrossRef]
- Stehly, G.R.; Meinertz, J.R.; Gingerich, W.H. Effect of temperature on the pharmacokinetics of benzocaine in rainbow trout (Oncorhynchus mykiss) after bath exposures. J. Vet. Pharmacol. Ther. 1998, 21, 121–127. [Google Scholar] [CrossRef]
- Hayton, W.L.; Szoke, A.; Kemmenoe, B.H.; Vick, A.M. Disposition of benzocaine in channel catfish. Aquat. Toxicol. 1996, 36, 99–113. [Google Scholar] [CrossRef]
- Saunders, J.; Speare, D.J.; McConkey, S. Methemoglobin concentrations in three salmonid species following exposure to benzocaine or tricaine methanesulfonate. Fish Physiol. Biochem. 2020, 46, 2257–2263. [Google Scholar] [CrossRef]
- Conole, D.; Beck, T.M.; Jay-Smith, M.; Tingle, M.D.; Eason, C.T.; Brimble, M.A.; Rennison, D. Synthesis and methemoglobinemia-inducing properties of benzocaine isosteres designed as humane rodenticides. Bioorg. Med. Chem. 2014, 22, 2220–2235. [Google Scholar] [CrossRef]
- Hartman, N.; Zhou, H.; Mao, J.; Mans, D.; Boyne, M., 2nd; Patel, V.; Colatsky, T. Characterization of the methemoglobin forming metabolites of benzocaine and lidocaine. Xenobiotica 2017, 47, 431–438. [Google Scholar] [CrossRef]
- Ma, X. Temperature Effects on Benzocaine Pharmacokinetics and Metabolim in Rainbow Trout, Oncorhynchus mykiss. Ohio State University, Graduate School, OhioLINK Electronic Theses and Dissertations Center. 2000. Available online: http://rave.ohiolink.edu/etdc/view?acc_num=osu1488195633520832 (accessed on 14 January 2022).
- Brox, S.; Seiwert, B.; Küster, E.; Reemtsma, T. Toxicokinetics of Polar Chemicals in Zebrafish Embryo (Danio rerio): Influence of Physicochemical Properties and of Biological Processes. Environ. Sci. Technol. 2016, 50, 10264–10272. [Google Scholar] [CrossRef] [PubMed]
- Meinertz, J.R.; Gingerich, W.H.; Allen, J.L. Metabolism and elimination of benzocaine by rainbow trout, Oncorhynchus mykiss. Xenobiotica 1991, 21, 525–533. [Google Scholar] [CrossRef] [PubMed]
- Zaib, U.N.; Akhtar, T. para-Aminobenzoic Acid-A Substrate of Immense Significance. Mini-Rev. Org. Chem. 2020, 17, 686–700. [Google Scholar] [CrossRef]
- Słojkowska, Z.; Krasuska, H.J.; Pachecka, J. Enzymic hydrolysis of amino acid derivatives of benzocaine. Xenobiotica 1982, 12, 359–364. [Google Scholar] [CrossRef] [PubMed]
- Kitamura, M.; Nakao, M.; Yanagisawa, I. Metabolism of para-aminobenzoic acid. J. Biochem. 1960, 47, 60–68. [Google Scholar] [CrossRef]
- Vest, M.F.; Salzberg, R. Conjugation reactions in the newborn infant: The metabolism of para-aminobenzoic acid. Arch. Dis. Child. 1965, 40, 97–105. [Google Scholar] [CrossRef] [PubMed]
- Henrikus, B.M.; Kampffmeyer, H.G. Ester hydrolysis and conjugation reactions in intact skin and skin homogenate, and by liver esterase of rabbits. Xenobiotica 1992, 22, 1357–1366. [Google Scholar] [CrossRef] [PubMed]
- Henrikus, B.; Kampffmeyer, H.G. Metabolism of ethyl 4-aminobenzoate in the isolated single-pass perfused rabbit ear. Skin Pharmacol. 1993, 6, 246–252. [Google Scholar] [CrossRef] [PubMed]
- Meyer, M.R.; Lindauer, C.; Welter, J.; Maurer, H.H. Dimethocaine, a synthetic cocaine analogue: Studies on its in-vivo metabolism and its detectability in urine by means of a rat model and liquid chromatography-linear ion-trap (high-resolution) mass spectrometry. Anal. Bioanal. Chem. 2014, 406, 1845–1854. [Google Scholar] [CrossRef]
- Kaivosaari, S.; Finel, M.; Koskinen, M. N-glucuronidation of drugs and other xenobiotics by human and animal UDP-glucuronosyltransferases. Xenobiotica 2011, 41, 652–669. [Google Scholar] [CrossRef] [PubMed]


| Combined Substrate Solutions [µM] | Working Solutions [mM] | Assay Concentrations [µM] | |||||||||
|---|---|---|---|---|---|---|---|---|---|---|---|
| C1 | C2 | C3 | C4 | W5 | W6 and W7 | ||||||
| Activity | Substrate Product | Compound | Stock Solution [mM] | ASG-10 | SLM/S9 | ASG-10 | SLM/S9 | ASG-10 | SLM/S9 | ASG-10 | SLM/S9 |
| CYP1A2 | PCN | phenacetin | 6.1 | 1000 | 715 | 2; 5; 10 | 2.5 | ||||
| ACP | acetaminophen | 7.3 | |||||||||
| CYP2C9 | TB | tolbutamide | 3.7 | 1000 | 710 | 2; 5; 10 | 2.5 | ||||
| 4-OH-TB | 4-hydroxy-TB | 3.5 | |||||||||
| CYP2D6 | DEX | dextromethorphan | 3.7 | 1000 | 715 | 2; 5; 10 | 2.5 | ||||
| DOR | dextrophan | 3.9 | |||||||||
| CYP2E1 | CH | chlorzoxazone | 5.9 | 1000 | 1444 | 2; 5; 10 | 5.1 | ||||
| 6-OH-CH | 6-hydroxy-CH | 5.4 | |||||||||
| CYP3A4 | MDZ | midazolam | 3.1 | 1000 | 2824 | 2; 5; 10 | 10 | ||||
| 4-OH-MDZ | 4-hydroxy-MDZ | 2.9 | |||||||||
| UGT1A1 | E2 | β-estradiol | 3.7 | 1000 | 250 | 2; 5; 10 | 5.5 | ||||
| E2-GlcA | E2-17β-D-glucuronide | 2.1 | |||||||||
| UGT1A4 | TFP | trifluoperazine 2HCl | 2.5 | 1000 | 83 | 2; 5; 10 | 1.2 | ||||
| TFP-GlcA | TFP-N-β-D-glucuronide | 0.2 | |||||||||
| UGT1A6 | NAS | N-acetylserotonin | 46 | 1000 | 268 | 2; 5; 10 | 6.9 | ||||
| NAS-GlcA | NAS-β-D-glucuronide | 2.5 | |||||||||
| UGT1A9 | MA | mycophenolic acid | 12 | 1000 | 83 | 2; 5; 10 | 0.5 | ||||
| MA-GlcA | MA-β-D-glucuronide | 2.0 | |||||||||
| UGT2B7 | NLX | naloxone | 3.1 | 1000 | 168 | 2; 5; 10 | 3.1 | ||||
| NLX-3GlcA | NLX-3β-D-glucuronide | 2.0 | |||||||||
| NAT and esterases | BZ | benzocaine | 6.1 | 121 | 0.4; 1.21 | 121; 303 | 1; 3 | ||||
| AcPABA | p-acetaminobenzoic acid | 5.6 | |||||||||
| PABA | p-aminobenzoic acid | 7.3 | |||||||||
| AcBZ | acetylbenzocaine | 4.8 | |||||||||
| Concentration [mM] | SLM | S9 |
|---|---|---|
| NADPH | 0.95 | 0.92 |
| NADP+ | 0.87 | 0.84 |
| Glucose 6-phosphate | 20.3 | 19.6 |
| MgCl2 × 6H2O | 9.43 | 9.13 |
| Metabolite | Composition | Theoretical Mass [M + H]+ m/z [Da] | Observed Mass [M + H]+ m/z [Da] | Mass Error *∆ ppm | Retention Time [min] | |
|---|---|---|---|---|---|---|
| p-Aminobenzoic acid | PABA | C7H7NO2 | 138.0550 | 138.0547 | −1.775 | 2.7 |
| p-Acetaminobenzoic acid | AcPABA | C9H9NO3 | 180.0655 | 180.0650 | −2.609 | 5.0 |
| Benzocaine hydroxylamine glucuronide | BZ(O)GlcA | C15H19NO9 | 358.1133 | 358.1136 | 0.984 | 5.6 |
| Benzocaine glucuronide | BZGlcA | C15H19NO8 | 342.1183 | 342.1180 | −0.856 | 5.8 |
| Benzocaine hydroxylamine | BZOH | C9H11NO3 | 182.0812 | 182.0811 | −0.438 | 6.0 |
| Benzocaine | BZ | C9H11NO2 | 166.0863 | 166.0860 | −1.356 | 6.6 |
| Acetylbenzocaine | AcBZ | C11H13NO3 | 208.0968 | 208.0967 | −0.768 | 7.2 |
| BZ | BZOH | ||||
|---|---|---|---|---|---|
| m/z [Da] | Composition | Mass Error * [ppm] | m/z [Da] | Composition | Mass Error * [ppm] |
| 166.0860 | C9H12O2N | −1.657 | 182.0811 | C9H12O3N | −0.328 |
| 138.0547 | C7H8O2N | −1.92 | 154.0497 | C7H8O3N | −1.166 |
| 120.0442 | C7H6ON | −1.669 | 136.0392 | C7H6O2N | −0.478 |
| 94.0650 | C6H8N | −1.657 | 110.0599 | C6H8ON | −1.094 |
Disclaimer/Publisher’s Note: The statements, opinions and data contained in all publications are solely those of the individual author(s) and contributor(s) and not of MDPI and/or the editor(s). MDPI and/or the editor(s) disclaim responsibility for any injury to people or property resulting from any ideas, methods, instructions or products referred to in the content. |
© 2023 by the authors. Licensee MDPI, Basel, Switzerland. This article is an open access article distributed under the terms and conditions of the Creative Commons Attribution (CC BY) license (https://creativecommons.org/licenses/by/4.0/).
Share and Cite
Ivanova, L.; Fæste, C.K.; Solhaug, A. Atlantic Salmon Gill Epithelial Cell Line (ASG-10) as a Suitable Model for Xenobiotic Biotransformation. Metabolites 2023, 13, 771. https://doi.org/10.3390/metabo13060771
Ivanova L, Fæste CK, Solhaug A. Atlantic Salmon Gill Epithelial Cell Line (ASG-10) as a Suitable Model for Xenobiotic Biotransformation. Metabolites. 2023; 13(6):771. https://doi.org/10.3390/metabo13060771
Chicago/Turabian StyleIvanova, Lada, Christiane Kruse Fæste, and Anita Solhaug. 2023. "Atlantic Salmon Gill Epithelial Cell Line (ASG-10) as a Suitable Model for Xenobiotic Biotransformation" Metabolites 13, no. 6: 771. https://doi.org/10.3390/metabo13060771
APA StyleIvanova, L., Fæste, C. K., & Solhaug, A. (2023). Atlantic Salmon Gill Epithelial Cell Line (ASG-10) as a Suitable Model for Xenobiotic Biotransformation. Metabolites, 13(6), 771. https://doi.org/10.3390/metabo13060771