Abstract
In this study, we obtained a lipidomic profile of plasma samples from drug-naïve patients with schizophrenia (SZ) and bipolar disorder (BD) in comparison to healthy controls. The sample cohort consisted of 30 BD and 30 SZ patients and 30 control individuals. An untargeted lipidomics strategy using liquid chromatography coupled with high-resolution mass spectrometry was employed to obtain the lipid profiles. Data were preprocessed, then univariate (t-test) and multivariate (principal component analysis and orthogonal partial least squares discriminant analysis) statistical tools were applied to select differential lipids, which were putatively identified. Afterward, multivariate receiver operating characteristic tests were performed, and metabolic pathway networks were constructed, considering the differential lipids. Our results demonstrate alterations in distinct lipid pathways, especially in glycerophospholipids, sphingolipids and glycerolipids, between SZ and BD patients. The results obtained in this study may serve as a basis for differential diagnosis, which is crucial for effective treatment and improving the quality of life of patients with psychotic disorders.
1. Introduction
Bipolar disorder (BD) is a severe psychiatric illness characterized by alternating mood states of mania, hypomania, depression and/or major depression, as well as mixed states [1]. BD affects more than 1% of the global population, irrespective of country of origin, ethnicity, or level of socioeconomic development [2,3]. The diagnosis of the disease is carried out, essentially, through a directed interview with the patient and family members based on the DSM-5 [4] and the International Statistical Classification of Diseases and Related Health Problems (ICD) [5]. At the beginning of the disease, most patients with BD have a depressive episode that subtly differs from unipolar depression [6], which makes the differential diagnosis very difficult and subjective. Only a small portion of patients with BD in a depressive state are correctly diagnosed during the first year and seek treatment, which can lead to disease progression and patient disability [1,2,7].
Schizophrenia (SZ) is a very severe, complex and disabling psychiatric illness characterized by profound cognitive, behavioral and emotional dysfunctions [8,9]. SZ affects about 1% of the world population, affecting men and women in a similar way [4]. No differences were found in the prevalence of the disease related to ethnicity [10]. The diagnosis of SZ depends on the correct interpretation of the patient report; however, due to the disease heterogeneous symptoms presentation and occurrence, differential diagnosis can be challenging [4,11].
Several studies employing the lipidomics strategy suggested a strong influence of lipid metabolism in the mechanism of BD and SZ [12,13,14,15,16,17]. As an example, it has been observed that certain abnormalities in phospholipid metabolism are strongly associated with SZ [18,19] and that the concentration of omega-3 polyunsaturated fatty acids is lower in individuals with SZ and BD, suggesting potential therapeutic approaches [18,20,21]. It is important to mention that currently, there are no biomarkers that have been approved for the diagnosis of any mental disorder [22,23,24]. Because omic sciences employ a comprehensive approach to the analysis of biomolecules that compose a biological sample, carrying out such studies on these psychiatric diseases is of great importance, especially for the discovery of potential biomarkers that aim at the development of new diagnostic tools [25,26].
Considering the above-mentioned information, the objective of the present study was to perform an untargeted lipidomics analysis of blood plasma samples from healthy individuals and drug-naïve BD and SZ patients in order to examine their lipid profiles and to analyze the correlation of statistically differential lipids with the diseases. These results can contribute toward the identification of potential biomarkers and may help further studies on the diagnosis of BD and SZ and the development of novel treatments.
2. Material and Methods
2.1. Sample and Clinical Assessments
This open-label study was conducted at the Institute of Psychiatry, University of Sao Paulo, Brazil. The sample consisted of 60 drug-naïve patients (30 SZ and 30 BD) and 30 healthy controls (CT). All participants were under 60 years old and were middle-income, community-dwelling subjects from the hospital catchment area. SZ diagnosis was established according to the Diagnostic and Statistical Manual of Mental Disorders (DSM-IV) [27], and SCID-I/P-Structured Clinical Interview Disorders Axis I for DSM-IV version 2.0 [28] was used to confirm the diagnosis. Psychopathology was assessed using the Positive and Negative Symptoms Scale (PANSS) [29], including the positive and negative subscales and general psychopathology. Depressive and manic symptoms were assessed for BD patients by the Hamilton Depression Rating Scale (HAM-D) [30] and Young’s Mania Rating Scale (YMRS) [31]. Subjects with other psychiatric or neurological disorders were excluded.
The sociodemographic characteristics of the patients and controls are summarized in Table 1.

Table 1.
Socio-demographic characteristics of patients and controls included in the study.
2.2. Chemicals
High-purity methyl-tert-butyl-ether (MTBE), methanol and ammonium acetate were purchased from Sigma Aldrich (Steinheim, Germany). LC-MS grade acetonitrile (ACN), isopropanol (IPA), ammonium formate and formic acid were also purchased from Sigma Aldrich.
2.3. Sample Collection and Preparation
Blood samples of all subjects were collected in EDTA-coated tubes (BD Vacutainer®, Becton Dickinson, Franklin Lakes, NJ, USA) for plasma metabolite determination after 8 h of fasting. All samples were immediately centrifuged at 20 °C at 1800× g for 15 min. The plasma was transferred to a new tube and stored at −80 °C until further processing without previous freeze–thawing.
Plasma lipids were extracted using the SIMPLEX method [32]. Briefly, the plasma samples were incubated with cold methanol and MTBE, followed by the addition of a 0.1% (m/v) ammonium acetate solution to induce phase separation. The supernatant containing lipids was collected, and the solvents were removed with a vacuum concentrator (Eppendorf, Hamburg, Germany) in a vacuum-high vapor (V-HV) mode at 30 °C for 2 h. Microtubes with the extracted lipids were stored at −80 °C prior to lipidomics analysis. The sample collection and preparation procedures were identical for all samples.
2.4. Lipidomics Analysis
Untargeted lipidomics analyses using ultra-high performance liquid chromatography coupled to mass spectrometry (UHPLC-MS) were performed on an UltiMate 3000 UHPLC system (Thermo Fisher Scientific, Waltham, MA, USA) coupled to a QExactive Orbitrap mass spectrometer (Thermo Fisher Scientific). The chromatographic separation was conducted on an ACQUITY CSH C18 (2.1 × 100 mm, 1.7 μm) column (Waters, Milford, MA, USA), and the temperature of the column oven was set to 55 °C. The mobile phase A consisted of an ACN:water mixture (60:40) with 1 mmol/L ammonium formate and 0.1% (v/v) formic acid, and the mobile phase B consisted of an IPA:ACN mixture (90:10) with 1 mmol/L ammonium formate and 0.1% (v/v) formic acid. The flow rate was set to 0.4 mL/min, and the injection volume was 5 μL for each sample. The gradient elution program consisted of a first linear gradient from solvent (A/B: 60/40) to solvent (A/B: 57/43) over 2 min; a rapid increase in the solvent (A/B: 50/50); a second linear gradient to the solvent (A/B: 46/54) over 10 min; a rapid increase to solvent (A/B: 30/70); a third linear gradient to solvent (A/B: 1/99) over 6 min; a rapid decrease to solvent (A/B: 60/40); and finally, an isocratic elution of the solvent (A/B: 60/40) for 2 min. The column was equilibrated with solvent (A/B: 60/40) for 5 min before reuse. The total run time was 25 min for each analysis.
MS scans were acquired in the electrospray ionization (ESI) negative mode from m/z 100 to 1500 with a resolution of 70,000. MS target values and maximum injection time were 3 × 10⁶ ions and 200 ms, respectively. Samples were randomized prior to analysis to reduce the impact of small variations in instrument sensitivity during the measurements. In order to verify system stability, quality control (QC) samples were injected at the start and at the end of a run, and after every 10th sample.
2.5. Data Processing and Statistical Analysis
The .raw files were converted to .mzML with MSConvert software (ProteoWizard, Palo Alto, CA, USA). Using RStudio (RStudio, Boston, MA, USA), the parameters for data processing with the ‘xcms’ package [33] were optimized with the ‘IPO’ package [34] based on QC samples. With the optimized parameters, all the files were processed with ‘xcms’ and, afterward, the data were organized in a peak list with the ‘CAMERA’ package [35], followed by the median fold change normalization [36].
Statistical analysis was carried out in the online platform MetaboAnalyst 5.0 (https://www.metaboanalyst.ca; accessed on 24 January 2022) [37]. The resulting peak list was checked for missing values, and features were filtered if their relative standard deviation (RSD) were higher than 20% in QC samples. The filtered dataset was submitted to logarithmic transformation and Pareto scaling, followed by uni- and multivariate analyses. The univariate analysis consisted of a t-test, and the multivariate analyses consisted of principal component analysis (PCA) and orthogonal partial least squares discriminant analysis (OPLS-DA).
The differential features indicated by both uni- and multivariate analyses were putatively identified with the CEU Mass Mediator platform (http://ceumass.eps.uspceu.es/index.xhtml; accessed on 19 September 2022) [38,39] based on the experimental mass-to-charge ratios (m/z), considering HCOO− to be a modifier and [M−H]−, [M+Cl]−, [M+HCOOH−H]−, [M−H−H2O]−, [M−H+HCOONa]−, [2M−H]−, [3M−H]−, [M−2H]2−, [M−3H]3− and [2M+HCOOH−H]− as the potential adducts, with a 10 ppm tolerance. The metabolites were filtered to show only lipids, and all the databases available, except MINE (database composed only of in silico compounds), were used.
Multivariate receiver operating characteristic (ROC) tests were performed in MetaboAnalyst 5.0 with the putatively annotated lipids for each pairwise comparison to ensure that the identified lipids could be considered potential biomarkers (features that did not obtain a match in the putative identification were excluded). MetaboAnalyst 5.0 used Monte-Carlo cross-validation (MCCV) and balanced sub-sampling to generate ROC curves.
Metabolic pathway analysis was performed in Cytoscape [40] using the MetScape plugin [41] and the Correlation Calculator Java application [42]. In order to be able to obtain more comprehensive pathway networks, it was necessary to use more general names for some of the putatively identified lipids when a KEGG compound entry was not available for the specific name (e.g., “sphingomyelin” instead of “sphingomyelin 41:1;O2” or “SM 41:1;O2”). Analogous to ROC tests, features that did not obtain a match in the putative identification were not included. The lipidomics datasets supporting the conclusions of this article were deposited and processed at Metabolomics Workbench [43], with the identifier PR001646 (Study ID ST002554).
3. Results
3.1. Selection of Potential Lipid Biomarkers
The PCA scores plot that included BD, SZ and CT groups and QC samples are displayed in Figure 1A. QC samples (dark blue) clustered together around the origin, demonstrating that the quality of UHPLC-MS data for this study was satisfactory. Figure 1B–D presents the PCA score plots for BD×CT, SZ×CT, and BD×SZ, respectively. It is noticeable that there was no clear group separation for the three paired comparisons. Despite the overlapping of the three studied groups, SZ group samples were less dispersed than BD and CT (Figure 1A,C,D), presenting a higher similarity among the samples.
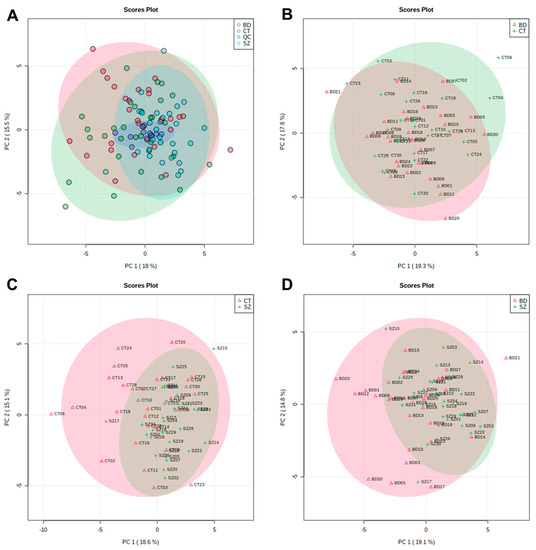
Figure 1.
PC1 vs. PC2 scores plot from the PCA of: (A) CT, BD, and SZ groups with QCs; (B) BD×CT, (C) SZ×CT, and (D) BD×SZ.
Most of the samples scattered in Figure 1 fell into the 95% confidence interval. Samples that fell out of the 95% confidence interval were deemed potential outliers and had their influence on the quality of the analysis evaluated. Whereas neither the PCA clustering nor the OPLS-DA models performance improved considerably with the removal of these samples, they were kept so as not to influence the sample size.
Figures S1–S3 present graphs of the data normalization results, where it was possible to observe that the data distributions were not normal, even after data pretreatment. For this reason, a non-parametric t-test (Wilcoxon test) was performed for all three group paired comparisons (BD×CT, SZ×CT, and BD×SZ), considering a p-value < 0.05. For BD×CT, no significant features were identified, while for SZ×CT, the Wilcoxon test indicated 49 significant features, and for BD×SZ, 28 significant features were identified. The tables containing the significant features identified by the univariate analysis can be found in the Supplementary Material (Tables S1 and S2).
The supervised models were also used to investigate if there were significant features that differentiated the groups, which were conducted considering the VIP scores, deeming significant features with a VIP score > 1.0. The OPLS-DA scores plot presented clustering between the SZ and CT groups (Figure 2B). For the other two comparisons, a better clustering tendency was observed between the BD and CT groups (Figure 2A) than between BD and SZ (Figure 2C), and overall, they presented less overlapping when compared to the PCA score plots (Figure 1B–D).
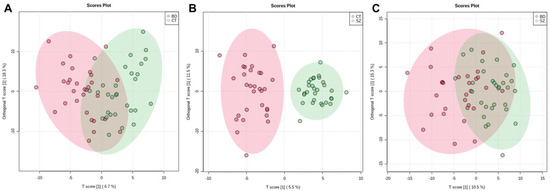
Figure 2.
OPLS-DA scores plot for the comparisons between: (A) BD×CT, (B) SZ×CT, and (C) BD×SZ.
Considering the predictive and orthogonal components, respectively, the OPLS-DA indicated: 139 and 154 significant features for the analysis between BD×CT (Table S3), 121 and 196 significant features for SZ×CT (Table S4), and 130 and 159 significant features for BD×SZ (Table S5). Because the univariate analysis did not identify any significant features for BD×CT, the feature selection for this comparison occurred only with those identified by OPLS-DA, totaling 116 features, which were described in Table S6 with their respective putative identifications. Between SZ×CT, 49 features were selected by both univariate and multivariate analyses, which can be found in Table S7, along with their putative identifications. Table S8 contains 28 features selected by uni- and multivariate analyses of the BD×SZ comparison and their putative identifications. Table 2 displays the prediction parameters for the OPLS-DA models. Although the SZ×CT OPLS-DA model presented a superior performance than the others, they performed poorly overall as prediction models.
Table 2.
OPLS-DA prediction parameters. R2X and R2Y represent the explained sum of squares for X and Y of the OPLS-DA model and Q2 indicates the prediction ability of the model.
Figure 3 presents a heatmap of the comparison of the main lipid species across the studied groups, i.e., the lipids common among the three pairwise comparisons. Generally, the SZ group presented lower relative concentrations for most of the lipid species when compared to BD and CT. When evaluating the lipid species with a higher mean intensity in SZ than in the CT group, we observed that glycerophospholipids (GP), particularly LPC 16:0, sphingolipids (SP), such as glycosphingolipids and ceramides, several types of sterol lipids (ST), and fatty acids (FA) were on the top of the list. When examining those with a lower average intensity, most of the lipid species were SP, predominantly sphingomyelins; glycerolipids (GL), such as triacylglycerols, as well as some species of GP and ST. By contrast, SP presented lower average intensities for the BD group when compared to CT, alongside some FA species. Oppositely to SZ, the BD group presented higher average intensities for GL, such as triacylglycerides, and SP, mostly sphingomyelins, when compared to the CT group, as well as some species of GP, FA, and ST, such as a vitamin D3 derivative.
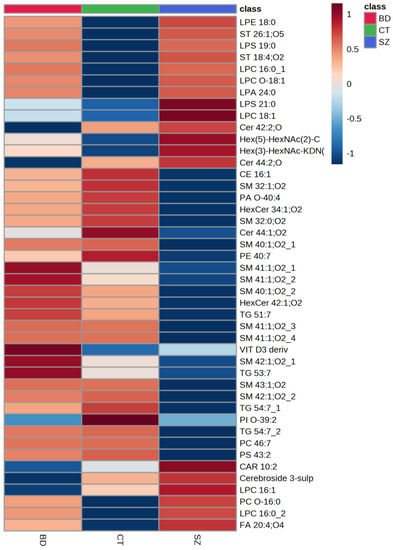
Figure 3.
Comparison of the main lipid species across the studied groups. The heatmap presents the average intensities of important lipid features according to ANOVA compared with the studied groups.
3.2. Differential Lipids and Potentially Altered Biochemical Pathways
Differential lipids (DLs), i.e., the differential features that held a putative annotation, which shared the same lipid class for each comparison, were grouped and plotted on the graphs displayed in Figure 4. GP and SP made up most of the DLs between BD and CT groups (Figure 4A), followed by ST, FA, and GL. With a slightly higher fraction of GL, the DLs of the SZ×CT comparison followed a similar pattern (Figure 4B). When comparing BD×SZ, however, DLs were mostly SP (Figure 4C), followed by GL and GP at equal proportions, and ST and FA in lower amounts.
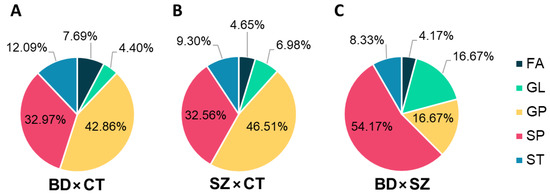
Figure 4.
Distribution of lipid classes in the differential lipids identified for (A) BD×CT, (B) SZ×CT, and (C) BD×SZ comparisons. FA, fatty acyls; GL, glycerolipids; GP, glycerophospholipids; SP, sphingolipids; ST, sterol lipids.
In order to assess if the putatively identified lipids could be considered potential biomarkers, multivariate ROC tests were performed, and the results are displayed in Figure 5. The BD×CT model (Figure 5A) presented an area under the curve (AUC) of 0.735 (0.552–0.895 with 95% confidence interval), 76.67% of sensitivity (Sens), 66.67% of specificity (Spec) and 71.67% of accuracy (Acc). SZ×CT model (Figure 5B) presented AUC = 0.865 (0.725–0.988 with 95% confidence interval), Sens = 83.33%, Spec = 73.33% and Acc = 78.33%. BD×SZ model (Figure 5C) presented AUC = 0.804 (0.615–0.981 with 95% confidence interval), Sens = 70%, Spec = 73.33% and Acc = 71.67%. Overall, all 3 ROC curves presented good AUC values (close to 1.000), with the SZ×CT model reaching 0.988 at the 95% confidence interval. The models also presented adequate Sens, Spec and Acc parameters.
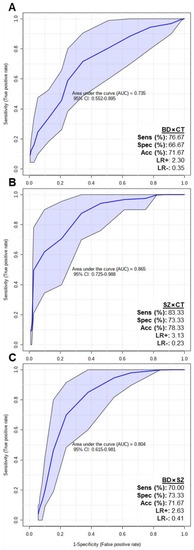
Figure 5.
Multivariate ROC test curves and figures of merit for (A) BD×CT, (B) SZ×CT, and (C) BD×SZ models. The ROC test classification method was PLS-DA and feature ranking method was PLS-DA built-in with 1 latent variable. The models were built with all the differential putatively identified lipids of each comparison: (A) BD×CT, 90 lipid species; (B) SZ×CT, 44 lipid species; and (C) BD×SZ, 23 lipid species. CI, confidence interval; Sens, sensitivity; Spec, specificity; Acc, accuracy; LR+, positive likelihood ratio; LR-, negative likelihood ratio.
Figure 6 presents the metabolic network that connects the potentially altered pathways to the DLs, providing a visual representation of these results. According to the metabolic pathways analysis of the DLs for BD×CT, the following pathways were possibly affected: androgen and estrogen biosynthesis and metabolism, bile acid biosynthesis, GP metabolism, glycosphingolipid (GSP) biosynthesis—globo series, GSP metabolism, linoleate metabolism, phosphatidylinositol phosphate metabolism, prostaglandin formation from arachidonate, and vitamin D3 metabolism. The reaction modules tables used to build the metabolic network in Figure 6 can be found in Tables S9 and S10.
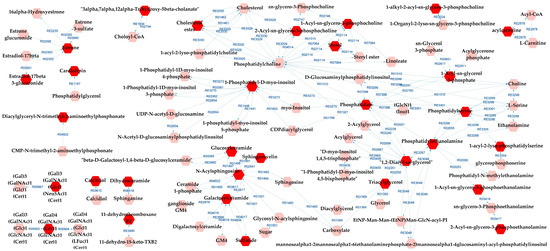
Figure 6.
Differential lipids (DLs)-based metabolic network linked with potentially altered metabolic pathways between BD and CT groups. The DLs are indicated by the bright red hexagons. Compounds in the pale red hexagons link the DLs with each other and/or show their relationship with a biochemical pathway to build the metabolic network.
Metabolic pathways analysis for SZ×CT revealed that most of the possibly altered pathways were identical to those for BD×CT, exceptions being prostaglandin formation from arachidonate and vitamin D3 metabolism (which did not appear), and GSP biosynthesis—ganglio series (that was not present for BD×CT). Similarly, Figure 7 presents the metabolic network resulting from the analysis. Tables S11 and S12 present the reaction modules tables used to build the metabolic network presented in Figure 7.
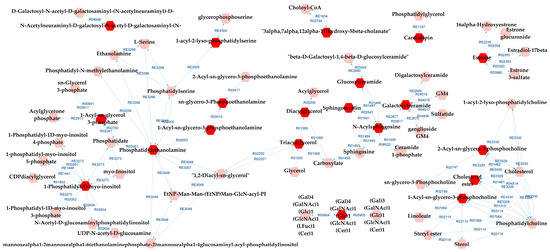
Figure 7.
Differential lipids (DLs)-based metabolic network linked with potentially altered metabolic pathways between SZ and CT groups. The DLs are indicated by the bright red hexagons. Compounds in the pale red hexagons link the DLs with each other and/or show their relationship with a biochemical pathway to build the metabolic network.
When comparing BD and SZ groups, GP metabolism, GSP metabolism, and linoleate metabolism also appeared as potentially affected metabolic pathways in relation to the DLs. In addition to them, arachidonic acid metabolism, lysine metabolism, and urea cycle and metabolism of arginine, proline, glutamate, aspartate, and asparagine were indicated by the metabolic pathways analysis. A complete metabolic network comprising the aforementioned pathways alongside the DLs is presented in Figure 8, and the reaction modules tables used to build the metabolic network displayed in Figure 8 can be found in Tables S13 and S14.
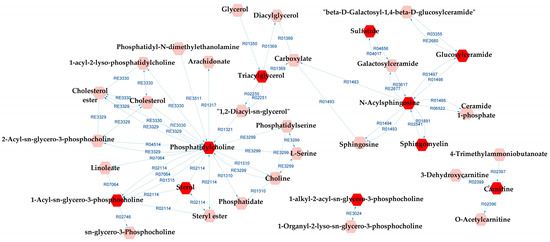
Figure 8.
Differential lipids (DLs)-based metabolic network linked with potentially altered metabolic pathways between BD and SZ groups. The DLs are indicated by the bright red hexagons. Compounds in the pale red hexagons link the DLs with each other and/or show their relationship with a biochemical pathway to build the metabolic network.
4. Discussion
In this study, our objective was to perform an untargeted lipidomics analysis of blood plasma samples from healthy individuals and drug-naïve BD and SZ patients. Our results of AUC values, alongside other metric figures, suggest that the putatively identified lipids performed well in differentiating the groups pairwise and, therefore, could function as potential biomarkers for BD and SZ. These results support the hypothesis that lipid alterations may be part of the core of changes in the central nervous system that occur in these disorders.
Since all psychiatric patients included in the study were drug-free and most likely early in their disease course, metabolic differences may not have been sufficiently pronounced to be detected by unsupervised multivariate statistical analysis. Despite this, our results demonstrate changes in different lipid pathways, such as glycerophospholipids, glycerolipids, and sphingolipids. Some metabolic pathways stood out in the differentiation of the studied groups. For example, vitamin D3 metabolism and prostaglandin formation from arachidonate were only altered when comparing BD and CT groups.
Plasma metabolites were increasingly investigated as potential biomarkers in psychiatry, offering a way to objectively measure the biochemical changes underlying mental disorders. Recent studies have suggested that certain plasma metabolites may be involved in psychiatric conditions such as depression [44], anxiety [45], bipolar disorder [46], and schizophrenia [47]. These metabolites can be used both in the early identification of psychiatric disorders and in monitoring the effectiveness of treatments, allowing for the personalized therapy of each patient. However, the use of plasma metabolites as biomarkers still faces challenges, such as the heterogeneity of psychiatric disorders and the lack of large-scale validation. The results presented herein help to fill the knowledge gap in the scientific literature by shedding light on some metabolic pathways that may differentiate psychiatric disorders in plasma.
It is believed that glycerophospholipid dysfunction is associated with changes in the activity of the enzyme phospholipase A2 (PLA2), which is responsible for breaking down glycerophospholipids into fatty acids and other lipids. It has been demonstrated that PLA2 activity is increased in SZ and BD and has an ultra-high risk (UHR) for psychosis patients [48,49,50,51,52,53]. In fact, studies have demonstrated a decrease in levels of phosphatidylcholine and sphingomyelin in the brain tissue of SZ patients, including the prefrontal cortex and hippocampus. These alterations appear to be related to changes in neuronal function and may be associated with symptoms of cognitive deficit and alterations in sensory perception [54,55,56]. Our results corroborate these findings since the SZ group presented a decrease in most lipid species, suggesting an increase in phospholipase metabolism in these patients. In BD, a decrease in the levels of phosphatidylethanolamine in the prefrontal cortex and amygdala and an increase in levels of phosphatidylcholine in the prefrontal cortex have been reported. These alterations also appear to be associated with changes in neuronal function and may contribute to affective and cognitive symptoms [57]. Similar results were not found in this study, which may be justified by our sample consisting of patients in the early stages of the disease.
Moreover, in line with our results, some studies found that metabolite levels related to the kynurenine pathway—marked by an increase in the kynurenine and a decrease in the production of the quinoline, which is involved in the metabolism of tryptophan—are different between SZ and BD [58,59]. Additionally, Lin et al. reported differences in the levels of certain glycerophospholipids in SZ patients plasma [60]. Other factors that can also influence the course of the disease, such as environmental factors, epigenetics and treatment, for example, cannot be ignored. Ribeiro et al. demonstrated that treated BD patients exhibited significant alterations in the levels of proteins and metabolites, which were related to blood coagulation and platelet function, suggesting that disturbances in the hemostatic system may be involved in the pathogenesis of BD [61]. In another study, it was demonstrated that treated patients with BD type I exhibited significant alterations in the levels of various lipids, including free fatty acids, ceramides, and phospholipids. Additionally, significant differences were found in the expression of certain genes involved in the synthesis and metabolism of lipids [62]. Therefore, all these findings suggest that lipid alterations were unquestionable, both in SZ and in BD.
The differential diagnosis is crucial in psychotic disorders, such as SZ and BD, because these diseases can share similar symptoms, such as hallucinations and delusions, but have different causes and treatments. An accurate diagnosis is essential for choosing the appropriate treatment and improving the quality of life of patients. The treatment of SZ usually involves antipsychotics, while the treatment of BD may involve mood stabilizers, antipsychotics, or antidepressants. These treatments may have different side effects and may be effective depending on the correct diagnosis. In addition, SZ and BD have different patterns of evolution and prognosis, which can influence treatment choices and the therapeutic approach. Therefore, it is essential to establish biomarkers that can differentiate these psychotic disorders.
Plasma lipids are a promising potential diagnostic tool for differentiating SZ and BD; however, this is still not a definitive and completely validated method and should be used in conjunction with other clinical assessments and diagnostic criteria. A limitation of this pioneer and exploratory work is that differential lipids were putatively identified. Hence, further studies employing a targeted lipidomics strategy are required to confirm their identities and validate the differential lipid profile of SZ and BD.
5. Conclusions
While the application of lipidomics in psychiatric disorders is still in its early stages, the results reported in this study suggest that alterations mainly in glycerophospholipids and sphingolipids levels may play an important role in the pathogenesis of schizophrenia and bipolar disorder. The identification of these metabolic alterations may aid in the development of new therapeutic approaches for the treatment of these complex mental disorders, in addition to the development of novel diagnostic tools. Nonetheless, validation through targeted lipidomics and further research are necessary to fully understand the implications of these metabolic alterations and how they can be used in the diagnosis and treatment of psychotic disorders.
Supplementary Materials
The following supporting information can be downloaded at: https://www.mdpi.com/article/10.3390/metabo13050600/s1, Figure S1: Data distribution before and after normalization for variables (top, referred as features) and samples (bottom) regarding the BD×CT comparison; Figure S2: Data distribution before and after normalization for variables (top, referred as features) and samples (bottom) regarding the SZ×CT comparison; Figure S3: Data distribution before and after normalization for variables (top, referred to as features) and samples (bottom) regarding the BD×SZ comparison. Table S1: List of significant features identified by the Wilcoxon test between SZ×CT, from lowest to highest p-value; Table S2: List of significant features identified by the Wilcoxon test between BD×SZ, from lowest to highest p-value; Table S3: List of significant features identified by OPLS-DA between BD and CT groups, in descending order of VIP scores; Table S4: List of significant features identified by OPLS-DA between CT and SZ groups, in descending order of VIP scores; Table S5: List of significant features identified by OPLS-DA between BD and SZ groups, in descending order of VIP scores; Table S6: Mass spectrometry characterization with theorical (Th) and experimental (Exp) masses with the m/z and putative identification for the significant features of the BD×CT comparison; Table S7: Mass spectrometry characterization with theorical (Th) and experimental (Exp) masses with the m/z and putative identification for the significant features of the SZ×CT comparison; Table S8: Mass spectrometry characterization with theorical (Th) and experimental (Exp) masses with the m/z and putative identification for the significant features of the BD×SZ comparison; Table S9: MetScape node table from the metabolic pathway analysis of the BD×CT comparison (related to Figure 6); Table S10: MetScape edge table from the metabolic pathway analysis of the BD×CT comparison (related to Figure 6); Table S11: MetScape node table from the metabolic pathway analysis of the SZ×CT comparison (related to Figure 7); Table S12: MetScape edge table from the metabolic pathway analysis of the SZ×CT comparison (related to Figure 7); Table S13: MetScape node table from the metabolic pathway analysis of the BD×SZ comparison (related to Figure 8); Table S14: MetScape edge table from the metabolic pathway analysis of the BD×SZ comparison (related to Figure 8).
Author Contributions
Conceptualization: A.S. and L.L.T.; methodology: A.C.C., L.B.R. and F.S.Z.; formal analysis: L.B.R. and F.S.Z.; resources: A.C.C.; writing—original draft preparation: A.C.C. and L.B.R.; writing—review and editing: A.S. and L.L.T.; supervision of patients: M.v.d.B. and W.F.G.; project administration: A.S. and L.L.T.; funding acquisition: A.S. and W.F.G. All authors have read and agreed to the published version of the manuscript.
Funding
This study was supported by the Fundação de Amparo à Pesquisa do Estado de São Paulo—FAPESP (grants 2017/26291-2 and 2018/01525-3), Instituto Nacional de Biomarcadores em Neuropsiquiatria (INBioN—FAPESP grant 2014/50873-3), Instituto Nacional de Ciência e Tecnologia de Bioanalítica (INCTBio—FAPESP grant 2014/50867-3), and Conselho Nacional de Desenvolvimento Científico e Tecnológico—CNPq (grant 306662/2022-1). The Laboratory of Neuroscience receives financial support from Associação Beneficente Alzira Denise Hertzog da Silva (ABADHS).
Institutional Review Board Statement
The study was conducted in accordance with the Declaration of Helsinki and was approved by the Local Ethics Committee of the University of Sao Paulo (CAPPesq number 943.883, 1 May 2015).
Informed Consent Statement
All subjects provided written informed consent prior to inclusion in the study.
Data Availability Statement
The data presented in this study are available in Metabolomics Workbench at http://dx.doi.org/10.21228/M8XX43 (accessed on 30 March 2023), reference number PR001646 (Study ID ST002554).
Acknowledgments
We would like to thank all the patients that participated in this study. Conselho Nacional de Desenvolvimento Científico e Tecnológico—CNPq—and Coordenação de Aperfeiçoamento de Pessoal de Nível Superior—CAPES—for L.B.R. and F.S.Z. scholarships.
Conflicts of Interest
The authors declare no conflict of interest.
References
- Grande, I.; Berk, M.; Birmaher, B.; Vieta, E. Bipolar disorder. Lancet 2016, 387, 1561–1572. [Google Scholar] [CrossRef] [PubMed]
- Alonso, J.; Petukhova, M.; Vilagut, G.; Chatterji, S.; Heeringa, S.; Üstün, T.B.; Al-Hamzawi, A.; Viana, M.C.; Angermeyer, M.; Bromet, E.; et al. Days out of role due to common physical and mental conditions: Results from the WHO World Mental Health surveys. Mol. Psychiatry 2011, 16, 1234–1246. [Google Scholar] [CrossRef] [PubMed]
- Rowland, T.A.; Marwaha, S. Epidemiology and risk factors for bipolar disorder. Ther. Adv. Psychopharmacol. 2018, 8, 251–269. [Google Scholar] [CrossRef] [PubMed]
- American Psychiatric Association (APA). DSM-5: Manual Diagnóstico e Estatístico de Transtornos Mentais; Artmed Editora Ltda: Porto Alegre, Brazil, 2014. [Google Scholar]
- WHO. ICD-10 Classification of Mental and Behavioural Disorders (the): Diagnostic Criteria for Research; World Health Organization: Geneva, Switzerland, 1993.
- Goodwin, G.M.; Anderson, I.; Arango, C.; Bowden, C.L.; Henry, C.; Mitchell, P.B.; Nolen, W.A.; Vieta, E.; Wittchen, H.-U. ECNP consensus meeting. Bipolar depression. Nice, March 2007. Eur. Neuropsychopharmacol. 2008, 18, 535–549. [Google Scholar] [CrossRef] [PubMed]
- Phillips, M.L.; Kupfer, D.J. Bipolar Disorder Diagnosis: Challenges and Future Directions. Lancet 2013, 381, 1663–1671. [Google Scholar] [CrossRef]
- Janoutová, J.; Janácková, P.; Serý, O.; Zeman, T.; Ambroz, P.; Kovalová, M.; Varechova, K.; Hosák, L.; Jirik, V.; Janout, V. Epidemiology and risk factors of schizophrenia. Neuro Endocrinol. Lett. 2016, 37, 1–8. [Google Scholar]
- Charlson, F.J.; Ferrari, A.J.; Santomauro, D.F.; Diminic, S.; Stockings, E.; Scott, J.G.; McGrath, J.; Whiteford, A.H. Global epidemiology and burden of schizophrenia: Findings from the global burden of disease study 2016. Schizophr. Bull. 2018, 44, 1195–1203. [Google Scholar] [CrossRef]
- Ayano, G. Bipolar disorder: A concise overview of etiology, epidemiology diagnosis and management: Review of literatures. SOJ Psychol. 2016, 3, 1–8. [Google Scholar] [CrossRef]
- Ayano, G. Schizophrenia: A concise overview of etiology, epidemiology diagnosis and management: Review of Literatures. J. Schizophr. Res. 2016, 3, 2–7. [Google Scholar]
- Brunkhorst-Kanaan, N.; Klatt-Schreiner, K.; Hackel, J.; Schröter, K.; Trautmann, S.; Hahnefeld, L.; Wicker, S.; Reif, A.; Thomas, D.; Geisslinger, G.; et al. Targeted lipidomics reveal derangement of ceramides in major depression and bipolar disorder. Metabolism 2019, 95, 65–76. [Google Scholar] [CrossRef]
- Ghosh, S.; Dyer, R.A.; Beasley, C.L. Evidence for altered cell membrane lipid composition in postmortem prefrontal white matter in bipolar disorder and schizophrenia. J. Psychiatr. Res. 2017, 95, 135–142. [Google Scholar] [CrossRef] [PubMed]
- Tasic, L.; Pontes, J.G.M.; Carvalho, M.S.; Cruz, G.; Dal Mas, C.; Sethi, S.; Pedrini, M.; Rizzo, L.B.; Zeni-Graiff, M.; Asevedo, E.; et al. Metabolomics and lipidomics analyses by 1H nuclear magnetic resonance of schizophrenia patient serum reveal potential peripheral biomarkers for diagnosis. Schizophr. Res. 2017, 185, 182–189. [Google Scholar] [CrossRef] [PubMed]
- Tessier, C.; Sweers, K.; Frajerman, A.; Bergaoui, H.; Ferreri, F.; Delva, C.; Lapidus, N.; Lamaziere, A.; Roiser, J.P.; De Hert, M.; et al. Membrane lipidomics in schizophrenia patients: A correlational study with clinical and cognitive manifestations. Transl. Psychiatry 2016, 6, e906. [Google Scholar] [CrossRef]
- Wang, F.; Guo, L.; Zhang, T.; Cui, Z.; Wang, J.; Zhang, C.; Xue, F.; Zhou, C.; Li, B.; Tan, Q.; et al. Alterations in plasma lipidomic profiles in adult patients with schizophrenia and major depressive disorder. Medicina 2022, 58, 1509. [Google Scholar] [CrossRef]
- Guo, L.; Zhang, T.; Li, R.; Cui, Z.-Q.; Du, J.; Yang, J.-B.; Xue, F.; Chen, Y.H.; Tan, Q.R.; Peng, Z.W. Alterations in the plasma lipidome of adult women with bipolar disorder: A mass spectrometry-based lipidomics research. Front. Psychiatry 2022, 13, 802710. [Google Scholar] [CrossRef] [PubMed]
- Adibhatla, R.M.; Hatcher, J.F. Role of lipids in brain injury and diseases. Future Lipidol. 2007, 2, 403–422. [Google Scholar] [CrossRef] [PubMed]
- Skinner, E.R. (Ed.) Brain Lipids and Disorders in Biological Psychiatry; Elsevier Science: London, UK, 2002; Volume 35. [Google Scholar]
- Balanzá-Martínez, V.; Fries, G.R.; Colpo, G.D.; Silveira, P.P.; Portella, A.K.; Tabarés-Seisdedos, R.; Kapczinski, F. Therapeutic Use of Omega-3 Fatty Acids in Bipolar Disorder. Expert Rev. Neurother. 2011, 11, 1029–1047. [Google Scholar] [CrossRef]
- McEvoy, J.; Baillie, R.A.; Zhu, H.; Buckley, P.; Keshavan, M.S.; Nasrallah, H.A.; Dougherty, G.G.; Yao, J.K.; Kaddurah-Daouk, R. Lipidomics reveals early metabolic changes in subjects with schizophrenia: Effects of atypical antipsychotics. PLoS ONE 2013, 8, e68717. [Google Scholar] [CrossRef]
- Teixeira, A.L.; Colpo, G.D.; Fries, G.R.; Bauer, I.E.; Selvaraj, S. Biomarkers for bipolar disorder: Current status and challenges ahead. Expert Rev. Neurother. 2019, 19, 67–81. [Google Scholar] [CrossRef]
- Yuan, N.; Chen, Y.; Xia, Y.; Dai, J.; Liu, C. Inflammation-related biomarkers in major psychiatric disorders: A cross-disorder assessment of reproducibility and specificity in 43 meta-analyses. Transl. Psychiatry 2019, 9, 233. [Google Scholar] [CrossRef]
- Quintero, M.; Stanisic, D.; Cruz, G.; Pontes, J.G.M.; Costa, T.B.B.C.; Tasic, L. Metabolomic biomarkers in mental disorders: Bipolar disorder and schizophrenia. Adv. Exp. Med. Biol. 2019, 1118, 271–293. [Google Scholar] [PubMed]
- Brand, S.J.; Moller, M.; Harvey, B.H. A review of biomarkers in mood and psychotic disorders: A dissection of clinical vs. Preclinical correlates. Curr. Neuropharmacol. 2015, 13, 324–368. [Google Scholar] [CrossRef] [PubMed]
- Sethi, S.; Brietzke, E. Omics-Based Biomarkers: Application of Metabolomics in Neuropsychiatric Disorders. Int. J. Neuropsychopharmacol. 2015, 19, yv096. [Google Scholar] [CrossRef] [PubMed]
- Bell, C.C. DSM-IV: Diagnostic and statistical manual of mental disorders. JAMA 1994, 272, 828. [Google Scholar] [CrossRef]
- Gorgens, K.A. Structured clinical interview for DSM-IV (SCID-I/SCID-II). In Encyclopedia of Clinical Neuropsychology; Springer: New York, NY, USA, 2011; pp. 2410–2417. [Google Scholar]
- Kay, S.R.; Fiszbein, A.; Opler, L.A. The positive and negative syndrome scale (PANSS) for schizophrenia. Schizophr. Bull. 1987, 13, 261–276. [Google Scholar] [CrossRef]
- Hamilton, M. A rating scale for depression. J. Neurol. Neurosurg. Psychiatry 1960, 23, 56–62. [Google Scholar] [CrossRef]
- Young, R.C.; Biggs, J.T.; Ziegler, V.E.; Meyer, D.A. A rating scale for mania: Reliability, validity and sensitivity. Br. J. Psychiatry 1978, 133, 429–435. [Google Scholar] [CrossRef]
- Coman, C.; Solari, F.A.; Hentschel, A.; Sickmann, A.; Zahedi, R.P.; Ahrends, R. Simultaneous metabolite, protein, lipid extraction (SIMPLEX): A combinatorial multimolecular omics approach for systems biology. Mol. Cell Proteom. 2016, 15, 1453–1466. [Google Scholar] [CrossRef]
- Smith, C.A.; Want, E.J.; O’Maille, G.; Abagyan, R.; Siuzdak, G. XCMS: Processing mass spectrometry data for metabolite profiling using nonlinear peak alignment, matching, and identification. Anal. Chem. 2006, 78, 779–787. [Google Scholar] [CrossRef]
- Libiseller, G.; Dvorzak, M.; Kleb, U.; Gander, E.; Eisenberg, T.; Madeo, F.; Neumann, S.; Trausinger, G.; Sinner, F.; Pieber, T.; et al. IPO: A tool for automated optimization of XCMS parameters. BMC Bioinform. 2015, 16, 118. [Google Scholar] [CrossRef]
- Kuhl, C.; Tautenhahn, R.; Böttcher, C.; Larson, T.R.; Neumann, S. CAMERA: An integrated strategy for compound spectra extraction and annotation of liquid chromatography/mass spectrometry data sets. Anal. Chem. 2012, 84, 283–289. [Google Scholar] [CrossRef] [PubMed]
- Veselkov, K.A.; Vingara, L.K.; Masson, P.; Robinette, S.L.; Want, E.; Li, J.V.; Barton, R.H.; Boursier-Neyret, C.; Walther, B.; Ebbels, T.M.; et al. Optimized preprocessing of ultra-performance liquid chromatography/mass spectrometry urinary metabolic profiles for improved information recovery. Anal. Chem. 2011, 83, 5864–5872. [Google Scholar] [CrossRef]
- Pang, Z.; Zhou, G.; Ewald, J.; Chang, L.; Hacariz, O.; Basu, N.; Xia, J. Using MetaboAnalyst 5.0 for LC-HRMS spectra processing, multi-omics integration and covariate adjustment of global metabolomics data. Nat. Protoc. 2022, 17, 1735–1761. [Google Scholar] [CrossRef]
- Gil de la Fuente, A.; Godzien, J.; Fernández López, M.; Rupérez, F.J.; Barbas, C.; Otero, A. Knowledge-based metabolite annotation tool: CEU Mass Mediator. J. Pharm. Biomed. Anal. 2018, 154, 138–149. [Google Scholar] [CrossRef] [PubMed]
- Gil-de-la-Fuente, A.; Godzien, J.; Saugar, S.; Garcia-Carmona, R.; Badran, H.; Wishart, D.S.; Barbas, C.; Otero, A. CEU mass mediator 3.0: A metabolite annotation tool. J. Proteome Res. 2019, 18, 797–802. [Google Scholar] [CrossRef]
- Shannon, P.; Markiel, A.; Ozier, O.; Baliga, N.S.; Wang, J.T.; Ramage, D.; Amin, N.; Schwikowski, B.; Ideker, T. Cytoscape: A software environment for integrated models of biomolecular interaction networks. Genome Res. 2003, 13, 2498–2504. [Google Scholar] [CrossRef]
- Gao, J.; Tarcea, V.G.; Karnovsky, A.; Mirel, B.R.; Weymouth, T.E.; Beecher, C.W.; Cavalcoli, J.D.; Athey, B.D.; Omenn, G.S.; Burant, C.F.; et al. Metscape: A Cytoscape plug-in for visualizing and interpreting metabolomic data in the context of human metabolic networks. Bioinformatics 2010, 26, 971–973. [Google Scholar] [CrossRef] [PubMed]
- Basu, S.; Duren, W.; Evans, C.R.; Burant, C.F.; Michailidis, G.; Karnovsky, A. Sparse network modeling and metscape-based visualization methods for the analysis of large-scale metabolomics data. Bioinformatics 2017, 33, 1545–1553. [Google Scholar] [CrossRef]
- Sud, M.; Fahy, E.; Cotter, D.; Azam, K.; Vadivelu, I.; Burant, C.; Edison, A.; Fiehn, O.; Higashi, R.; Nair, K.S. Metabolomics Workbench: An International Repository for Metabolomics Data and Metadata, Metabolite Standards, Protocols, Tutorials and Training, and Analysis Tools. Nucleic Acids Res. 2016, 44, D463–D470. [Google Scholar] [CrossRef]
- Liu, J.-C.; Yu, H.; Li, R.; Zhou, C.-H.; Shi, Q.-Q.; Guo, L.; He, H. A preliminary comparison of plasma tryptophan metabolites and medium- and long-chain fatty acids in adult patients with major depressive disorder and schizophrenia. Medicina 2023, 59, 413. [Google Scholar] [CrossRef]
- Burton, T.C.; Lv, N.; Tsai, P.; Peñalver Bernabé, B.; Tussing-Humphreys, L.; Xiao, L.; Pandey, G.N.; Wu, Y.; Ajilore, O.A.; Ma, J. Associations between fecal short-chain fatty acids, plasma inflammatory cytokines, and dietary markers with depression and anxiety: Post hoc analysis of the ENGAGE-2 pilot trial. Am. J. Clin. Nutr. 2023, 117, 717–730. [Google Scholar] [CrossRef]
- Brum, M.; Nieberler, M.; Kehrwald, C.; Knopf, K.; Brunkhorst-Kanaan, N.; Etyemez, S.; Allers, K.A.; Bittner, R.A.; Slattery, D.A.; McNeill, R.V.; et al. Phase-and disorder-specific differences in peripheral metabolites of the kynurenine pathway in major depression, bipolar affective disorder and schizophrenia. World J. Biol. Psychiatry, 2023; 1–14, ahead of print. [Google Scholar] [CrossRef] [PubMed]
- Costa, A.C.; Joaquim, H.P.G.; Talib, L.L.; Serpa, M.H.; Zanetti, M.V.; Gattaz, W.F. Plasma metabolites in first episode psychoses. Schizophr. Res. 2019, 206, 468–470. [Google Scholar] [CrossRef] [PubMed]
- Talib, L.L.; Costa, A.C.; Joaquim, H.P.G.; Pereira, C.A.C.; Van de Bilt, M.T.; Loch, A.A.; Gattaz, W.F. Increased PLA2 activity in individuals at ultra-high risk for psychosis. Eur. Arch. Psychiatry Clin. Neurosci. 2021, 271, 1593–1599. [Google Scholar] [CrossRef]
- Gattaz, W.F.; Köllisch, M.; Thuren, T.; Virtanen, J.A.; Kinnunen, P.K. Increased plasma phospholipase-A2 activity in schizophrenic patients: Reduction after neuroleptic therapy. Biol. Psychiatry 1987, 22, 421–426. [Google Scholar] [CrossRef]
- Gattaz, W.F.; Schmitt, A.; Maras, A. Increased platelet phospholipase A2 activity in schizophrenia. Schizophr. Res. 1995, 16, 1–6. [Google Scholar] [CrossRef]
- Gattaz, W.F.; Brunner, J.; Schmitt, A.; Maras, A. Accelerated breakdown of membrane phospholipids in schizophrenia-implications for the hypofrontality hypothesis. Fortschr. Neurol. Psychiatr. 1994, 62, 489–496. [Google Scholar] [CrossRef] [PubMed]
- Gattaz, W.F.; Valente, K.D.; Raposo, N.R.B.; Vincentiis, S.; Talib, L.L. Increased PLA2 activity in the hippocampus of patients with temporal lobe epilepsy and psychosis. J. Psychiatr. Res. 2011, 45, 1617–1620. [Google Scholar] [CrossRef]
- Smesny, S.; Milleit, B.; Hipler, U.-C.; Milleit, C.; Schäfer, M.R.; Klier, C.M.; Holub, M.; Holzer, I.; E Berger, G.; Otto, M.; et al. Omega-3 fatty acid supplementation changes intracellular phospholipase A2 activity and membrane fatty acid profiles in individuals at ultra-high risk for psychosis. Mol. Psychiatry 2014, 19, 317–324. [Google Scholar] [CrossRef]
- Yao, J.K.; Leonard, S.; Reddy, R.D. Membrane phospholipid abnormalities in postmortem brains from schizophrenic patients. Schizophr. Res. 2000, 42, 7–17. [Google Scholar] [CrossRef] [PubMed]
- Ross, B.M.; Seguin, J.; Sieswerda, L.E. Omega-3 fatty acids as treatments for mental illness: Which disorder and which fatty acid? Lipids Health Dis. 2007, 6, 21. [Google Scholar] [CrossRef] [PubMed]
- Arvindakshan, M.; Sitasawad, S.; Debsikdar, V.; Ghate, M.; Evans, D.; Horrobin, D.F.; Bennett, C.; Ranjekar, P.K.; Mahadik, S.P. Essential polyunsaturated fatty acid and lipid peroxide levels in never-medicated and medicated schizophrenia patients. Biol. Psychiatry 2003, 53, 56–64. [Google Scholar] [CrossRef]
- Harper, K.N.; Hibbeln, J.R.; Deckelbaum, R.; Quesenberry, C.P., Jr.; Schaefer, C.A.; Brown, A.S. Maternal serum docosahexaenoic acid and schizophrenia spectrum disorders in adult offspring. Schizophr. Res. 2011, 128, 30–36. [Google Scholar] [CrossRef] [PubMed]
- Chiappelli, J.; Pocivavsek, A.; Nugent, K.L.; Notarangelo, F.M.; Kochunov, P.; Rowland, L.M.; Schwarcz, R.; Hong, L.E. Stress-induced increase in kynurenic acid as a potential biomarker for patients with schizophrenia and distress intolerance. JAMA Psychiatry 2014, 71, 761–768. [Google Scholar] [CrossRef] [PubMed]
- Schwarcz, R.; Rassoulpour, A.; Wu, H.-Q.; Medoff, D.; Tamminga, C.A.; Roberts, R.C. Increased cortical kynurenate content in schizophrenia. Biol. Psychiatry 2001, 50, 521–530. [Google Scholar] [CrossRef]
- Lin, S.; Li, P.; Qin, J.; Liu, Q.; Zhang, J.; Meng, N.; Jia, C.; Zhu, K.; Lv, D.; Sun, L.; et al. Exploring the key factors of schizophrenia relapse by integrating LC-MS/1H NMR metabolomics and weighted correlation network analysis. Clin. Chim. Acta 2023, 541, 117252. [Google Scholar] [CrossRef]
- Ribeiro, H.C.; Sen, P.; Dickens, A.; Santa Cruz, E.C.; Orešič, M.; Sussulini, A. Metabolomic and proteomic profiling in bipolar disorder patients revealed potential molecular signatures related to hemostasis. Metabolomics 2022, 18, 65. [Google Scholar] [CrossRef]
- Ribeiro, H.C.; Klassen, A.; Pedrini, M.; Carvalho, M.S.; Rizzo, L.B.; Noto, M.N.; Zeni-Graiff, M.; Sethi, S.; Fonseca, F.A.; Tasic, L.; et al. A preliminary study of bipolar disorder type I by mass spectrometry-based serum lipidomics. Psychiatry Res. 2017, 258, 268–273. [Google Scholar] [CrossRef]


Disclaimer/Publisher’s Note: The statements, opinions and data contained in all publications are solely those of the individual author(s) and contributor(s) and not of MDPI and/or the editor(s). MDPI and/or the editor(s) disclaim responsibility for any injury to people or property resulting from any ideas, methods, instructions or products referred to in the content. |
© 2023 by the authors. Licensee MDPI, Basel, Switzerland. This article is an open access article distributed under the terms and conditions of the Creative Commons Attribution (CC BY) license (https://creativecommons.org/licenses/by/4.0/).