

Cerebrospinal Fluid Metabolomics: Pilot Study of Using Metabolomics to Assess Diet and Metabolic Interventions in Alzheimer’s Disease and Mild Cognitive Impairment
 ,
, 

 ,
,  and
and
Abstract
1. Introduction
2. Materials and Methods
2.1. Subjects
2.2. Infusion Intervention
2.3. Metabolomics Preparation and Statistical Analysis
3. Results
3.1. Demographics and Plasma Data
3.2. Baseline Metabolomic Findings
3.3. Effect of Intervention on Metabolites
4. Discussion
4.1. The Ketone Body HBA
4.2. APOE and Metabolites
4.3. Limitations
5. Conclusions
Supplementary Materials
Author Contributions
Funding
Institutional Review Board Statement
Informed Consent Statement
Data Availability Statement
Acknowledgments
Conflicts of Interest
References
- Gustaw-Rothenberg, K. Dietary patterns associated with Alzheimer’s disease: Population based study. Int. J. Environ. Res. Public Health 2009, 6, 1335–1340. [Google Scholar] [CrossRef] [PubMed]
- Solfrizzi, V.; Panza, F.; Frisardi, V.; Seripa, D.; Logroscino, G.; Imbimbo, B.P.; Pilotto, A. Diet and Alzheimer’s disease risk factors or prevention: The current evidence. Expert Rev. Neurother. 2011, 11, 677–708. [Google Scholar] [CrossRef] [PubMed]
- Cholerton, B.; Baker, L.D.; Craft, S. Insulin resistance and pathological brain ageing. Diabet. Med. 2011, 28, 1463–1475. [Google Scholar] [CrossRef] [PubMed]
- Julien, C.; Tremblay, C.; Phivilay, A.; Berthiaume, L.; Emond, V.; Julien, P.; Calon, F. High-fat diet aggravates amyloid-beta and tau pathologies in the 3xTg-AD mouse model. Neurobiol. Aging 2010, 31, 1516–1531. [Google Scholar] [CrossRef] [PubMed]
- Takechi, R.; Galloway, S.; Pallebage-Gamarallage, M.M.; Lam, V.; Mamo, J.C. Dietary fats, cerebrovasculature integrity and Alzheimer’s disease risk. Prog. Lipid Res. 2010, 49, 159–170. [Google Scholar] [CrossRef] [PubMed]
- Ho, L.; Qin, W.; Pompl, P.N.; Xiang, Z.; Wang, J.; Zhao, Z.; Peng, Y.; Cambareri, G.; Rocher, A.; Mobbs, C.V.; et al. Diet-induced insulin resistance promotes amyloidosis in a transgenic mouse model of Alzheimer’s disease. FASEB J. 2004, 18, 902–904. [Google Scholar] [CrossRef]
- Devaraj, S.; Wang-Polagruto, J.; Polagruto, J.; Keen, C.L.; Jialal, I. High-fat, energy-dense, fast-food-style breakfast results in an increase in oxidative stress in metabolic syndrome. Metabolism 2008, 57, 867–870. [Google Scholar] [CrossRef]
- Tsai, W.C.; Li, Y.H.; Lin, C.C.; Chao, T.H.; Chen, J.H. Effects of oxidative stress on endothelial function after a high-fat meal. Clin. Sci. 2004, 106, 315–319. [Google Scholar] [CrossRef]
- Papanikolaou, Y.; Palmer, H.; Binns, M.A.; Jenkins, D.J.; Greenwood, C.E. Better cognitive performance following a low-glycaemic-index compared with a high-glycaemic-index carbohydrate meal in adults with type 2 diabetes. Diabetologia 2006, 49, 855–862. [Google Scholar] [CrossRef]
- Boden, G.; Chen, X.; Ruiz, J.; White, J.V.; Rossetti, L. Mechanisms of fatty acid-induced inhibition of glucose uptake. J. Clin. Investig. 1994, 93, 2438–2446. [Google Scholar] [CrossRef]
- Emmanuel, Y.; Cochlin, L.E.; Tyler, D.J.; de Jager, C.A.; David Smith, A.; Clarke, K. Human hippocampal energy metabolism is impaired during cognitive activity in a lipid infusion model of insulin resistance. Brain Behav. 2013, 3, 134–144. [Google Scholar] [CrossRef]
- Hanson, A.J.; Banks, W.A.; Bettcher, L.F.; Pepin, R.; Raftery, D.; Craft, S. Cerebrospinal fluid lipidomics: Effects of an intravenous triglyceride infusion and apoE status. Metabolomics 2019, 16, 6. [Google Scholar] [CrossRef]
- Cunnane, S.C.; Trushina, E.; Morland, C.; Prigione, A.; Casadesus, G.; Andrews, Z.B.; Beal, M.F.; Bergersen, L.H.; Brinton, R.D.; de la Monte, S.; et al. Brain energy rescue: An emerging therapeutic concept for neurodegenerative disorders of ageing. Nat. Rev. Drug Discov. 2020, 19, 609–633. [Google Scholar] [CrossRef] [PubMed]
- Wishart, D.S.; Lewis, M.J.; Morrissey, J.A.; Flegel, M.D.; Jeroncic, K.; Xiong, Y.; Cheng, D.; Eisner, R.; Gautam, B.; Tzur, D.; et al. The human cerebrospinal fluid metabolome. J. Chromatogr. B Anal. Technol. Biomed. Life Sci. 2008, 871, 164–173. [Google Scholar] [CrossRef] [PubMed]
- Ibanez, C.; Simo, C.; Barupal, D.K.; Fiehn, O.; Kivipelto, M.; Cedazo-Minguez, A.; Cifuentes, A. A new metabolomic workflow for early detection of Alzheimer’s disease. J. Chromatogr. A 2013, 1302, 65–71. [Google Scholar] [CrossRef] [PubMed]
- Czech, C.; Berndt, P.; Busch, K.; Schmitz, O.; Wiemer, J.; Most, V.; Hampel, H.; Kastler, J.; Senn, H. Metabolite profiling of Alzheimer’s disease cerebrospinal fluid. PLoS ONE 2012, 7, e31501. [Google Scholar] [CrossRef] [PubMed]
- Hixson, J.E.; Vernier, D.T. Restriction isotyping of human apolipoprotein E by gene amplification and cleavage with HhaI. J. Lipid Res. 1990, 31, 545–548. [Google Scholar] [CrossRef]
- Skill, N.J.; Elliott, C.M.; Ceballos, B.; Saxena, R.; Pepin, R.; Bettcher, L.; Ellensberg, M.; Raftery, D.; Malucio, M.A.; Ekser, B.; et al. Metabolomic Characterization of Human Model of Liver Rejection Identifies Aberrancies Linked to Cyclooxygenase (COX) and Nitric Oxide Synthase (NOS). Ann. Transplant. 2019, 24, 341–349. [Google Scholar] [CrossRef]
- Zheng, C.; Gowda, G.A.N.; Raftery, D.; Neuhouser, M.L.; Tinker, L.F.; Prentice, R.L.; Beresford, S.A.A.; Zhang, Y.; Bettcher, L.; Pepin, R.; et al. Evaluation of potential metabolomic-based biomarkers of protein, carbohydrate and fat intakes using a controlled feeding study. Eur. J. Nutr. 2021, 60, 4207–4218. [Google Scholar] [CrossRef]
- Chong, J.; Soufan, O.; Li, C.; Caraus, I.; Li, S.; Bourque, G.; Wishart, D.S.; Xia, J. MetaboAnalyst 4.0: Towards more transparent and integrative metabolomics analysis. Nucleic Acids Res. 2018, 46, W486–W494. [Google Scholar] [CrossRef]
- Wishart, D.S.; Feunang, Y.D.; Marcu, A.; Guo, A.C.; Liang, K.; Vazquez-Fresno, R.; Sajed, T.; Johnson, D.; Li, C.; Karu, N.; et al. HMDB 4.0: The human metabolome database for 2018. Nucleic Acids Res. 2018, 46, D608–D617. [Google Scholar] [CrossRef] [PubMed]
- Navarro, S.L.; Tarkhan, A.; Shojaie, A.; Randolph, T.W.; Gu, H.; Djukovic, D.; Osterbauer, K.J.; Hullar, M.A.; Kratz, M.; Neuhouser, M.L.; et al. Plasma metabolomics profiles suggest beneficial effects of a low-glycemic load dietary pattern on inflammation and energy metabolism. Am. J. Clin. Nutr. 2019, 110, 984–992. [Google Scholar] [CrossRef] [PubMed]
- Trushina, E.; Dutta, T.; Persson, X.M.; Mielke, M.M.; Petersen, R.C. Identification of altered metabolic pathways in plasma and CSF in mild cognitive impairment and Alzheimer’s disease using metabolomics. PLoS ONE 2013, 8, e63644. [Google Scholar] [CrossRef] [PubMed]
- Weiss, N.; Barbier Saint Hilaire, P.; Colsch, B.; Isnard, F.; Attala, S.; Schaefer, A.; Amador, M.D.; Rudler, M.; Lamari, F.; Sedel, F.; et al. Cerebrospinal fluid metabolomics highlights dysregulation of energy metabolism in overt hepatic encephalopathy. J. Hepatol. 2016, 65, 1120–1130. [Google Scholar] [CrossRef]
- Tateishi, H.; Setoyama, D.; Kato, T.A.; Kang, D.; Matsushima, J.; Nogami, K.; Mawatari, S.; Kojima, R.; Fujii, Y.; Sakemura, Y.; et al. Changes in the metabolites of cerebrospinal fluid induced by rTMS in treatment-resistant depression: A pilot study. Psychiatry Res. 2022, 313, 114636. [Google Scholar] [CrossRef]
- Moaddel, R.; Zanos, P.; Farmer, C.A.; Kadriu, B.; Morris, P.J.; Lovett, J.; Acevedo-Diaz, E.E.; Cavanaugh, G.W.; Yuan, P.; Yavi, M.; et al. Comparative metabolomic analysis in plasma and cerebrospinal fluid of humans and in plasma and brain of mice following antidepressant-dose ketamine administration. Transl. Psychiatry 2022, 12, 179. [Google Scholar] [CrossRef]
- Cunnane, S.; Nugent, S.; Roy, M.; Courchesne-Loyer, A.; Croteau, E.; Tremblay, S.; Castellano, A.; Pifferi, F.; Bocti, C.; Paquet, N.; et al. Brain fuel metabolism, aging, and Alzheimer’s disease. Nutrition 2011, 27, 3–20. [Google Scholar] [CrossRef]
- Williams, H.C.; Piron, M.A.; Nation, G.K.; Walsh, A.E.; Young, L.E.A.; Sun, R.C.; Johnson, L.A. Oral Gavage Delivery of Stable Isotope Tracer for In Vivo Metabolomics. Metabolites 2020, 10, 501. [Google Scholar] [CrossRef]
- Li, Y.C.; Wang, R.; A, J.Y.; Sun, R.B.; Na, S.J.; Liu, T.; Ding, X.S.; Ge, W.H. Cerebrospinal fluid metabolic profiling reveals divergent modulation of pentose phosphate pathway by midazolam, propofol and dexmedetomidine in patients with subarachnoid hemorrhage: A cohort study. BMC Anesthesiol. 2022, 22, 34. [Google Scholar] [CrossRef]
- Reiman, E.M.; Chen, K.; Alexander, G.E.; Caselli, R.J.; Bandy, D.; Osborne, D.; Saunders, A.M.; Hardy, J. Correlations between apolipoprotein E epsilon4 gene dose and brain-imaging measurements of regional hypometabolism. Proc. Natl. Acad. Sci. USA 2005, 102, 8299–8302. [Google Scholar] [CrossRef]
- Farmer, B.C.; Williams, H.C.; Devanney, N.A.; Piron, M.A.; Nation, G.K.; Carter, D.J.; Walsh, A.E.; Khanal, R.; Young, L.E.A.; Kluemper, J.C.; et al. APOEpsilon4 lowers energy expenditure in females and impairs glucose oxidation by increasing flux through aerobic glycolysis. Mol. Neurodegener. 2021, 16, 62. [Google Scholar] [CrossRef] [PubMed]
- Harney, J.P.; Madara, J.; Madara, J.; I’Anson, H. Effects of acute inhibition of fatty acid oxidation on latency to seizure and concentrations of beta hydroxybutyrate in plasma of rats maintained on calorie restriction and/or the ketogenic diet. Epilepsy Res. 2002, 49, 239–246. [Google Scholar] [CrossRef] [PubMed]
- Yum, M.S.; Ko, T.S.; Kim, D.W. beta-Hydroxybutyrate increases the pilocarpine-induced seizure threshold in young mice. Brain Dev. 2012, 34, 181–184. [Google Scholar] [CrossRef] [PubMed]
- Bourassa, M.W.; Alim, I.; Bultman, S.J.; Ratan, R.R. Butyrate, neuroepigenetics and the gut microbiome: Can a high fiber diet improve brain health? Neurosci. Lett. 2016, 625, 56–63. [Google Scholar] [CrossRef] [PubMed]
- Versele, R.; Corsi, M.; Fuso, A.; Sevin, E.; Businaro, R.; Gosselet, F.; Fenart, L.; Candela, P. Ketone Bodies Promote Amyloid-beta(1–40) Clearance in a Human in Vitro Blood-Brain Barrier Model. Int. J. Mol. Sci. 2020, 21, 934. [Google Scholar] [CrossRef] [PubMed]
- Yang, X.; Wang, R.; Zhou, H.; Wang, L.; Wang, R.; Li, H.; Tan, B.; Wu, Q.; Xu, X.; Cui, L.; et al. beta-hydroxybutyrate Alleviates Learning and Memory Impairment Through the SIRT1 Pathway in D-Galactose-Injured Mice. Front. Pharmacol. 2021, 12, 751028. [Google Scholar] [CrossRef]
- Wang, Z.; Li, T.; Du, M.; Zhang, L.; Xu, L.; Song, H.; Zhang, J. beta-hydroxybutyrate improves cognitive impairment caused by chronic cerebral hypoperfusion via amelioration of neuroinflammation and blood-brain barrier damage. Brain Res. Bull. 2023, 193, 117–130. [Google Scholar] [CrossRef]
- Freemantle, E.; Vandal, M.; Tremblay Mercier, J.; Plourde, M.; Poirier, J.; Cunnane, S.C. Metabolic response to a ketogenic breakfast in the healthy elderly. J. Nutr. Health Aging 2009, 13, 293–298. [Google Scholar] [CrossRef]
- London, E.D.; Margolin, R.A.; Duara, R.; Holloway, H.W.; Robertson-Tchabo, E.A.; Cutler, N.R.; Rapoport, S.I. Effects of fasting on ketone body concentrations in healthy men of different ages. J. Gerontol. 1986, 41, 599–604. [Google Scholar] [CrossRef]
- Fortier, M.; Castellano, C.A.; Croteau, E.; Langlois, F.; Bocti, C.; St-Pierre, V.; Vandenberghe, C.; Bernier, M.; Roy, M.; Descoteaux, M.; et al. A ketogenic drink improves brain energy and some measures of cognition in mild cognitive impairment. Alzheimers Dement. 2019, 15, 625–634. [Google Scholar] [CrossRef]
- Neth, B.J.; Mintz, A.; Whitlow, C.; Jung, Y.; Solingapuram Sai, K.; Register, T.C.; Kellar, D.; Lockhart, S.N.; Hoscheidt, S.; Maldjian, J.; et al. Modified ketogenic diet is associated with improved cerebrospinal fluid biomarker profile, cerebral perfusion, and cerebral ketone body uptake in older adults at risk for Alzheimer’s disease: A pilot study. Neurobiol. Aging 2020, 86, 54–63. [Google Scholar] [CrossRef] [PubMed]
- Masuoka, N.; Yoshimine, C.; Hori, M.; Tanaka, M.; Asada, T.; Abe, K.; Hisatsune, T. Effects of Anserine/Carnosine Supplementation on Mild Cognitive Impairment with APOE4. Nutrients 2019, 11, 1626. [Google Scholar] [CrossRef] [PubMed]
- Gonzalez-Dominguez, R.; Castellano-Escuder, P.; Lefevre-Arbogast, S.; Low, D.Y.; Du Preez, A.; Ruigrok, S.R.; Lee, H.; Helmer, C.; Pallas, M.; Urpi-Sarda, M.; et al. Apolipoprotein E and sex modulate fatty acid metabolism in a prospective observational study of cognitive decline. Alzheimers Res. Ther. 2022, 14, 1. [Google Scholar] [CrossRef] [PubMed]


| All Subjects | CN | CI | T Test (Chi2) | |
|---|---|---|---|---|
| Number | 21 | 12 | 9 | |
| # Female | 10 | 7 | 3 | p = 0.26 |
| # E4 Pos | 8 | 4 | 4 | p = 0.6 |
| Age | 67.7 ± 8.6 | 65.3 ± 8.1 | 70.9 ± 8.6 | p = 0.14 |
| BMI (kg/m2) | 25.7 ± 4.0 | 24.9 ± 3.6 | 26.8 ± 4.4 | p = 0.29 |
| HDL (mg/dL) | 67.3 ± 19.1 | 70.9 ± 21.6 | 62.6 ± 14.8 | p = 0.33 |
| LDL (mg/dL) | 116 ± 20.7 | 108.4 ± 18.8 | 126.1 ± 19.5 | p = 0.049 |
| Triglyceride | 93.4 ± 33.2 | 97.8 ± 28.8 | 87.4 ± 39.5 | p = 0.49 |
| Glucose | 90.4 ± 7.4 | 88.6 ± 6.7 | 92.8 ± 7.9 | p = 0.20 |
| Metabolite | Scheme | TG | p Value | Pathway |
|---|---|---|---|---|
| HBA | 25.7 ± 17.6 | 45.6 ± 29.1 | 0.003 | TCA Cycle |
| Saline HBA | TG HBA | Change HBA (TG Minus Saline) | |
|---|---|---|---|
| Age | 0.53 (0.013) | 0.35 (0.12) | 0.028 (0.9) |
| Systolic BP | 0.12 (0.6) | 0.5 (0.02) | 0.46 (0.035) |
| Fasting plasma glucose | 0.24 (0.28) | 0.54 (0.012) | 0.42 (0.056) |
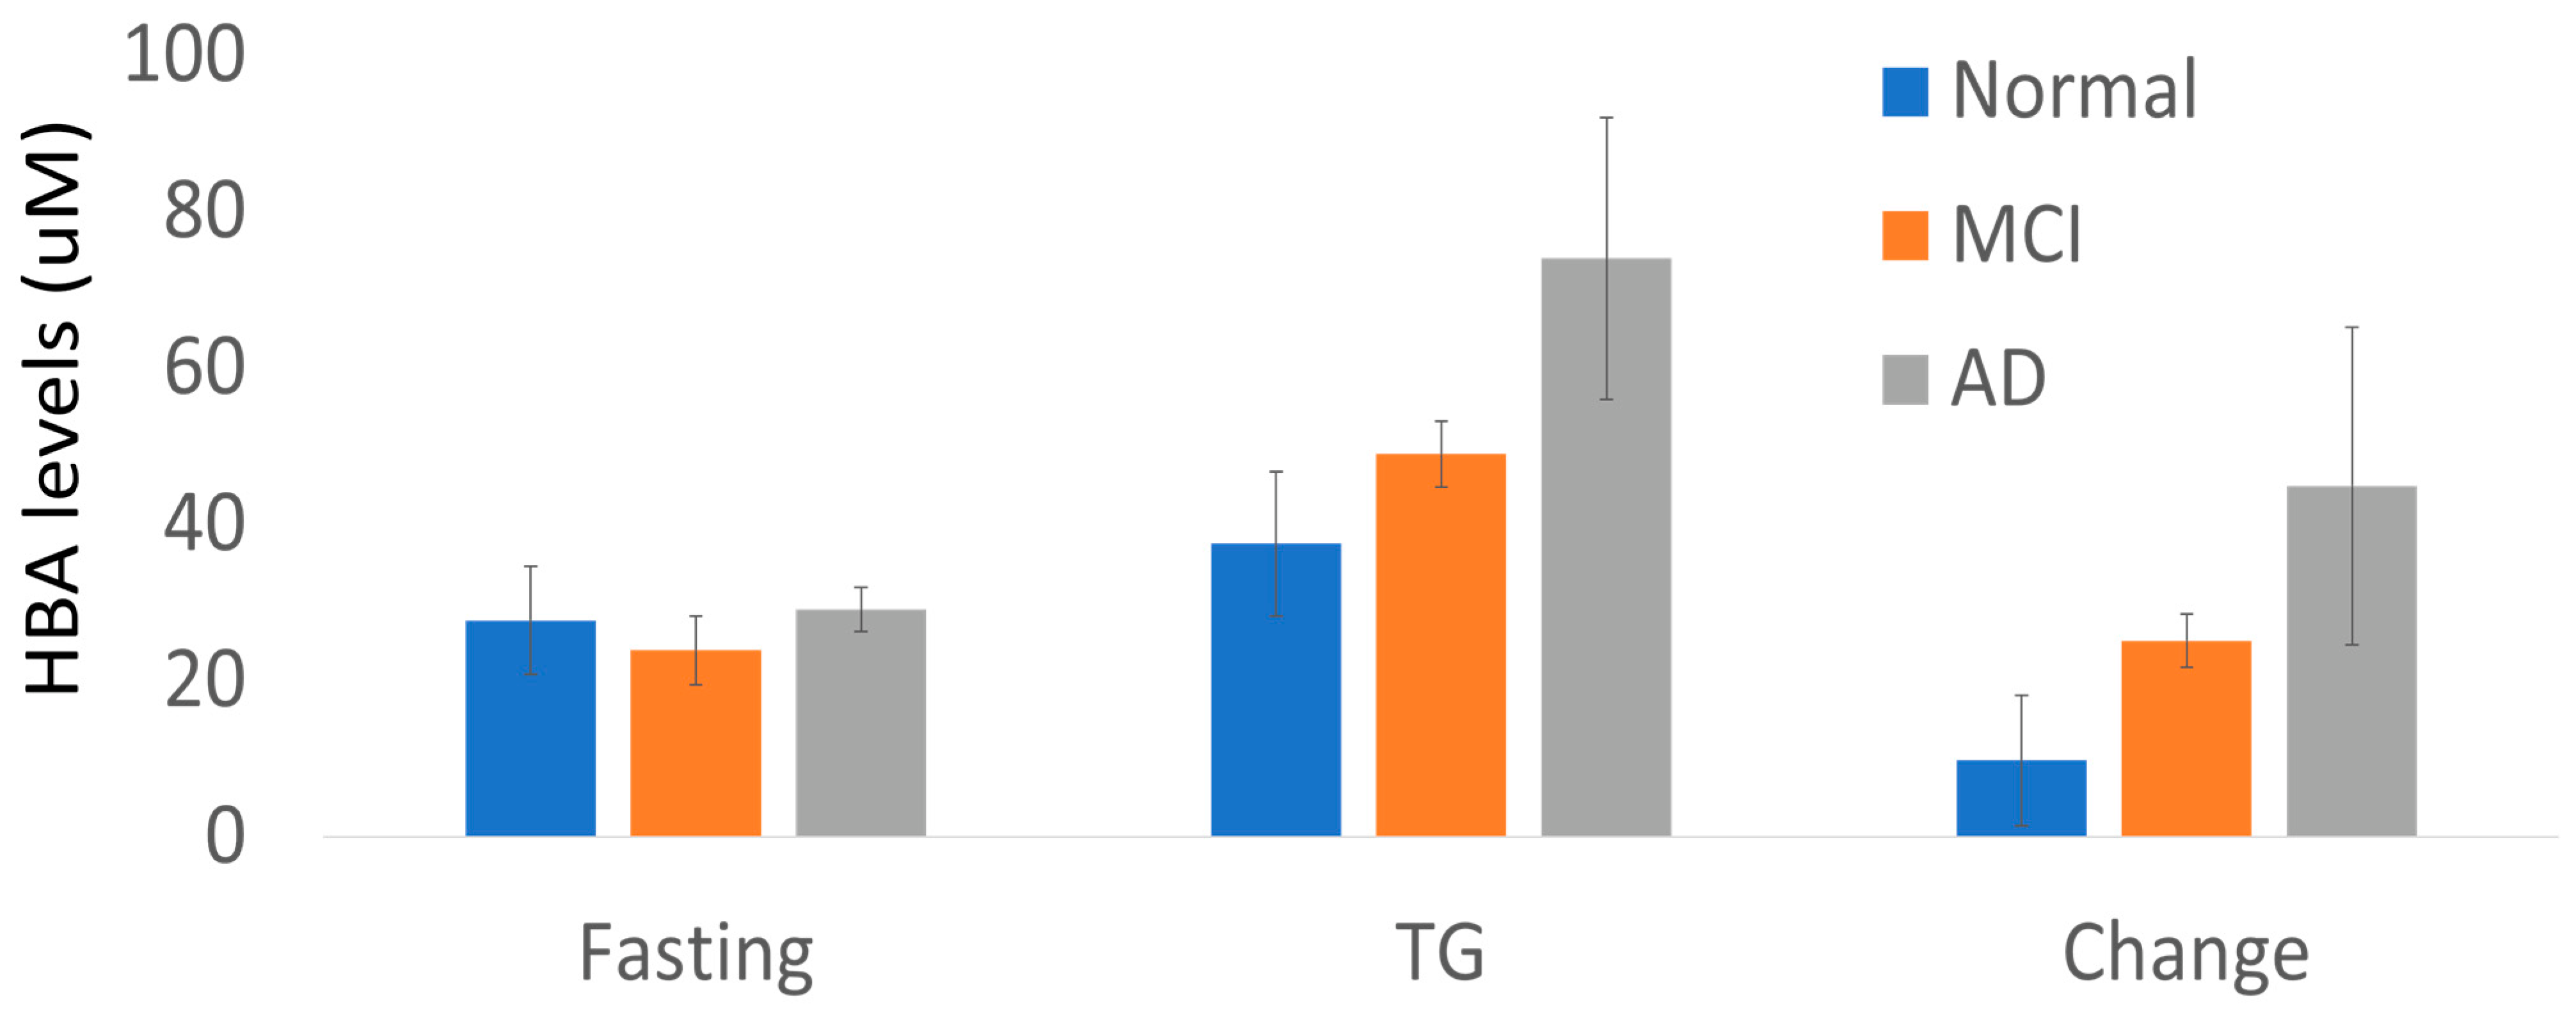
| Cog Dx | Fasting | TG | Change |
|---|---|---|---|
| CN (n = 12) | 27.7 ± 6.9 | 37.5 ± 9.2 | 9.8 ± 8.3 |
| Cog (n = 9) | 25.8 ± 3 | 58.2 ± 7.4 | 32.4 ± 7.4 |
| MCI (n = 6) | 23.9 ± 4.4 | 49 ± 4.2 | 25.1 ± 3.4 |
| AD (n = 3) | 29.1 ± 2.8 | 74 ± 18 | 44.9 ± 20.3 |
Disclaimer/Publisher’s Note: The statements, opinions and data contained in all publications are solely those of the individual author(s) and contributor(s) and not of MDPI and/or the editor(s). MDPI and/or the editor(s) disclaim responsibility for any injury to people or property resulting from any ideas, methods, instructions or products referred to in the content. |
© 2023 by the authors. Licensee MDPI, Basel, Switzerland. This article is an open access article distributed under the terms and conditions of the Creative Commons Attribution (CC BY) license (https://creativecommons.org/licenses/by/4.0/).
Share and Cite
Hanson, A.J.; Banks, W.A.; Bettcher, L.F.; Pepin, R.; Raftery, D.; Navarro, S.L.; Craft, S. Cerebrospinal Fluid Metabolomics: Pilot Study of Using Metabolomics to Assess Diet and Metabolic Interventions in Alzheimer’s Disease and Mild Cognitive Impairment. Metabolites 2023, 13, 569. https://doi.org/10.3390/metabo13040569
Hanson AJ, Banks WA, Bettcher LF, Pepin R, Raftery D, Navarro SL, Craft S. Cerebrospinal Fluid Metabolomics: Pilot Study of Using Metabolomics to Assess Diet and Metabolic Interventions in Alzheimer’s Disease and Mild Cognitive Impairment. Metabolites. 2023; 13(4):569. https://doi.org/10.3390/metabo13040569
Chicago/Turabian StyleHanson, Angela J., William A. Banks, Lisa F. Bettcher, Robert Pepin, Daniel Raftery, Sandi L. Navarro, and Suzanne Craft. 2023. "Cerebrospinal Fluid Metabolomics: Pilot Study of Using Metabolomics to Assess Diet and Metabolic Interventions in Alzheimer’s Disease and Mild Cognitive Impairment" Metabolites 13, no. 4: 569. https://doi.org/10.3390/metabo13040569
APA StyleHanson, A. J., Banks, W. A., Bettcher, L. F., Pepin, R., Raftery, D., Navarro, S. L., & Craft, S. (2023). Cerebrospinal Fluid Metabolomics: Pilot Study of Using Metabolomics to Assess Diet and Metabolic Interventions in Alzheimer’s Disease and Mild Cognitive Impairment. Metabolites, 13(4), 569. https://doi.org/10.3390/metabo13040569