


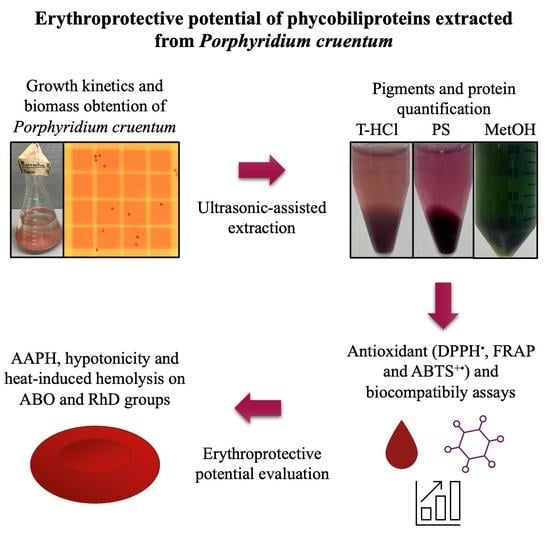
Erythroprotective Potential of Phycobiliproteins Extracted from Porphyridium cruentum

 ,
,  , , ,
, , ,
Abstract
1. Introduction

| ABO Group | Associated Disease | Reference |
|---|---|---|
| A | Breast cancer | [9] |
| Pancreatic cancer | [10] | |
| COVID-19 | [11] | |
| Cholelithiasis | [12] | |
| Thrombosis (pulmonary embolism and deep vein thrombosis) | [12] | |
| SARS | [1] | |
| B | Pancreatic cancer | [10] |
| Blood disorders (gastric ulcer and duodenal ulcer) | [12] | |
| Thyroid cancer | [12] | |
| Diabetes mellitus type 2 | [13] | |
| O | Thyrotoxicosis | [12] |
| Gestational hypertension | [12] | |
| Renal and ureteral calculi | [12] | |
| Blood disorders (gastric and duodenal ulcer) | [12] | |
| AB | Squamous cell carcinoma | [14] |
| Cholelithiasis | [12] | |
| Thyroid cancer | [12] | |
| Colorectal cancer | [15] |
| RhD Group | Associated Disease | Reference |
|---|---|---|
| Positive | Breast cancer | [9] |
| Gestational hypertension | [12] | |
| COVID-19 | [16] | |
| Negative | Small cell lung cancer | [17] |
2. Materials and Methods
2.1. Biological Material
2.2. Microalgal Culture and Experimental Design
2.3. Growth Kinetics
2.4. Phycobiliproteins Extraction
2.5. Pigments and Protein Quantification
2.6. Analysis of the Biological Activities of Phycobiliproteins
2.7. Determination of Antioxidant Activity
2.7.1. Inhibition Assay of 2,2′-azinobis-(3-ethylbenzothiazolin)-6-sulfonic acid Free Radical (ABTS+•)
2.7.2. Free Radical Inhibition Assay 1,1-diphenyl-2-picrylhydrazyl (DPPH•)
2.7.3. Ferric Ion Antioxidant Reducing Power (FRAP)
2.8. Biocompatibility Blood Assay
2.9. Evaluation of the Erythroprotective Potential
2.9.1. Antihemolytic Activity in Erythrocytes by the 2,2′-azobis-(2-methylpropionamidine) (AAPH) Method
2.9.2. Hypotonicity-Induced Hemolysis Assay
2.9.3. Heat-Induced Hemolysis Assay
3. Results and Discussion
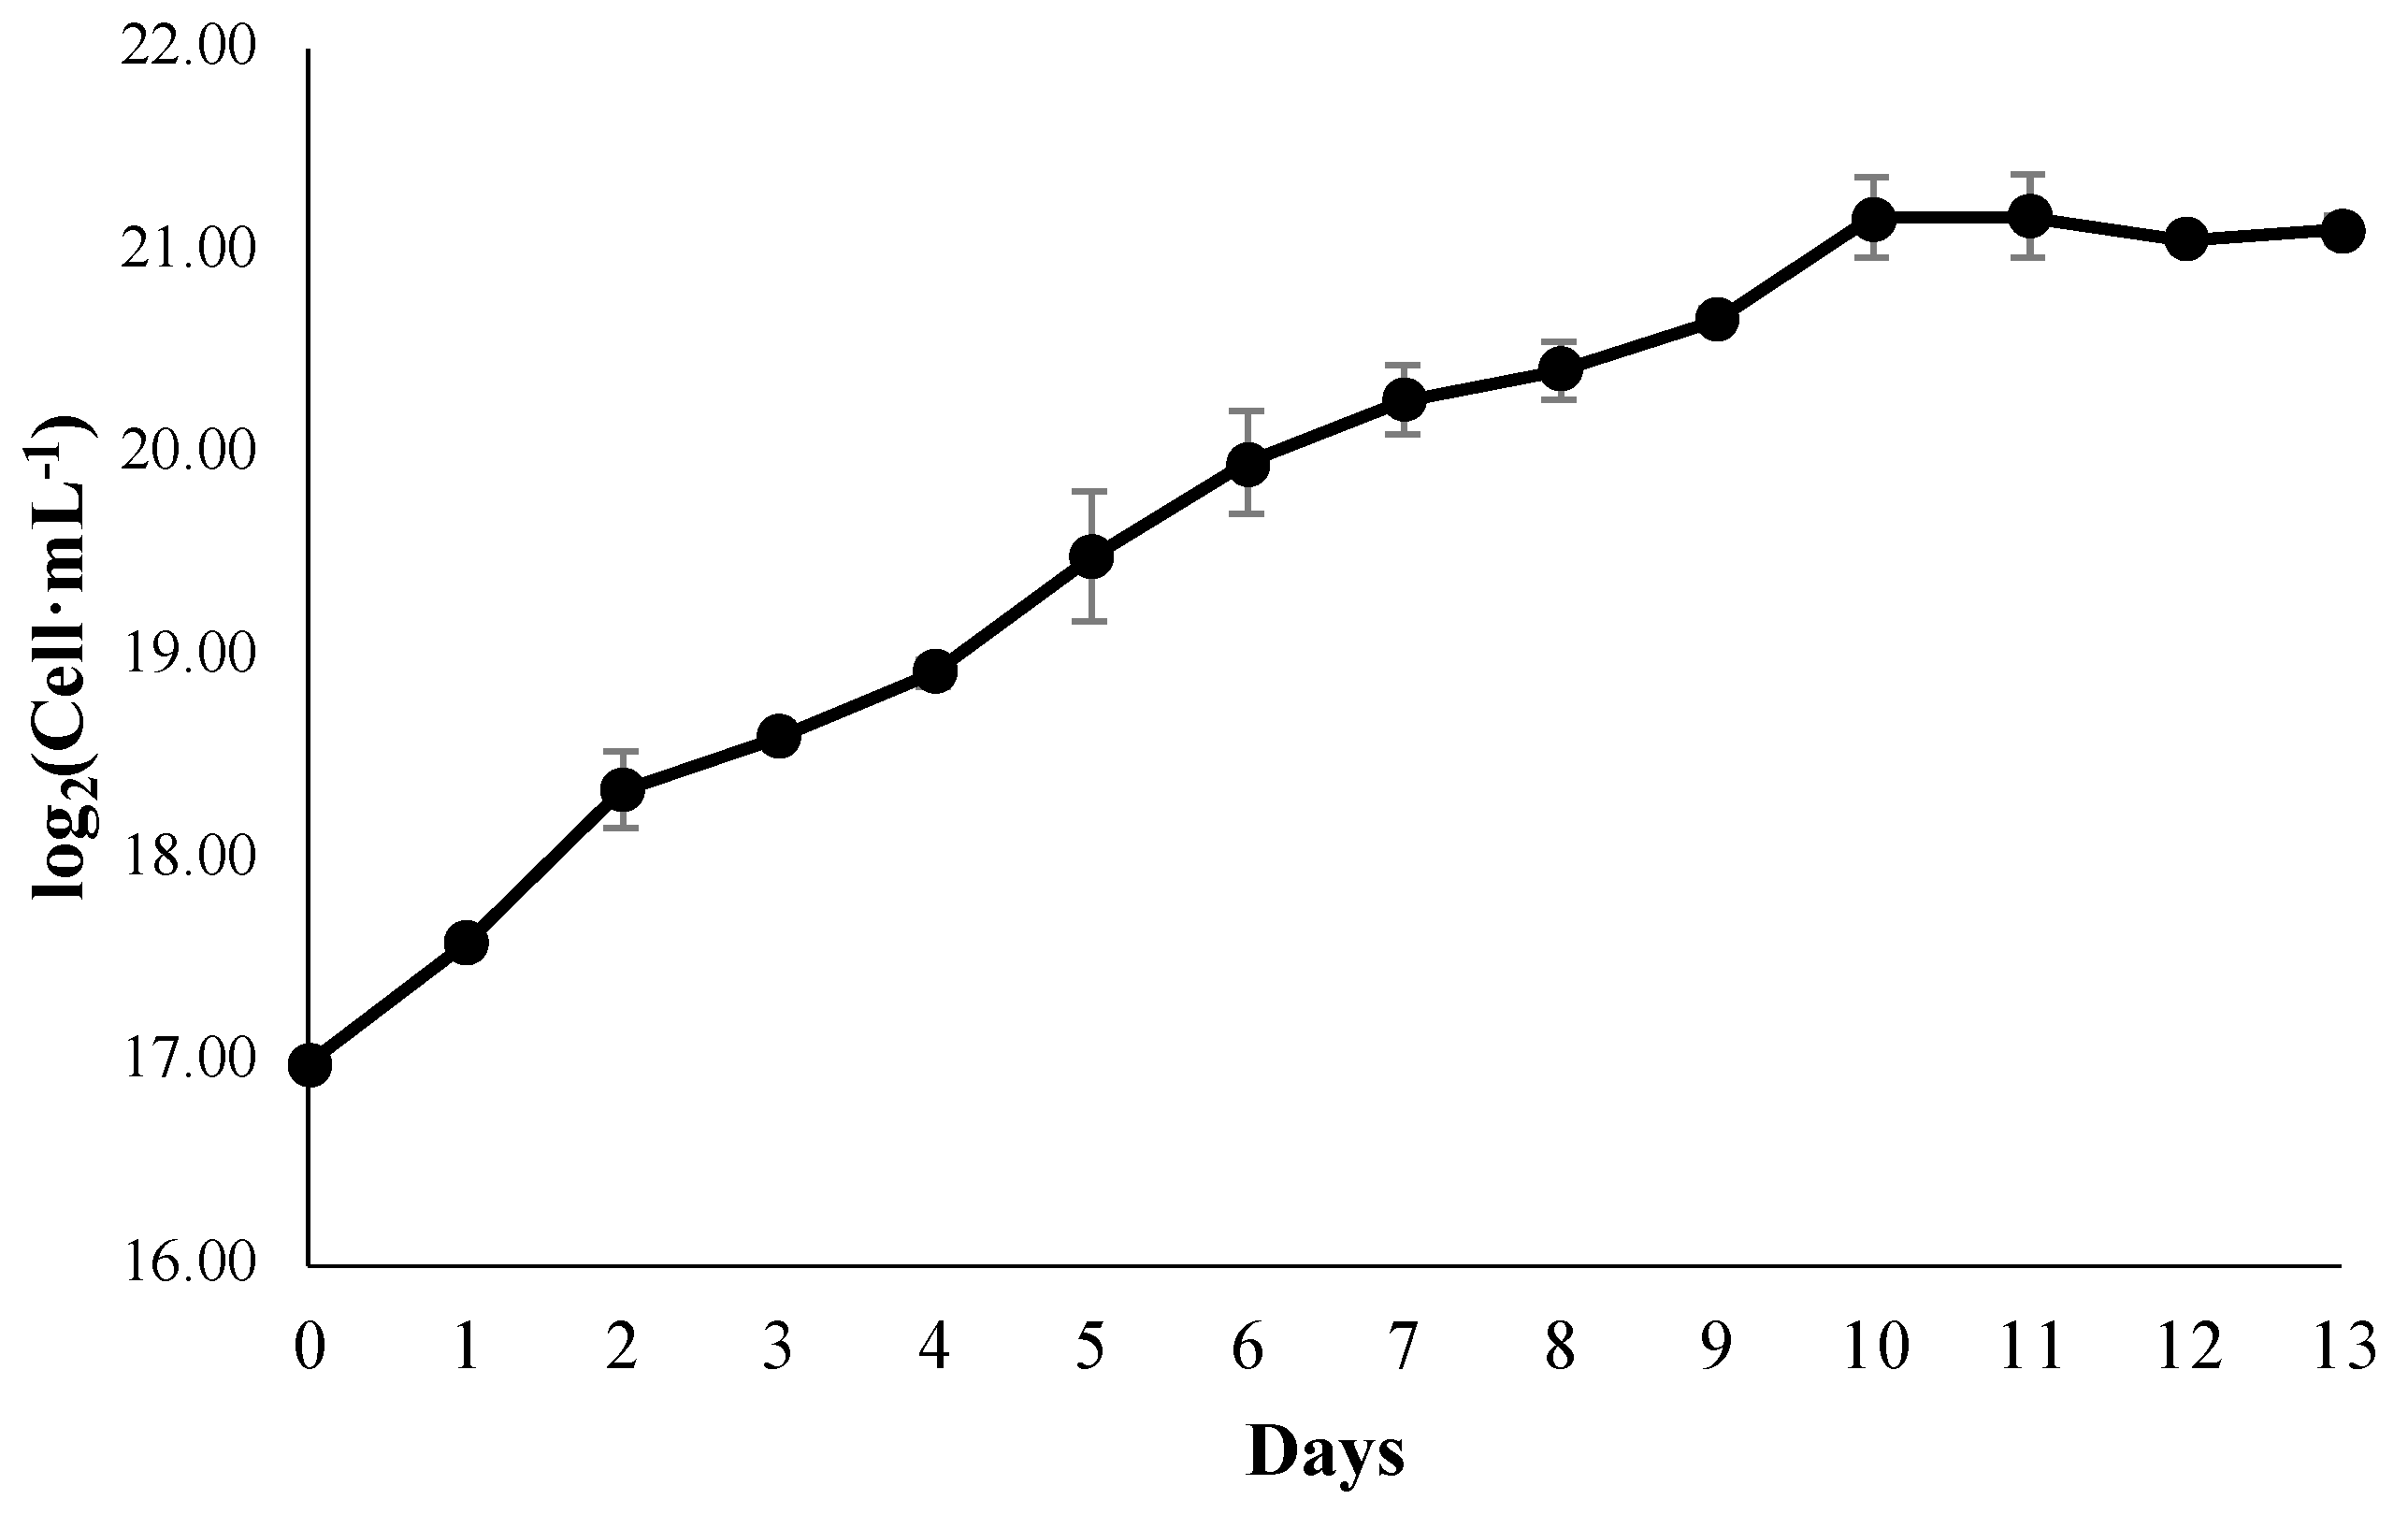
3.1. Growth Kinetics
3.2. Pigments and Protein Quantification
3.3. Biological Activities of Phycobiliproteins Analysis
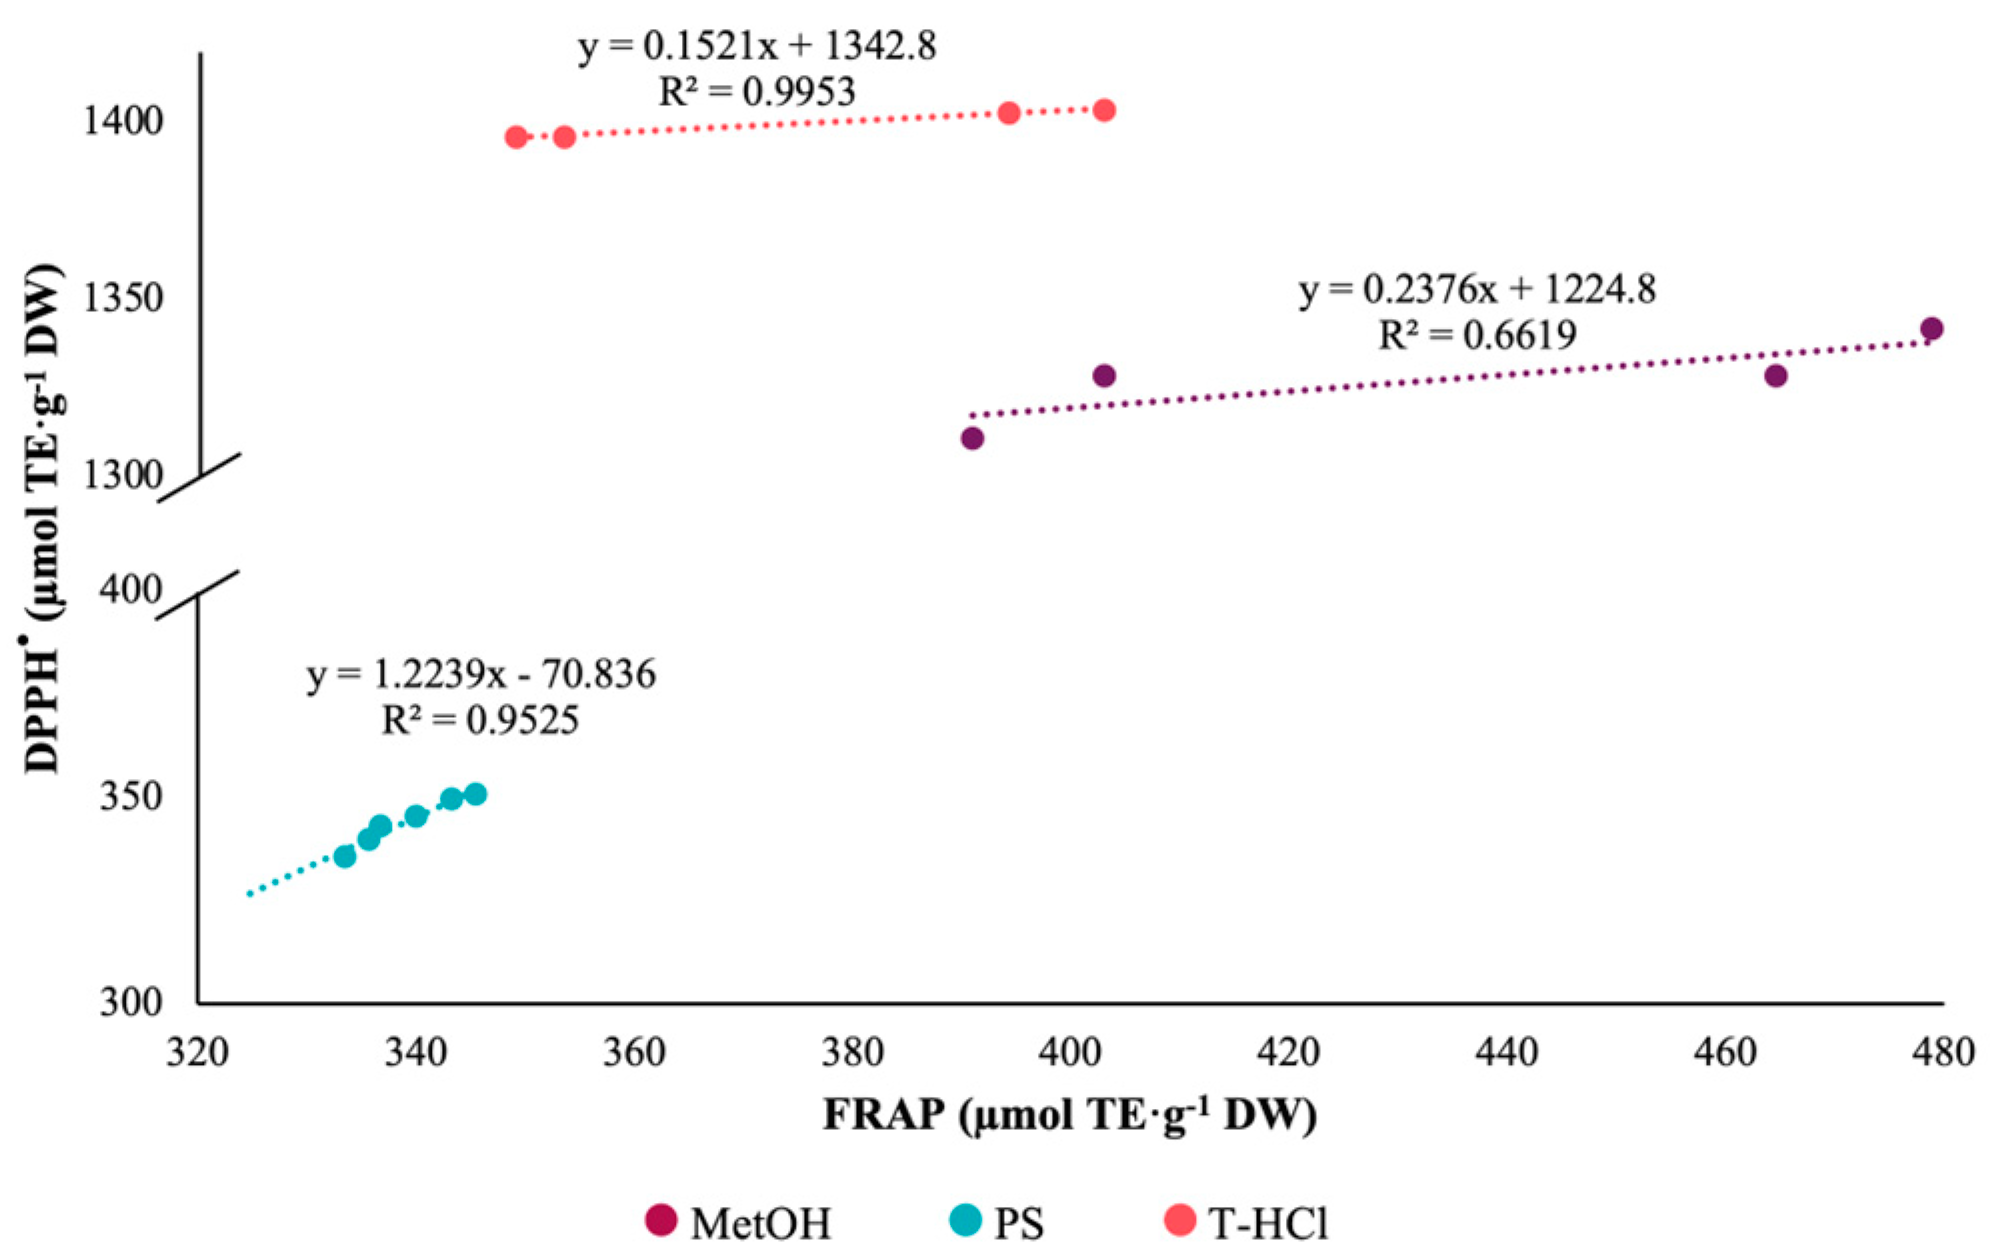
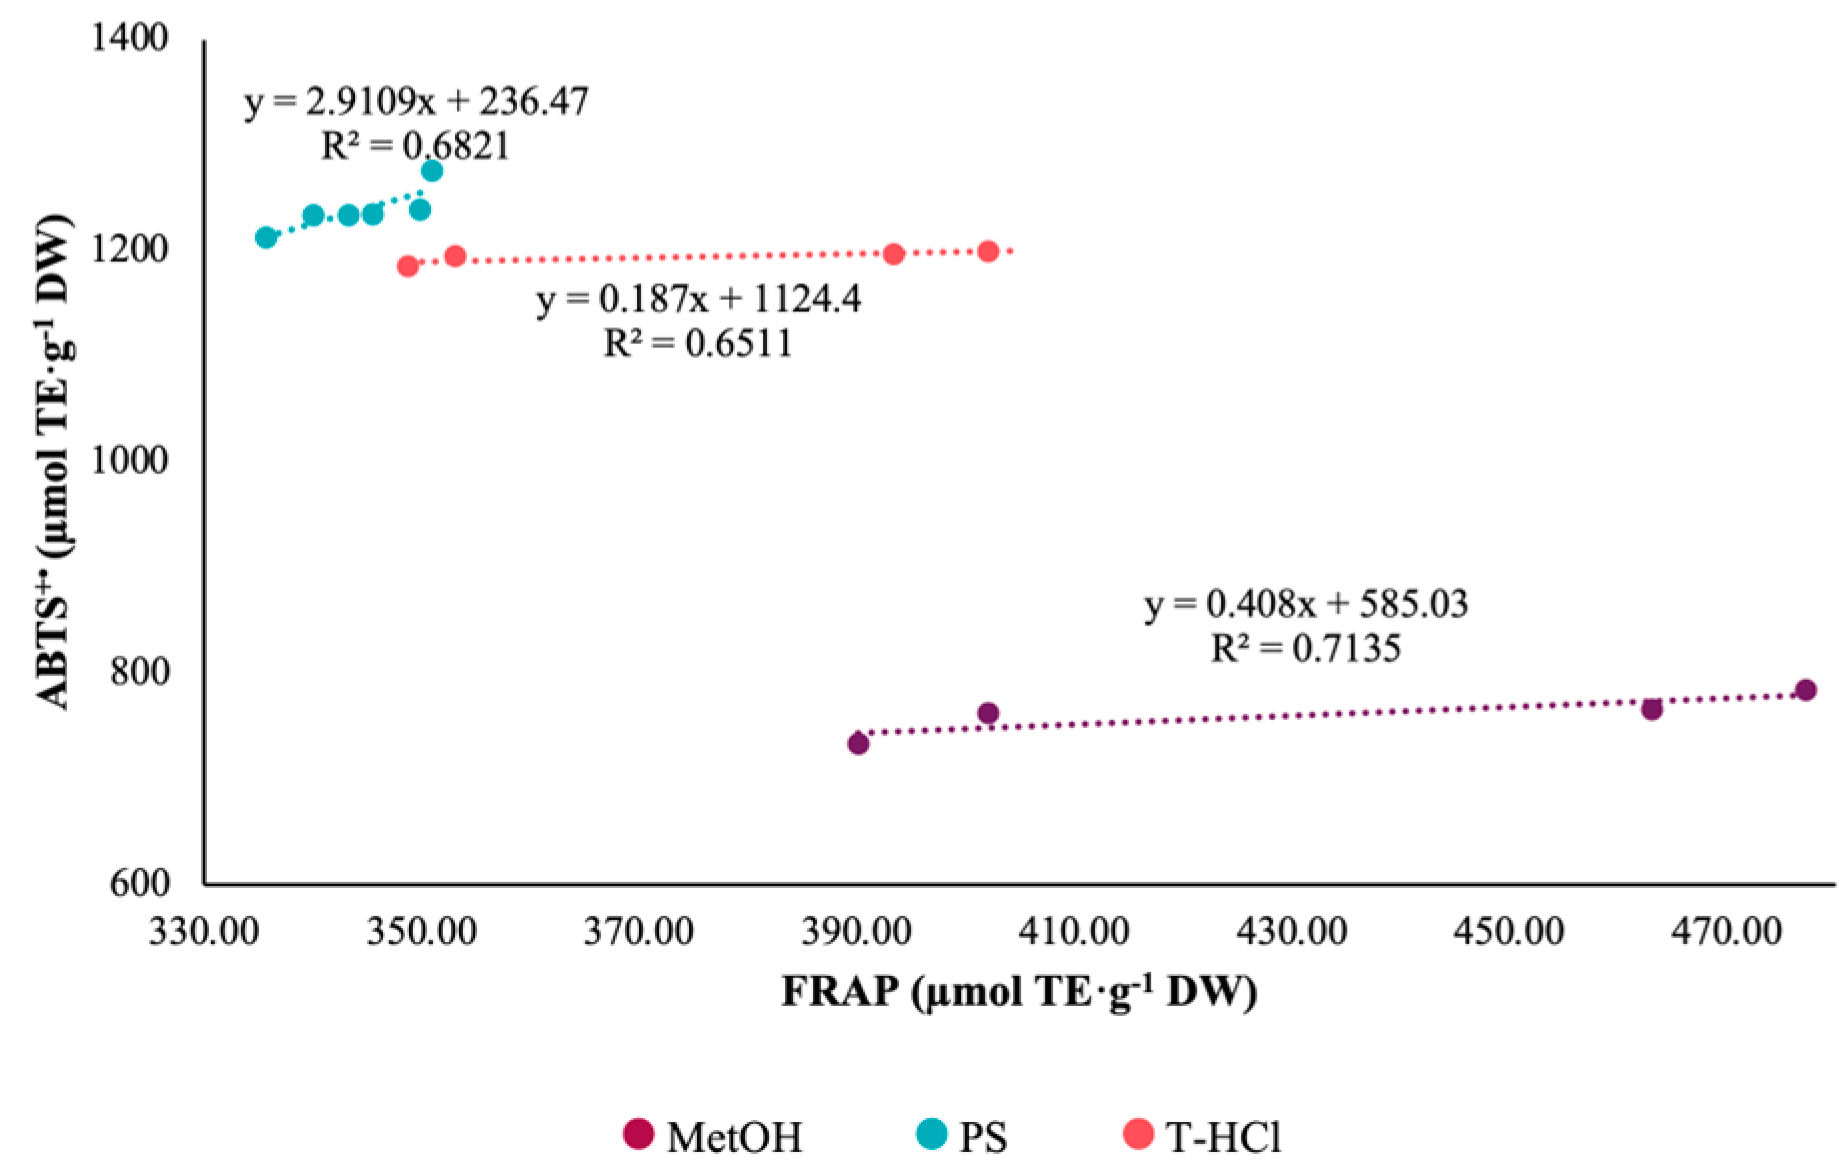
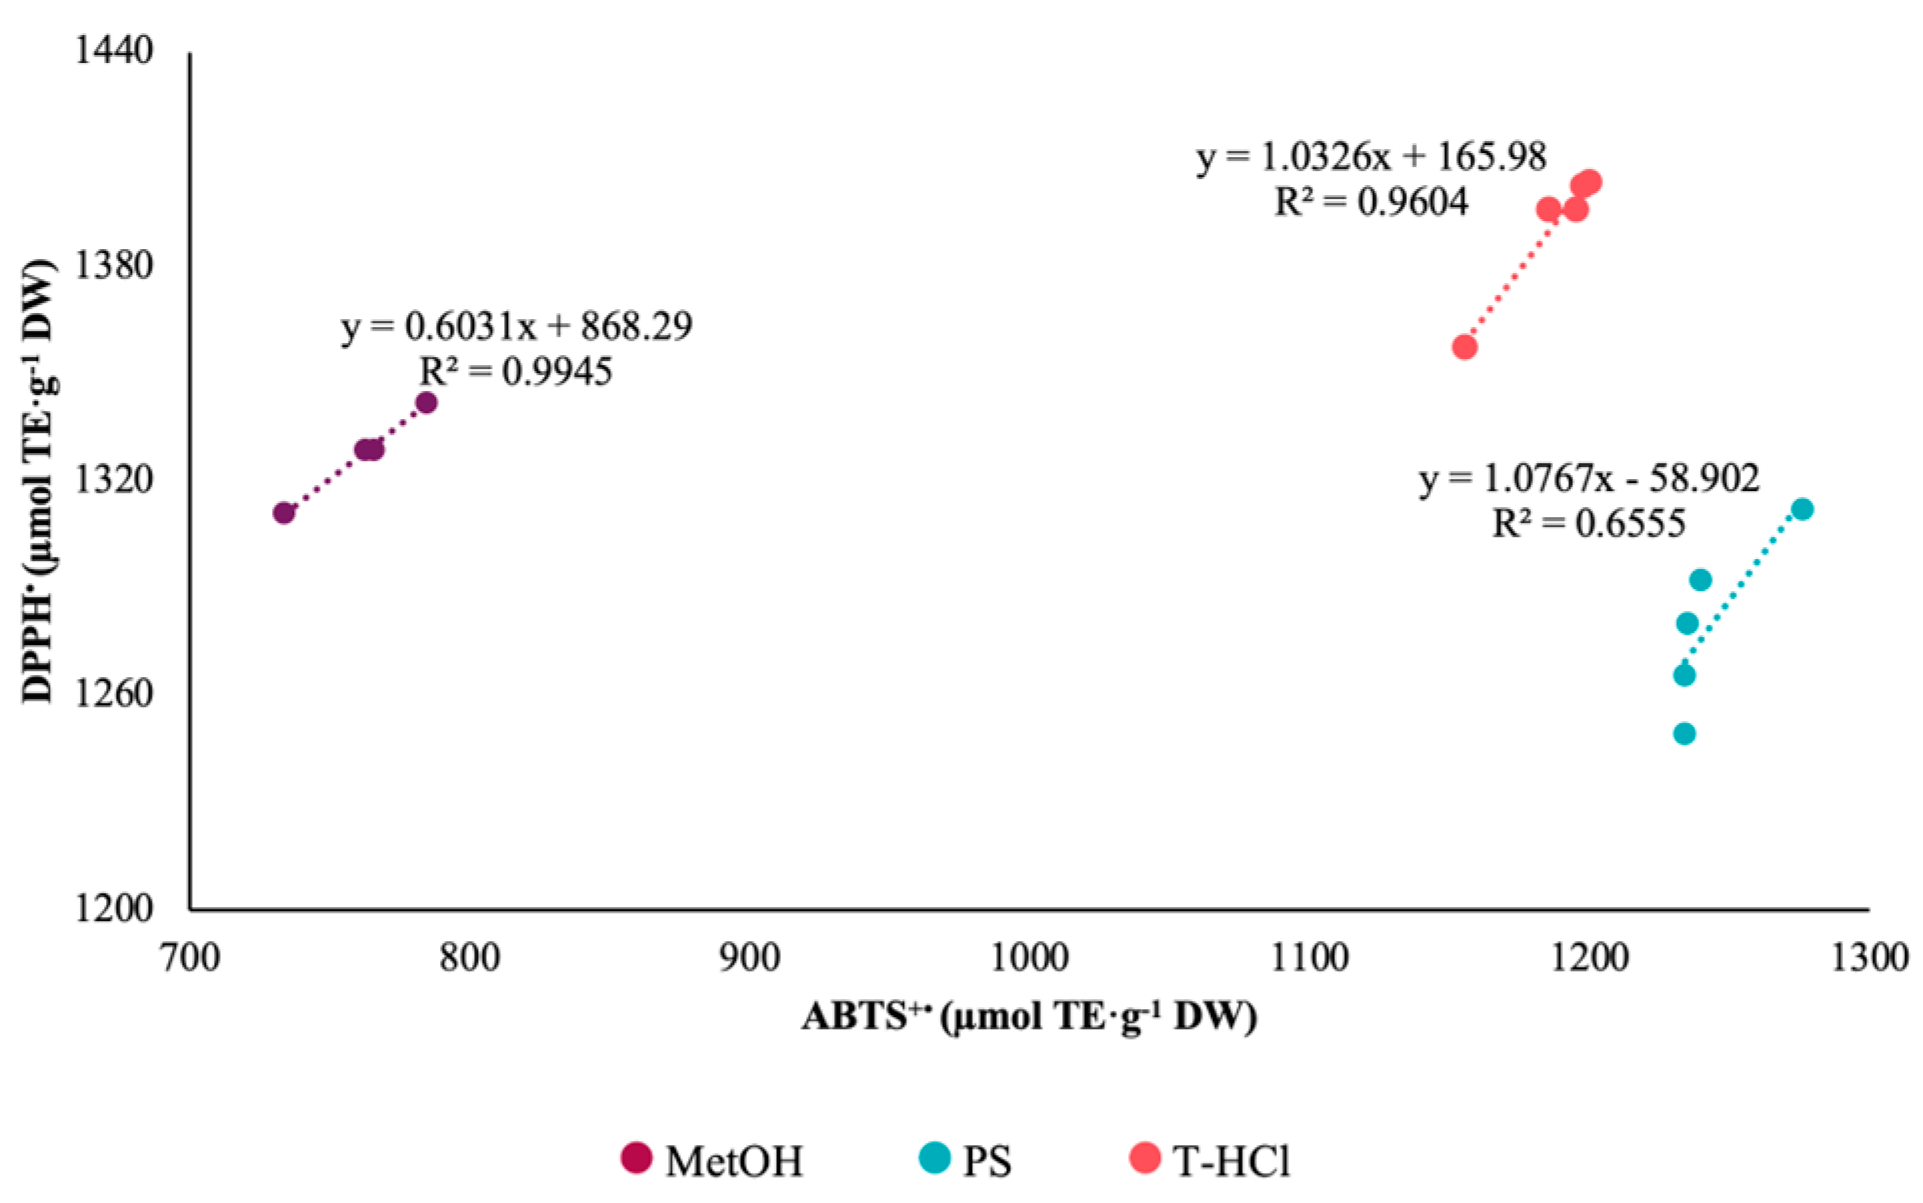
3.3.1. Antioxidant Activity
3.3.2. Blood Biocompatibility Assay
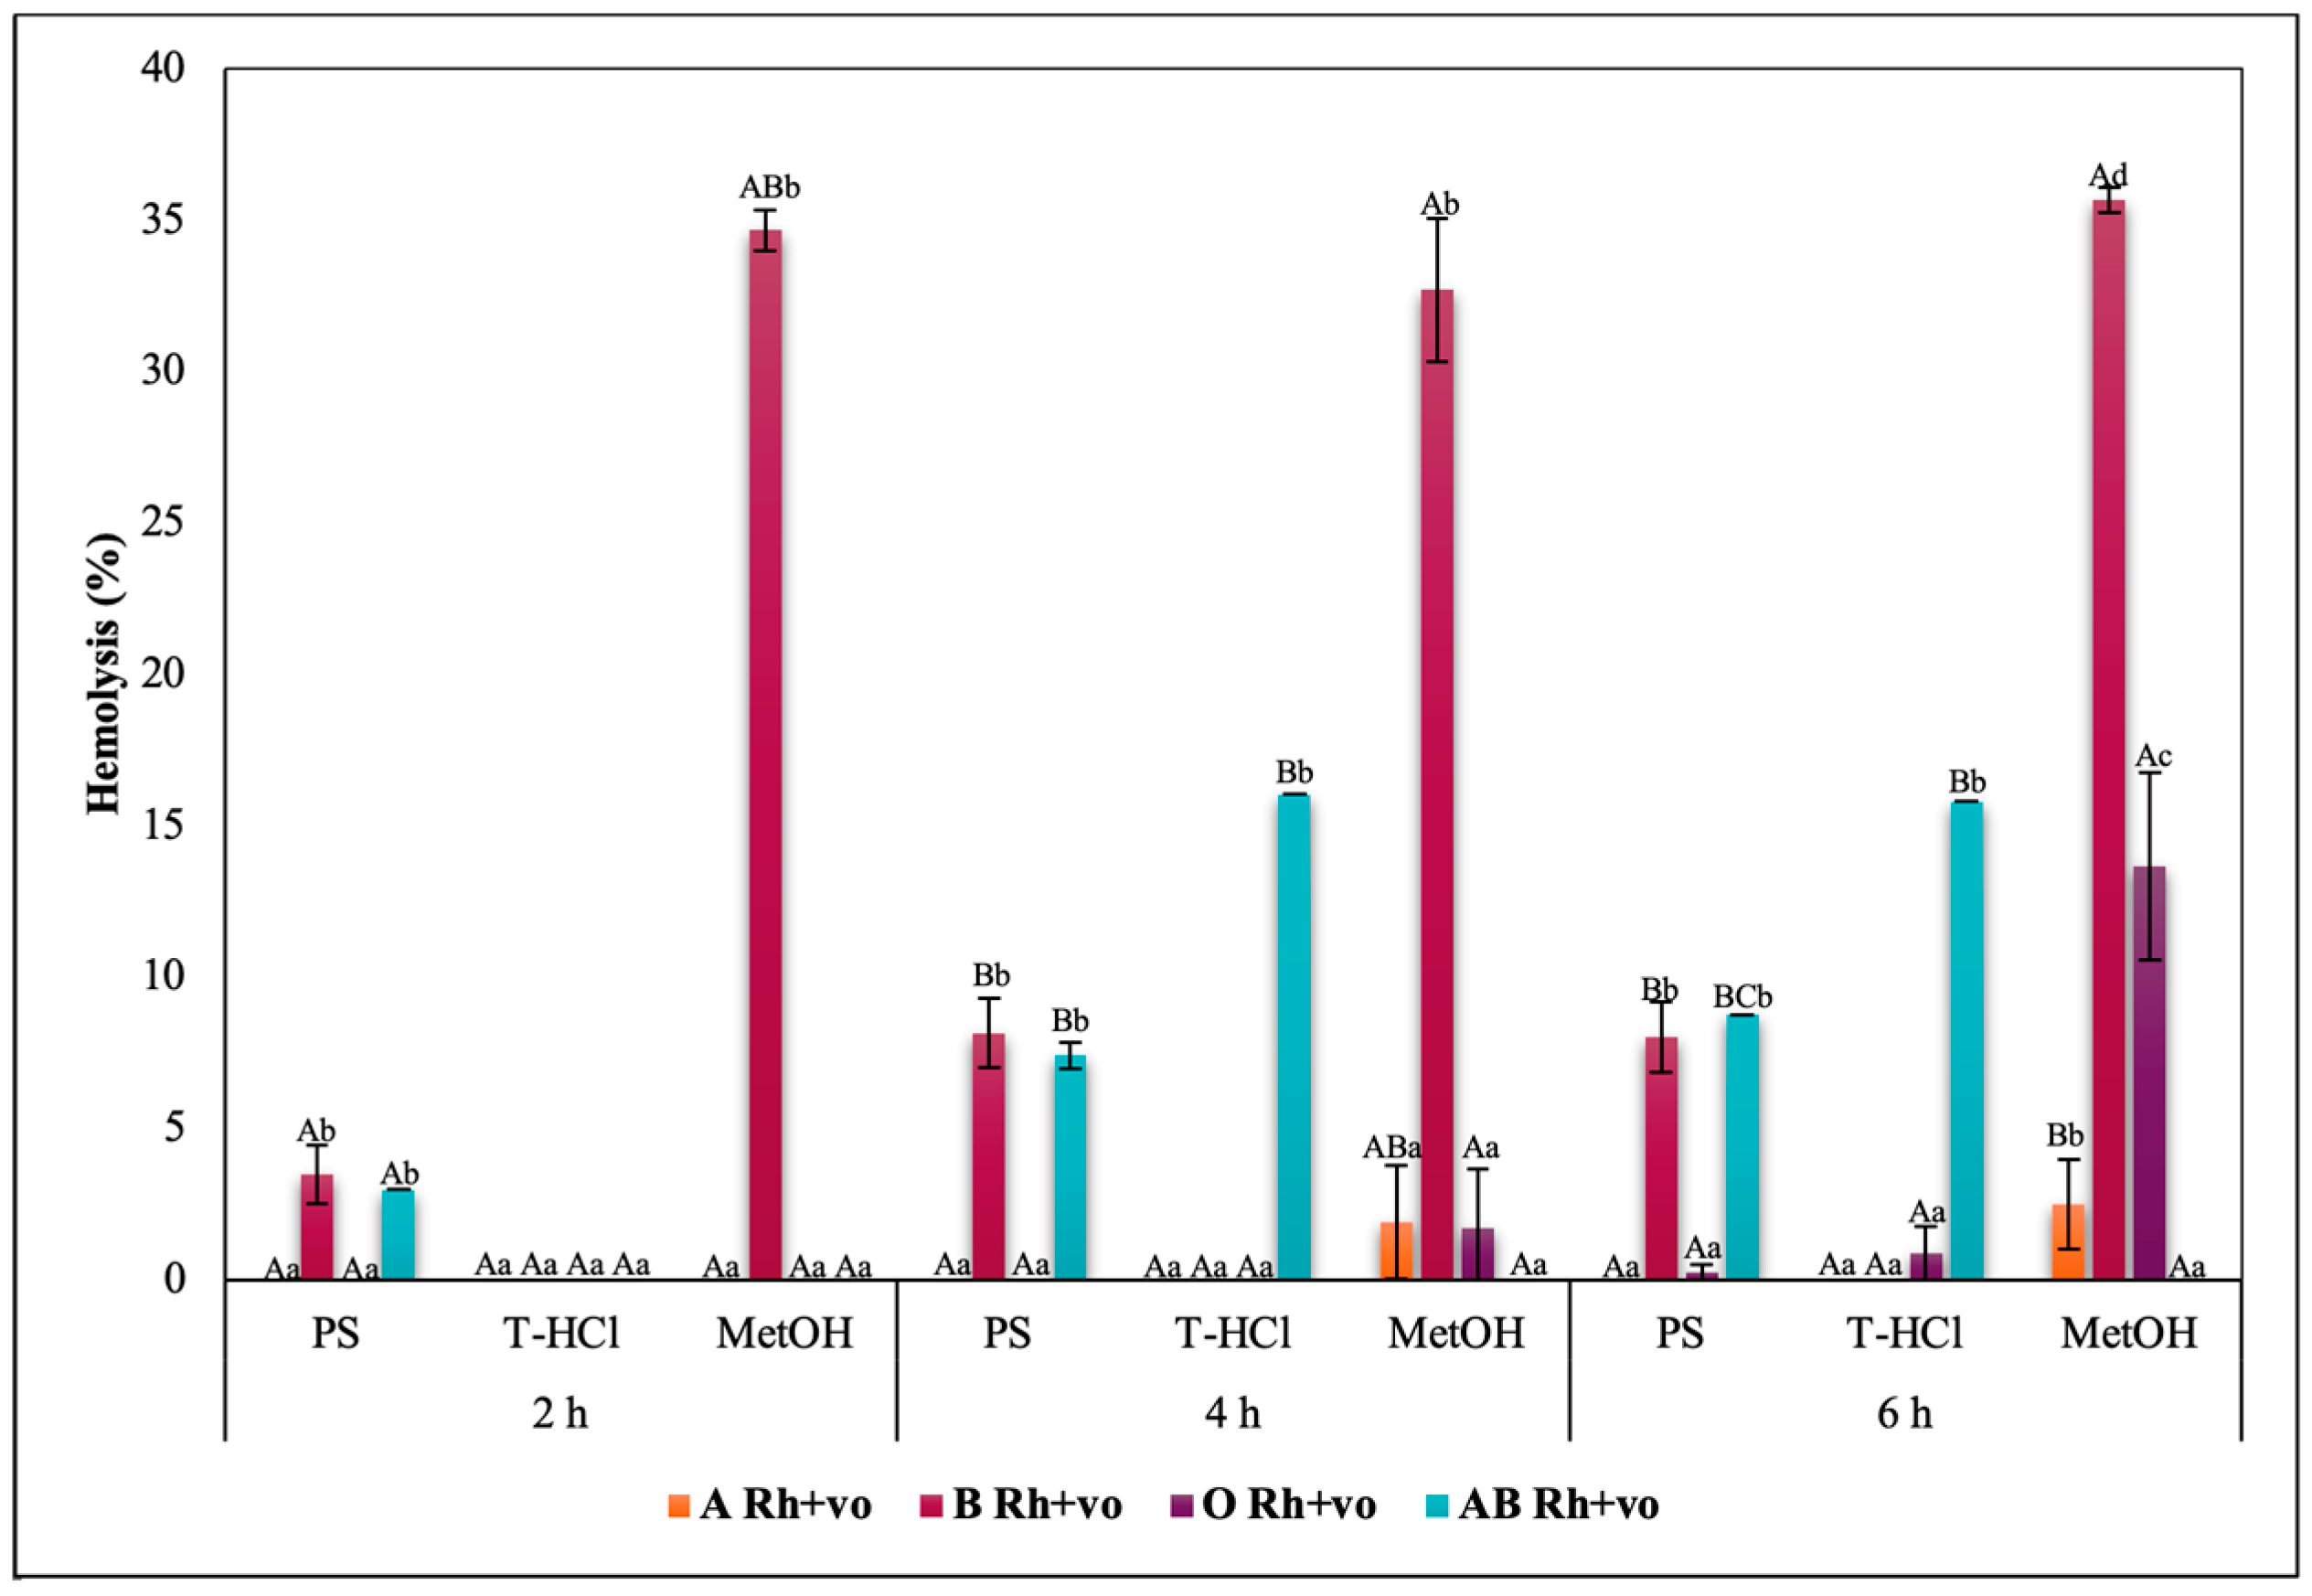
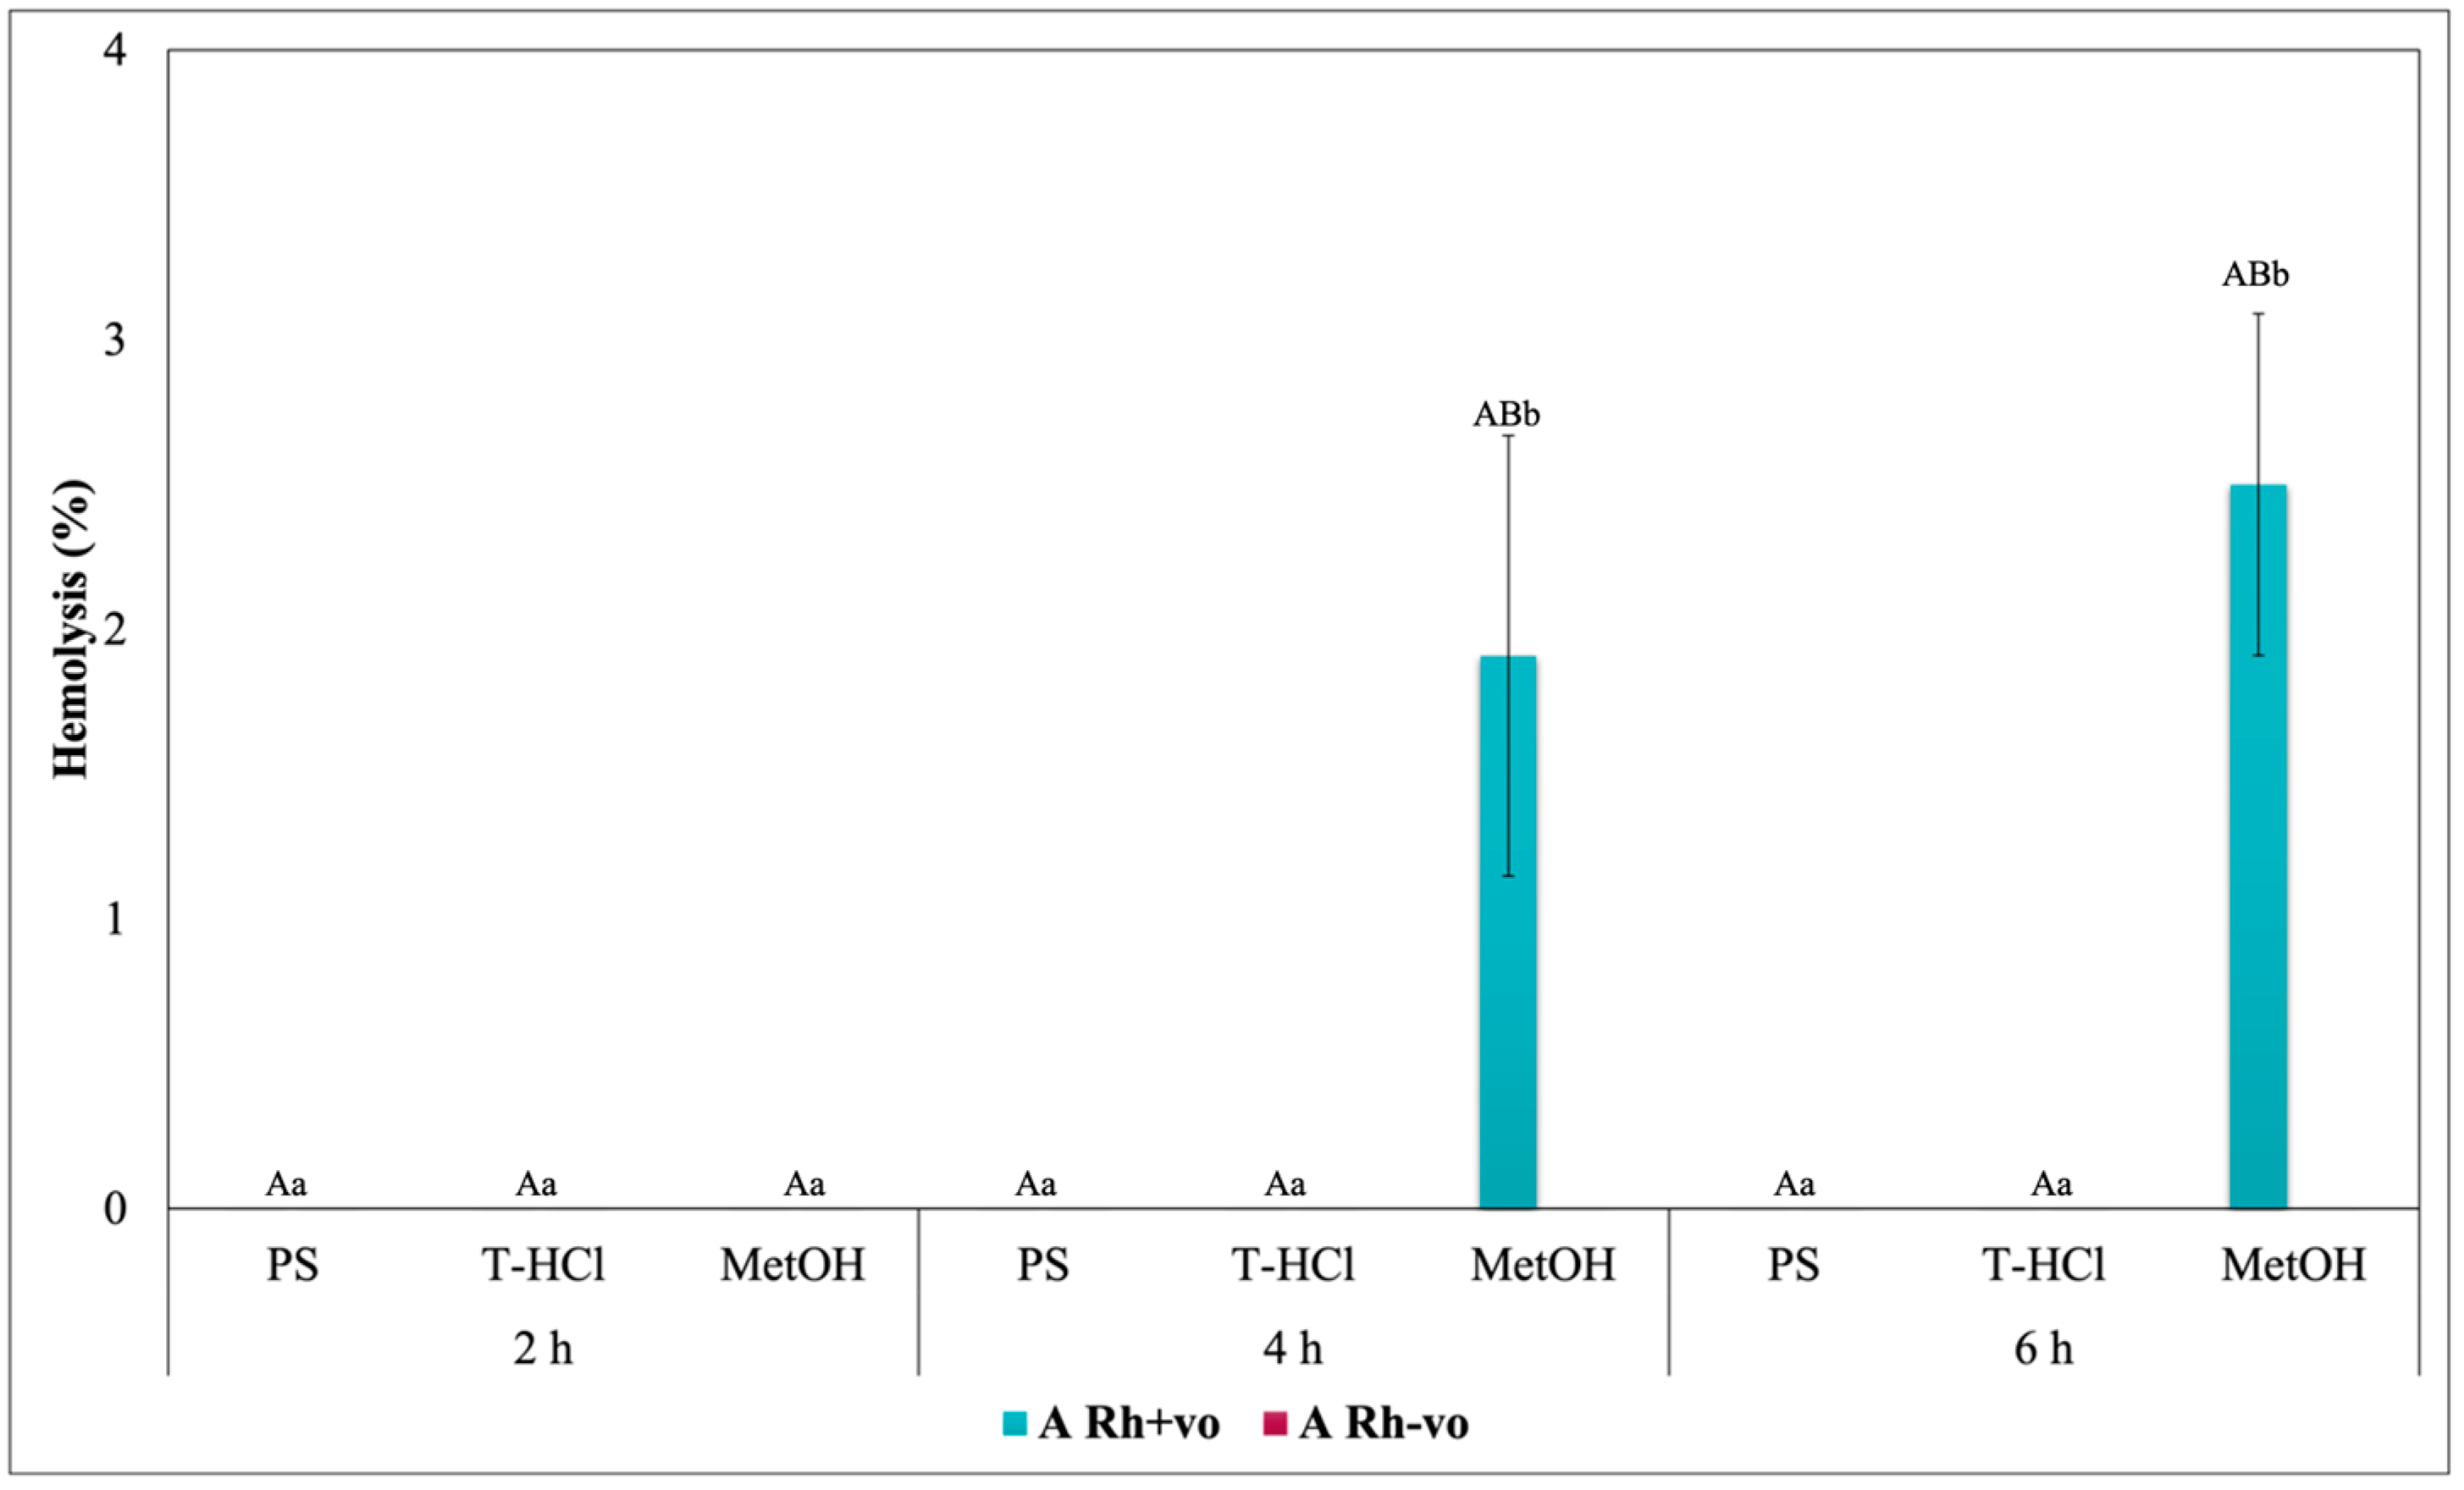
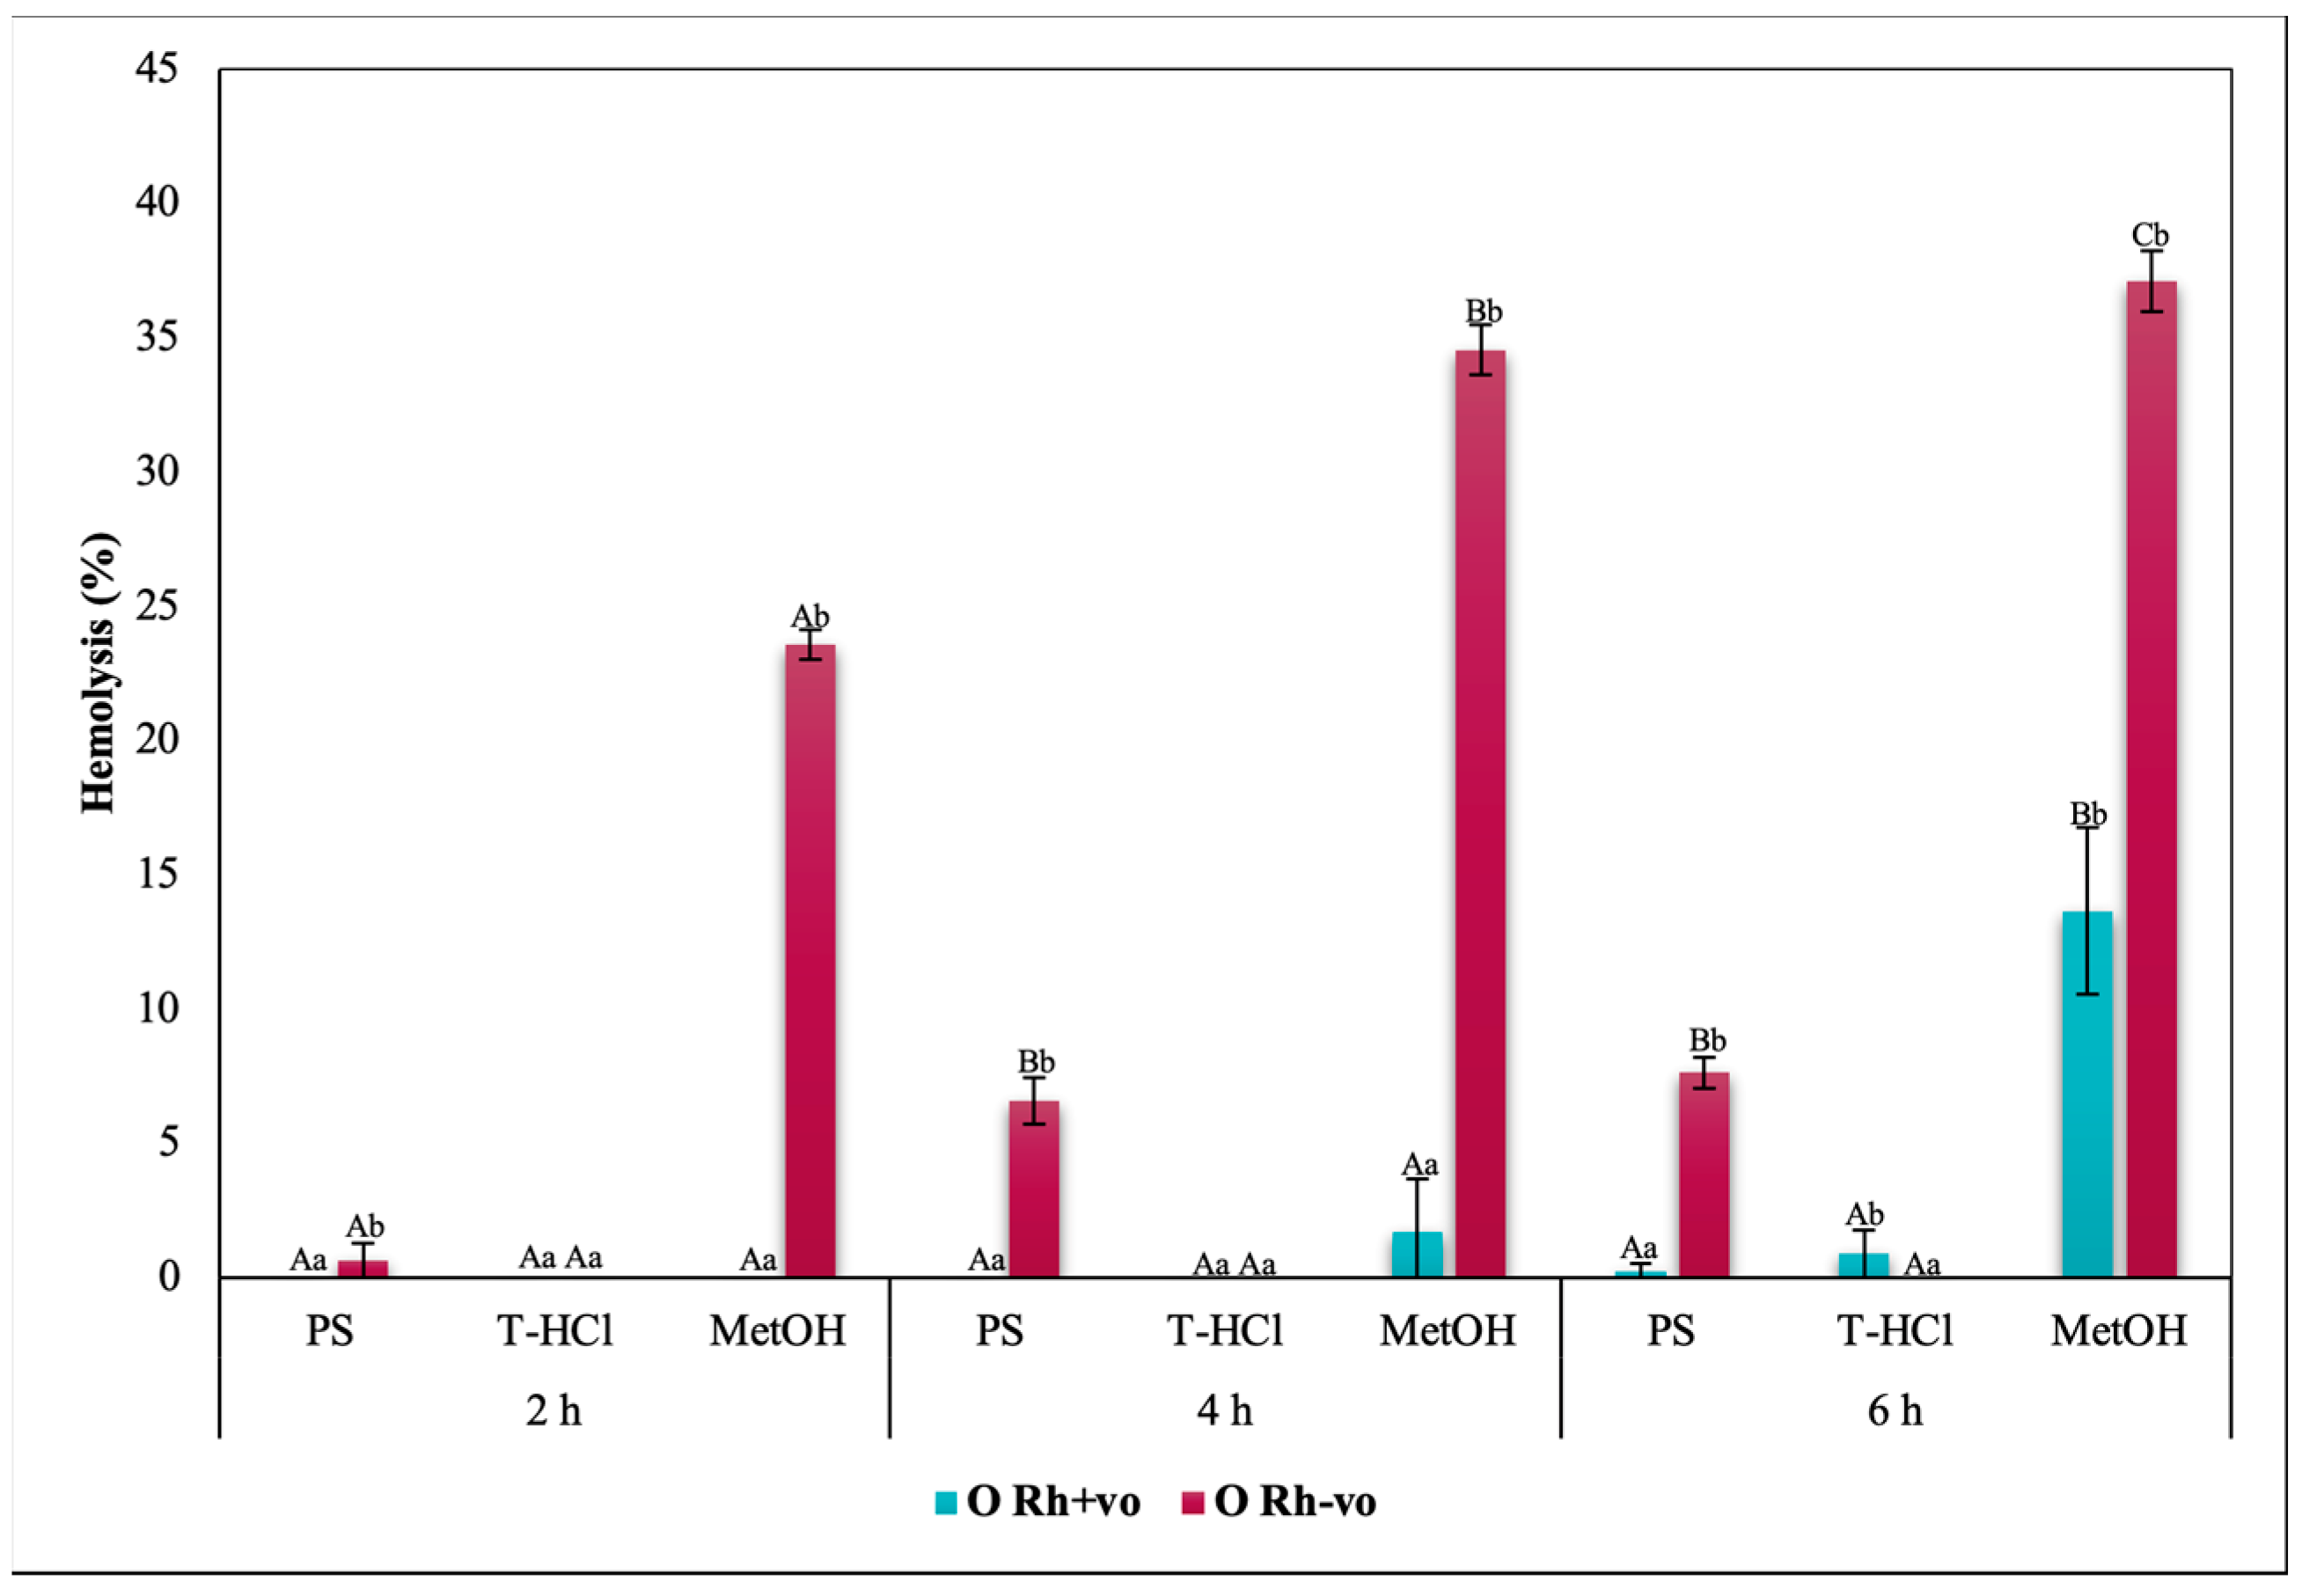
3.3.3. Erythroprotective Potential
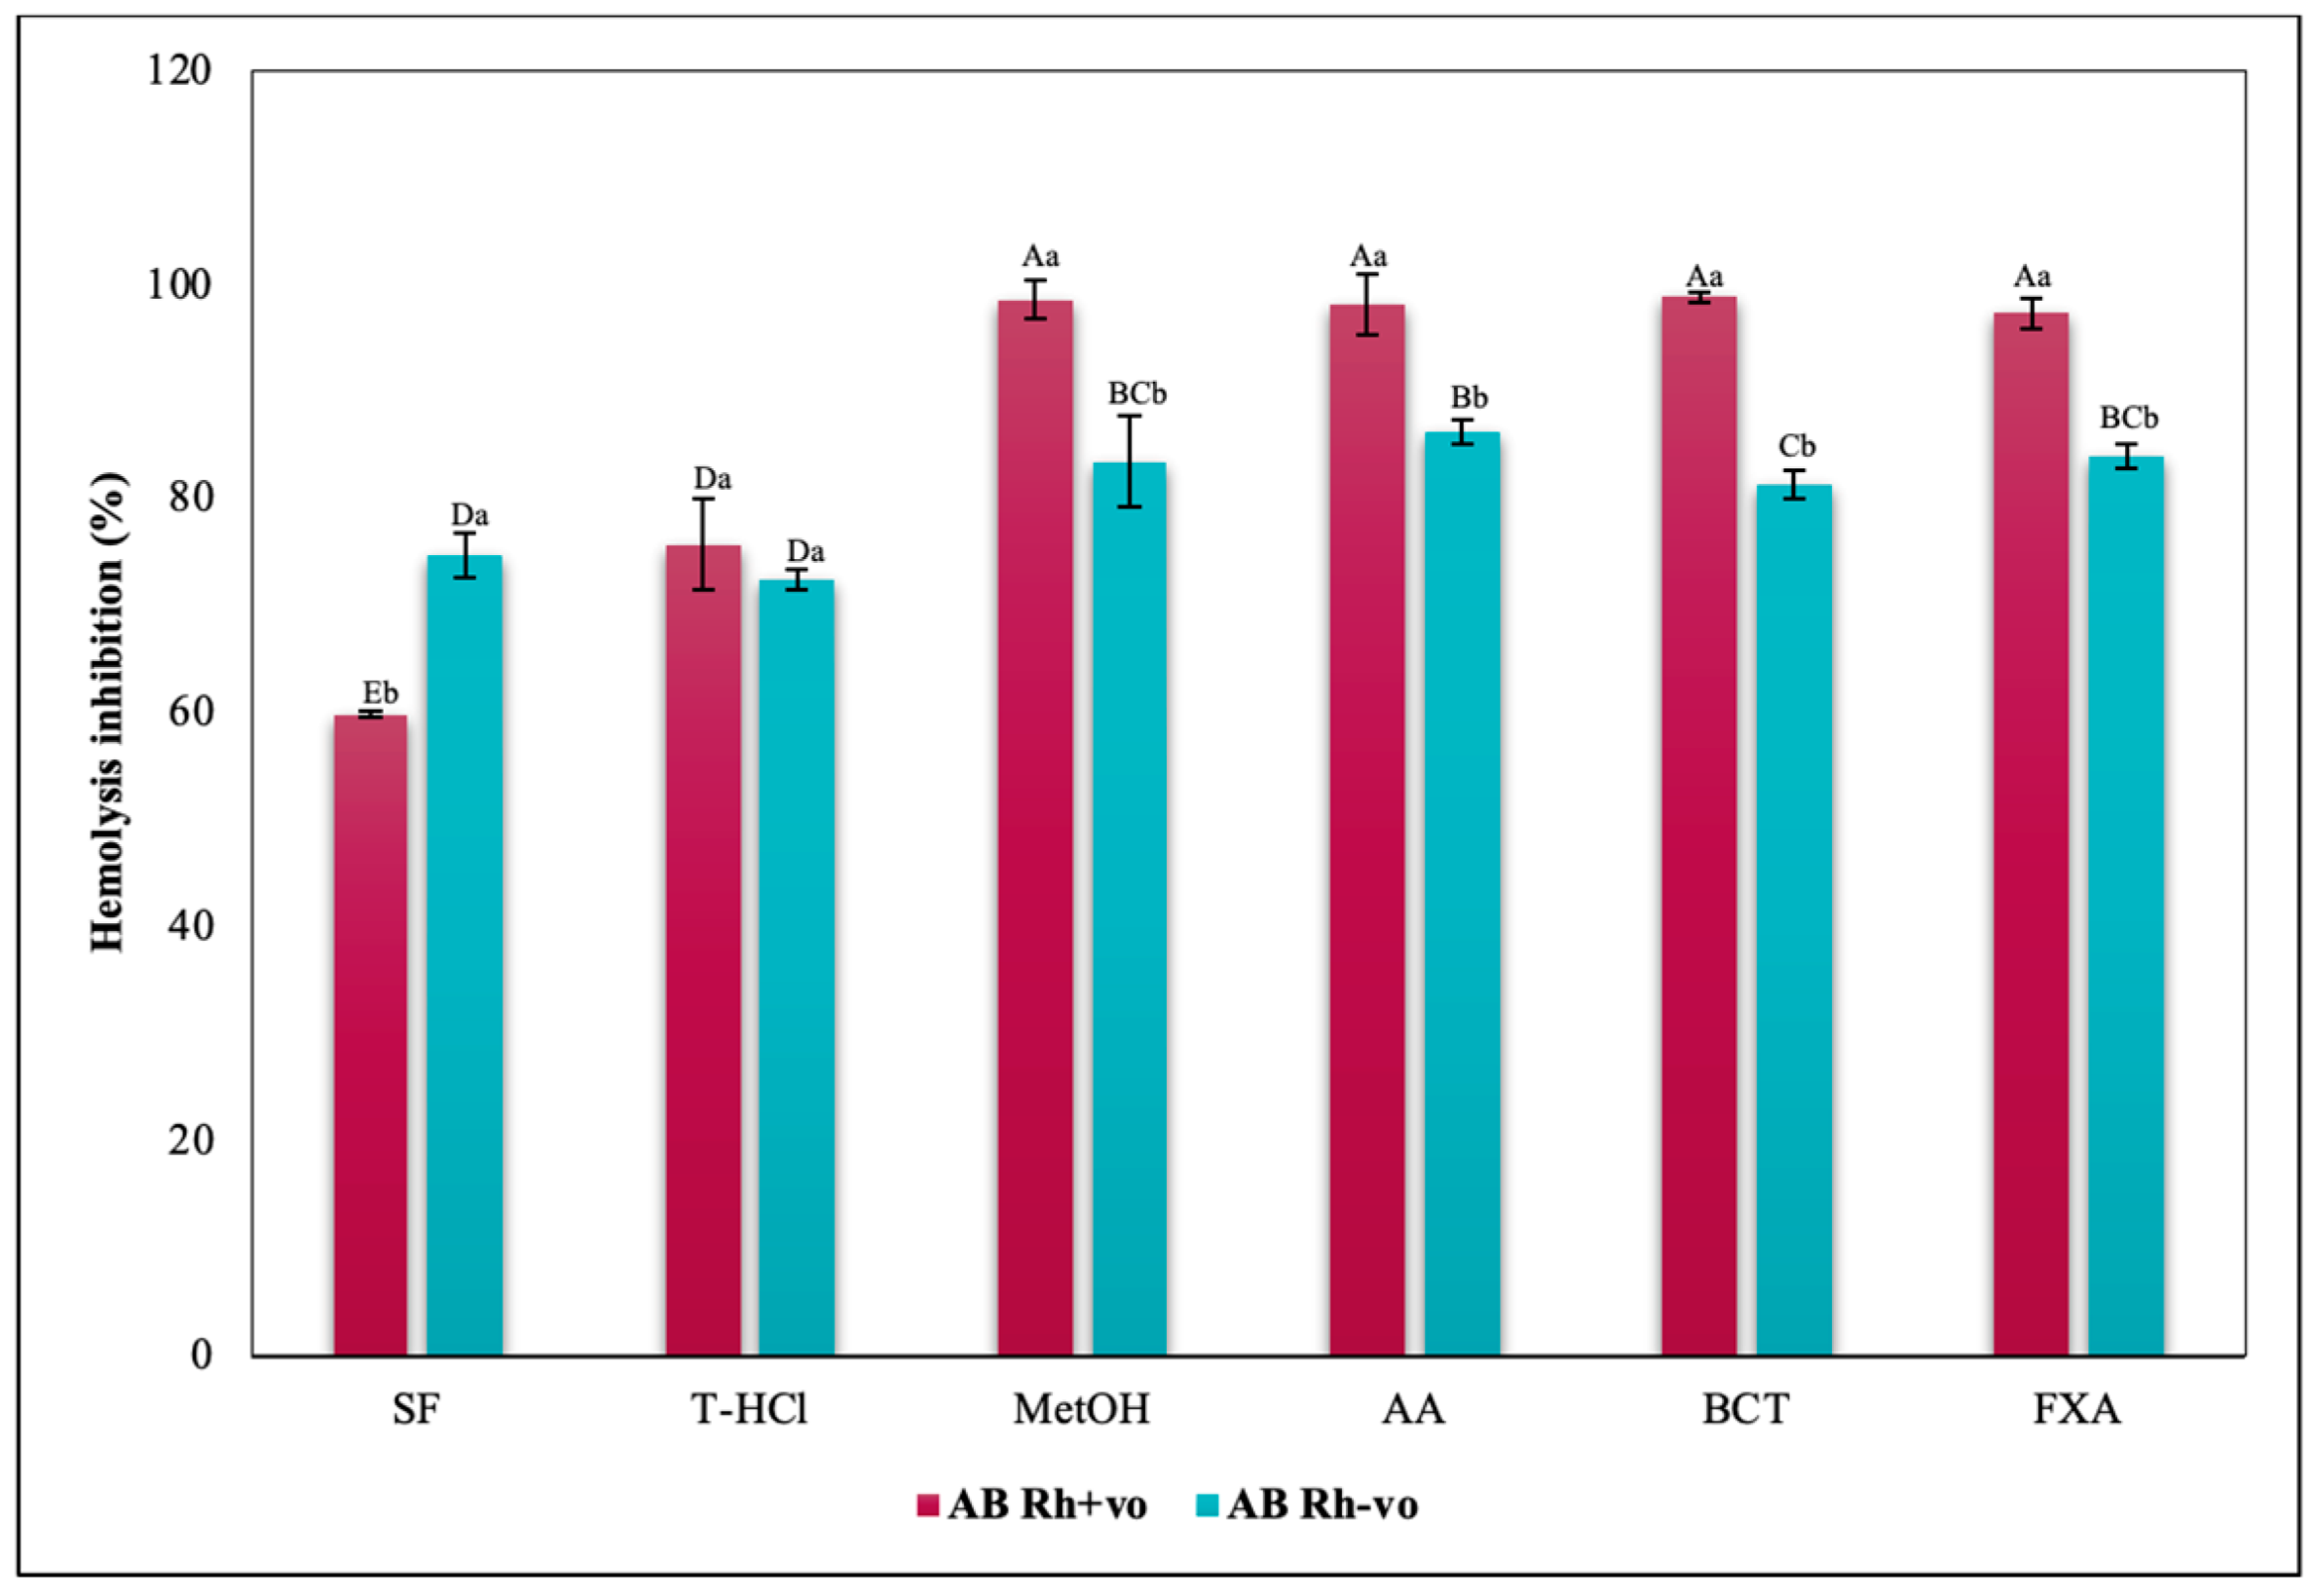
Antihemolytic Activity in Erythrocytes by the 2,2′-azobis-(2-methylpropionamidine) (AAPH) Method
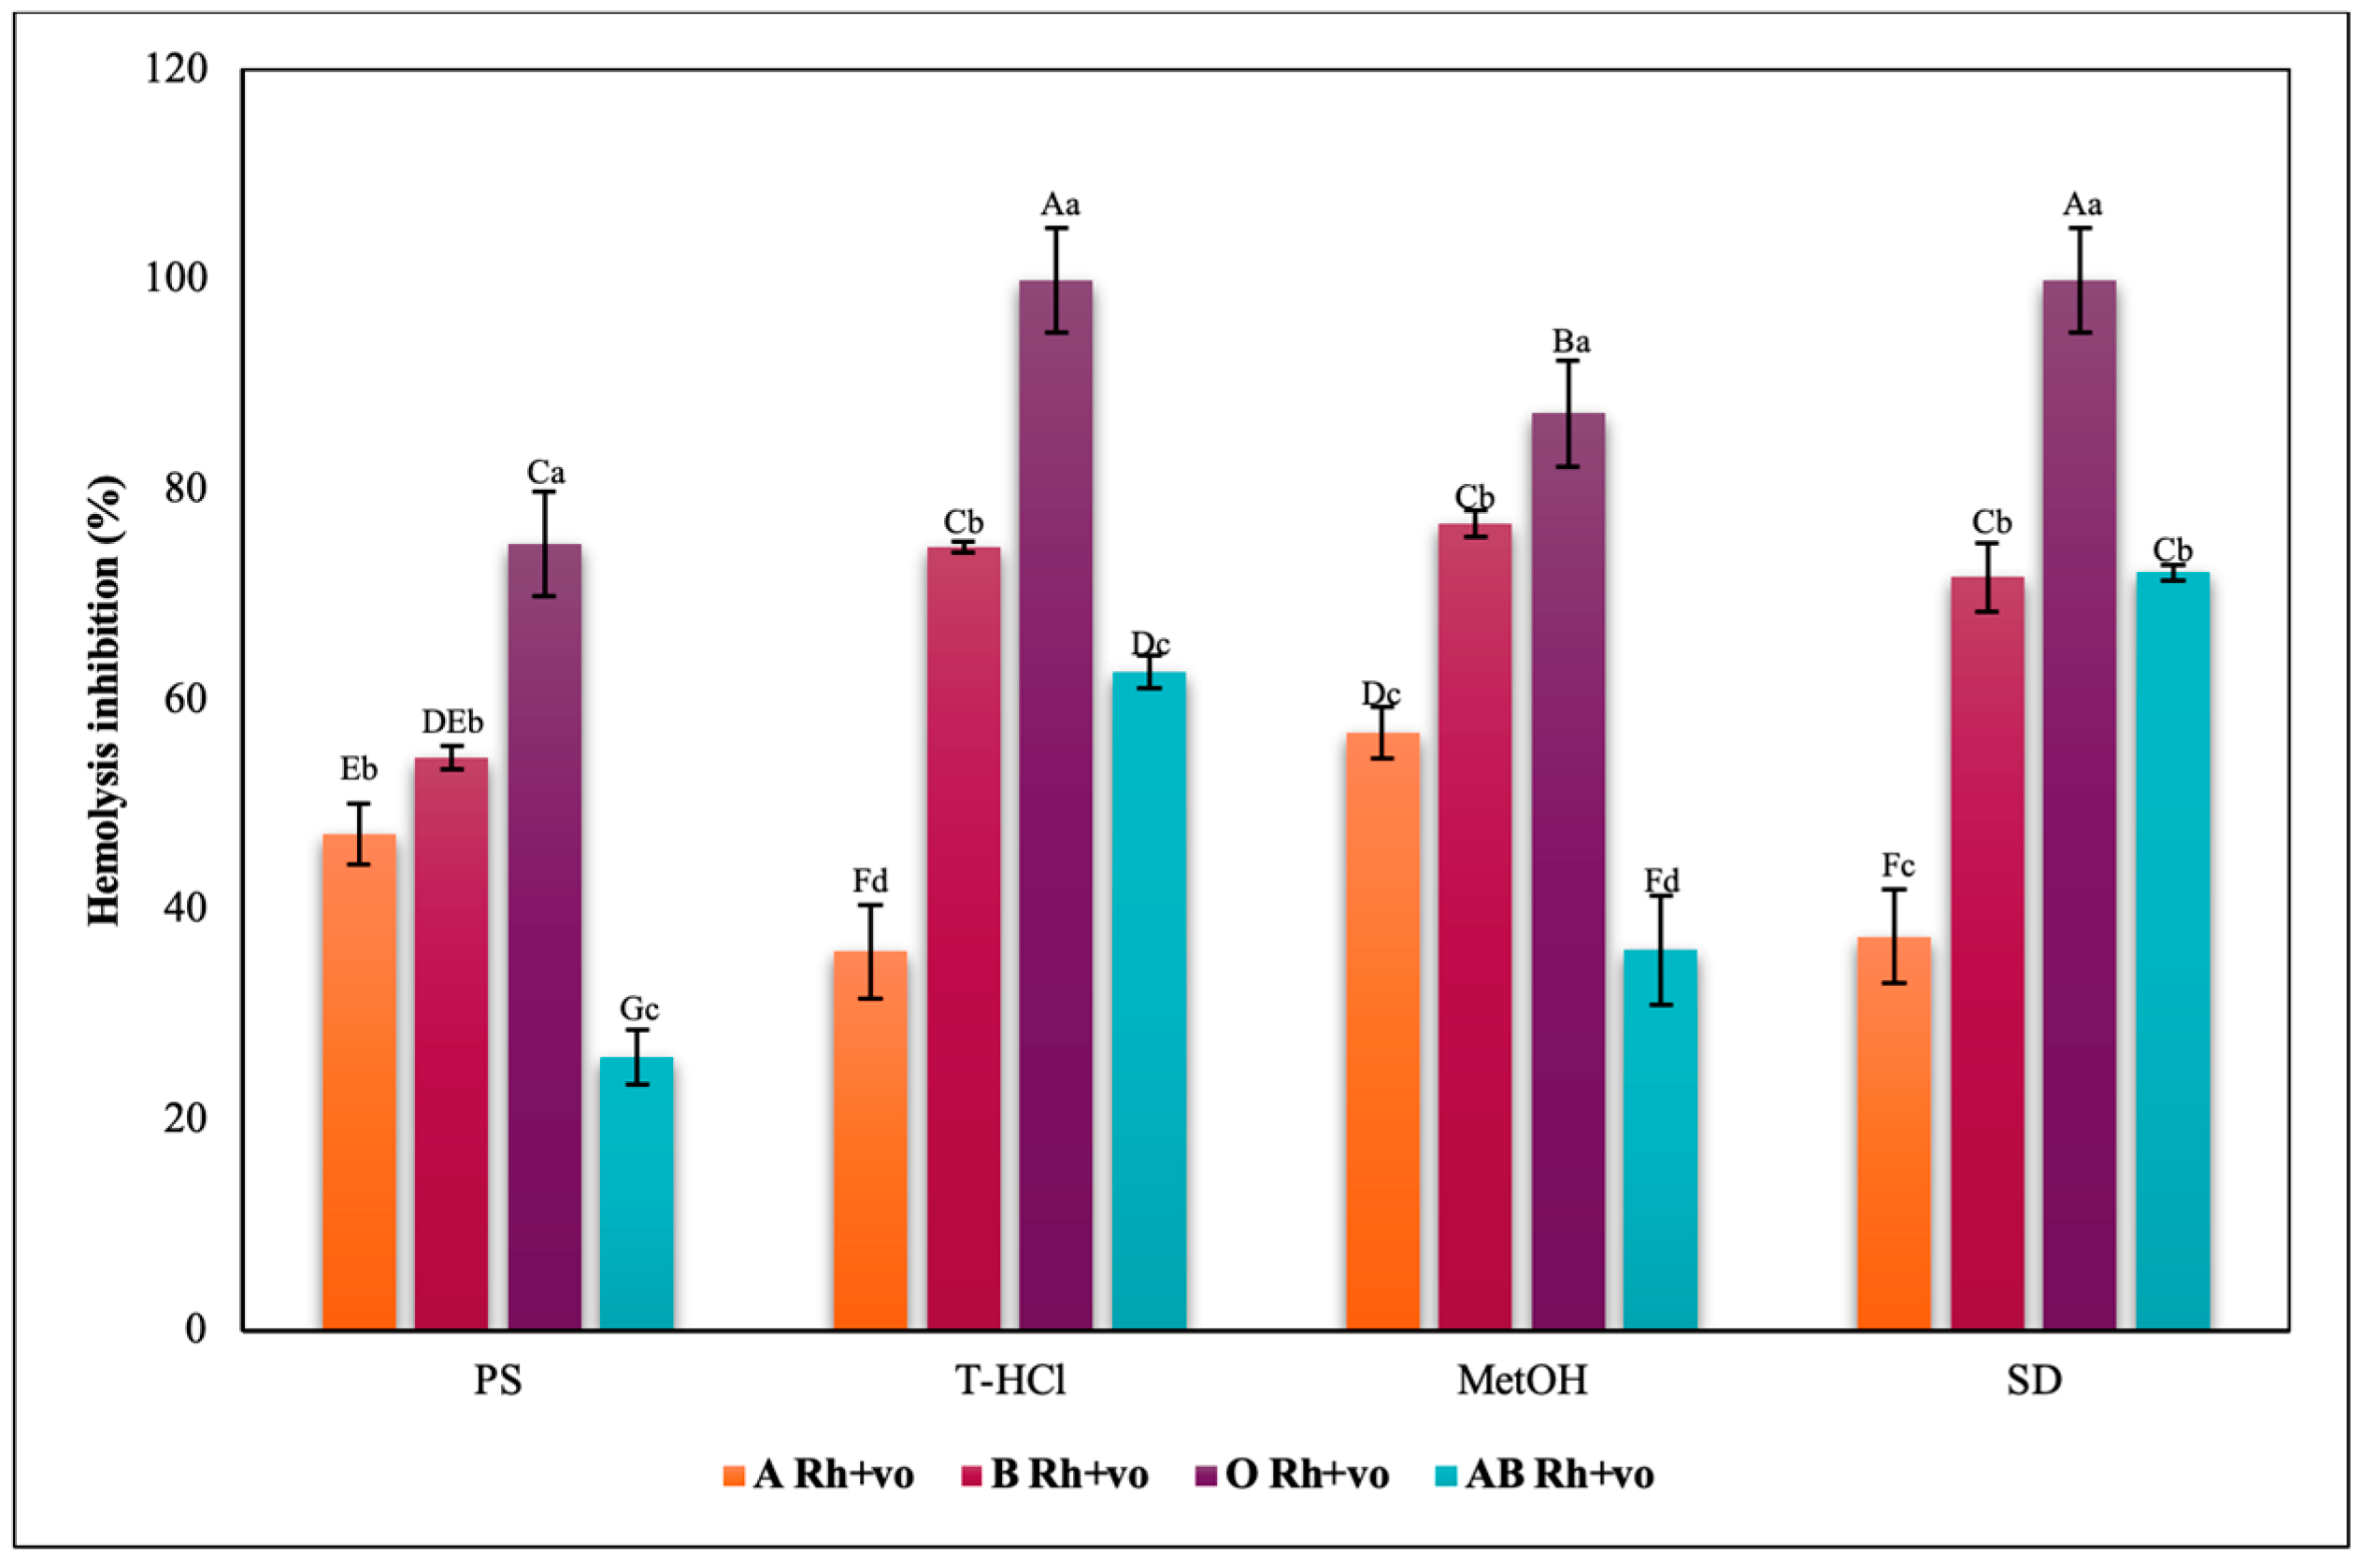
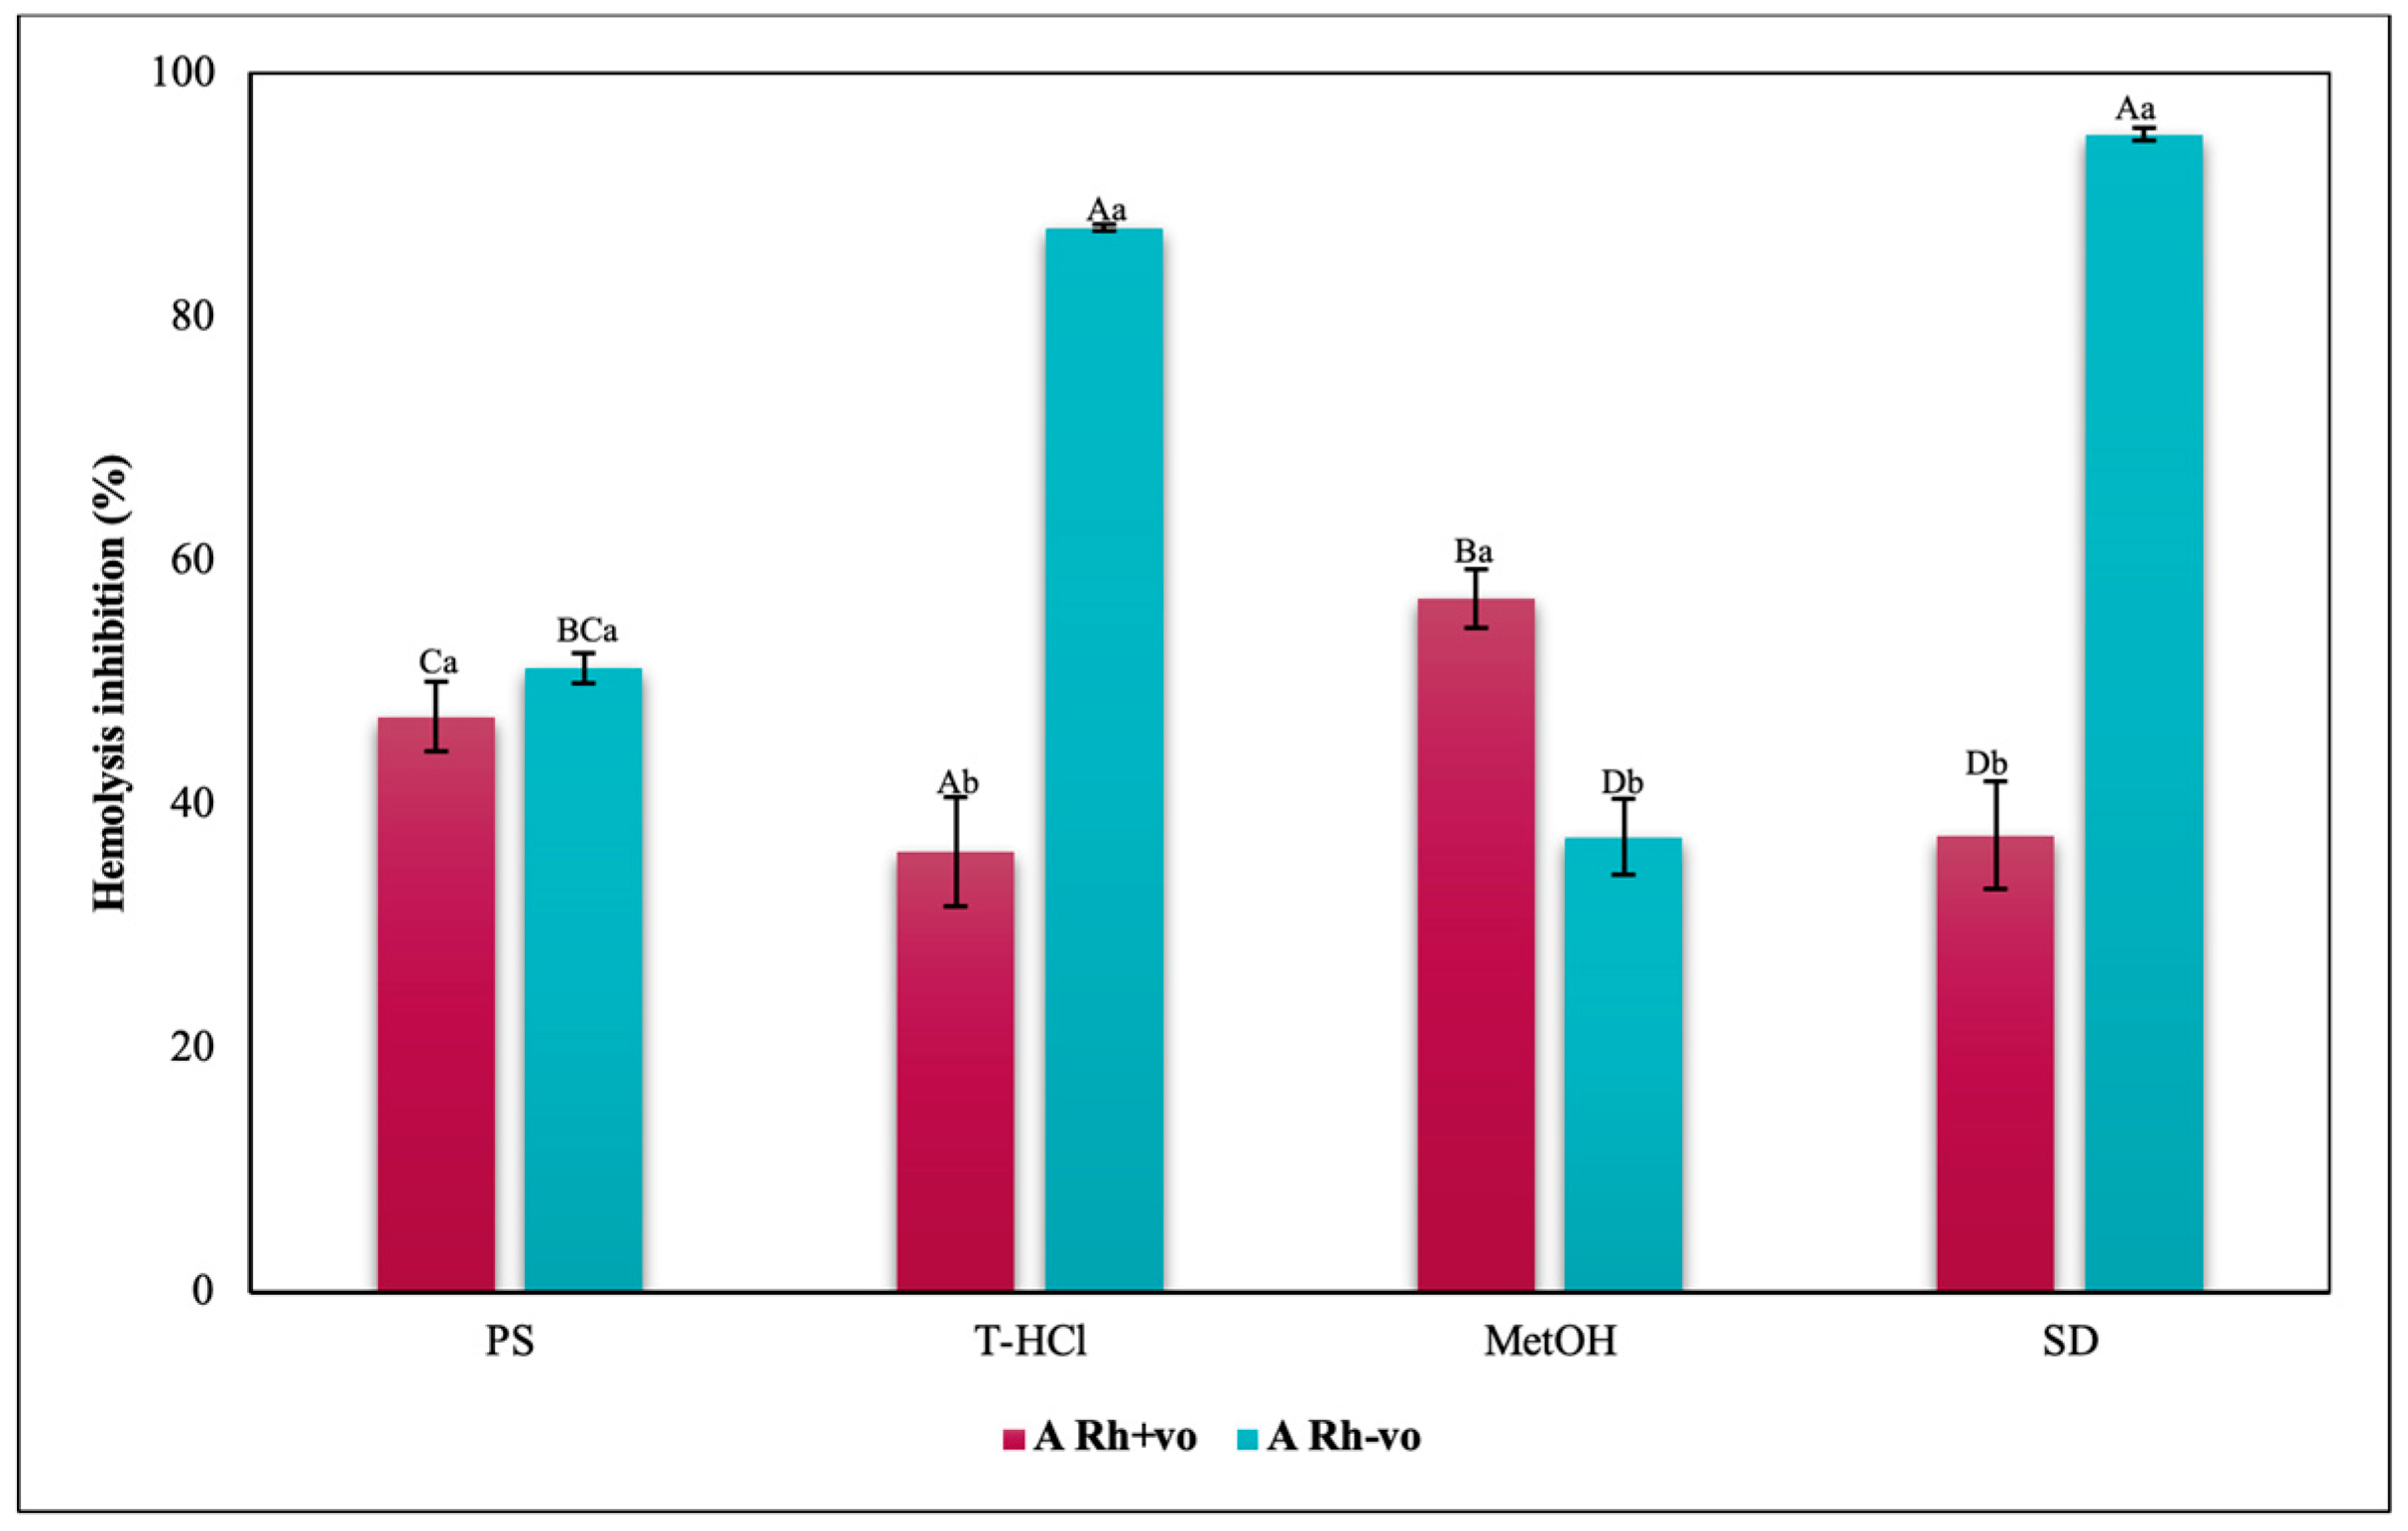
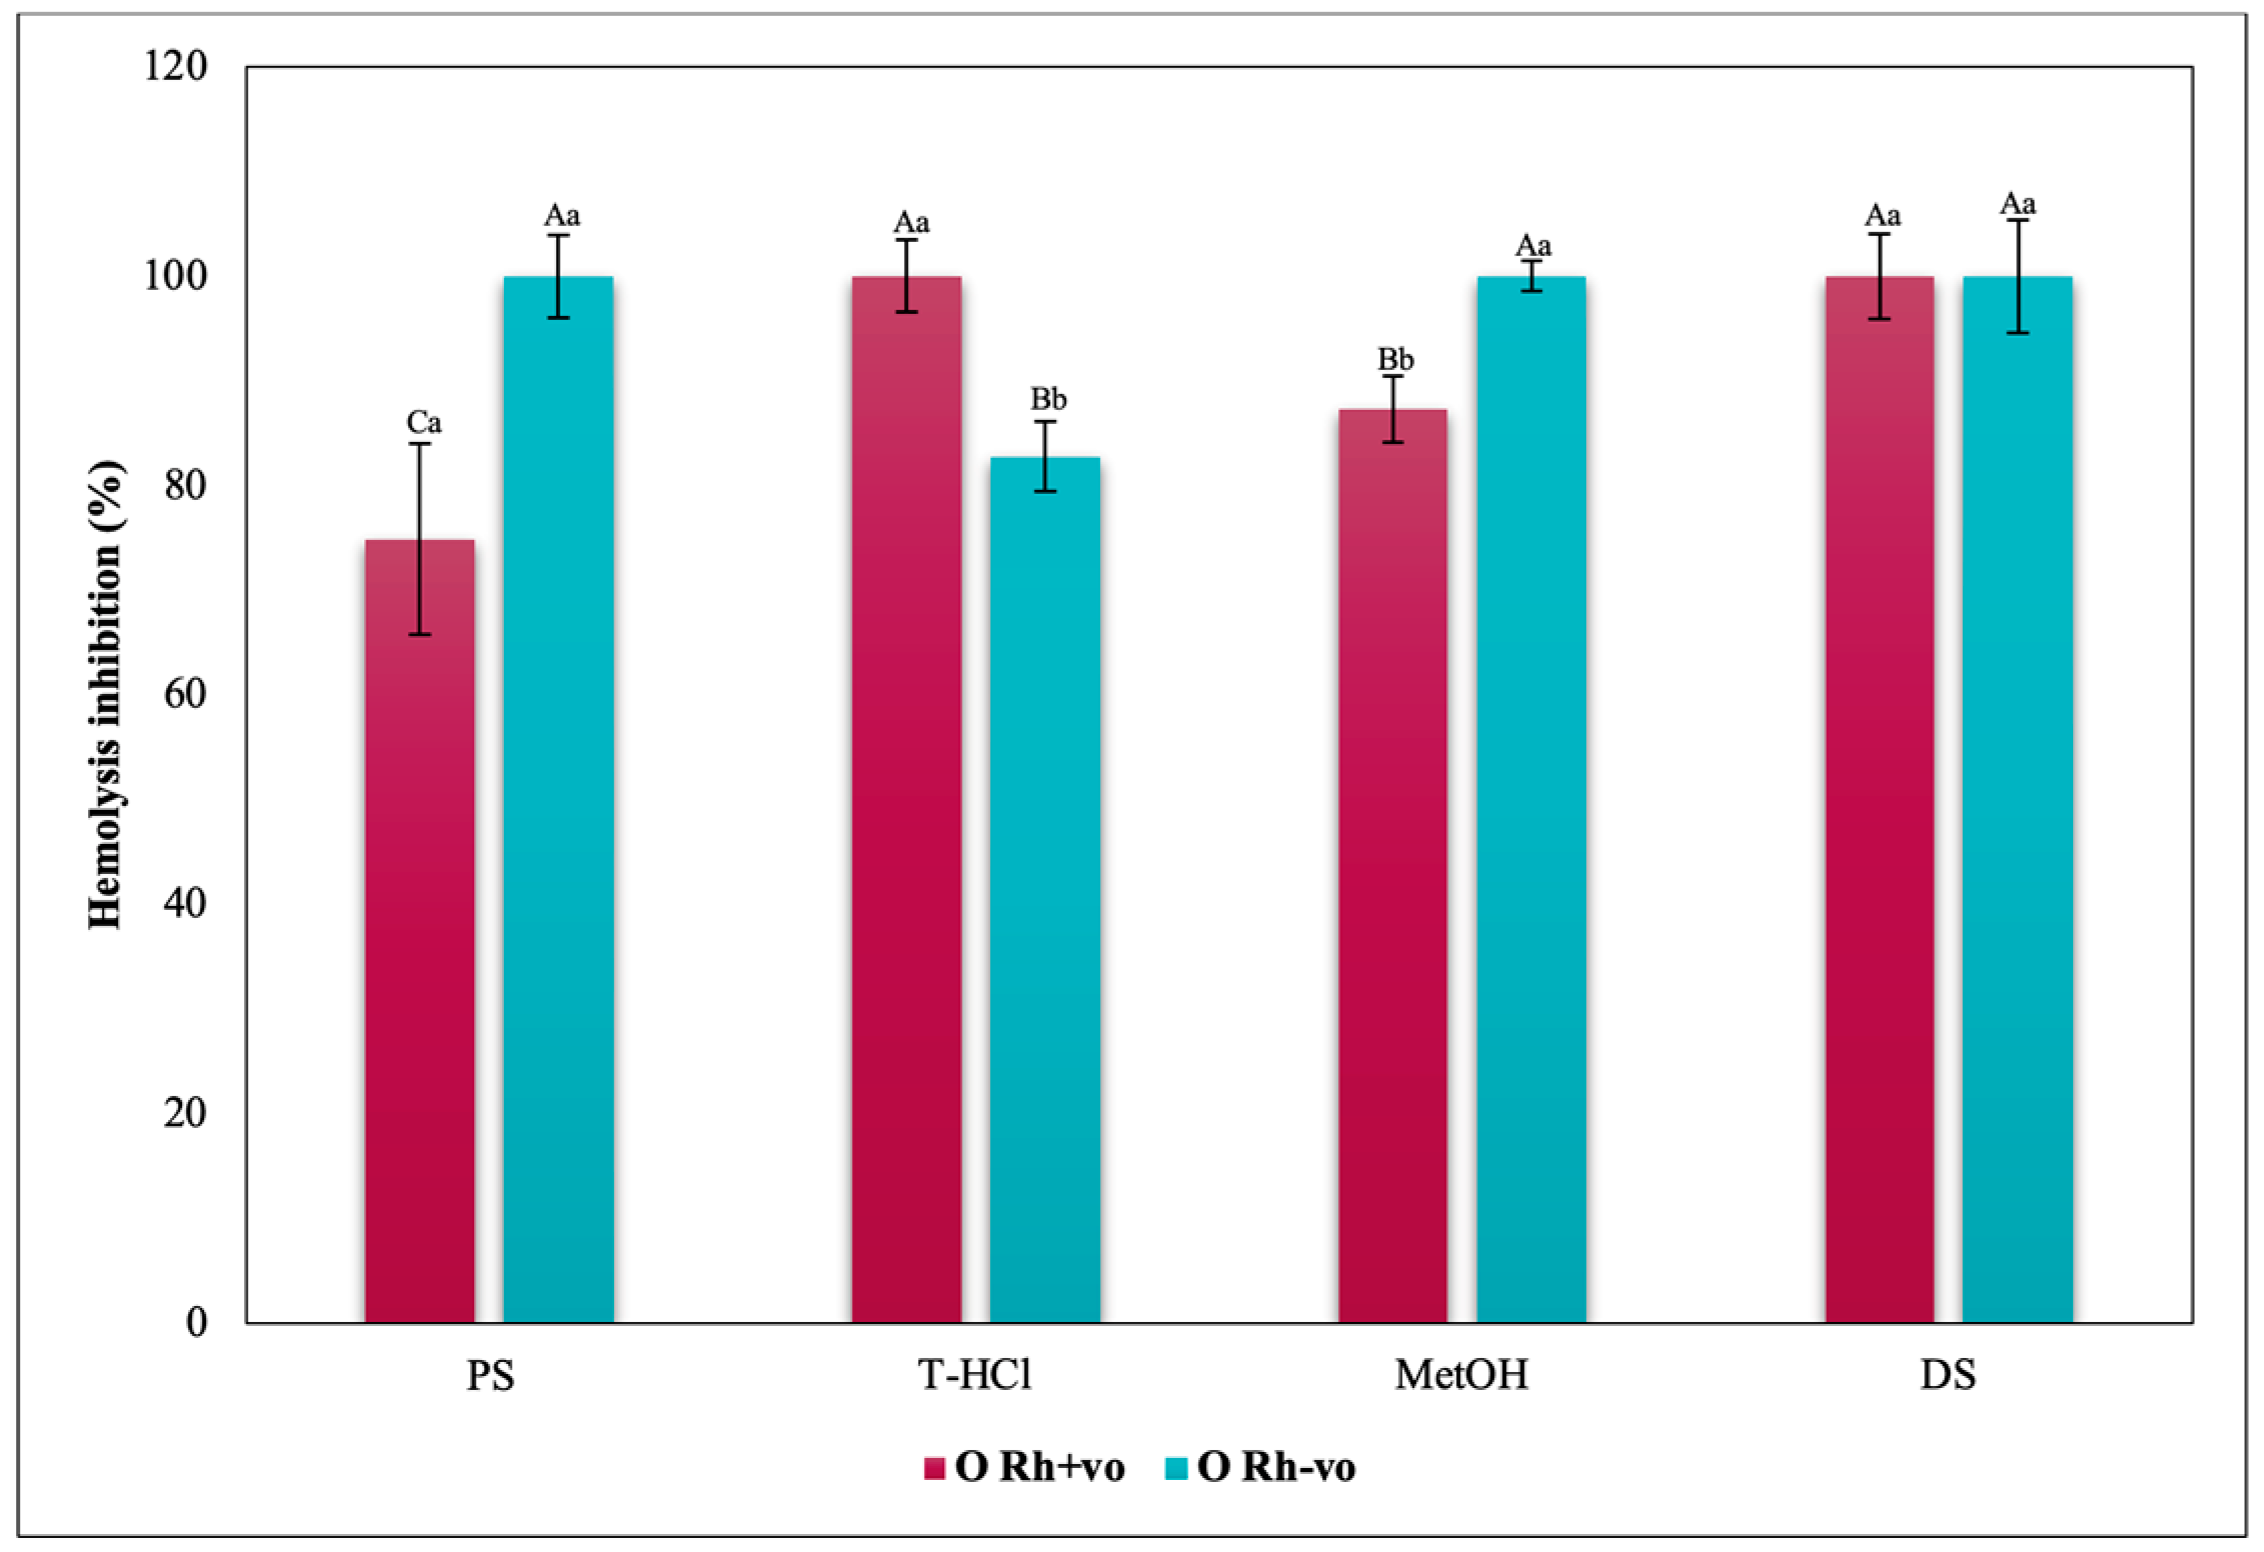
Hypotonicity Induced-Hemolysis Inhibition
Heat Induced-Hemolysis Inhibition
4. Conclusions
Author Contributions
Funding
Institutional Review Board Statement
Informed Consent Statement
Data Availability Statement
Acknowledgments
Conflicts of Interest
References
- Reilly, J.P.; Meyer, N.J.; Shashaty, M.G.S.; Anderson, B.J.; Ittner, C.; Dunn, T.G.; Lim, B.; Forker, C.; Bonk, M.P.; Kotloff, E.; et al. The ABO Histo-Blood Group, Endothelial Activation, and Acute Respiratory Distress Syndrome Risk in Critical Illness. J. Clin. Investig. 2021, 131, e139700. [Google Scholar] [CrossRef] [PubMed]
- Pessoa, A.; Miranda, C.F.; Batista, M.; Bosio, M.; Marques, G.; Nunes, F.; Quinta-Ferreira, R.M.; Quinta-Ferreira, M.E. Action of Bioactive Compounds in Cellular Oxidative Response. Energy Rep. 2020, 6, 891–896. [Google Scholar] [CrossRef]
- Mailloux, R.J. Application of Mitochondria-Targeted Pharmaceuticals for the Treatment of Heart Disease. Curr. Pharm. Des. 2016, 22, 4763–4779. [Google Scholar] [CrossRef] [PubMed]
- Nakai, K.; Tsuruta, D. What Are Reactive Oxygen Species, Free Radicals, and Oxidative Stress in Skin Diseases? Int. J. Mol. Sci. 2021, 22, 10799. [Google Scholar] [CrossRef]
- Phaniendra, A.; Jestadi, D.B.; Periyasamy, L. Free Radicals: Properties, Sources, Targets, and Their Implication in Various Diseases. Indian J. Clin. Biochem. 2014, 30, 11–26. [Google Scholar] [CrossRef]
- Naparło, K.; Soszyński, M.; Bartosz, G.; Sadowska-Bartosz, I. Comparison of Antioxidants: The Limited Correlation between Various Assays of Antioxidant Activity. Molecules 2020, 25, 3244. [Google Scholar] [CrossRef]
- Siddon, A.J.; Tormey, C.A. The Chemical and Laboratory Investigation of Hemolysis. Adv. Clin. Chem. 2019, 89, 215–258. [Google Scholar] [CrossRef]
- Bozza, M.T.; Jeney, V. Pro-Inflammatory Actions of Heme and Other Hemoglobin-Derived DAMPs. Front. Immunol. 2020, 11, 1323. [Google Scholar] [CrossRef]
- Meo, S.A.; Suraya, F.; Jamil, B.; Rouq, F.A.; Meo, A.S.; Sattar, K.; Ansari, M.J.; Alasiri, S.A. Association of ABO and Rh Blood Groups with Breast Cancer. Saudi J. Biol. Sci. 2017, 24, 1609–1613. [Google Scholar] [CrossRef]
- El Jellas, K.; Hoem, D.; Hagen, K.G.; Kalvenes, M.B.; Aziz, S.; Steine, S.J.; Immervoll, H.; Johansson, S.; Molven, A. Associations between ABO Blood Groups and Pancreatic Ductal Adenocarcinoma: Influence on Resection Status and Survival. Cancer Med. 2017, 6, 1531–1540. [Google Scholar] [CrossRef]
- Ellinghaus, D.; Degenhardt, F.; Bujanda, L.; Buti, M.; Albillos, A.; Invernizzi, P.; Fernández, J.; Prati, D.; Baselli, G.; Asselta, R.; et al. Genomewide Association Study of Severe Covid-19 with Respiratory Failure. N. Engl. J. Med. 2020, 383, 1522–1534. [Google Scholar] [CrossRef] [PubMed]
- Dahlén, T.; Clements, M.; Zhao, J.; Olsson, M.L.; Edgren, G. An Agnostic Study of Associations between ABO and RhD Blood Group and Phenome-Wide Disease Risk. eLife 2021, 10, e65658. [Google Scholar] [CrossRef] [PubMed]
- Getawa, S.; Bayleyegn, B.; Aynalem, M.; Worku, Y.B.; Adane, T. Relationships of ABO and Rhesus Blood Groups with Type 2 Diabetes Mellitus: A Systematic Review and Meta-Analysis. J. Int. Med. Res. 2022, 50, 030006052211295. [Google Scholar] [CrossRef] [PubMed]
- Chen, Y.; Hu, N.; Liao, L.; Yu, K.; Shu, X.-O.; Zheng, W.; Yuan, J.-M.; Koh, W.-P.; Qiao, Y.-L.; Fan, J.-H.; et al. ABO Genotypes and the Risk of Esophageal and Gastric Cancers. BMC Cancer 2021, 21, 589. [Google Scholar] [CrossRef]
- Al-Sawat, A.; Alswat, S.; Alosaimi, R.; Alharthi, M.; Alsuwat, M.; Alhasani, K.; Alharthi, W. Relationship between ABO Blood Group and the Risk of Colorectal Cancer: A Retrospective Multicenter Study. J. Clin. Med. Res. 2022, 14, 119–125. [Google Scholar] [CrossRef]
- Anderson, J.L.; May, H.T.; Knight, S.; Bair, T.L.; Horne, B.D.; Knowlton, K.U. Association of Rhesus Factor Blood Type with Risk of SARS-CoV-2 Infection and COVID-19 Severity. Br. J. Haematol. 2022, 197, 573–575. [Google Scholar] [CrossRef]
- Biswas, A.; Jiang, Y.; Li, D.; Mehta, H.J.; Kaye, F. The Prevalence of Rhesus-Negative Blood Group among Patient with Small Cell Lung Cancer and Analysis of Its Effect on Overall Survival. Front. Oncol. 2018, 8, 358. [Google Scholar] [CrossRef]
- Sharifi-Rad, M.; Anil Kumar, N.V.; Zucca, P.; Varoni, E.M.; Dini, L.; Panzarini, E.; Rajkovic, J.; Tsouh Fokou, P.V.; Azzini, E.; Peluso, I.; et al. Lifestyle, Oxidative Stress, and Antioxidants: Back and Forth in the Pathophysiology of Chronic Diseases. Front. Physiol. 2020, 11, 694. [Google Scholar] [CrossRef]
- World Health Organization. Global Health Estimates: Leading Causes of Death. Available online: https://www.who.int/data/gho/data/themes/mortality-and-global-health-estimates/ghe-leading-causes-of-death (accessed on 20 September 2022).
- Henriksen, E.J. Role of Oxidative Stress in the Pathogenesis of Insulin Resistance and Type 2 Diabetes. In Bioactive Food as Dietary Interventions for Diabetes; Academic Press: Cambridge, MA, USA, 2019; pp. 3–17. [Google Scholar] [CrossRef]
- Brainina, K.; Stozhko, N.; Vidrevich, M. Antioxidants: Terminology, Methods, and Future Considerations. Antioxidants 2019, 8, 297. [Google Scholar] [CrossRef]
- Apak, R.; Özyürek, M.; Güçlü, K.; Çapanoğlu, E. Antioxidant Activity/Capacity Measurement. 1. Classification, Physicochemical Principles, Mechanisms, and Electron Transfer (ET)-Based Assays. J. Agric. Food Chem. 2016, 64, 997–1027. [Google Scholar] [CrossRef]
- Sun, Y.; Yang, C.; Tsao, R. Nomenclature and General Classification of Antioxidant Activity/Capacity Assays. In Measurement of Antioxidant Activity & Capacity; John Wiley & Sons Ltd.: Hoboken, NJ, USA, 2017; pp. 1–19. [Google Scholar] [CrossRef]
- López-Pedrouso, M.; Lorenzo, J.M.; Franco, D. Advances in Natural Antioxidants for Food Improvement. Antioxidants 2022, 11, 1825. [Google Scholar] [CrossRef] [PubMed]
- Patel, A.K.; Laroche, C.; Marcati, A.; Ursu, A.V.; Jubeau, S.; Marchal, L.; Petit, E.; Djelveh, G.; Michaud, P. Separation and Fractionation of Exopolysaccharides from Porphyridium Cruentum. Bioresour. Technol. 2013, 145, 345–350. [Google Scholar] [CrossRef] [PubMed]
- Alam, M.A.; Xu, J.-L.; Wang, Z. Microalgae Biotechnology for Food, Health and High Value Products; Springer Singapore: Singapore, 2020; ISBN 9789811501685. [Google Scholar]
- Manirafasha, E.; Ndikubwimana, T.; Zeng, X.; Lu, Y.; Jing, K. Phycobiliprotein: Potential Microalgae Derived Pharmaceutical and Biological Reagent. Biochem. Eng. J. 2016, 109, 282–296. [Google Scholar] [CrossRef]
- Kannaujiya, V.K.; Sundaram, S.; Sinha, R.P. Phycobiliproteins: Recent Developments and Future Applications; Springer Singapore: Singapore, 2017; ISBN 9789811064593. [Google Scholar]
- Dagnino-Leone, J.; Pinto Figueroa, C.; Latorre Castañeda, M.; Donoso Youlton, A.; Vallejos-Almirall, A.; Agurto-Muñoz, A.; Pavón Pérez, J.; Agurto-Muñoz, C. Phycobiliproteins: Structural Aspects, Functional Characteristics, and Biotechnological Perspectives. Comput. Struct. Biotechnol. J. 2022, 20, 1506–1527. [Google Scholar] [CrossRef] [PubMed]
- Queiroz, M.I.; Vieira, J.G.; Maroneze, M.M. Morphophysiological, Structural, and Metabolic Aspects of Microalgae. In Handbook of Microalgae-Based Processes and Products; Academic Press: Cambridge, MA, USA, 2020; pp. 25–48. [Google Scholar] [CrossRef]
- Romay, C.; Gonzalez, R. Phycocyanin Is an Antioxidant Protector of Human Erythrocytes against Lysis by Peroxyl Radicals. J. Pharm. Pharmacol. 2000, 52, 367–368. [Google Scholar] [CrossRef]
- Eriksen, N.T. Production of Phycocyanin—A Pigment with Applications in Biology, Biotechnology, Foods and Medicine. Appl. Microbiol. Biotechnol. 2008, 80, 1–14. [Google Scholar] [CrossRef]
- Kuddus, M.; Singh, P.; Thomas, G.; Al-Hazimi, A. Recent Developments in Production and Biotechnological Applications of C-Phycocyanin. BioMed Res. Int. 2013, 2013, 742859. [Google Scholar] [CrossRef]
- Bermejo, R.; Talavera, E.M.; Alvarez-Pez, J.M. Chromatographic Purification and Characterization of B-Phycoerythrin from Porphyridium Cruentum. J. Chromatogr. A 2001, 917, 135–145. [Google Scholar] [CrossRef]
- Mysliwa-Kurdziel, B.; Solymosi, K. Phycobilins and Phycobiliproteins Used in Food Industry and Medicine. Mini-Rev. Med. Chem. 2017, 17, 1173–1193. [Google Scholar] [CrossRef] [PubMed]
- Mattioli, R.; Mosca, L.; Sánchez-Lamar, A.; Tempera, I.; Hausmann, R. Natural Bioactive Compounds Acting against Oxidative Stress in Chronic, Degenerative, and Infectious Diseases. Oxidative Med. Cell. Longev. 2018, 2018, 3894381. [Google Scholar] [CrossRef] [PubMed]
- Guillard, R.R.L.; Ryther, J.H. Studies of Marine Planktonic Diatoms: I. Cyclotella Nana Hustedt, and Detonula Confervacea (CLEVE) Gran. Can. J. Microbiol. 1962, 8, 229–239. [Google Scholar] [CrossRef]
- Arredondo Vega, B.O.; Voltolina, D. Métodos y Herramientas Analíticas en la Evaluación de la Biomasa Microalgal; Centro de Investigaciones Biológicas del Noroeste, S.C.: La Paz, Mexico, 2007. [Google Scholar]
- Bennett, A.; Bogorad, L. Complementary chromatic adaptation in a filamentous blue-green alga. J. Cell Biol. 1973, 58, 419–435. [Google Scholar] [CrossRef] [PubMed]
- Bryant, D.A.; Guglielmi, G.; de Marsac, N.T.; Castets, A.-M.; Cohen-Bazire, G. The Structure of Cyanobacterial Phycobilisomes: A Model. Arch. Microbiol. 1979, 123, 113–127. [Google Scholar] [CrossRef]
- Beer, S.; Eshel, A. Determining Phycoerythrin and Phycocyanin Concentrations in Aqueous Crude Extracts of Red Algae. Mar. Freshw. Res. 1985, 36, 785. [Google Scholar] [CrossRef]
- Wellburn, A.R. The Spectral Determination of Chlorophylls a and B, as Well as Total Carotenoids, Using Various Solvents with Spectrophotometers of Different Resolution. J. Plant Physiol. 1994, 144, 307–313. [Google Scholar] [CrossRef]
- Lichtenthaler, H.K.; Wellburn, A.R. Determinations of Total Carotenoids and Chlorophylls a and B of Leaf Extracts in Different Solvents. Biochem. Soc. Trans. 1983, 11, 591–592. [Google Scholar] [CrossRef]
- Smith, P.K.; Krohn, R.I.; Hermanson, G.T.; Mallia, A.K.; Gartner, F.H.; Provenzano, M.D.; Fujimoto, E.K.; Goeke, N.M.; Olson, B.J.; Klenk, D.C. Measurement of Protein Using Bicinchoninic Acid. Anal. Biochem. 1985, 150, 76–85. [Google Scholar] [CrossRef]
- Re, R.; Pellegrini, N.; Proteggente, A.; Pannala, A.; Yang, M.; Rice-Evans, C. Antioxidant Activity Applying an Improved ABTS Radical Cation Decolorization Assay. Free. Radic. Biol. Med. 1999, 26, 1231–1237. [Google Scholar] [CrossRef] [PubMed]
- Brand-Williams, W.; Cuvelier, M.E.; Berset, C. Use of a Free Radical Method to Evaluate Antioxidant Activity. LWT—Food Sci. Technol. 1995, 28, 25–30. [Google Scholar] [CrossRef]
- Benzie, I.F.F.; Strain, J.J. The Ferric Reducing Ability of Plasma (FRAP) as a Measure of “Antioxidant Power”: The FRAP Assay. Anal. Biochem. 1996, 239, 70–76. [Google Scholar] [CrossRef] [PubMed]
- Belokoneva, O.S.; Villegas, E.; Corzo, G.; Dai, L.; Nakajima, T. The Hemolytic Activity of Six Arachnid Cationic Peptides Is Affected by the Phosphatidylcholine-To-Sphingomyelin Ratio in Lipid Bilayers. Biochim. Et Biophys. Acta (BBA)—Biomembr. 2003, 1617, 22–30. [Google Scholar] [CrossRef] [PubMed]
- Liu, S.; Huang, H. Assessments of Antioxidant Effect of Black Tea Extract and Its Rationals by Erythrocyte Haemolysis Assay, Plasma Oxidation Assay and Cellular Antioxidant Activity (CAA) Assay. J. Funct. Foods 2015, 18, 1095–1105. [Google Scholar] [CrossRef]
- Hernández-Ruiz, K.L.; Ruiz-Cruz, S.; Cira-Chávez, L.A.; Gassos-Ortega, L.E.; Ornelas-Paz, J.d.J.; Del-Toro-Sánchez, C.L.; Márquez-Ríos, E.; López-Mata, M.A.; Rodríguez-Félix, F. Evaluation of Antioxidant Capacity, Protective Effect on Human Erythrocytes and Phenolic Compound Identification in Two Varieties of Plum Fruit (Spondias spp.) by UPLC-MS. Molecules 2018, 23, 3200. [Google Scholar] [CrossRef] [PubMed]
- Agarwal, H.; Shanmugam, V.K. Anti-Inflammatory Activity Screening of Kalanchoe Pinnata Methanol Extract and Its Validation Using a Computational Simulation Approach. Inform. Med. Unlocked 2019, 14, 6–14. [Google Scholar] [CrossRef]
- Razaghi, A.; Godhe, A.; Albers, E. Effects of Nitrogen on Growth and Carbohydrate Formation in Porphyridium Cruentum. Open Life Sci. 2014, 9, 156–162. [Google Scholar] [CrossRef]
- Arashiro, L.T.; Boto-Ordóñez, M.; Van Hulle, S.W.H.; Ferrer, I.; Garfí, M.; Rousseau, D.P.L. Natural Pigments from Microalgae Grown in Industrial Wastewater. Bioresour. Technol. 2020, 303, 122894. [Google Scholar] [CrossRef]
- Chang, L.; Liu, X.; Li, Y.; Liu, C.-C.; Yang, F.; Zhao, J.; Sui, S.-F. Structural Organization of an Intact Phycobilisome and Its Association with Photosystem II. Cell Res. 2015, 25, 726–737. [Google Scholar] [CrossRef]
- Borics, G.; Lerf, V.; T-Krasznai, E.; Stanković, I.; Pickó, L.; Béres, V.; Várbíró, G. Biovolume and Surface Area Calculations for Microalgae, Using Realistic 3D Models. Sci. Total Environ. 2021, 773, 145538. [Google Scholar] [CrossRef] [PubMed]
- Gani, P.; Hua, A.K.; Sunar, N.M.; Matias-Peralta, H.M.; Apandi, N. The Influence of Photoperiod, Light Intensity, Temperature and Salinity on the Growth Rate and Biomass Productivity of Botryococcus sp. IOP Conf. Ser. Earth Environ. Sci. 2021, 646, 012006. [Google Scholar] [CrossRef]
- Gudvilovich, I.N.; Lelekov, A.S.; Maltsev, E.I.; Kulikovskii, M.S.; Borovkov, A.B. Growth of Porphyridium Purpureum (Porphyridiales, Rhodophyta) and Production of B-Phycoerythrin under Varying Illumination. Russ. J. Plant Physiol. 2021, 68, 188–196. [Google Scholar] [CrossRef]
- Tsaloglou, M.N. Microalgae: Current Research and Applications; Caister Academic Press: Poole, UK, 2016; ISBN 9781910190272. [Google Scholar]
- Durmaz, Y.; Tamtürk, F.; Konar, N.; Tokey, Ö.S.; Palabiyik, İ. Effect of Pigment Composition of Porphyridium Cruentum as Continuously Culture Method in Industrial Scale Tubular Photobioreactor. Int. J. Life Sci. Biotechnol. Y Pharma Res. 2017, 6, 18–21. [Google Scholar] [CrossRef]
- Tran, T.; Lafarge, C.; Pradelles, R.; Perrier-Cornet, J.-M.; Cayot, N.; Loupiac, C. Effect of High Hydrostatic Pressure on the Structure of the Soluble Protein Fraction in Porphyridium Cruentum Extracts. Innov. Food Sci. Emerg. Technol. 2019, 58, 102226. [Google Scholar] [CrossRef]
- Liu, H.; Zhang, H.; Niedzwiedzki, D.M.; Prado, M.; He, G.; Gross, M.L.; Blankenship, R.E. Phycobilisomes Supply Excitations to Both Photosystems in a Megacomplex in Cyanobacteria. Science 2013, 342, 1104–1107. [Google Scholar] [CrossRef]
- Juin, C.; Chérouvrier, J.-R.; Thiéry, V.; Gagez, A.-L.; Bérard, J.-B.; Joguet, N.; Kaas, R.; Cadoret, J.-P.; Picot, L. Microwave-Assisted Extraction of Phycobiliproteins from Porphyridium Purpureum. Appl. Biochem. Biotechnol. 2014, 175, 1–15. [Google Scholar] [CrossRef]
- Takaichi, S. Carotenoids in Algae: Distributions, Biosyntheses and Functions. Mar. Drugs 2011, 9, 1101–1118. [Google Scholar] [CrossRef]
- Björling, A.; Berntsson, O.; Lehtivuori, H.; Takala, H.; Hughes, A.J.; Panman, M.; Hoernke, M.; Niebling, S.; Henry, L.; Henning, R.; et al. Structural Photoactivation of a Full-Length Bacterial Phytochrome. Sci. Adv. 2016, 2, e1600920. [Google Scholar] [CrossRef]
- Rebolloso Fuentes, M.; Acien Fernandez, G.G.; Sanchez Perez, J.A.; Guil Guerrero, J.L. Biomass Nutrient Profiles of the Microalga Porphyridium Cruentum. Food Chem. 2000, 70, 345–353. [Google Scholar] [CrossRef]
- Xu, D.; Sun, N.; Xuan, S.; Wang, C.; Huang, T.; Li, C.; Zhang, J.; Yang, W. Effect of Different Drying Methods on the Physicochemical Properties and Phycobiliprotein Structure of Porphyra Haitanensis. Int. J. Food Eng. 2020, 17, 111–120. [Google Scholar] [CrossRef]
- Tonog, P.; Lakhkar, A.D. Normal Saline. Available online: https://pubmed.ncbi.nlm.nih.gov/31424794/ (accessed on 12 August 2022).
- Lee, S.; Kang, H.; Do, Y.; Lee, G.; Kim, J.; Han, H. High-Precision THz Dielectric Spectroscopy of Tris-HCl Buffer. J. Opt. Soc. Korea 2016, 20, 431–434. [Google Scholar] [CrossRef]
- Liu, X.; Yang, H.; Xiong, P.; Li, W.; Huang, H.-H.; Zheng, Y. Comparative Studies of Tris-HCl, HEPES and NaHCO3/CO2 Buffer Systems on the Biodegradation Behaviour of Pure Zn in NaCl and SBF Solutions. Corros. Sci. 2019, 157, 205–219. [Google Scholar] [CrossRef]
- Durst, R.A.; Staples, B.R. Tris/Tris·HCl: A Standard Buffer for Use in the Physiologic PH Range. Clin. Chem. 1972, 18, 206–208. [Google Scholar] [CrossRef] [PubMed]
- Duong-Ly, K.C.; Gabelli, S.B. Salting out of Proteins Using Ammonium Sulfate Precipitation. Methods Enzymol. 2014, 541, 85–94. [Google Scholar] [CrossRef] [PubMed]
- Reddi, B.A. Why Is Saline so Acidic (and Does It Really Matter?). Int. J. Med. Sci. 2013, 10, 747–750. [Google Scholar] [CrossRef]
- Saran, S.; Puri, N.; Jasuja, N.D.; Kumar, M.; Sharma, G. Optimization, Purification and Characterization of Phycocyanin from Spirulina Platensis. Available online: https://www.semanticscholar.org/paper/Optimization-%2C-Purification-and-characterization-of-Saran-Puri/30b970d8a250e59457714578ec588ff1dd96f4b0 (accessed on 8 January 2023).
- Butnariu, M. Methods of Analysis (Extraction, Separation, Identification and Quantification) of Carotenoids from Natural Products. J. Ecosyst. Ecography 2016, 6, 1000193. [Google Scholar] [CrossRef]
- Agustini, N.W.S. Kusmiati Potency of Endo-Exopolysaccharide from Porphyridium Cruentum (S.F.Gray) Nägeli as Antioxidant (DPPH) and Biological Toxicity (BSLT). KnE Life Sci. 2017, 3, 147. [Google Scholar] [CrossRef]
- Parcheta, M.; Świsłocka, R.; Orzechowska, S.; Akimowicz, M.; Choińska, R.; Lewandowski, W. Recent Developments in Effective Antioxidants: The Structure and Antioxidant Properties. Materials 2021, 14, 1984. [Google Scholar] [CrossRef]
- Kasote, D.M.; Jayaprakasha, G.K.; Patil, B.S. Leaf Disc Assays for Rapid Measurement of Antioxidant Activity. Sci. Rep. 2019, 9, 1884. [Google Scholar] [CrossRef]
- Bibi Sadeer, N.; Montesano, D.; Albrizio, S.; Zengin, G.; Mahomoodally, M.F. The Versatility of Antioxidant Assays in Food Science and Safety—Chemistry, Applications, Strengths, and Limitations. Antioxidants 2020, 9, 709. [Google Scholar] [CrossRef] [PubMed]
- Siddeeg, A.; AlKehayez, N.M.; Abu-Hiamed, H.A.; Al-Sanea, E.A.; AL-Farga, A.M. Mode of Action and Determination of Antioxidant Activity in the Dietary Sources: An Overview. Saudi J. Biol. Sci. 2021, 28, 1633–1644. [Google Scholar] [CrossRef] [PubMed]
- Mendonça, J.d.S.; Guimarães, R. de C.A.; Zorgetto-Pinheiro, V.A.; Fernandes, C.D.P.; Marcelino, G.; Bogo, D.; Freitas, K. de C.; Hiane, P.A.; de Pádua Melo, E.S.; Vilela, M.L.B.; et al. Natural Antioxidant Evaluation: A Review of Detection Methods. Molecules 2022, 27, 3563. [Google Scholar] [CrossRef] [PubMed]
- Triantis, T.M.; Yannakopoulou, E.; Nikokavoura, A.; Dimotikali, D.; Papadopoulos, K. Chemiluminescent Studies on the Antioxidant Activity of Amino Acids. Anal. Chim. Acta 2007, 591, 106–111. [Google Scholar] [CrossRef]
- Marcati, A.; Ursu, A.V.; Laroche, C.; Soanen, N.; Marchal, L.; Jubeau, S.; Djelveh, G.; Michaud, P. Extraction and Frac-tionation of Polysaccharides and B-Phycoerythrin from the Microalga Porphyridium Cruentum by Membrane Tech-nology. Algal Res. 2014, 5, 258–263. [Google Scholar] [CrossRef]
- Martins, M.; Soares, B.P.; Santos, J.H.P.M.; Bharmoria, P.; Torres Acosta, M.A.; Dias, A.C.R.V.; Coutinho, J.A.P.; Ventura, S.P.M. Sustainable Strategy Based on Induced Precipitation for the Purification of Phycobiliproteins. ACS Sustain. Chem. Eng. 2021, 9, 3942–3954. [Google Scholar] [CrossRef]
- Shahid Ud Daula, A.F.M.; Kamariah, A.S.; Lim, L.B.L.; Ahmad, N. Phytochemical Screening, Antioxidant, and Antimicrobial Activities of Leaves, Stems, and Rhizomes of Etlingera Coccinea (Blume) S. Sakai & Nagam. Int. J. Pharmacogn. Phytochem. Res. 2015, 7, 873–883. [Google Scholar]
- Casagrande do Nascimento, T.; Campos Chisté, R.; Queiroz Zepka, L. Analytical Protocols in Antioxidant Capacity Measurement. In Pigments from Microalgae Handbook; Springer: Berlin/Heidelberg, Germany, 2020; pp. 203–228. [Google Scholar] [CrossRef]
- Kenny, O.; Brunton, N.P.; Smyth, T.J. In Vitro Protocols for Measuring the Antioxidant Capacity of Algal Extracts. Methods Mol. Biol. 2015, 1308, 375–402. [Google Scholar] [CrossRef]
- Sonani, R.R.; Singh, N.K.; Kumar, J.; Thakar, D.; Madamwar, D. Concurrent Purification and Antioxidant Activity of Phycobiliproteins from Lyngbya sp. A09DM: An Antioxidant and Anti-Aging Potential of Phycoerythrin in Caenorhabditis Elegans. Process Biochem. 2014, 49, 1757–1766. [Google Scholar] [CrossRef]
- Sonani, R.R. Antioxidant Potential of Phycobiliproteins: Role in Anti-Aging Research. Biochem. Anal. Bio-Chem. 2015, 4, 2. [Google Scholar] [CrossRef]
- Sarmadi, B.H.; Ismail, A. Antioxidative Peptides from Food Proteins: A Review. Peptides 2010, 31, 1949–1956. [Google Scholar] [CrossRef] [PubMed]
- Noipa, T.; Srijaranai, S.; Tuntulani, T.; Ngeontae, W. New Approach for Evaluation of the Antioxidant Capacity Based on Scavenging DPPH Free Radical in Micelle Systems. Food Res. Int. 2011, 44, 798–806. [Google Scholar] [CrossRef]
- Boudier, A.; Tournebize, J.; Bartosz, G.; El Hani, S.; Bengueddour, R.; Sapin-Minet, A.; Leroy, P. High-Performance Liquid Chromatographic Method to Evaluate the Hydrogen Atom Transfer during Reaction between 1,1-Diphenyl-2-Picryl-Hydrazyl Radical and Antioxidants. Anal. Chim. Acta 2012, 711, 97–106. [Google Scholar] [CrossRef]
- Shahidi, F.; Zhong, Y. Measurement of Antioxidant Activity. J. Funct. Foods 2015, 18, 757–781. [Google Scholar] [CrossRef]
- Shahidi, F.; Ambigaipalan, P. Phenolics and Polyphenolics in Foods, Beverages and Spices: Antioxidant Activity and Health Effects—A Review. J. Funct. Foods 2015, 18, 820–897. [Google Scholar] [CrossRef]
- Sonmez, M.; Ince, H.Y.; Yalcin, O.; Ajdžanović, V.; Spasojević, I.; Meiselman, H.J.; Baskurt, O.K. The Effect of Alcohols on Red Blood Cell Mechanical Properties and Membrane Fluidity Depends on Their Molecular Size. PLoS ONE 2013, 8, e76579. [Google Scholar] [CrossRef]
- Truong, D.; Ta, N.T.A.; Pham, T.V.; Huynh, T.D.; Do, Q.T.G.; Dinh, N.C.G.; Dang, C.D.; Nguyen, T.K.C.; Bui, A.V. Effects of Solvent—Solvent Fractionation on the Total Terpenoid Content and in Vitro Anti-Inflammatory Activity of Serevenia Buxifolia Bark Extract. Food Sci. Nutr. 2021, 9, 1720–1735. [Google Scholar] [CrossRef]
- Goodhead, L.K.; MacMillan, F.M. Measuring Osmosis and Hemolysis of Red Blood Cells. Adv. Physiol. Educ. 2017, 41, 298–305. [Google Scholar] [CrossRef]
- Bourebaba, L.; Gilbert-López, B.; Oukil, N.; Bedjou, F. Phytochemical Composition of Ecballium Elaterium Extracts with Antioxidant and Anti-Inflammatory Activities: Comparison among Leaves, Flowers and Fruits Extracts. Arab. J. Chem. 2020, 13, 3286–3300. [Google Scholar] [CrossRef]
- Ximenes, V.F.; Lopes, M.G.; Petrônio, M.S.; Regasini, L.O.; Siqueira Silva, D.H.; da Fonseca, L.M. Inhibitory Effect of Gallic Acid and Its Esters on 2,2′-Azobis(2-Amidinopropane)Hydrochloride (AAPH)-Induced Hemolysis and Depletion of In-tracellular Glutathione in Erythrocytes. J. Agric. Food Chem. 2010, 58, 5355–5362. [Google Scholar] [CrossRef] [PubMed]
- Francenia Santos-Sánchez, N.; Salas-Coronado, R.; Villanueva-Cañongo, C.; Hernández-Carlos, B. Antioxidant Compounds and Their Antioxidant Mechanism. In Antioxidants; IntechOpen: London, UK, 2019; pp. 1–28. [Google Scholar] [CrossRef]
- Lauceri, R.; Bresciani, M.; Lami, A.; Morabito, G. Chlorophyll a Interference in Phycocyanin and Allophycocyanin Spec-trophotometric Quantification. J. Limnol. 2017, 77, 1691. [Google Scholar] [CrossRef]
- Galetović, A.; Seura, F.; Gallardo, V.; Graves, R.; Cortés, J.; Valdivia, C.; Núñez, J.; Tapia, C.; Neira, I.; Sanzana, S.; et al. Use of Phycobiliproteins from Atacama Cyanobacteria as Food Colorants in a Dairy Beverage Prototype. Foods 2020, 9, 244. [Google Scholar] [CrossRef]
- Ruiz-Cruz, S.; González-Vega, R.I.; Robles-Zepeda, R.E.; Reyes-Díaz, A.; López-Elías, J.A.; Álvarez-Ainza, M.L.; Cinco-Moroyoqui, F.J.; Moreno-Corral, R.A.; Wong-Corral, F.J.; Borboa-Flores, J.; et al. Association of Different ABO and Rh Blood Groups with the Erythroprotective Effect of Extracts from Navicula Incerta and Their Anti-Inflammatory and Antiproliferative Properties. Metabolites 2022, 12, 1203. [Google Scholar] [CrossRef]
- González-Vega, R.I.; Cárdenas-López, J.L.; López-Elías, J.A.; Ruiz-Cruz, S.; Reyes-Díaz, A.; Perez-Perez, L.M.; Cin-co-Moroyoqui, F.J.; Robles-Zepeda, R.E.; Borboa-Flores, J.; Del-Toro-Sánchez, C.L. Optimization of Growing Condi-tions for Pigments Production from Microalga Navicula Incerta Using Response Surface Methodology and Its Antioxidant Capacity. Saudi J. Biol. Sci. 2021, 28, 1401–1416. [Google Scholar] [CrossRef]
- Khairinisa, G.; Mahargyani, W.; Agnia, G. Anti-Inflammatory Activity of the Peel Extract of Ambon Bananas (Musa Paradisiaca L.) Examined with the Human Red Blood Cell Membrane Stabilization Method. In Proceedings of the 4th International Seminar on Global Health (ISGH4), Cimahi, Indonesia, 28 October 2021; pp. 216–223. [Google Scholar] [CrossRef]
- Thomas, D.C. The Phagocyte Respiratory Burst: Historical Perspectives and Recent Advances. Immunol. Lett. 2017, 192, 88–96. [Google Scholar] [CrossRef]
- Aidoo, D.B.; Konja, D.; Henneh, I.T.; Ekor, M. Protective Effect of Bergapten against Human Erythrocyte Hemolysis and Protein Denaturation in Vitro. Int. J. Inflamm. 2021, 2021, 1279359. [Google Scholar] [CrossRef]
- Gunathilake, K.; Ranaweera, K.; Rupasinghe, H. In Vitro Anti-Inflammatory Properties of Selected Green Leafy Vegetables. Biomedicines 2018, 6, 107. [Google Scholar] [CrossRef]
- Bukhari, I.A.; Pivac, N.; Alhumayyd, M.S.; Mahesar, A.L.; Gilani, A.H. The Analgesic and Anticonvulsant Effects of Piperine in Mice. J. Physiol. Pharmacol. 2013, 64, 789–794. [Google Scholar] [PubMed]
- Yesmin, S.; Paul, A.; Naz, T.; Rahman, A.B.M.A.; Akhter, S.F.; Wahed, M.I.I.; Emran, T.B.; Siddiqui, S.A. Membrane Stabilization as a Mechanism of the Anti-Inflammatory Activity of Ethanolic Root Extract of Choi (Piper Chaba). Clin. Phytoscience 2020, 6, 59. [Google Scholar] [CrossRef]
- Shafay, S.E.; Sl-Sheekh, M.; Bases, E.; El-Shenody, R. Antioxidant, Antidiabetic, Anti-Inflammatory and Anticancer Potential of Some Seaweed Extracts. Food Sci. Technol. 2021, 42, 20521. [Google Scholar] [CrossRef]
- Bliss, O.; Ejiofor, E.; Njoku, C.; Ejiofor, M.; Michael, K. GC-MS Characterization, In Vitro Antioxidant and Anti-Inflammatory Activities of Essential Oil from the Leaves of Stachytarpheta Jamaicensis. J. Mex. Chem. Soc. 2022, 66, 1822. [Google Scholar] [CrossRef]
- Pradhan, B.; Patra, S.; Behera, C.; Nayak, R.; Jit, B.P.; Ragusa, A.; Jena, M. Preliminary Investigation of the Antioxidant, Anti-Diabetic, and Anti-Inflammatory Activity of Enteromorpha Intestinalis Extracts. Molecules 2021, 26, 1171. [Google Scholar] [CrossRef] [PubMed]


| PBP | T-HCl | PS |
|---|---|---|
| B-PE | 71.00 Aa ± 2.65 | 53.64 Ba ± 2.01 |
| R-PC | 37.56 Ab ± 0.87 | 30.60 Bb ± 1.90 |
| APC | 32.21 Ac ± 1.14 | 30.14 Ab ± 2.87 |
| Pigment | MetOH |
|---|---|
| Ctotal | 7.78 a ± 0.63 |
| Cx+c | 0.49 b ± 0.14 |
| Extract | Protein Concentration |
|---|---|
| PS | 45.65 a ± 0.46 |
| T-HCl | 16.66 b ± 0.75 |
| Extract | ABTS+• | DPPH• | FRAP |
|---|---|---|---|
| PS | 1238.49 Aa ± 20.51 | 344.22 Bc ± 05.82 | 335.57 Bc ± 06.68 |
| T-HCl | 1186.64 Bb ± 18.24 | 1385.65 Aa ± 22.04 | 374.30 Cb ± 27.30 |
| MetOH | 761.80 Bc ± 21.00 | 1318.72 Ab ± 14.52 | 433.10 Ca ± 43.40 |
Disclaimer/Publisher’s Note: The statements, opinions and data contained in all publications are solely those of the individual author(s) and contributor(s) and not of MDPI and/or the editor(s). MDPI and/or the editor(s) disclaim responsibility for any injury to people or property resulting from any ideas, methods, instructions or products referred to in the content. |
© 2023 by the authors. Licensee MDPI, Basel, Switzerland. This article is an open access article distributed under the terms and conditions of the Creative Commons Attribution (CC BY) license (https://creativecommons.org/licenses/by/4.0/).
Share and Cite
Peña-Medina, R.L.; Fimbres-Olivarría, D.; Enríquez-Ocaña, L.F.; Martínez-Córdova, L.R.; Del-Toro-Sánchez, C.L.; López-Elías, J.A.; González-Vega, R.I. Erythroprotective Potential of Phycobiliproteins Extracted from Porphyridium cruentum. Metabolites 2023, 13, 366. https://doi.org/10.3390/metabo13030366
Peña-Medina RL, Fimbres-Olivarría D, Enríquez-Ocaña LF, Martínez-Córdova LR, Del-Toro-Sánchez CL, López-Elías JA, González-Vega RI. Erythroprotective Potential of Phycobiliproteins Extracted from Porphyridium cruentum. Metabolites. 2023; 13(3):366. https://doi.org/10.3390/metabo13030366
Chicago/Turabian StylePeña-Medina, Rubria Lucía, Diana Fimbres-Olivarría, Luis Fernando Enríquez-Ocaña, Luis Rafael Martínez-Córdova, Carmen Lizette Del-Toro-Sánchez, José Antonio López-Elías, and Ricardo Iván González-Vega. 2023. "Erythroprotective Potential of Phycobiliproteins Extracted from Porphyridium cruentum" Metabolites 13, no. 3: 366. https://doi.org/10.3390/metabo13030366
APA StylePeña-Medina, R. L., Fimbres-Olivarría, D., Enríquez-Ocaña, L. F., Martínez-Córdova, L. R., Del-Toro-Sánchez, C. L., López-Elías, J. A., & González-Vega, R. I. (2023). Erythroprotective Potential of Phycobiliproteins Extracted from Porphyridium cruentum. Metabolites, 13(3), 366. https://doi.org/10.3390/metabo13030366