Article

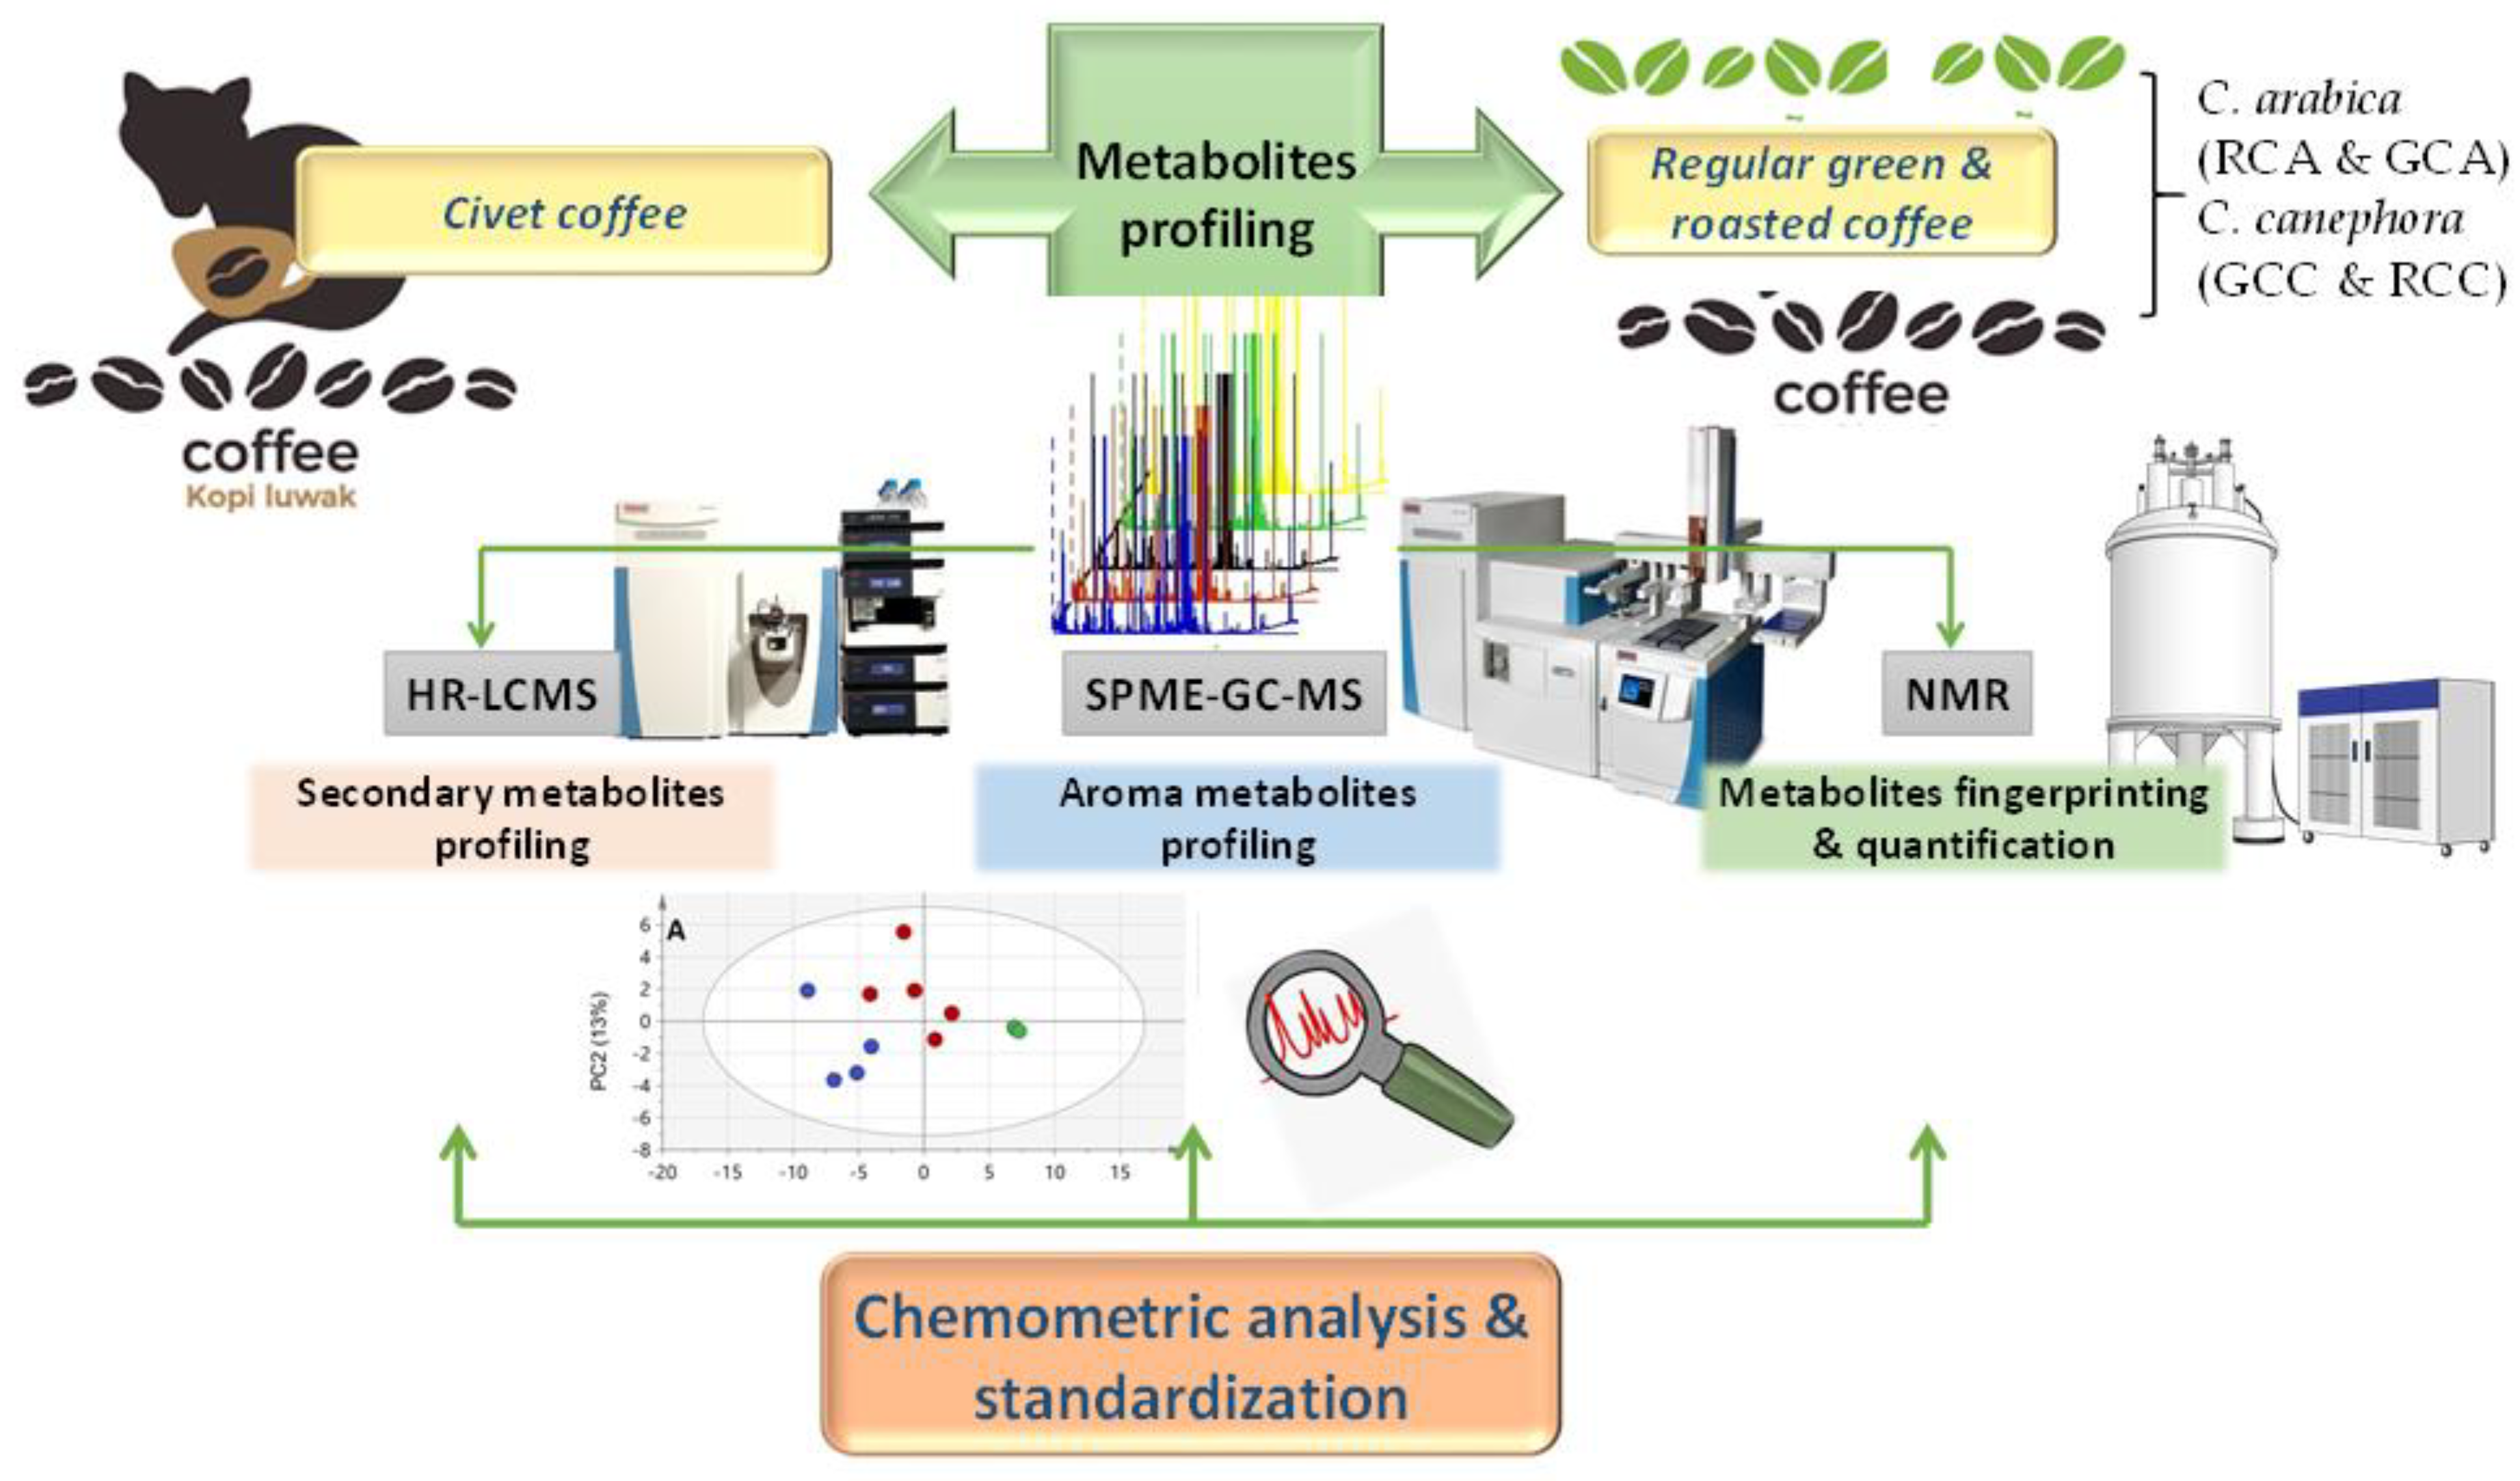
Metabolite Profiling of Premium Civet Luwak Bio-Transformed Coffee Compared with Conventional Coffee Types, as Analyzed Using Chemometric Tools

by
Mohamed A. Farag
1,*,†,
Tarik A. Mohamed
2,†,
Enas A. El-Hawary
3 and
Amr Abdelwareth
4
1
Pharmacognosy Department, College of Pharmacy, Cairo University, Kasr El-Aini St., Cairo 11562, Egypt
2
Chemistry of Medicinal Plants Department, National Research Centre, 33 El-Bohouth St., Giza 12622, Egypt
3
Chemistry Department, School of Sciences & Engineering, The American University in Cairo, New Cairo 11835, Egypt
4
Novartis Pharma, Cairo Site, El-Sawah St., Cairo 11551, Egypt
*
Author to whom correspondence should be addressed.
These authors contributed equally to this work.
Metabolites 2023, 13(2), 173; https://doi.org/10.3390/metabo13020173
Submission received: 31 December 2022 / Revised: 19 January 2023 / Accepted: 20 January 2023 / Published: 24 January 2023

Abstract

:
Luwak (civet) coffee is one of the most precious and exotic coffee commodities in the world. It has garnered an increasing reputation as the rarest and most expensive coffee, with an annual production. Many targeted analytical techniques have been reported for the discrimination of specialty coffee commodities, such as Luwak coffee, from other ordinary coffee. This study presents the first comparative metabolomics approach for Luwak coffee analysis compared to other coffee products, targeting secondary and aroma metabolites using nuclear magnetic resonance (NMR), gas chromatography (GC), or liquid chromatography (LC) coupled with mass spectrometry (MS). Chemometric modeling of these datasets showed significant classification among all samples and aided in identifying potential novel markers for Luwak coffee from other coffee samples. Markers have indicated that C. arabica was the source of Luwak coffee, with several new markers being identified, including kahweol, chlorogenic acid lactones, and elaidic acid. Aroma profiling using solid-phase micro-extraction (SPME) coupled with GC/MS revealed higher levels of guaiacol derivatives, pyrazines, and furans in roasted Luwak coffee compared with roasted C. arabica. Quantification of the major metabolites was attempted using NMR for Luwak coffee to enable future standardization. Lower levels of alkaloids (caffeine 2.85 µg/mg, trigonelline 0.14 µg/mg, and xanthine 0.03 µg/mg) were detected, compared with C. arabica. Other metabolites that were quantified in civet coffee included kahweol and difurfuryl ether at 1.37 and 0.15 µg/mg, respectively.

1. Introduction

Luwak (civet) coffee is one of the most precious exotic coffee commodities traded in the world [1]. It has garnered an increasing reputation as the rarest and most expensive coffee, with an annual production of around 500 pounds and 600 dollars per pound, which is approximately one hundred times that of normal coffee [2]. Such a high price is attributed to its high consumer demand and superior sensory attributes. Luwak coffee is low in caffeine, low in fat, and low in bitterness. A study of different samples of civet coffee from the Gayo Highlands showed that nutty, fishy, chocolaty, herby, toasty, and earthy flavors were the dominant characteristics [3]. Coffea arabica berries are first digested by the Asian palm civet (Paradoxurus hermaphroditus), then the stools are either collected in the wild or harvested from caged animals. This arboreal animal is an excellent tree climber; it uses its strong sense of smell and eyesight to select only the ripest and sweetest coffee cherries [4]. The civet digests the berries’ pericarp and ejects coffee beans that then undergo cleaning, wet fermentation, sun-drying, and, finally, roasting [1]. Throughout the fermentation process, a unique flavor is imparted to the coffee beans that has a chocolaty, earthy, syrupy, and rich taste [4].
Indonesia is the first and main producer of Luwak coffee; it became more popular in 2003 when Oprah Winfrey presented Luwak coffee in her TV show [3]. Luwak coffee can be produced naturally in the wild, or the animals can be kept in cages, which is referred to as captivity. Studies have reported that good breeding methods and gentle treatment for the animals can lead to an increase in the production of premium-quality caged coffee, compared to naturally produced wild coffee [5]. The use of caged-animal breeding was developed to meet the increasing demand for civet coffee due to the scarcity of wild Luwak coffee horns. However, this approach is challenged by the need to maintain animal nutrition availability and healthy caged production, which is necessary for caged civet-produced coffee that approaches the sensory quality of wild civet-produced coffee [3].
Civet coffee beans are characterized by less bright, darker coffee beans compared with non-fermented coffee beans [3]. Studies have focused more on developing an analytical process to authenticate Luwak coffee and detect adulteration by various means, including the sensory evaluation of green coffee beans and instrumental nose and olfactory analysis, culminating with the employment of large-scale metabolomics to identify discriminatory markers [1].
According to many studies, the “better” taste of Luwak coffee has been attributed to the natural fermentation process, which contributes to the production of several flavors that give it a special aroma [5]. Fermentation is performed using the gut microbiota and enzymes in the Luwak gastrointestinal tract. Sugar, protein, and pectin are degraded into simpler forms with the aid of digestive enzymes; studies have, moreover, isolated the microbial strains in the biomass from palm civets, which are responsible for the catabolism of caffeine in the coffee bulb via N-demethylation and xanthine oxidation [6]. Gluconobacter species possessing genes that encode enzymes for the metabolism of sulfur-containing amino acids have been reported in palm civet feces [7]. The degradation of structural polysaccharides eases the penetration of fermented metabolites into coffee beans. The presence of amino acid residues from fermentation contributes to the sensory notes of coffee and contributes to the enriched aroma post-Milliard reaction that occurs during coffee roasting [8]. Studies are now focusing on finding a starter consortium microbiota that mimics the in vivo fermentation occurring in the palm civet gut to manufacture Luwak coffee by artificial bio-fermentation on a commercial scale [3].
Several analytical techniques have been employed for the identification and quantification of major coffee metabolites, such as caffeine and trigonelline. These techniques have ranged from simple planar chromatography [9,10,11] to the use of more advanced techniques that are based on holistic metabolomics data analysis for the discrimination of specialty coffee commodities, including Luwak coffee, from other ordinary coffee-adulterant commodities. These include mass spectrometry (MS) coupled with chromatography, inductively coupled plasma atomic emission spectrometry (ICP-AES), Fourier transform infrared (FTIR) spectroscopy, Raman spectroscopy, nuclear magnetic resonance (NMR), and GC with FID detection [12].
This paper is intended to complement our previous work on the different coffee species and commodities, using multiple analytical techniques for metabolite fingerprinting based on ultraviolet spectroscopy, liquid chromatography-mass spectrometry, silylated GC-MS, SPME/GC-MS, and NMR, all coupled with modeling using chemometric tools (see Figure 1) [13,14].
Recently, metabolomics has made a remarkable contribution to the analysis of food components and quality control. Several hyphenated techniques, such as nuclear magnetic resonance (NMR), gas chromatography (GC), or liquid chromatography (LC) coupled to mass spectrometry (MS), have been employed to analyze food phytochemicals and provide a detailed profile of their composition. Liquid chromatography is a powerful tool for investigating the differences in the chemical profile between closely related taxa and species, due to its excellent resolution and high sensitivity level. Most previous metabolomics studies have targeted the diverse commercial types of coffee and have provided a detailed profile of the different coffee species, i.e., C. arabica, C. canephora, C. liberica, etc. Although the unique coffee analyzed in this paper has attracted many coffee lovers and has increased in demand worldwide, there is little research into the identification of significant phytochemicals and discriminant markers for its authentication, compared to other coffee types. The objective of this study was to employ chemometric tools for the first time to assess the phytochemicals in Luwak coffee, targeting its aroma and secondary metabolites, and standardizing its major components as one of the priciest and rarest coffees available.

2. Materials and Methods

2.1. Coffee Specimens, Chemicals, and Extraction

Commercial Luwak coffee was purchased from Bogor Indonesia as 100% pure, coarsely powdered coffee, ca. 2–4 mm in size, which has been heavily roasted and freeze-dried. It was compared to samples from two coffee-producing species: C. arabica, commonly known as arabica coffee, roasted arabica coffee (RCA), and green arabica coffee (GCA); the other is C. canephora var. robusta (known as green robusta coffee (GCC) or roasted robusta coffee (RCC)), collected from the Mina Gerais University Arboretum, Brazil, as entire seeds that were further powdered in a mortar using liquid nitrogen. Analysis was performed via NMR spectroscopy, ultra-performance liquid chromatography coupled with mass spectroscopy (UPLC-MS), and solid-phase microextraction coupled with the gas chromatography-mass spectrometry method (SPME/GC–MS). Samples subjected to SPME/GC-MS included Luwak coffee, roasted coffee, and roasted coffee blended with cardamom to comparatively evaluate the aroma profile. The NMR fingerprinting of coffee extracts was also conducted.
Freeze-dried coffee seeds were prepared for NMR analysis following the same protocol as used for herbal extracts [15,16,17]; about 150 mg of each coffee powder (n = 3) was homogenized with 6 mL of 100% MeOH containing 10 µg/mL umbelliferone (an internal standard for relative quantification using LC-MS), using an Ultra-Turrax (IKA, Staufen, Germany) at 11,000 rpm for 5 × 60 s, with 1-minute break intervals. The extract was vortexed for 1 min, centrifuged at 3000× g for 30 min, and then filtered. Afterward, 4 mL of the supernatant was aliquoted for NMR analysis and then dried in a stream of nitrogen. The dried extract was re-suspended with 800 μL of 100% methanol-d4, containing HMDS that has been adjusted to a final concentration of 0.94 mM. After centrifugation (13,000× g for 1 min), the supernatant was transferred to a 5-millimeter NMR tube for measurement. For the LC-MS analysis, 1 mL of the sample was aliquoted and placed on a 500 mg Octadecylsilane (C18) cartridge that was preconditioned with methanol. The samples were then eluted using 3 × 0.5 mL methanol; the eluent was then evaporated under a nitrogen stream and the obtained dry residue was resuspended in 1 mL of 100% methanol.

2.2. UPLC-MS Profiling of Secondary Metabolites

UPLC-MS acquisition was performed using ion-trap high-resolution testing under the same conditions as those used for coffee testing by El-Hawary et al. [13].
To profile the metabolites, 150 mg of each coffee powder specimen was homogenized with 5 mL MeOH (100% v/v) containing 10 µg/mL umbelliferone as an internal standard, using an Ultra-Turrax mixer (IKA, Staufen, Germany) adjusted at 11,000 rpm, mixed in five 20-second periods, with intervals of 1 min between each mixing period to guard against temperature increases and heating effects. The resulting suspensions were then vortexed vigorously, centrifuged at 3000× g for 30 min, and filtered through a 22 μm pore-size filter to remove plant debris. Then, 1 mL of the sample was aliquoted and pre-treated by placement on a 500 mg C18 cartridge that was pre-conditioned with MeOH and Milli-Q water before elution; this was performed twice, using 3 mL of MeOH. Afterward, the eluent was evaporated under a nitrogen stream, and the obtained dry residue was re-suspended in 1 mL of MeOH.
The principal step of UPLC-ESI–HRMS analysis was conducted in triplicate (n = 3), with 2 μL introduced to a Dionex 3000 UPLC system (Thermo Fisher Scientific, Bremen, Germany), equipped with an HSS T3 column (100 × 1.0 mm, 1.8 μm; Waters®; column temperature: 40 °C) and a photodiode array detector (PDA, Thermo Fisher Scientific, Bremen). The chromatographic conditions were optimized for improved peak elution, using a binary gradient elution protocol at a flow rate of 150 μL/min. The composition of the mobile phase varied between water/formic acid at 99.9/0.1 (v/v) (A) and acetonitrile/formic acid at 99.9/0.1 (v/v) (B). The protocol consisted of an isocratic step for 1 min with 5% mobile phase B, followed by a linear increase of B from 5% to 100% over 11 min. The mobile phase was kept isocratic for between 11 and 19 min at 100% B. After this, there was a return to 5% B within 1 min, and, finally, an additional 10 min, i.e., 20–30 min overall, for column re-equilibration using 5% B. The wavelength range of the PDA measurements used for detection was 190–600 nm.
The UPLC system was coupled with a high-resolution mass spectrometer, comprising an Orbitrap Elite mass spectrometer (Thermo Fisher Scientific, Bremen, Germany) equipped with a HESI electrospray ion source (spray voltage, positive ion mode 4 kV, negative ion mode 3 kV; source heater temperature, 250 °C; capillary temperature, 300 °C; FTMS resolution, 30,000). Nitrogen was used as both the sheath and auxiliary gas. The CID mass spectra (buffer gas: helium; FTMS resolution: 15,000) were recorded in a data-dependent acquisition mode (DDA) using normalized collision energy (NCE) of 35% and 45% The instrument was externally calibrated with Pierce® LTQ Velos ESI positive ion calibration solution (product number 88323, Thermo Fisher Scientific, Rockford, IL, USA) and Pierce® LTQ Velos ESI negative ion calibration solution (product number 88324, Thermo Fisher Scientific, Rockford, IL, USA).

2.3. Headspace SPME GC-MS Profiling of Aroma Compounds

GC/MS analysis of coffee volatiles was performed exactly as previously described by Farag et. al. [17,18]. Three biological replicates were analyzed for each specimen, using a Shimadzu GC-17A gas chromatograph equipped with a DB-5 column (30 m, 0.25 mm × 0.25 um film thickness; Supelco®, Merck SA, Darmstadt, Germany) coupled to a Shimadzu QP5050A mass spectrometer.

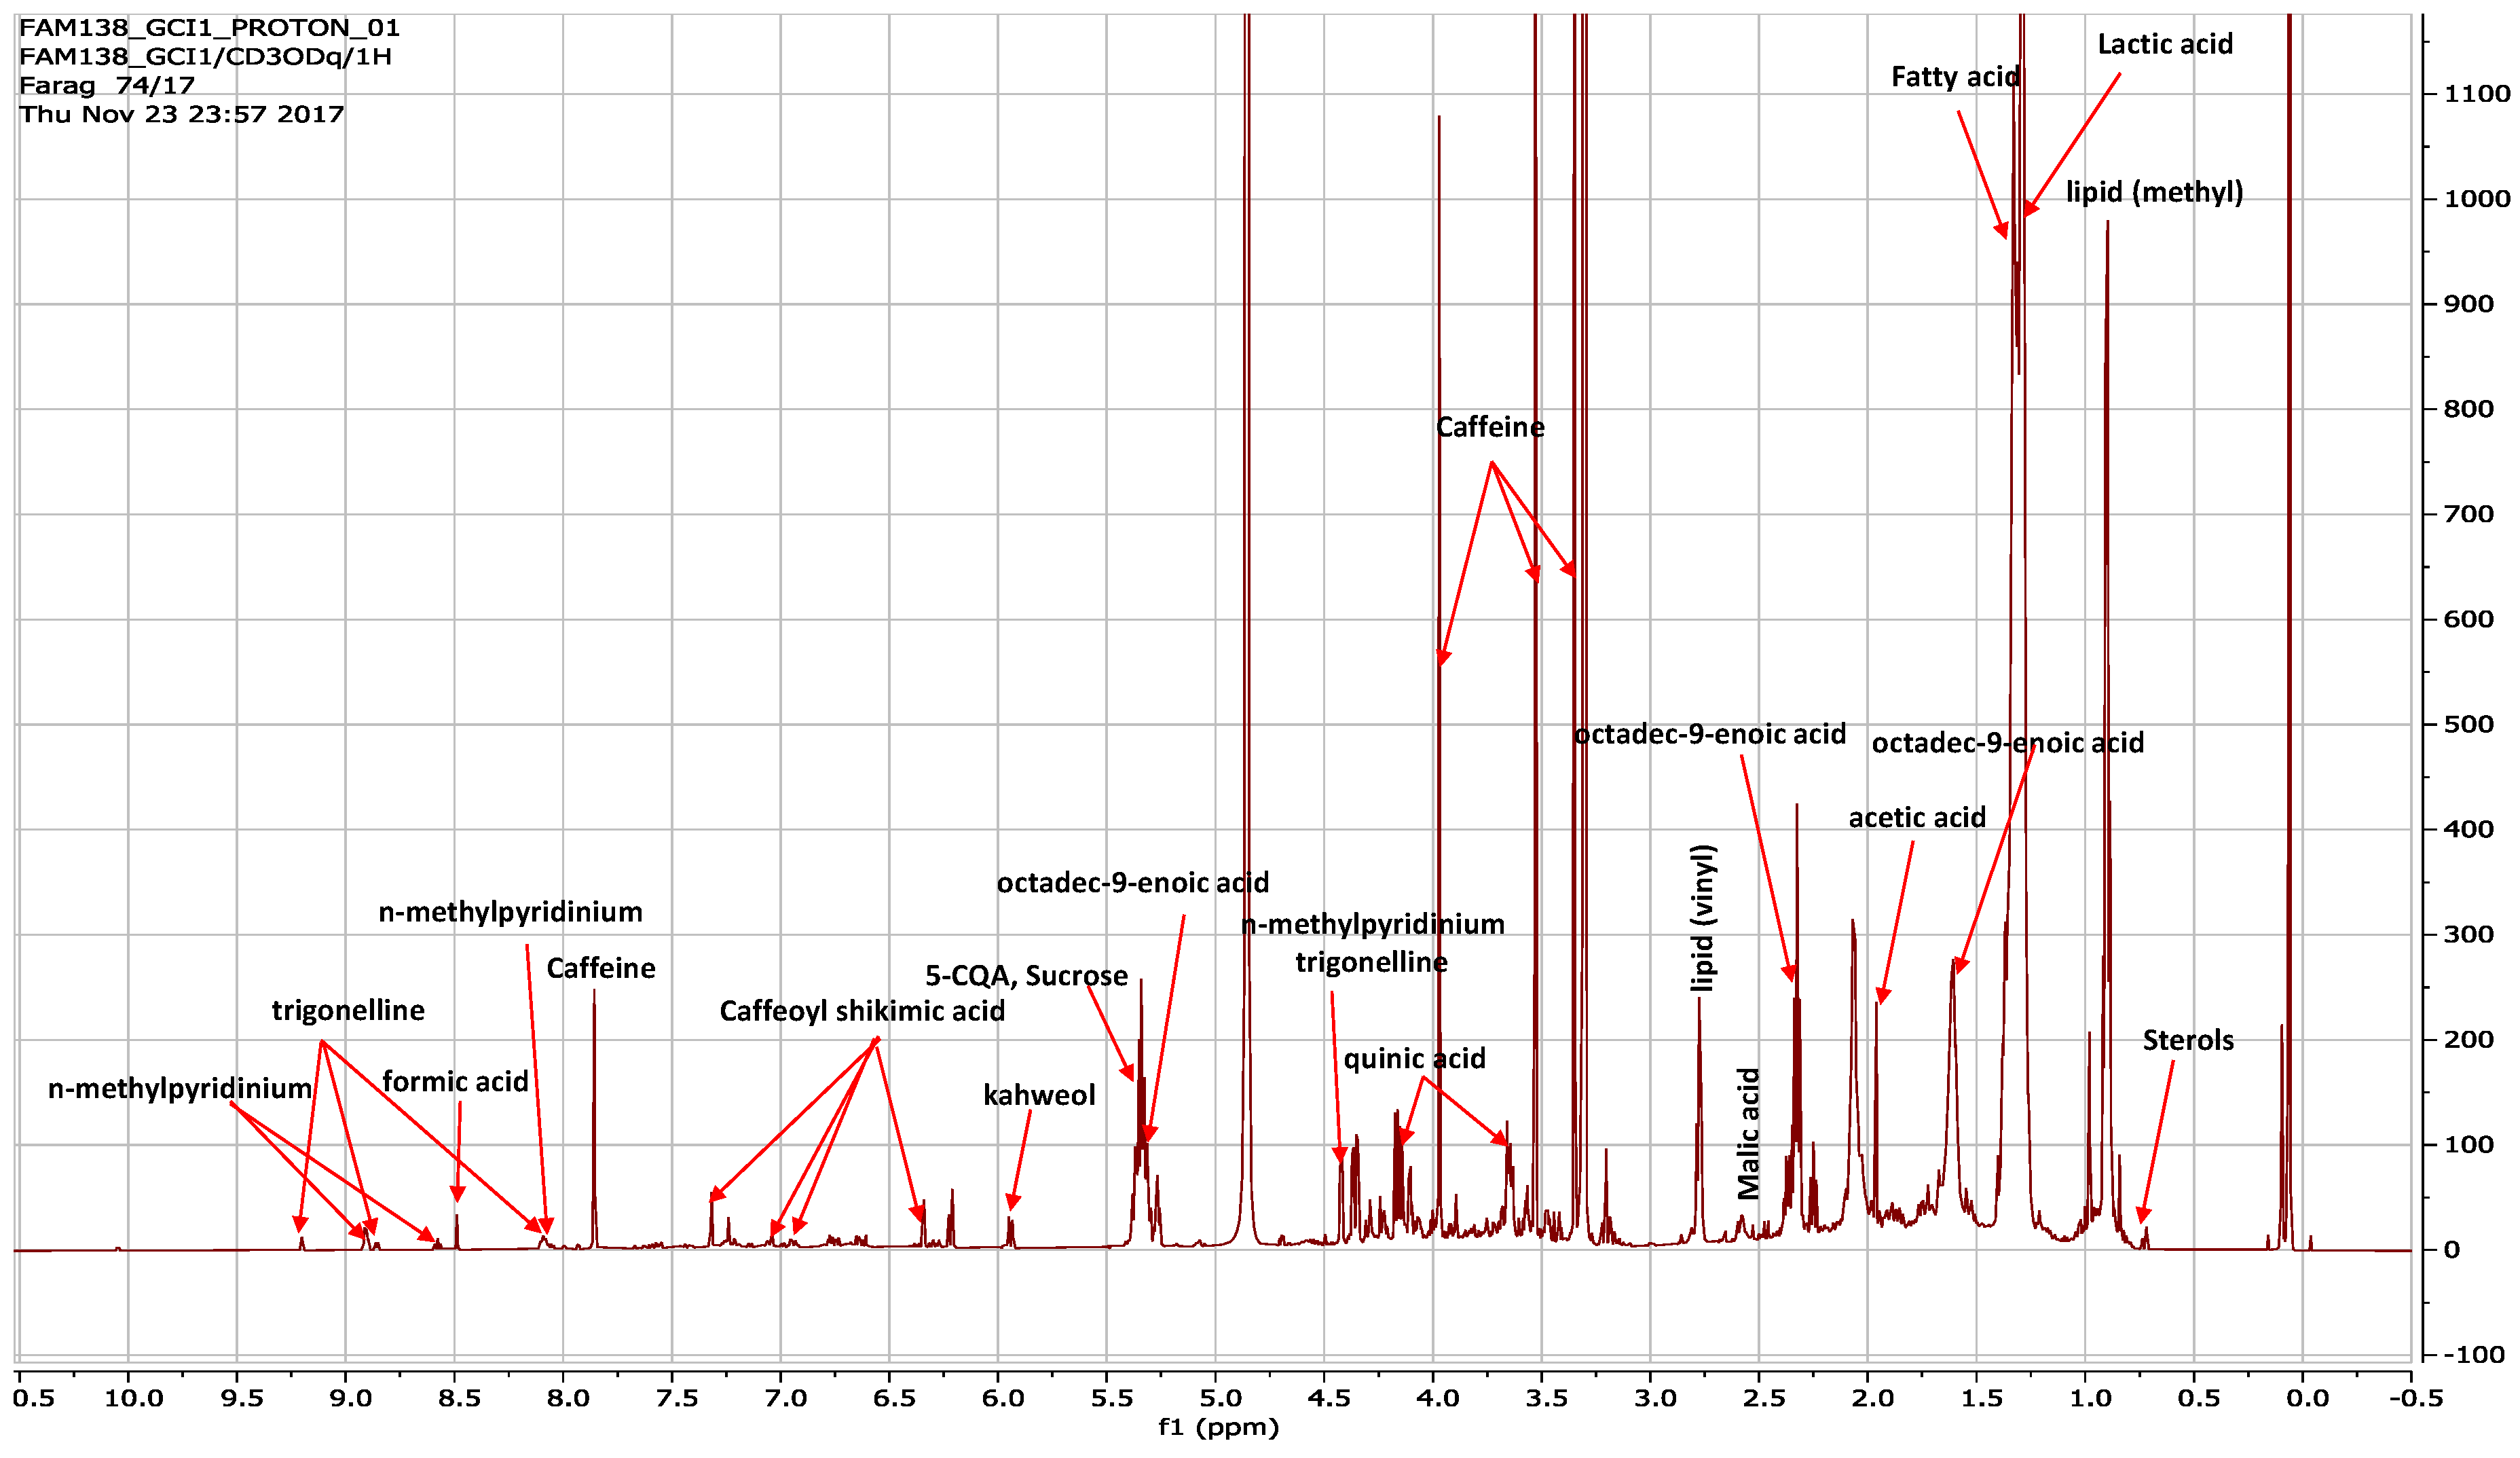
2.4. NMR Fingerprinting of Coffee Extracts

All spectra were recorded using an Agilent VNMRS 600 NMR spectrometer (Varian, Palo Alto, CA, USA) at a proton NMR frequency of 599.83 MHz, using a 5-millimeter inverse detection cryoprobe. The 1H-NMR spectra were recorded at the parameters, including a digital resolution of 0.367 Hz/point, pulse width (pw) of 3 μs (90°), relaxation delay of 23.7 s, and an acquisition time of 2.7 s; the number of transients was 160. Zero filling up to 128 K (l b = 0.4) was used prior to the Fourier transformation.

2.5. Data Processing and Multivariate Analysis

2.5.1. NMR Quantification of Coffee Metabolites and Dataset Modeling

The NMR spectra were processed with Mestrenova software (Mestrelab Research Mnova 14.1.0 Build 24037) to aid in the peak picking (δH, δC, and δH/C) of detected NMR signals, measured in parts per million (ppm) relative to the internal standard hexamethyldisilazane (HMDS). In addition, the 1H-NMR spectra were automatically Fourier-transformed to ESP files using the ACD/NMR Manager Lab version 10.0 software (Toronto, Canada), based on the method used by [15,16].
Further processing was applied for multivariate analysis (MVA), including the spectra binning into buckets of equal width (0.04 ppm) within the region of δH at 11.4–0.4 ppm and the exclusion of signals between δH at 5.0–4.7 ppm and δH at 3.4–3.25 ppm, corresponding to the residual water and methanol signals, respectively. The data were then subjected to principal component analysis (PCA), hierarchical component analysis (HCA), and orthogonal partial least-squares discriminant analysis (OPLS-DA) using the SIMCA-P version 14.1 software package (Umetrics, Umeå, Sweden). All variables were mean-centered and scaled to the Pareto variance. The models were derived from both the full scale of the chemical shift (δH: 1–10 ppm) and the aromatic region (δH: 5.4–10 ppm). Quantification followed the exact formulae and procedures described in earlier works [15,16].

2.5.2. SPME-GC/MS Dataset Volatiles Identification and Modeling

Volatiles were identified by the comparison of peak retention time, the Kovat index (KI), and the spectrum with the reference metabolites in the NIST database (NIST/EPA/NIH mass spectral database (NIST 11). For peak identification, peaks were first deconvoluted using the AMDIS software (www.amdis.net) (accessed on 1 December 2022), prior to spectral matching. The relative content of each metabolite was obtained by the area normalization of all responses related to the identified hits. Average responses per injection replicates were then calculated for each metabolite. Afterward, the data were subjected to multivariate analysis (MVA), as described earlier, with the NMR dataset deriving models from the full scale of both the chemical shift and the aromatic region.

2.5.3. UPLC-ESI–HRMS Dataset Metabolite Identification and Modeling

All metabolites were identified by their accurate mass, retention time, MS fragments, isotopic distribution, and error. The “X-caliber software qual” browser (https://www.thermofisher.com/)(accessed on 1 December 2022) was used for the imported high-resolution files. The analysis was performed in negative mode, and the ion mass spectra that were derived from the anions (M−H) were accompanied by many fragmentation patterns. Relative comparisons of the spectral data were made with the literature references, in-house data, and natural products database of the standard phytochemical dictionary (CRC, Wiley).
The original LC-MS files of all authenticated samples (GCC, GCA, RCA, and RCC) and the Luwak samples were converted into mzML files using the MS Convert GUI (http://proteowizard.sourceforge.net/download.html) (accessed on 1 December 2022) and then converted to .abf files using the ABF converter (https://www.reifycs.com/AbfConverter/) (accessed on 1 December 2022), with the exact parameters described in our previous study [13]. The peak abundance mass list was then exported for multivariate data analysis, wherein the final ID and metabolites were Pareto-scaled using SIMCA (Umetrics, Umea, Sweden). The unsupervised principal component analysis (PCA) models were validated, based on R and Q, in addition to a hierarchal cluster analysis (HCA) of the authenticated and Luwak samples. Supervised OPLS-DA analysis was used in the pre-classified groups to identify the requisite markers, via an S-plot that was validated using the p-value, covariance (p), and correlation (pcor).

3. Results

3.1. H-NMR Assignments and the Quantification of Coffee Metabolites

3.1.1. Identification of Coffee Metabolites

1H-NMR analysis was employed for Luwak coffee characterization and the quantification of its major peaks, to be used for its future standardization (Table 1).
The representative 1D 1H-NMR spectra are depicted in Figure 2. The Luwak coffee sample displayed a signal richness that can mostly be ascribed to primary metabolites found in the aliphatic region from 0 to 5 ppm, and the lower intensity ascribed to secondary metabolites found in the region from 5.5 to 10 ppm. Metabolites that were identified from both ranges included several major coffee metabolites, i.e., caffeine, trigonelline, N-methylpyridinum, kahweol, sucrose, caffeoyl shikimic acid, quinic acid, malic acid, lactic acid, acetic acid, sterols, and fatty acids. Considering that coffee’s health-promoting effects are mostly ascribed to its secondary metabolites, assignments of its key metabolites were attempted based on one- and two-dimensional NMR experiments, such as heteronuclear single-quantum correlation spectroscopy (HSQC), heteronuclear multiple-bond coherence (HMBC), etc.
With regard to the secondary bioactives, the 1H-NMR spectrum was characterized by dense signals in the mid-spectrum region (δH 3.4–4 ppm) belonging to caffeine, which was detected at δH 7.58 (H5), and three methyl signals at δH 3.34, 3.52, and 3.97 for CH3-8, CH3-7, and CH3-6, respectively [19]. Lower-intensity NMR signals were observed for another alkaloid, i.e., trigonelline annotated from singlet signals at δH 4.42 [20], owing to the N-methyl group. The trigonelline structure was confirmed, based on multiple signals at δH 8.0–9.5 ppm, which can be attributed to the aromatic protons. Due to its structural similarity to trigonelline, N-methylpyridinium showed overlap signals at δH 4.4 ppm and 8–9 ppm, owing to the N-methyl group and aromatic protons, respectively [21]. N-methylpyridinium (NMP) is a thermal degradation product of trigonelline and is hypothesized to exert several health benefits in humans [22]; it is likely to be generated during the roasting process of Luwak coffee. Dark-roasted coffee that is rich in NMP was shown to reduce body weight [23] and has yet to be examined in the case of Luwak coffee.
Kahweol is a diterpene that is reported as a marker of C. arabica, identified based on its two key doublet signals at δH 5.9 ppm (due to H-2), δH 6.2 ppm (due to H-1 and H-18), and δH 7.2 ppm (due to H-1 and H-19) [19]. The characterization of its signals verified that C. arabica was the origin material of Luwak coffee production in this product; an analysis of other Luwak coffee samples from other origins can further confirm such a hypothesis.
With regard to primary metabolites that contribute more to coffee’s sensory and nutritive attributes, malic acid was identified as the major organic acid to be characterized, based on a multiplet at δH 2.8 ppm, while the high-field region up to δH 2.0 ppm showed lactic acid and acetic acid signals [24]. Furthermore, signals characteristic of free sugars that might account for the taste of the coffee could be readily assigned in the 1H-NMR spectrum, including the anomeric proton of sucrose at δH 5.39 (d, J = 5.0 Hz) [17].
Organic acids, such as quinic acid, were identified at δH 3.57 (dd, J = 9.5, 3.2 Hz) and 4.14 (dd, J = 10.8, 6.4) ppm [25] as the major acids that contribute to the production of coffee key phenolics i.e., chlorogenic acid, the major antioxidant in coffee. Other phenolic acid derivatives were identified downstream of quinic acid, due to the acetylation of an acid moiety, including caffeoyl quinic acid (chlorogenic acid), which appeared at δH 5.32, owing to the presence of 5-CQA H10 [26], as identified in Figure 2. Caffeoyl shikimic acid signals were detected at δH 6.34 and 7.23 ppm, which correspond to H-4 and H-6, respectively [27].
Generally, the δH 0–3 ppm region showed considerably higher-intensity signals that are typical for organic/fatty acids and sterols [19]. Few of the signals characteristic of fatty acids could be readily assigned in the 1H-NMR spectrum, such as at δH 1.28 and 1.32 ppm, for the repeated methylene groups of fatty acids [19].
To overcome the signal overlap observed in the 1D-NMR spectra, a set of 2D-NMR spectroscopic experiments were employed for the assignment of coffee metabolites. The unsaturation in some fatty acid chains, as in the case of octadec-9-enoic acid (elaidic acid) was confirmed by the presence of a triplet at δH/C (1H, 5.35/129, t, J = 5.0 Hz), showing the HSQC cross-peak correlation to the aliphatic methylene (C-8, C-11) at δC 27.5 ppm. The annotation of free fatty acid was based on its carbonyl at δC 176 and the adjacent α-methylene at δH/C 2.38/35.0 and was consistent with that reported in [28] (see Figure S1C,D in the Supplementary Materials).
Elaidic acid is the trans-unsaturated fatty acid isomer of oleic acid. It has been regarded as detrimental to the sensory quality of coffee [29] and is generated during the thermal processing of coffee beans, leading to the transformation of fatty acids from a cis configuration to a trans configuration. Generally, elaidic acid is detected at low levels in coffee beans; being detected in Luwak coffee by the NMR indicates the effect of the roasting post-fermentation step. Although linoleic acid has been characterized via NMR in several studies, this is the first report to characterize elaidic acid in Luwak coffee beans.

3.1.2. NMR Metabolites Quantification

Quantification was further employed for the key major coffee chemicals, based on 1H-NMR, including alkaloids and nitrogenous compounds (i.e., caffeine, trigonelline, N-methylpyridinium, and xanthine), diterpene (i.e., kahweol), and phenolics (i.e., caffeoyl shikimic acid, octadec-9-enoic (elaidic) acid, and difurfuryl ether).
Caffeine comprised the main alkaloid detected at 2.85 µg/mg (compared to 12.2 µg/mg and 11.1 µg/mg in GCA and RCA respectively), whereas trigonelline was detected at much lower levels of 0.14 µg/mg (compared to 10.6 µg/mg and 7.2 µg/mg in GCA and RCA, respectively), which is likely attributable to the roasting of Luwak coffee seeds during the preparation of samples, it being thermolabile [19]. Xanthine, a caffeine derivative, was quantified at low levels of 0.03 µg/mg; whether this is derived from microbiota-mediated fermentation inside the animal gut is yet to be determined.
Difurfuryl ether is a furan that contributes a coffee-like, nutty, earthy, mushroom odor [30]; it was previously reported, using SPME/GC-MS, in roasted coffee [14]. Quantification was based on δH 7.57, yielding concentrations of 0.156 µg/mg.
The diterpene, kahweol, which is a marker of C. arabica species, was detected at 1.378 µg/mg. This was much less than that in authentic roasted C. arabica RCA (8.8 µg/mg) and its green counterpart, GCA (9.7 µg/mg). Kahweol was not detected in either roasted or green robusta coffee samples [19].
Marked levels of the fatty acid, octadec-9-enoic (elaidic) acid, were quantified at 18.53 µg/mg. It was previously characterized in green C. arabica samples [19], and, likewise, in the coffee pigments of C. arabica, confirming its origin in the Luwak coffee samples [31], alongside kahweol diterpene.

3.2. Metabolite Profiling via UPLC-ESI–HRMS

Kopi Luwak extract was subjected to UPLC-MS analysis, allowing the annotation of 24 metabolites, as listed in Table 2. The order of eluted metabolites followed that in our previous paper [13] on authenticated green and roasted coffees, including organic acids, phenolic acids (i.e., hydroxycinnamates, feruloyl, and coumaroyl derivatives), amino acids, and fatty acids. A list of identified compounds, along with their spectroscopic data, is shown in Table 2. The fragmentation patterns of the identified metabolites have been presented in previous reports [13,32,33,34].

3.3. SPME/GC-MS Analysis of Luwak Coffee Aroma

A powdered sample of civet coffee was subjected to head-space extraction, coupled with GC-MS for aroma profiling. The obtained chromatograms were evaluated in comparison with chromatograms obtained from previous samples of authentic roasted C. arabica (RCA) and C. arabica with cardamom as a major blended coffee type, analyzed using the same method [14]. The reason for choosing RCA for comparison is the common origin and similar processing of samples. This is because civet coffee is obtained from Luwak animal-feed coffee arabica cherries, as revealed by NMR and LCMS modeling using PCA and HCA, showing the close grouping between civet coffee samples and roasted C. arabica samples. Commercial coffee with cardamom was added, owing to the distinct pattern of volatile metabolites associated with cardamom supplementation, as outlined in our previous report [14], and to compare whether civet coffee has an improved aroma profile.
As listed in Table 3, 75 peaks belonging to 13 chemical groups were verified. The identified volatiles included alcohols (6), aldehydes (2), aliphatic hydrocarbons (4), aromatic hydrocarbons (2), esters (7), ether/oxide (5), furan/pyran (14), ketone (3), monoterpene hydrocarbon (6), phenolics (3), pyrazines (12), and sesquiterpene hydrocarbons (10).
The Luwak coffee’s SPME/GC-MS chromatogram showed a comparable aroma profile to that of RCA and C. arabica with cardamom in terms of furans, pyrazines, phenolics, aliphatic and aromatic hydrocarbons, certain alcohols (i.e., furfuryl alcohol and maltol), certain aldehydes (2-methoxy-4-methylbenzaldehyde). Other volatiles, including ethylene diacetate and butyryl lactone, have been detected only in the Luwak samples.
On the other hand, the Luwak samples showed no detection of terpene hydrocarbons, most of the esters (i.e., linalyl acetate, methyl geranate, myrcenyl acetate, terpinyl acetate, and decyl acetate) that are abundant in roasted coffee with cardamom, owing to the cardamom content. Regarding the relative abundance of volatiles in Luwak coffee samples, furans and pyrans were the major class (40.1%), followed by alcohols (14.68%), pyrazines (13.33%), and phenolics (12.89%). Other classes that were present at much lower levels included aromatic hydrocarbons (4.82%), esters (1.04%), and ether/oxide (1.08%). For classes with a relative abundance in the Luwak aroma, please refer to Figure S2 in the Supplementary Materials. Major aroma compounds included furfuryl alcohol (12.1%), 4-ethylguiacol (9.59%), difurfuryl ether (8.96%), furfuryl acetate (6.47%), and methylpyrazine (6.05%).
As identified in Table 3, the pyrazines showed a high abundance in Luwak coffee, compared with roasted C. arabica, which was most likely generated during the thermal processing (Milliard reaction) of coffee. The higher amount detected in Luwak coffee, compared to other roasted C. arabica samples, is in accordance with a previous report indicating the impact of solid fermentation on the amino acid and sugar precursors of pyrazines such as phenylalanine, aspartic acid, and glutamic acid. Substantial levels of 2-methylpyrazine were detected, which indicated high levels of both glutamic acid and aspartic acid amino acid precursors in the Luwak coffee, prior to roasting [35].
In a similar way, a higher abundance of phenolics, such as 4-ethylguiacol (9.59%), 4-vinyl guaiacol (1.78%), and guaiacol (1.52%), which were only detected in Luwak coffee, indicated the impact of fermentation in the civet’s gut on the phenolic precursors of hydroxycinnamic acid, whereas the higher abundance of 4-ethylguiacol, compared with 4-vinylguiacol, indicated the thermal processing during dark roasting [35].

4. Discussion

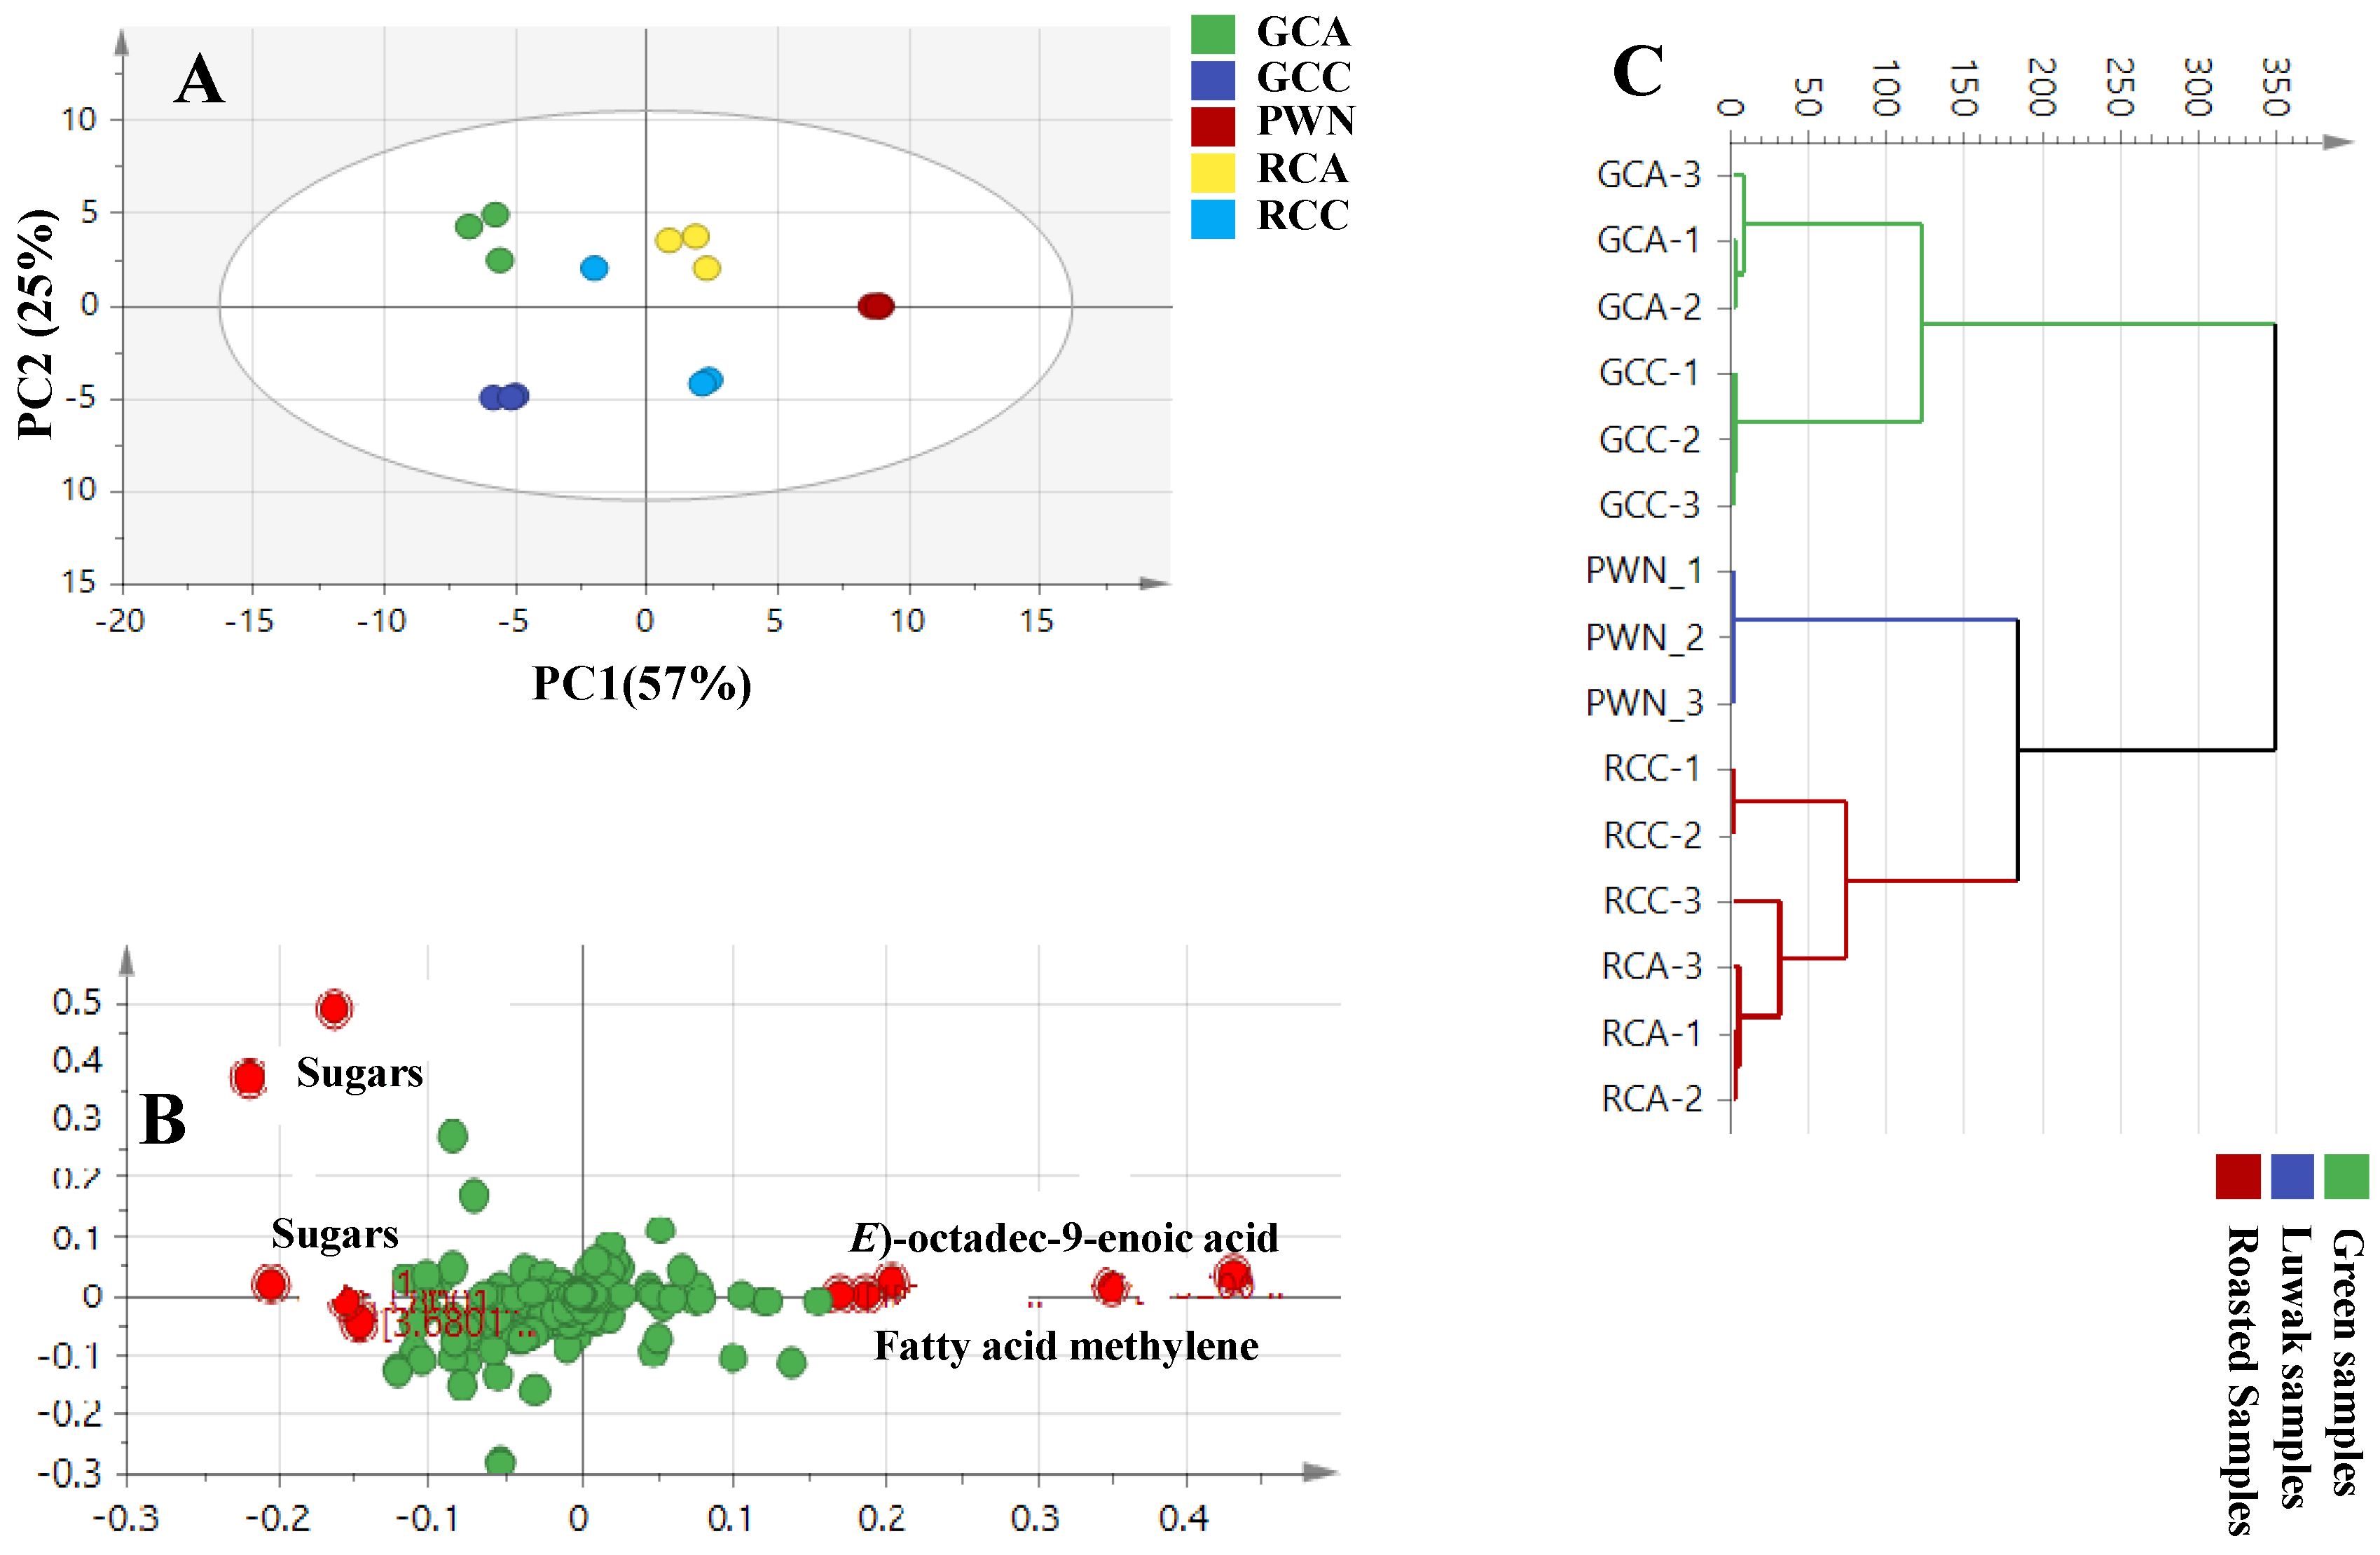
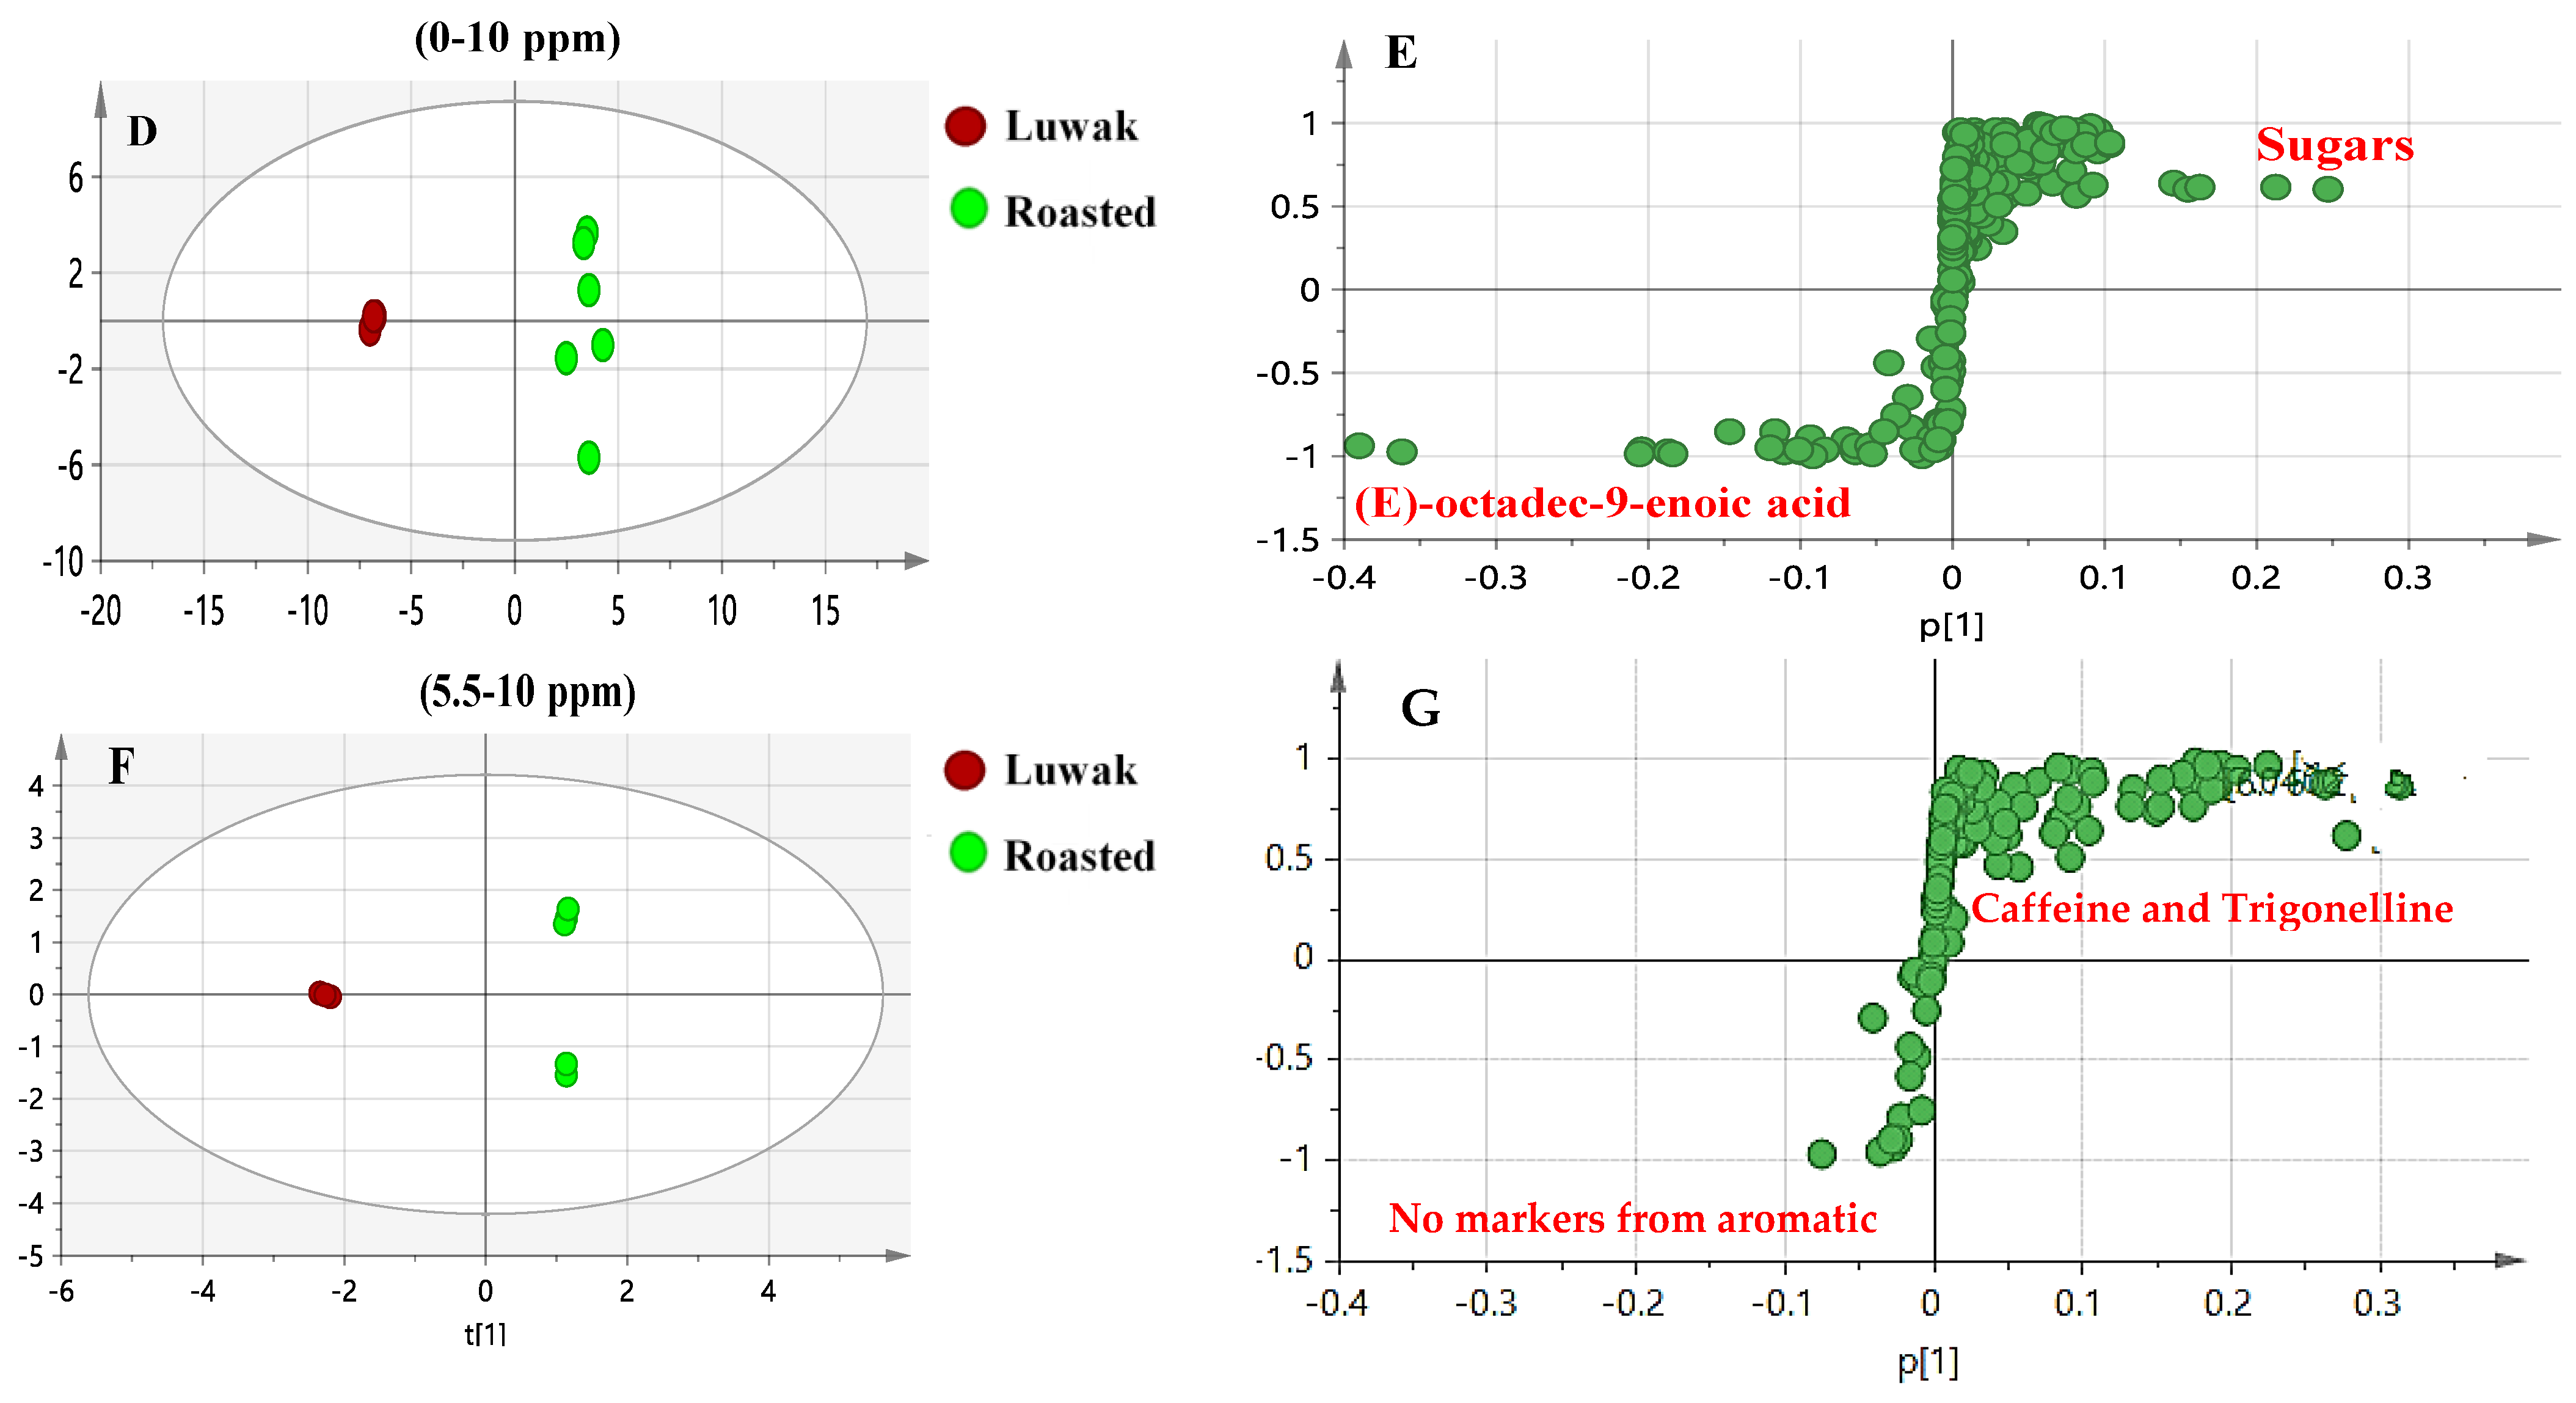
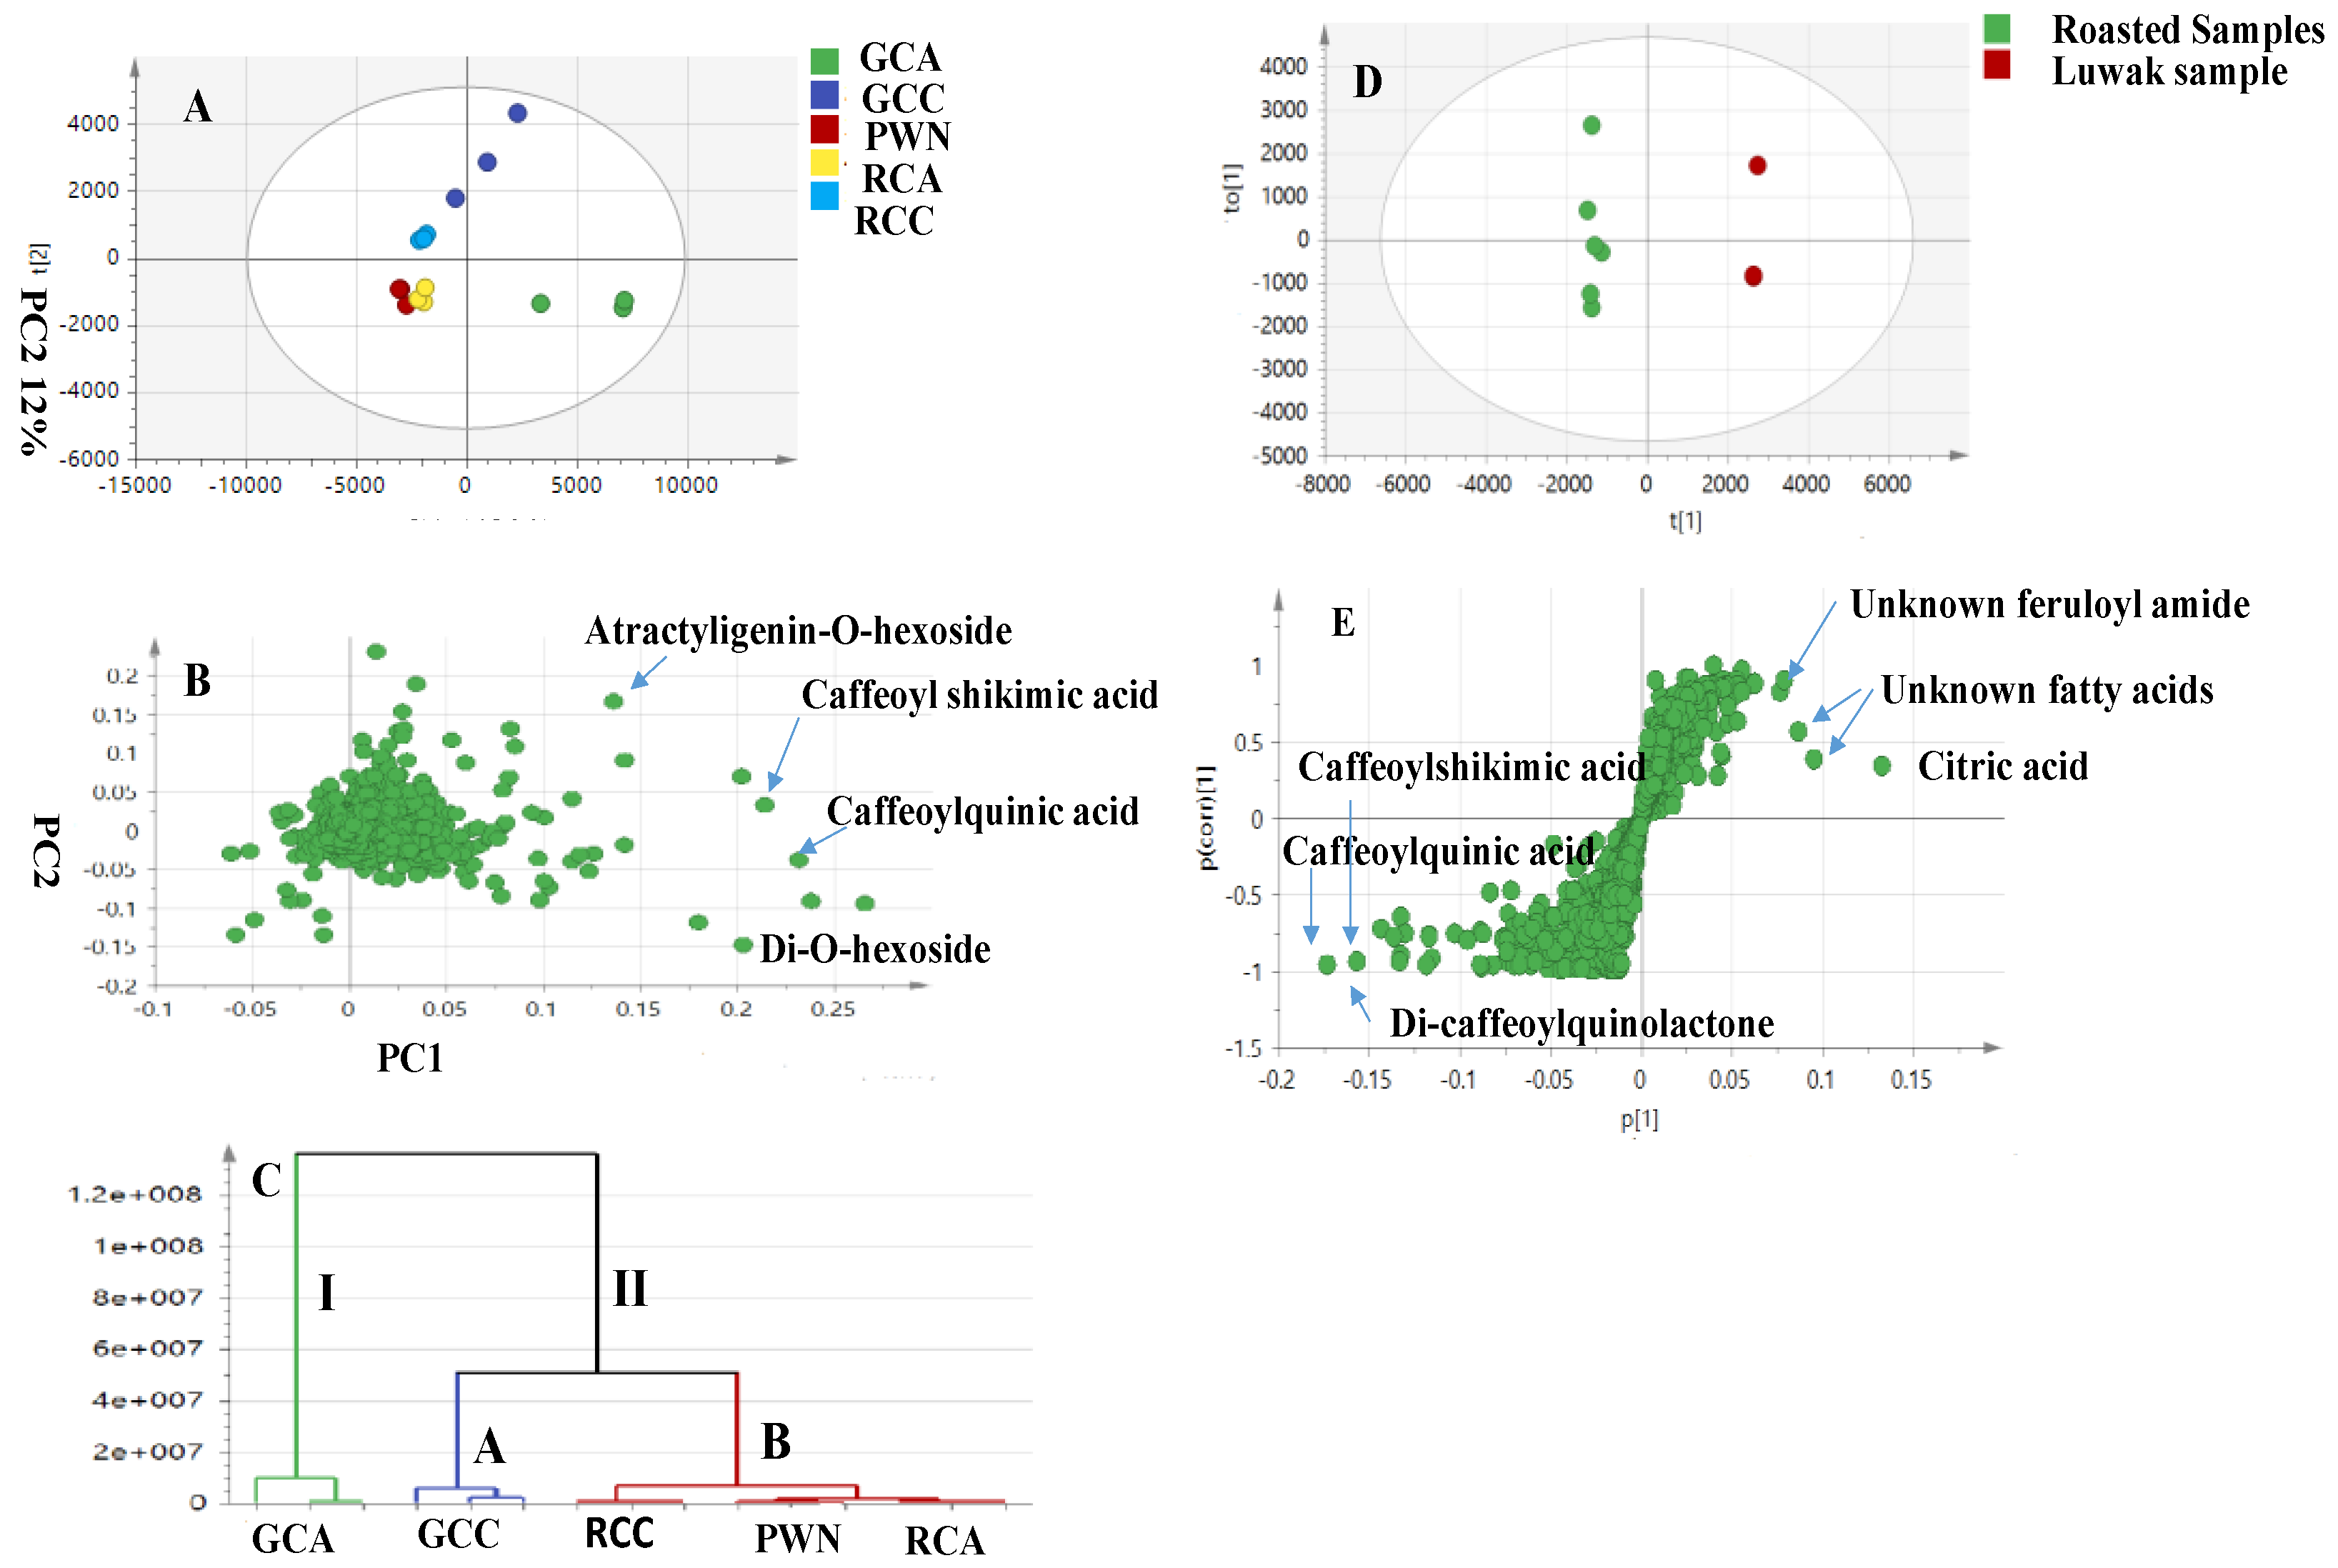
4.1. H-NMR Multivariate Data Analysis of Luwak Coffee and Authenticated Green and Roasted Coffees

Similar NMR spectra were observed by a visual examination of the 1H-NMR spectra of Luwak coffee and then compared with authenticated green (GCA, GCC) and roasted coffee (RCA and RCC) samples [19], revealing to which type Luwak coffee is close in an untargeted manner using chemometric tools. A report on the exact chemical characterization of the NMR data of these coffee samples has previously been reported by our group [19].
The NMR-derived dataset was based on samples of authenticated green, roasted, and Luwak coffee, using both unsupervised and supervised analysis, as seen in Figure 3. The principal component analysis (PCA) plot showed the principal component, PC1, representing 57% and 25% of the PC2 of the total variance, with acceptable values for the goodness-of-fit and goodness-of-prediction (R2 = 0.57 and Q2 = 0.39), suggesting an acceptable model, as shown in Figure 3A. The corresponding loading plot revealed the enrichment of sugars in green coffee, while roasted and Luwak coffees were more abundant in fatty acids (see Figure 3B). HCA showed a similar segregation pattern (Figure 3C), in which samples were segregated into two main clusters. The first cluster included all green samples of both species; the Luwak coffee, along with all the roasted samples of both species (RCA and RCC), showed that the fatty acids were present in the second cluster, suggesting that the roasting process was more influential than the genotype among the full scans and aromatic models.
To confirm the results revealed from the unsupervised PCA, another supervised OPLS-DA analysis of the full NMR (Figure 3D,E), and aromatic spectral regions (Figure 3F,G) was attempted, with good model parameters: R2 = 0.93, Q2 = 0.91, R2 = 0.83, Q2 = 0.80, and a p-value of less than 0.05 for the full coffee region at δH: 0–10 ppm and 5.5–10 ppm, respectively. The full scan model (δH: 0–10 ppm) provided better classification than the aromatic region (δH: 5.5–10 ppm), based on these validation parameters. The OPLS S-loading plot (δH: 0–10 ppm) confirmed the PCA results for the high abundance of fatty acids in Luwak coffee versus the enrichment of roasted coffee in sugars as the most discriminatory 1H-NMR signals (see Figure 3E). Lastly, an OPLS of the aromatic region’s 1H-NMR signals (δH: 5.5–10 ppm) dataset showed a higher abundance of caffeine and trigonelline in the roasted samples of both species, whereas, interestingly, no markers were detected for Luwak (see Figure 3G).

4.2. UPLC–HRMS Multivariate Data Analysis of the Luwak Coffee and Authenticated Coffee Samples

The UPLC–HRMS dataset was classified using multivariate data analysis, including the previously characterized coffee samples (authenticated green and roasted coffee) and Luwak coffee, all analyzed using the same method [13]. Both unsupervised analyses, i.e., PCA and HCA, and supervised analyses, i.e., OPLS-DA, were constructed for specimen classification and for the identification of distinct markers for Luwak coffee (Figure 4).
Firstly, the PCA model, taken as an unsupervised model, was applied for five samples, including Luwak (PWN) and the authenticated green and roasted samples denoting different symbols, i.e., green canephora coffee (GCC), green C. arabica (GCA), roasted C. arabica (RCA), and roasted canephora coffee (RCC). The PCA score plot (Figure 4A) explained 48% of the total variance in PC1, whereas the second principal component, PC2, explained 12% of the variance, with acceptable values for the goodness-of-fit and goodness-of-prediction values (R2 = 0.48 and Q2 = 0.39), indicating a good model. The HCA model offers another unsupervised analysis method, with a visual graphical display (Figure 4C) showing two main clusters (I and II). Cluster I encompassed only the green arabica sample (GCA), while the rest of the samples were embedded in cluster II. As the two subclasses, the green canephora specimen was present, alone, in one subclass (A), whereas the roasted authentic samples, along with the Luwak, were grouped in cluster B, revealing the similarity between roasted and Luwak coffees, as revealed by the PCA analysis. Both the PCA score plots and HCA showed the segregation of Luwak coffee toward the roasted samples, with a closer aggregation with the roasted arabica samples (RCA), which is in agreement with the NMR results (Figure 4A). Further examination of the PCA loading plot (Figure 4B) indicated that the phenolic acids and diterpenes were more abundant in the roasted samples than in the Luwak samples. In another attempt to investigate more markers, a supervised OPLS-DA model was established to compare the roasted samples against the Luwak coffee. The supervised model showed the parameters R2 and Q2 at 0.98 and 0.84, respectively, supporting good model fitness and predictability, and explaining its significant markers with a p-value of less than 0.05 (Figure 4D). The OPLS-DA-derived S-plot (Figure 4E) showed other distinctive markers for Luwak, such as the citric acid (L4) and fatty acid series, viz., L20, L22, L23, and L24. On the other hand, hydroxycinnamic acids (caffeoyl, feruloyl, coumaroyl, and dicaffeoyl quinic acids) were more abundant in the roasted C. arabica samples. The chlorogenic acid lactones were distinguished as markers for the roasted C. arabica samples. These results are aligned with our previously published work on authentic coffee samples [13].
In comparison to the NMR results, both techniques showed good segregation of all samples, suggesting the related composition of both roasted and Luwak coffees, compared to green coffee. However, more markers were detected using the LCMS technique, such as chlorogenic acids and citric acid, which were not revealed using NMR.

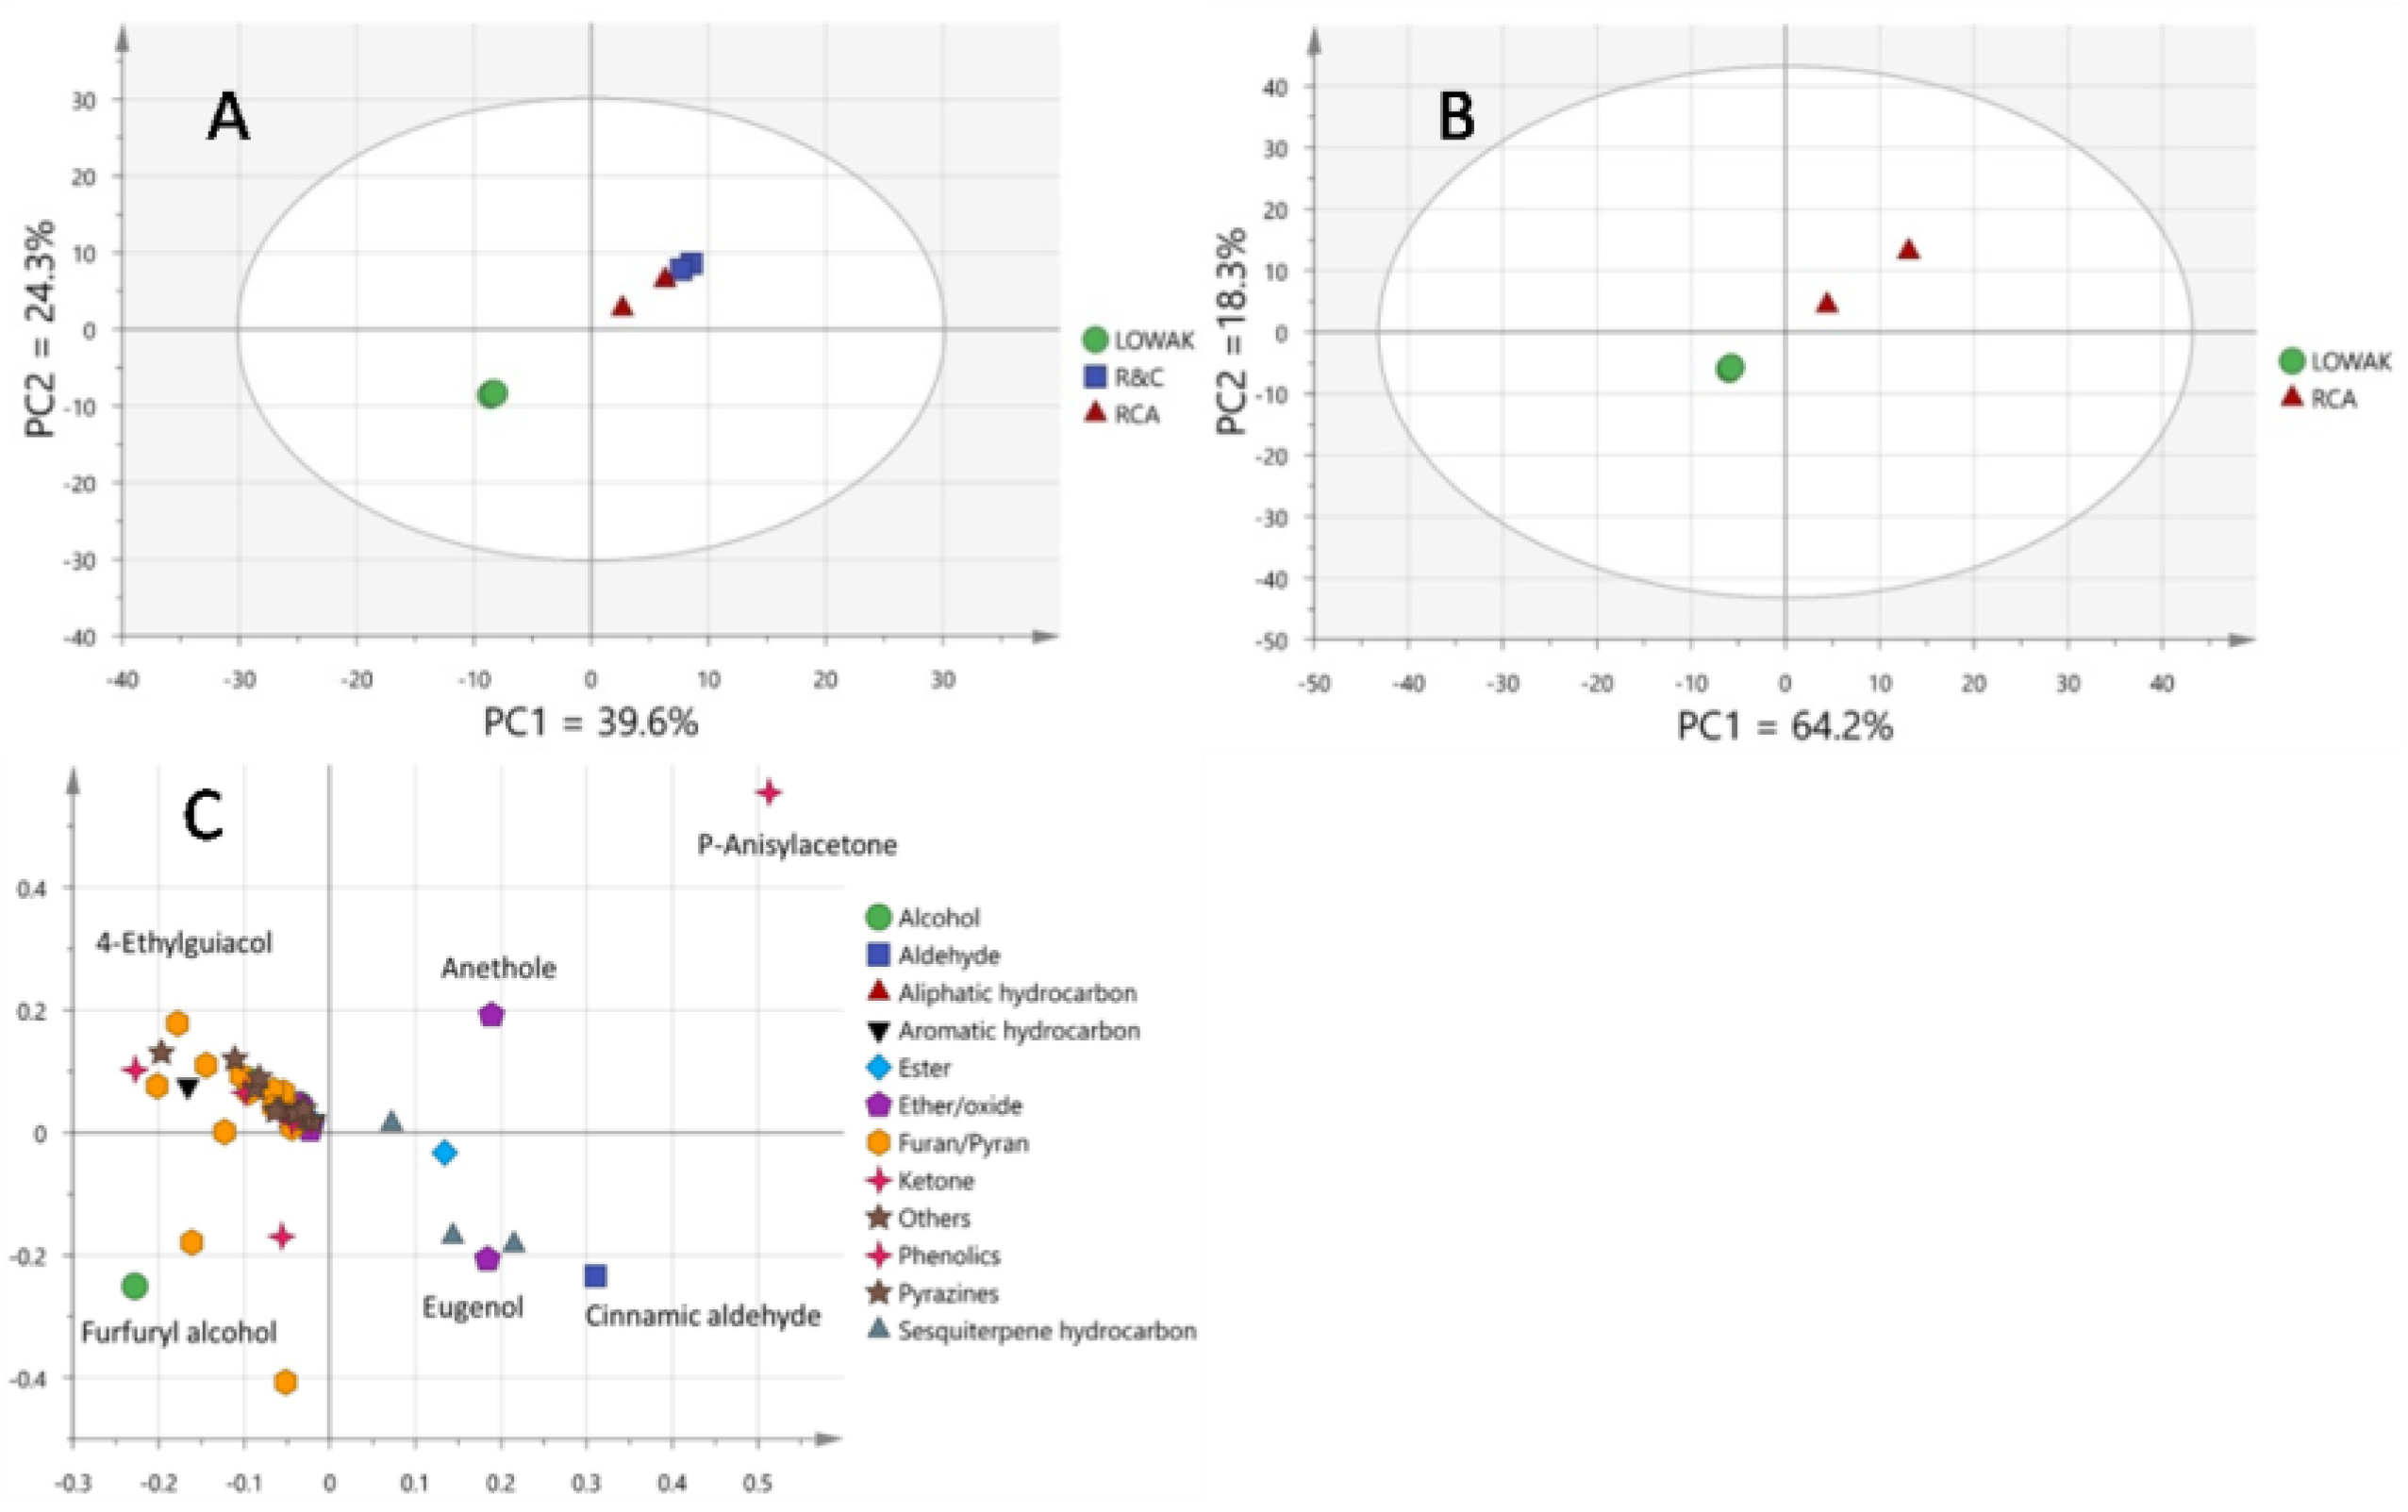
4.3. SPME-GC/MS Multivariate Data Analysis of Luwak Coffee, Roasted Coffee, and Roasted Coffee with Cardamom

Multivariate data analysis (MVA) visualized the further differences in the aroma profile of Luwak coffee, compared with those of the RCA and roasted coffee with cardamom. The score plot of the PCA that was derived from all the coffee samples showed two components that accounted for 39.6% and 24.3% of the total variance. The PCA score plot revealed the distinct separation of civet coffee from other roasted coffees (Figure 5A). Civet coffee was found to be clearly separated from the roasted C. arabica along the PC1-axis. The PCA model showed high quality in terms of the goodness-of-fit (R2X% 0.639). Repeating the model using a subset of RCA versus Luwak coffee showed a higher goodness-of-fit (R2X% 0.825), as indicated in Figure 5B. The loading plot of Luwak coffee versus RCA (Figure 5C) showed a higher 4-ethylguiacol level as a potential marker of Luwak coffee, establishing the aroma profiling.
OPLS-DA modeling was further employed to indicate the role of animal fermentation on the aroma profile of roasted coffee. The OPLS-DA score plot of the total data set of Luwak coffee versus that of RCA revealed segregation between the samples on the basis of animal fermentation (see Figure S3A in the Supplementary Materials). Civet coffee and the roasted coffee samples were clearly separated in the predictive component (t [1]). The OPLS-DA model was built with an R2Y value of 0.995 and a Q2 value of 0.946. The correlation coefficient (R2Y) is used to describe how a model fits a set of predicted data sets related to class separation. The high Q2 value in the model precludes overfitting. A Q2 value of 0.5 is considered to be acceptable for a model derived from biological samples [12].
Permutation tests were performed in the PLS-DA model to confirm the quality of the OPLS-DA model. According to Setoyama et al., if the OPLS-DA model were over-fitted, the R2Y and Q2 values would not virtually change after permutation [36]. Both parameters were in the range of the requirements for a reliable model; R2Y-intercept values fluctuated between 0.0 and 0.795, and the Q2-intercept was below 0.05. These values denoted that there was a change in the values of the two parameters (see Figure S3B in the Supplementary Materials).
The OPLS plot showed that the terpenes and esters showed higher abundance, with conventionally roasted coffee showing the most influencing volatiles on the right corner, which belong to terpinyl acetate, p-anisylacetone, cinnamic aldehyde, and acetone. In contrast, the S-plot showed that the civet coffee is rich in phenolics alongside furans, with most of the influencing volatiles being 4-ethylguaiacol, furfuryl alcohol, and difurfuryl ether (see Figure S3C in the Supplementary Materials).
This study is the first report on the civet coffee metabolome in comparison with conventional coffee but managed to identify several civet coffee markers. Compared with recent publications, most of the studies focused on analytical techniques by which to determine coffee authenticity for the common types and minimize adulteration [37]. Several markers were reported for the authenticity evaluation of Luwak coffee, such as caffeine, inositol, and pyroglutamic acid, by using GC-MS [38] obtained from the robusta Luwak coffee, while citric acid, malic acid, and glycolic acid were reported to be characteristic of arabica Luwak coffee [39]. Citric acid and malic acid, as compound markers of Luwak coffee [2], appeared in alignment with those in the NMR spectra evaluation in this study. Likewise, our results revealed a higher abundance of furans, pyridine, and pyrazine derivatives in the Luwak coffee post-roasting tests, compared with unfermented roasted coffee and in accordance with the previous report [40]. Moreover, although elaidic acid was previously reported in arabica coffee pulp and husk [41], our research is the first to report it in Luwak coffee. With regard to the study limitations, the current research examined civet coffee from one commercial source that has yet to be distinguished from other specimens. Further comparisons between the same coffee used in Luwak coffee prior to the fermentation step should aid in dissecting the impact of this step on the Luwak coffee metabolome as the analyzed coffee proved to have been subjected to both fermentation and roasting processes, as is evident from the presence of furan compounds. The administration of different coffee types to the civet animal and the monitoring of changes in metabolome using the same approach as that described herein should aid in identifying the best sources for producing this premium type of coffee.
Future biological studies are recommended for revealing civet coffee’s effects, especially in terms of targeting CNS compared to other coffee types. They will aid in correlating the metabolome composition to achieve certain targeted effects.

5. Conclusions

Three different technology platforms were employed for Luwak coffee classification, including NMR, LC-MS, and SPME/GC-MS, to show the significant classifications among all samples and aid in identifying potential novel markers to distinguish Luwak coffee from other coffee samples. The markers indicated that C. arabica was the source of Luwak coffee. The roasting process that was applied to Luwak coffee and roasted C. arabica preparation had a pivotal role in their comparable metabolite profile similarity and their distance from the green coffee samples, as revealed from the NMR and LC-MS models. The Luwak coffee metabolite markers revealed by the NMR included elaidic acid, kahweol, and di-furfuryl ether. The latter was also identified as a marker for Luwak coffee, using SPME/GC-MS analysis. This study also confirmed the impact of the fermentation step prior to roasting on the aroma profile by using SPME coupled with GC/MS, as exemplified by the higher abundance of guaiacol derivatives, pyrazines, and furans in roasted Luwak coffee compared with roasted C. arabica. Finally, such a comparative metabolomics approach overcomes the limitation of detection by using one technique versus another. For example, some metabolite markers, such as citric acid, were identified in the LC-MS versus the elaidic and other fatty acids in NMR via other markers, i.e., di-furfuryl ether was detected in both NMR and SPME/GC-MS. Such a comparative metabolomics approach can be used for the quality control assessment of other distinctive or premium coffee products from regular ones in the future. A comparison of Luwak’s health benefits compared to roasted coffee should also follow, based on these findings, as revealed using metabolomics.

Supplementary Materials

The following supporting information can be downloaded at: https://www.mdpi.com/article/10.3390/metabo13020173/s1, Figure S1: (A) HSQC NMR spectra for the assignment of 1, sucrose; 2, 5-CQA; 3, 4-CQA; 4, trigonelline; 5, caffeine; 6, quinic acid (B) HSQC NMR spectra for the assignment of caffeoyl shikimic acid (C, D) HSQC and HMBC NMR spectra for assignment of octadec-9-enoic acid as a major fatty acid constituent in Luwak coffee seeds. (E) HSQC NMR spectra for the assignment of nitrogen compounds (caffeine and trigonelline) (F) HMBC NMR spectra for the assignment of n-methylpyridinium. All assignment details are listed in Table 1. Figure S2: Percentile proportion of metabolite groups in different coffee samples as identified by SPME/GC-MS; Figure S3: (A) OPLS-DA model score plot of Luwak coffee versus roasted coffee. (B) Permutation analysis to validate the OPLS-DA model score plot of Luwak coffee versus roasted coffee. (C) OPLS-DA model S-plot of Luwak coffee versus roasted coffee.

Author Contributions

Conceptualization, M.A.F.; methodology, M.A.F. and A.A.; software, M.A.F. and A.A.; validation, M.A.F. and T.A.M.; formal analysis, T.A.M.; E.A.E.-H. and A.A.; writing—original draft preparation, T.A.M.; E.A.E.-H. and A.A.; writing—review and editing, M.A.F., T.A.M., E.A.E.-H. and A.A. All authors have read and agreed to the published version of the manuscript.

Funding

This research received no external funding.

Institutional Review Board Statement

Not applicable.

Informed Consent Statement

Not applicable.

Data Availability Statement

The data presented in this study are available in article and supplementary material.

Acknowledgments

M.A.F. thanks the Alexander von Humboldt Foundation, Germany for its financial support and the Leibniz institute for Plant Biochemistry, Germany for assistance in LCMS measurement.

Conflicts of Interest

The authors declare no conflict of interest.

References

  1. Jumhawan, U.; Putri, S.P.; Yusianto; Marwani, E.; Bamba, T.; Fukusaki, E. Selection of discriminant markers for authentication of asian palm civet coffee (kopi luwak): A metabolomics approach. J. Agric. Food Chem. 2013, 61, 7994–8001. [Google Scholar] [CrossRef]
  2. Jumhawan, U.; Putri, S.; Yusianto; Bamba, T.; Fukusaki, E. Quantification of coffee blends for authentication of asian palm civet coffee (kopi luwak) via metabolomics: A proof of concept. J. Biosci. Bioeng. 2016, 122, 79–84. [Google Scholar] [CrossRef] [PubMed]
  3. Muzaifa, M.; Hasni, D.; Rahmi, F. What is kopi luwak? A literature review on production, quality and problems. IOP Conf. Ser. Earth and Environ. Sci. 2019, 365, 012041. [Google Scholar]
  4. Marcone, M. Composition and properties of indonesian palm civet coffee (kopi luwak) and ethiopian civet coffee. Food Res. Int. 2004, 37, 901–912. [Google Scholar] [CrossRef]
  5. Lachenmeier, D.; Schwarz, S. Digested civet coffee beans (kopi luwak)—an unfortunate trend in specialty coffee caused by mislabeling of coffea liberica? Foods 2021, 10, 1329. [Google Scholar] [CrossRef]
  6. Iswanto, T.; Shovitri, M.; Altway, A.; Widjaja, T.; Kusumawati, D.I.; Lisdyanti, P. Isolation and identification of caffeine-degrading bacteria from soil, coffee pulp waste and excreted coffee bean in luwak feces. Feces 2019, 20. [Google Scholar] [CrossRef] [Green Version]
  7. Watanabe, H.; Ng, C.H.; Limviphuvadh, V.; Suzuki, S.; Yamada, T.J.P. Gluconobacter dominates the gut microbiome of the asian palm civet paradoxurus hermaphroditus that produces kopi luwak. luwak 2020, 8, e9579. [Google Scholar] [CrossRef] [PubMed]
  8. Aditiawati, P.; Astuti, D.I.; Kriswantoro, J.A.; Khanza, S.M.; Kamarisima; Irifune, T.; Amalia, F.; Fukusaki, E.; Putri, S.P. Gc/ms-based metabolic profiling for the evaluation of solid state fermentation to improve quality of arabica coffee beans. Metabolomics 2020, 16, 57. [Google Scholar] [CrossRef] [PubMed]
  9. Foudah, A.I.; Alam, P.; Abdel-Kader, M.S.; Shakeel, F.; Alqasoumi, S.I.; Salkini, A.M.; Yusufoglu, H.S. High-performance thin-layer chromatographic determination of trigonelline content in various extracts and different varieties of some commercial coffees available in the saudi arabian market. JPC–J. Planar Chromatogr.–Modern TLC 2020, 33, 43–50. [Google Scholar] [CrossRef]
  10. Foudah, A.I.; Shakeel, F.; Salkini, M.A.; Alshehri, S.; Ghoneim, M.M.; Alam, P. A green high-performance thin-layer chromatography method for the determination of caffeine in commercial energy drinks and formulations. Materials 2022, 15, 2965. [Google Scholar] [CrossRef]
  11. Alam, P.; Shakeel, F.; Ali, A.; Alqarni, M.H.; Foudah, A.I.; Aljarba, T.M.; Alkholifi, F.K.; Alshehri, S.; Ghoneim, M.M.; Ali, A. Simultaneous determination of caffeine and paracetamol in commercial formulations using greener normal-phase and reversed-phase hptlc methods: A contrast of validation parameters. Molecules 2022, 27, 405. [Google Scholar] [CrossRef]
  12. Jumhawan, U.; Putri, S.P.; Bamba, T.; Fukusaki, E. Application of gas chromatography/flame ionization detector-based metabolite fingerprinting for authentication of asian palm civet coffee (kopi luwak). J. biosci. bioeng. 2015, 120, 555–561. [Google Scholar] [CrossRef]
  13. El-Hawary, E.A.; Zayed, A.; Laub, A.; Modolo, L.V.; Wessjohann, L.; Farag, M.A. How does lc/ms compare to uv in coffee authentication and determination of antioxidant effects? Brazilian and middle eastern coffee as case studies. Antioxidants 2022, 11, 131. [Google Scholar] [CrossRef] [PubMed]
  14. Abdelwareth, A.; Zayed, A.; Farag, M.A. Chemometrics-based aroma profiling for revealing origin, roasting indices, and brewing method in coffee seeds and its commercial blends in the middle east. Food Chem. 2021, 349, 129162. [Google Scholar] [CrossRef]
  15. Porzel, A.; Farag, M.A.; Mülbradt, J.; Wessjohann, L.A. Metabolite profiling and fingerprinting of hypericum species: A comparison of ms and nmr metabolomics. Metabolomics 2014, 10, 574–588. [Google Scholar] [CrossRef]
  16. Farag, M.A.; Porzel, A.; Mahrous, E.A.; El-Massry, M.M.; Wessjohann, L.A. Integrated comparative metabolite profiling via ms and nmr techniques for senna drug quality control analysis. Anal. Bioanal. Chem. 2015, 407, 1937–1949. [Google Scholar] [CrossRef] [PubMed]
  17. Farag, M.A.; Rasheed, D.M.; Kamal, I.M. Volatiles and primary metabolites profiling in two hibiscus sabdariffa (roselle) cultivars via headspace spme-gc-ms and chemometrics. Food Res. Int. 2015, 78, 327–335. [Google Scholar] [CrossRef]
  18. Farag, M.A.; Hegazi, N.; Dokhalahy, E.; Khattab, A.R. Chemometrics based gc-ms aroma profiling for revealing freshness, origin and roasting indices in saffron spice and its adulteration. Food Chem. 2020, 331, 127358. [Google Scholar] [CrossRef] [PubMed]
  19. Zayed, A.; Abdelwareth, A.; Mohamed, T.A.; Fahmy, H.A.; Porzel, A.; Wessjohann, L.A.; Farag, M.A. Dissecting coffee seeds metabolome in context of genotype, roasting degree, and blending in the middle east using nmr and gc/ms techniques. Food Chem. 2022, 373, 131452. [Google Scholar] [CrossRef] [PubMed]
  20. Farag, M.A.; Porzel, A.; Wessjohann, L.A. Unraveling the active hypoglycemic agent trigonelline in balanites aegyptiaca date fruit using metabolite fingerprinting by nmr. J. Pharm. Biomed. Anal. 2015, 115, 383–387. [Google Scholar] [CrossRef] [PubMed]
  21. del Campo, G.; Berregi, I.; Caracena, R.; Zuriarrain, J. Quantitative determination of caffeine, formic acid, trigonelline and 5-(hydroxymethyl) furfural in soluble coffees by 1h nmr spectrometry. Talanta 2010, 81, 367–371. [Google Scholar] [CrossRef] [PubMed]
  22. Riedel, A.; Hochkogler, C.M.; Lang, R.; Bytof, G.; Lantz, I.; Hofmann, T.; Somoza, V. N-methylpyridinium, a degradation product of trigonelline upon coffee roasting, stimulates respiratory activity and promotes glucose utilization in hepg2 cells. Food Funct. 2014, 5, 454–462. [Google Scholar]
  23. Kotyczka, C.; Boettler, U.; Lang, R.; Stiebitz, H.; Bytof, G.; Lantz, I.; Hofmann, T.; Marko, D.; Somoza, V. Dark roast coffee is more effective than light roast coffee in reducing body weight, and in restoring red blood cell vitamin e and glutathione concentrations in healthy volunteers. Mol. Nutr. Food Res. 2011, 55, 1582–1586. [Google Scholar]
  24. Belton, P.S.; Colquhoun, I.J.; Kemsley, E.K.; Delgadillo, I.; Roma, P.; Dennis, M.J.; Sharman, M.; Holmes, E.; Nicholson, J.K.; Spraul, M. Application of chemometrics to the 1h nmr spectra of apple juices: Discrimination between apple varieties. Food Chem. 1998, 61, 207–213. [Google Scholar] [CrossRef]
  25. Girelli, C.R.; Angilè, F.; Del Coco, L.; Migoni, D.; Zampella, L.; Marcelletti, S.; Cristella, N.; Marangi, P.; Scortichini, M.; Fanizzi, F.P. 1H-NMR Metabolite Fingerprinting Analysis Reveals a Disease Biomarker and a Field Treatment Response in Xylella fastidiosa subsp. pauca-Infected Olive Trees. Plants 2019, 8, 115. [Google Scholar] [CrossRef] [Green Version]
  26. Wei, F.; Furihata, K.; Hu, F.; Miyakawa, T.; Tanokura, M. Complex mixture analysis of organic compounds in green coffee bean extract by two-dimensional nmr spectroscopy. Magn. Reson. Chem. 2010, 48, 857–865. [Google Scholar] [CrossRef] [PubMed]
  27. Hall, L. The conformations of cyclic compounds in solution. I. Shikimic acid. J. Org. Chem. 1964, 29, 297–299. [Google Scholar] [CrossRef]
  28. Alexandri, E.; Ahmed, R.; Siddiqui, H.; Choudhary, M.I.; Tsiafoulis, C.G.; Gerothanassis, I.P. High resolution nmr spectroscopy as a structural and analytical tool for unsaturated lipids in solution. Molecules 2017, 22, 1663. [Google Scholar] [CrossRef] [PubMed] [Green Version]
  29. Luisa, P.F.; Flavio, M.B.; Fabiana, C.R.; Gerson, S.G.; Jose, H.d.S.T.; Marcelo, R.M. Fatty acid profiles and parameters of quality of specialty coffees produced in different brazilian regions. Afr. J. Agric. Res. 2015, 10, 3484–3493. [Google Scholar] [CrossRef]
  30. Yang, S.; Hao, Y.; Wang, J.; Wang, H.; Zheng, Y.; Tian, H.; Liu, Y.; Sun, B. Selective catalytic dehydration of furfuryl alcohol to 2, 2′-difurfuryl ether using a polyoxometalate catalyst. Sci. Rep. 2017, 7, 1–6. [Google Scholar] [CrossRef] [PubMed] [Green Version]
  31. Karunanithi, G.; Varadappan, A.M.S. Exploring the effectiveness of novel coffea arabica leaf pigment as a natural antioxidant additive for date seed biodiesel. Fuel 2022, 324, 124561. [Google Scholar] [CrossRef]
  32. Fang, N.; Yu, S.; Prior, R.L. Lc/ms/ms characterization of phenolic constituents in dried plums. J. Agric. Food Chem. 2002, 50, 3579–3585. [Google Scholar] [CrossRef] [PubMed]
  33. Asamenew, G.; Kim, H.W.; Lee, M.K.; Lee, S.H.; Lee, S.; Cha, Y.S.; Lee, S.H.; Yoo, S.M.; Kim, J.B. Comprehensive characterization of hydroxycinnamoyl derivatives in green and roasted coffee beans: A new group of methyl hydroxycinnamoyl quinate. Food Chem. X 2019, 2, 100033. [Google Scholar] [CrossRef] [PubMed]
  34. Bianco, G.; Abate, S.; Labella, C.; Cataldi, T.R. Identification and fragmentation pathways of caffeine metabolites in urine samples via liquid chromatography with positive electrospray ionization coupled to a hybrid quadrupole linear ion trap (ltq) and fourier transform ion cyclotron resonance mass spectrometry and tandem mass spectrometry. Rapid Commun. Mass Spectro. RCM 2009, 23, 1065–1074. [Google Scholar]
  35. Lee, L.W.; Cheong, M.W.; Curran, P.; Yu, B.; Liu, S.Q. Modulation of coffee aroma via the fermentation of green coffee beans with rhizopus oligosporus: Ii. Effects of different roast levels. Food Chem. 2016, 211, 925–936. [Google Scholar] [CrossRef]
  36. Setoyama, D.; Iwasa, K.; Seta, H.; Shimizu, H.; Fujimura, Y.; Miura, D.; Wariishi, H.; Nagai, C.; Nakahara, K. High-throughput metabolic profiling of diverse green coffea arabica beans identified tryptophan as a universal discrimination factor for immature beans. PLoS ONE 2013, 8, e70098. [Google Scholar] [CrossRef] [PubMed]
  37. Burns, D.T.; Walker, M.J. Critical review of analytical and bioanalytical verification of the authenticity of coffee. J. AOAC Int. 2020, 103, 283–294. [Google Scholar] [CrossRef]
  38. Medina, S.; Pereira, J.A.; Silva, P.; Perestrelo, R.; Câmara, J.S. Food fingerprints—A valuable tool to monitor food authenticity and safety. Food Chem. 2019, 278, 144–162. [Google Scholar] [CrossRef]
  39. Putri, S.P.; Ikram, M.M.M.; Sato, A.; Dahlan, H.A.; Rahmawati, D.; Ohto, Y.; Fukusaki, E. Application of gas chromatography-mass spectrometry-based metabolomics in food science and technology. J. Biosci. Bioeng. 2022, 133, 425–435. [Google Scholar] [CrossRef] [PubMed]
  40. Kim, S.-J.; Lee, S.; Bang, E.; Lee, S.; Rhee, J.-K.; Na, Y.-C. Comparative evaluation of flavor compounds in fermented green and roasted coffee beans by solid phase microextraction-gas chromatography/mass spectrometry. Flavour Fragr. J. 2019, 34, 365–376. [Google Scholar] [CrossRef]
  41. Lestari, W.; Hasballah, K.; Listiawan, M.; Sofia, S. Identification of antioxidant components of gayo arabica coffee cascara using the gc-ms method. IOP Conf. Ser. Earth and Environ. Sci. 2022, 956, 012011. [Google Scholar] [CrossRef]
Figure 1. Graphical sketch summarizing the current paper’s objectives and the techniques employed for comparisons between Luwak and regular coffee types.
Metabolites 13 00173 g001
Figure 2. Representative 1H NMR spectrum (δH: 0–10 ppm) of the Luwak coffee sample in CD3OD.
Metabolites 13 00173 g002
Figure 3. (A) The principal component analysis (PCA) score plot. (B) The loading plot of all the coffee samples, analyzed using NMR. (C) Hierarchical cluster analysis (HCA) plot. (D) OPLS-DA model for the roasted samples (RCA and RCC) vs. the Luwak coffee (PWN). (E) The S-loading plot showing the covariance p [1] against the correlation p(cor) [1], analyzed by 1 H NMR, shown at a full scale (F) OPLS-DA score plot for the roasted samples versus the roasted aromatic region. (G) The S-loading plot for the aromatic region. Selected variables are highlighted and discussed in the text.
Metabolites 13 00173 g003aMetabolites 13 00173 g003b
Figure 4. (A) Principal component analysis (PCA) score plot of PC1 vs. PC2 scores, based on the UPLC-MS of authentic samples (arabica and canephora specimens) and Luwak samples. (B) PCA loading plot for PC1 and PC2, showing the potential markers for roasted coffee seeds. (C) HCA of the authentic and Luwak samples. (D) OPLS-DA score plot for the Luwak versus the roasted samples only. (E) OPLS-DA S-plot for the Luwak versus the roasted samples that are contributing markers for Luwak coffee. OPLS-DA-S-plot models show the covariance-p [1] against the correlation p(cor) [1] for the variables of the discriminating components of the OPLS-DA models. Cut-off values of p < 0.05 were used; selected variables are highlighted in the S-plot and are discussed in the text.
Metabolites 13 00173 g004
Figure 5. (A) PCA model score-plot of the Luwak coffee samples, along with commercially roasted coffee with cardamom and authentically roasted C. arabica. (B) PCA model score-plot of the Luwak coffee samples, along with authentically roasted C. arabica. (C) PCA loading plot of the Luwak coffee samples (LUWAK) versus authentically roasted C. arabica (RCA).
Metabolites 13 00173 g005
Table 1. Resonance assignments with the chemical shifts of constituents identified in 600 MHz 1H NMR, heteronuclear single-quantum correlation spectroscopy (HSQC), and the heteronuclear multiple-bond coherence (HMBC) spectra of Luwak coffee (methanol d4; CD3OD).
NoMetaboliteAssignment1H (Multiplicity)HSQCHMBC
1(E)-octadec-9-enoic acidH-95.33129C-7 (27.9)
H-105.33129C-12 (27.9)
H-22.3534.8C-1 (174.6), C-3 (26.4)
H-8, H-112.334.8
H-31.625.9C-1 (174.6)
2TrigonellineH-29.20 s147.5
H-4 8.89 d146.8C-5 (129.2), C-2 (146.8)
H-58.09 t129.2C-3 (143.9)
H-68.86 d146.8
CH34.43 s48.8C-2 (147.5)
3Caffeoyl shikimic acid CH2-2axial2.0940.4
CH2-2 equatorial240.4
H-55.2670.5C-4 (74.8)
H-8′6.34109.5
H-7′7.56146.9
H-2′7.04115
H-5′6.77116.4
H-6′6.95122.8
4CaffeineH-83.3528.1C-1 (156.8), C-2 (153.3)
H-73.5330C-2 (153.3), C-3 (149.8)
H-63.9733.7C-4 (108.8), C-5 (144.0)
H-57.86144.1C-2 (115.0)
5KahweolH-15.95 d (10.2)139.6C-5 (45.7), C-9 (49.7), C-10 (42.9)
H-26.21 d (10.2)116.2C-10 (42.9)
H-3---151.5
H-4---122.9
H-52.5745.7
H-91.5949.7
H-10---42.9
H-186.21 (10.2)109C-3 (151.5), C-4 (122.9)
H-197.23141.8C-3 (151.5), C-4 (122.9)
H-200.9715.9C-1 (156.8), C-5 (45.7), C-9 (49.7), C-10 (42.9)
6Caffeic acidH-27.06 d115
H-56.77 d116.3
H-66.98 dd124.3
H-77.57 d146.8
H-86.28 d117.1
7N-methylpyridiniumH-2, H-69.90 d146.8
H-3, H-58.05 t 128.4
H-48.57 t 146.5C-2 (146.8), C-6 (146.8)
CH34.42 s48.8C-2 (146.8), C-6 (146.8)
8Myo-inositolH3.41 dd73.173.1
9XanthineH-87.93 s132.9
10Difurfuryl etherH-36.26115.4
H-46.29115.3
H-57.5714.1
11fumaric acidH6.61132.6C=O (173.5)
12CaffeineH-83.3528.1C-1 (156.7), C-2 (153.3)
H-73.5330C-2 (153.3), C-3 (149.8)
H-63.9733.7C-4 (108.8), C-5 (144.0)
H-57.86144.1C-2 (108.8)
13Lactic acidCH31.3423.5
CH468.2
14SucroseH-15.3793.8C-5 (74.5), C-1′ (105.3)
H-23.4173.1C-3 (74.4)
H-33.6874.4
H-43.3471.4C-3 (74.4), C-5 (74.5)
H-53.8174.5
H-63.6861.7
H-2′4.0879.3
H-3′3.9574.1C-1′ (105.3), C-5′ (64.5), C-2′ (79.3)
H-4′3.7583.8
H-5′3.764.5
H-6′3.7563.2
Table 2. Metabolites identified in the methanol extract of Luwak coffee via UPLC-PDA-ESI-HRMS in negative mode.
NoRT (min)Compound NameChemical Class[M-H]-Molecular FormulaMass ErrorMS/MS FragmentsReferences
L10.27Malic acidOrganic acid133.01411C4H5O5−2.36n.d[13]
L20.22O-Malonyl-hexopyranosideSugar471.07425C19H19O144.44n.d[13]
L30.32Di-O-hexosideSugar341.10815C12H21O11−2.32179,161[13]
L40.37Citric acidOrganic acid191.01926C6H7O7−2.43111,173[13]
L50.38Quinic acidOrganic acid191.05556C7H11O6−2.86173, 111[13]
L60.38O-Caffeoylquinic acidPhenolic acid353.08664C16H17O9−3.37191,179,135[13]
L73.2Caffeoylshikimic acidPhenolic acid335.07614C16H15O8−3.21179,161,135[13]
L86.1Dicaffeoylquinic acidPhenolic acid515.11804C25H23O12−2.82353,335[13]
L96.3Feruloylquinic acidPhenolic acid367.10223C17H19O9−3.33161,193,135[13]
L106.6P-Coumaroyl quinic acidPhenolic acid337.09174C16H17O8−3.41191,163[13]
L117.01Atractyligenin-O-hexosideDiterpene481.24234C25H37O9−4.08301[13]
L127.11Carboxtatractyligenin-O-hexosideDiterpene525.23193C26H37O11−4.18396,203[13]
L137.7Trihydroxy-kauranoic acidDiterpene351.21664C20H31O5−3.12289,321[13]
L147.7Caffeoyl-feuloylquinic acidPhenolic acid529.13293C26H25O12−2.35367,353[13]
L157.9Desoxycarboxyatractyligenin-O-hexosideDiterpene771.34113C37H55O17−4.31727[13]
L167.9Desoxyatractyligenin-O-hexosideDiterpene727.35138C36H55O15−4.42643,625[13]
L178.1Caffeoyl-N-tryptophanAmino acid365.11272C20H17N2O5−2.08135,229[13]
L188.3Unknown chlorogenic acidPhenolic acid437.14359C21H25O10−3.95173,275[13]
L198.47Di-caffeoylquinolactonePhenolic acid497.10716C25H22O11−2.25335[13]
L208.56Unknown fatty acidFatty acid538.23956C25H48O11N−4.25311,198,180[13]
L218.8Isovaleryl-atractyligenin-O-hexosideDiterpene565.29987C30H45O10−3.45481,463,303[13]
L2212.1Unknown fatty acidFatty acid311.12355C20H13O3−3.12183[13]
L2312.5Unknown fatty acidFatty acid325.18341C14H29O8−9.61183[13]
L2413.7Unknown fatty acidFatty acid339.19907C15H31O8−9.91183[13]
Table 3. The volatiles detected using SPME/GC-MS in Luwak coffee, alongside roasted coffee (RCA) and roasted coffee with cardamom, expressed as a relative percentile (mean ± SD).
CategoryMetaboliteRIRTLuwak Samples Roasted Coffee with Cardamom (R&C) Roasted C. arabica (RCA)
Alcohol1-Octanol1101.510.3042 0.29 ± 0.251
2,7-dimethyl-4-Octene-2,7-diol1152.711.0333 0.2 ± 0.09
Cineole1007.28.82920.35 ± 0.4331.98 ± 1.405
Furfuryl alcohol842.75.786712.1 ± 2.204 5.5 ± 7.774
Nerolidol1519.715.7508 3.71 ± 4.156
Maltol1115.910.50922.23 ± 2.078
Aldehyde2-Methoxy-4-methylbenzaldehyde1132.710.74920.41 ± 0.361
Cinnamic aldehyde1264.812.5617 1.44 ± 2.03814.54 ± 0.247
Aliphatic hydrocarbonDodecane1163.511.18750.17 ± 0.161
Hexadecane1545.416.12080.18 ± 0.1840.01 ± 0.017
Pentadecane1450.614.8658 0.44 ± 0.372
Tetradecane1356.113.71250.49 ± 0.406
Aromatic hydrocarbonNaphthalene1169.611.2754.73 ± 1.833
Styrene867.96.310.09 ± 0.093
EsterDecyl acetate1369.913.8808 0.94 ± 0.9570.13 ± 0.186
Diisobutyl phthalate1812.320.9350.09 ± 0.0830.29 ± 0.332
Ethylene diacetate851.85.97670.88 ± 0.802
Linalyl acetate1216.411.9242 12.16 ± 10.2692.32 ± 0.707
Myrcenylacetate1285.312.8317 0.33 ± 0.262
Oxalic acid, allyl isobutyl ester1037.29.30.07 ± 0.063
Terpinyl acetate1316.913.2325 35.53 ± 49.32813.05 ± 18.453
Ether/oxideAnethole1267.712.5992 3.98 ± 5.211
Biphenyl oxide1382.414.0350.12 ± 0.116
Cineol1007.28.82920.35 ± 0.4331.98 ± 1.405
Dicyclobutylidene oxide1083.410.02330.61 ± 0.291
Eugenol1334.813.4517 3.44 ± 3.8015.84 ± 0.965
Furan / pyrrole2-Furanmethanol842.75.78676.05 ± 1.102 2.75 ± 3.887
Acetylfuran891.66.80080.65 ± 0.048
Furfural820.35.32254.18 ± 1.87 4.55 ± 6.44
Furfuryl 3-methylbutanoate1190.211.56832.06 ± 1.164
Furfuryl acetate969.58.1856.47 ± 4.393
2-Furfuryl-5-methylfuran1149.810.99333.42 ± 0.901
2-Furfurylfuran1057.59.61750.73 ± 0.694
2-Pentylfuran963.18.07421.04 ± 0.909
5-Methyl furfural947.47.80082.56 ± 0.609 0.44 ± 0.626
Difurfuryl ether1274.812.69258.96 ± 6.84
1-Furfurylpyrrole1157.411.10081.44 ± 0.383
2-Formyl-1-methylpyrrole990.18.54420.65 ± 0.609
2-Formyl-4,5-dimethyl-pyrrole1141.310.87170.45 ± 0.425
N-Furfurylpyrrole1157.411.10081.44 ± 0.383
Ketone2,2-Dimethylbutanone943.37.730.13 ± 0.132
3,3-dimethyl-2-butanone1550.916.20080.4 ± 0.257
p-Anisylacetone1374.113.9325 0.2 ± 0.28529.78 ± 40.553
Monoterpene hydrocarbonalpha-Terpineol1175.511.3583 5.69 ± 5.262
Camphor1130.310.7142 0.23 ± 0.127
Isoterpinolene1061.39.6775 0.6 ± 0.103
Terpin-4-ol116111.1517 0.95 ± 0.754
Unknown monoterpene948.27.815 0.18 ± 0.105
OthersButyryl lactone895.66.88332.74 ± 2.129
Phenolics4-Ethylguaiacol125612.4459.59 ± 4.57
4-Vinylguaiacol1302.313.05331.78 ± 1.197 1.28 ± 1.812
o-Guaiacol1070.79.82421.52 ± 0.078
Pyrazines1-(6-Methyl-2-pyrazinyl)-1-ethanone1097.410.24170.28 ± 0.262
2,3-dimethylpyrazine899.96.97250.1 ± 0.099
2,6-dimethylpyrazine894.86.86671.62 ± 1.205
2-Acetyl-3-methylpyrazine1097.410.24170.21 ± 0.27
2-Ethyl-3-methylpyrazine978.68.3451.05 ± 1.181
2-Methyl-3,5-diethylpyrazine1130.510.71750.56 ± 0.115
2-Methyl-5-propenyl-pyrazine1181.411.44330.68 ± 0.248
5-Methyl-2,3-diethylpyrazine1126.110.6550.25 ± 0.063
5-Methyl-5H-cyclopenta [b]pyrazine1123.510.61830.23 ± 0.235
Methylpyrazine842.75.78676.05 ± 1.102 2.75 ± 3.887
Pyrazine, 2-ethyl-3-methyl-978.68.3451.62 ± 1.404
2-Methyl-5-(1-propenyl)-, (E)-pyrazine1181.411.44330.68 ± 0.248
Sesquiterpene hydrocarbonalpha-Farnesene1461.114.9942 1.02 ± 1.11
beta-Curcumene1471.715.1225 3.68 ± 0.702
beta-Eudesmene1463.615.0242 1.19 ± 0.518
Calamenene1493.115.3833 0.17 ± 0.151
beta-Caryophyllene1395.914.1992 2.09 ± 1.751
Curcumene1444.614.7933 7.28 ± 0.257
Germacrene1484.415.2775 6.25 ± 5.915
alpha-Humulene1430.214.6175 0.45 ± 0.31
alpha-Bergamotene1400.214.2525 2.94 ± 3.195
beta-Farnesene1411.814.3933 0.63 ± 0.386
Disclaimer/Publisher’s Note: The statements, opinions and data contained in all publications are solely those of the individual author(s) and contributor(s) and not of MDPI and/or the editor(s). MDPI and/or the editor(s) disclaim responsibility for any injury to people or property resulting from any ideas, methods, instructions or products referred to in the content.

